


1. Introduction
In additive manufacturing, rapid technological development is expanding the scope of engineering design and enabling increased complexity in functional components. Of particular significance is the emergence of low-cost material-extrusion (MEX) systems equipped with actively heated build chambers. These systems—now available from manufacturers such as Creality (China, Shenzhen, Creality), Bambu Lab (China, Shenzhen, Bambu Lab) and Prusa Research (Czech Republic, Prague, Prusa Research)—are marketed as capable of processing advanced engineering materials. Among these materials, polyamide 6 reinforced with carbon fibres (PA6-CF) is especially promising, with the potential to transform functional prototyping and support the fabrication of end-use components. High-performance polymers have become increasingly important across a wide range of industrial applications and engineering design tasks. These materials are characterised by exceptional chemical resistance, mechanical strength, and wear performance; however, such properties typically require processing at substantially elevated temperatures. Polymers that necessitate processing temperatures above roughly 250 °C are commonly classified as high-temperature materials (Reference Das, Chatham, Fallon, Zawaski, Gilmer, Williams and BortnerDas et al., 2020). Within MEX processes, filaments such as polyether ether ketone (PEEK), polyetherimide (PEI), and certain grades of polyamide (PA) fall within the category of high-performance polymers. Both PEEK and PEI require exceptionally high nozzle temperatures to ensure successful extrusion. For example, PEI must be processed at approximately 370 °C to achieve its optimal mechanical properties (Reference El Magri, Vanaei and VaudreuilEl Magri et al., 2021). In contrast, PEEK requires an even higher processing temperature, with optimal mechanical performance achieved at a nozzle temperature of approximately 420 °C (Reference Yang, Tian, Li, Cao, Zhao and ShiYang et al., 2017). These elevated thermal requirements necessitate specialised and expensive equipment. Moreover, both PEEK and PEI exhibit high material costs, further limiting their suitability for low-cost manufacturing contexts (Reference de Leon, Chen, Palaganas, Palaganas, Manapat and Advinculade Leon et al., 2016). Polyamide 6, by comparison, achieves its desired mechanical properties at a substantially lower nozzle temperature of around 295 °C (Reference Sun, Mubarak, Zhang, Peng, Hu, Zhang, Wu and WangSun et al., 2023), placing it within the operational capabilities of emerging low-cost systems. Due to the layer-by-layer nature of MEX processes, the mechanical properties of printed components are inherently anisotropic. Several factors contribute to this anisotropy, including hardware configuration, build orientation, fibre orientation, and interlayer bonding (Reference EikevågEikevåg, 2023).
Appropriate hardware selection and parameter tuning strongly influence the resulting mechanical performance, often producing deviations from the values reported in manufacturer datasheets. Research has demonstrated that thorough calibration can yield more than a 20% increase in Ultimate Tensile Strength (UTS) in both the XY and ZX directions compared to nominal material properties (Reference Birkelid, Eikevåg, Elverum and SteinertBirkelid et al., 2022). Build orientation itself exerts a substantial effect on UTS. For example, a study on polylactic acid (PLA) showed that horizontally oriented specimens in the XY plane achieved more than twice the tensile strength of vertically printed specimens in the ZX direction (Reference Torrado, Shemelya, English, Lin, Wicker and RobersonTorrado et al., 2015). Fibre orientation and raster angle further alters mechanical performance. Even with identical build orientations, tensile strength can vary significantly; one study demonstrated a 25% increase when shifting the raster angle from 90° to 0° (Reference Sun, Mubarak, Zhang, Peng, Hu, Zhang, Wu and WangSun et al., 2023). Temperature is a critical determinant of interlayer bonding quality. Ambient thermal conditions also affect polymer behaviour, particularly for semicrystalline materials: higher environmental temperatures promote increased crystallinity, which in turn enhances tensile strength and modulus (Reference Yang, Tian, Li, Cao, Zhao and ShiYang et al., 2017). Post-processing through heat treatment can further improve fibre alignment and reduce inter-fibre voids in fibre-reinforced polymers (Reference Sun, Mubarak, Zhang, Peng, Hu, Zhang, Wu and WangSun et al., 2023). The UTS of an MEX-manufactured part is strongly influenced by its thermal history (Reference Nesheim, Eikevåg, Steinert and ElverumNesheim et al., 2025). For PA6-CF components, increases from 42 MPa to 73 MPa have been reported solely due to variations in layer temperature (Reference Bjørken, Andresen, Eikevåg, Steinert and ElverumBjørken et al., 2022). This sensitivity underscores the need for infrared thermography (IRT) as a means to evaluate and optimise interlayer bonding (Reference Turner, Strong and GoldN. Turner et al., 2014; Reference Nesheim, Eikevåg, Steinert and ElverumNesheim et al., 2025). Bond formation requires that the temperature of each newly deposited layer exceed the polymer’s glass transition temperature (Tg) (Reference Turner, Strong and GoldN. Turner et al., 2014).
Deposition layer Temperature, DT is defined as the peak temperature of the newly deposited material, often equal to the nozzle temperature. Pre-Deposition layer Temperature, PDT , is defined as the surface temperature of the preceding layer immediately before deposition of the next layer. Quantifying this phenomenon, a study on ABS extruded at 230 °C and 100 mm/s used IRT to measure the temperatures of the printed layer and the underlying layers. The time above Tg was less than 2 s for DT and approximately 1.5 s for PDT, while the temperature of the layer below PDT never exceeded Tg (Reference Seppala and MiglerSeppala & Migler, 2016). Verifying that the PDT remains above Tg throughout printing is therefore essential for improving mechanical properties.
IRT also enables closed-loop thermal control systems in which machine-learning (ML) models correct defects in real time (Reference SadafSadaf, 2024). One ML-based temperature control system reported a 60.3% improvement over a conventional PID controller (Reference Titi, Achahuanco and SuarezTiti et al., 2025). A growing body of recent research highlights continued interest in temperature monitoring and control as a pathway to improved mechanical performance. Tensile modulus is fundamental to characterising the stress–strain response of printed materials, and accurate measurement is essential for reliable mechanical simulations (Reference Fallahiarezoodar, Goertemiller, Katre and AltanFallahiarezoodar et al., 2018; Reference Kraemer, Roellig, Metasch, Ahmar, Meier and WieseKraemer et al., 2018). To the author’s knowledge, no prior studies have examined the influence of PDT on tensile modulus.
In this study, we investigate the thermal influences on UTS, tensile modulus, and strain in advanced polymer composites. The resulting thermal characterisation provides critical insights for engineering design, enabling both high-fidelity functional prototyping and robust end-use manufacturing. As low-cost systems continue to evolve rapidly, this work further evaluates current manufacturing capabilities and identifies essential hardware features required to fully realise the performance potential of these materials.
2. Method
New material-extrusion technologies are becoming increasingly affordable and accessible, with many systems now marketed as capable of processing selected high-performance polymers. Among these materials, polyamide 6 reinforced with carbon fibres (PA6-CF) from Polymaker CF (China, Changshu, Polymaker) currently demonstrates the most promising mechanical performance within the nylon family (Reference Bjørken, Andresen, Eikevåg, Steinert and ElverumBjørken et al., 2022). In this study, we examine the material characteristics of PA6-CF under the thermal constraints of two low-cost MEX systems: the Creality K2 Plus and the Bambu Lab H2D. Both systems feature actively heated enclosures and enhanced thermal capabilities for nozzle and build-plate operation, providing a suitable platform for evaluating PA6-CF processing behaviour.
2.1. Motivation from thermal component monitoring
In MEX, PDT is influenced by multiple interacting factors, including the ambient environment, nozzle temperature, part geometry, and the time required to complete each layer. Layer height, for instance, directly affects the thermal mass delivered to the underlying layer and consequently influences the weld temperature (Tw). PDT has been shown to play a critical role in determining out-of-plane mechanical performance (Reference Bjørken, Andresen, Eikevåg, Steinert and ElverumBjørken et al., 2022).
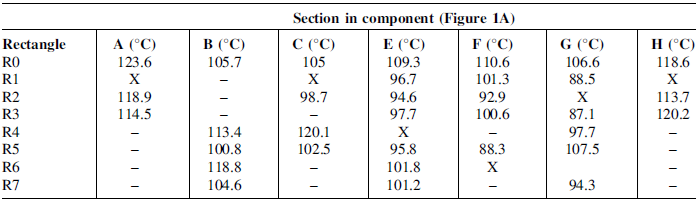
To characterise PDT and its variation throughout the build process, we examined a representative component by printing a VESA mount (100 × 100 × 150 mm) (Reference Peckham, Elverum, Hicks, Goudswaard, Snider, Steinert and EikevågPeckham et al., 2024) in PA6- by Polymaker using a Bambu Lab H2D with a maximum chamber temperature of 65 °C. Thermal data were collected at 1 Hz using an InfiRay P2 Pro infrared camera (China, Yantai, InfiRay) operated through the TCView software (TopDon, 2023). Figure 1A illustrates the geometric transitions occurring during printing, while Figure 1B shows the corresponding PDT for each rectangle.
Thermal monitoring in 100x100x150 (mm) component with struts. A) sections where thermal measurements where recorded due to geometric changes. B) Thermal measurements of each section A-H

Figure 1 Long description
Panel A: A vertical cross-sectional view of a component with labeled sections A to H. The component has a complex structure with struts and geometric changes. Panel B: Eight horizontal cross-sectional views labeled A to H, each showing thermal measurements. Each section displays a heat map with regions labeled R0 to R7, indicating different temperature zones.
The results indicated that the component was produced with a PDT ranging from 88.3 °C to 120.2 °C, as summarised in Table 1.
Thermal data during component manufacturing. “X” indicates a defined rectangle where the print head obstructed measurements. “-” indicates no rectangles was defined at that index

The observed thermal profile indicates that PA6-CF components produced on low-cost systems operate below the temperature conditions associated with optimal mechanical performance (Reference Bjørken, Andresen, Eikevåg, Steinert and ElverumBjørken et al., 2022). The mechanical behaviour of PA6-CF within this reduced thermal window remains insufficiently characterised, necessitating further investigation. Accordingly, this study examines the UTS, strain, and tensile modulus of PA6-CF fabricated under these conditions using a low-cost desktop MEX system.
2.2. Hardware and setup
For material characterisation, thermal data were collected using the TCView software, which monitored a single point on the outer wall and recorded temperatures with emissivity set to 0.95 at a sampling rate of 1 Hz. The raw data were processed to determine the PDT, defined as the lowest value among the temperatures observed across successive layers. Monitoring multiple layers was necessary to account for the limited sampling frequency. This temperature was considered representative of the entire layer. Specimen fabrication was carried out on a recently introduced low-cost printer equipped with an actively heated chamber capable of reaching 60 °C. The selected system, the Creality K2 Plus, features a maximum print speed of 600 mm/s and a 30 mm 100W hotend. All PDT values were measured using an InfiRay P2 Pro thermal camera, which operates over a range of –20 to 550°C with an accuracy of ±2 °C or ±2%, a frame rate of 25 Hz, and a sensor resolution of 256 × 192 pixels.
To obtain consistent PDT measurements, a custom camera mount was designed to ensure stable positioning throughout the printing process. Figure 2A illustrates the relative placement of the mount, thermal camera, extruder, and printed specimen. The camera was positioned at a 10° incline to maintain a clear line of sight to the preceding layer during deposition, and the mount height was aligned with the nozzle height. The camera was placed as close to the extruder as possible, constrained by focus requirements and the need to avoid vibration-induced artefacts. The thermal camera was connected to a PC via a USB-C interface. Temperature monitoring was performed by tracking a single point located on the outer wall at the seam of the specimen. This measurement point was continuously recorded for one minute across multiple layers. Figure 2B presents the camera’s field of view in TCView and shows the point of measurement at the seam circled in white for clarity.
A) Diagram of camera mount B) Camera view as seen in TCView with a white circle with the captured temperature in the centre C) Raw data from TCView for the 104℃ specimens

Figure 2 Long description
The image contains three elements: a diagram, a thermal image, and a line graph. Panel A: The diagram shows the setup for mounting an infrared camera to capture temperature data. The camera is positioned at a 10-degree angle and 0.5 centimeters away from the extruder. The extruder is depicted as extruding a sample. Panel B: The thermal image displays the view from the infrared camera as seen in TCView. The image shows a heated extruder with a white circle in the center indicating the captured temperature. Panel C: The line graph presents raw data from TCView for 104 specimens. The x-axis represents the sample number, and the y-axis represents the temperature in degrees Celsius. The graph shows temperature fluctuations among the specimens, with a notable point highlighted at sample number 60.
Monitoring across multiple layers was necessary due to the limited sampling frequency. Figure 2C presents the raw thermal data collected during the fabrication of the 104 °C specimens, with the minimum peak temperature indicated by a red marker. The abrupt temperature rises observed between data points is due to the sampling rate not being synchronised with the completion of individual layers.
2.3. Materials and manufacturing
The high-performance filament examined in this study was selected due to its strong mechanical potential and its manufacturer’s claim of compatibility with low-cost MEX systems. The material, PA6-CF from Polymaker, is reported to exhibit a tensile strength of 105 ± 5.0 MPa and a tensile modulus of 7453 ± 656 MPa in the XY direction, and 67.7 ± 4.7 MPa with a tensile modulus of 4354 ± 206 MPa in the Z direction, according to the technical datasheet that uses ISO527. These values are specified for printing conditions of 280–300 °C nozzle temperature, a 25–50 °C build-plate temperature, and an ambient environment between room temperature and 50 °C. To evaluate the thermal influence on mechanical performance, we fabricated modified ISO 527-2 tensile specimens (Reference Bjørken, Andresen, Eikevåg, Steinert and ElverumBjørken et al., 2022). The specimens measured 65 mm in length, with a 17 mm gauge section and a cross-sectional area of 50 mm2. All specimens were printed at a fixed nozzle temperature of 280 °C and a build-plate temperature of 120 °C. The layer height was 0.2 mm, and the maximum volumetric flow rate was set to 12 mm3/s. For each temperature condition, five specimens were printed sequentially for each configuration for a total of 45 specimens. All specimens were printed standing in the z-direction. Following fabrication, all specimens were stored in sealed bags with desiccant and subjected to heat treatment at 80 °C for a minimum of six hours prior to testing. As a result, the specimens can be considered dry for comparison to the manufacturer’s datasheet values.
2.4. Design of experiment
Controlling the PDT in small geometries is challenging, as adjusting a single process parameter is insufficient to span the full temperature range observed in larger component prints. A previous study demonstrated this limitation by varying the printing speed using a layer-time target (Reference Bjørken, Andresen, Eikevåg, Steinert and ElverumBjørken et al., 2022). Although the method successfully reduced PDT to 143°C, printing became unstable at lower speeds. Further decreasing the speed would have extended the print time for a single specimen to several hours, making speed reduction alone an impractical strategy for accessing the complete temperature range. We investigated the influence of several process variables on PDT control. These preliminary explorations showed only minor temperature variations, as achieving sufficient time above the melt state requires relatively little exposure. For effective interlayer fusion, the combined effect of DT and PDT must exceed the melting point of the material (Reference Duarte, Covas and Da CostaDuarte et al., 2022), in this case 218.5 °C. Currently, there is no established method for directly measuring this combined thermal condition; therefore, measuring the PDT, as done in this study, is a first step towards part certification.
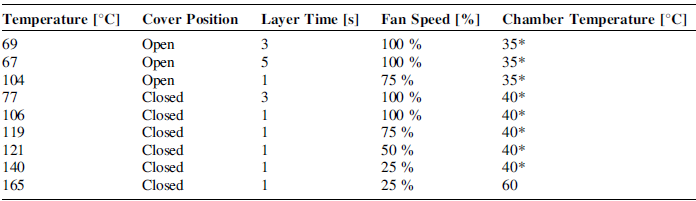
In this study, we controlled the PDT by varying multiple parameters, including printing speed, fan speed, and environmental conditions (open, enclosed, and heated). Although changing several variables simultaneously is not ideal from an experimental-design perspective, it was the only feasible approach to obtain the required temperature range. Printing speed was adjusted using the “Slow printing down for better cooling” option under “Cooling” in the material settings in the open-source software OrcaSlicer 2.3, by modifying the associated “Layer Time” parameter. The resulting PDT and their corresponding settings are summarised in Table 2.
Temperatures and their associated variables

* Not set, but chamber temperatures trended towards presented temperature
2.5. Data collection and mechanical testing
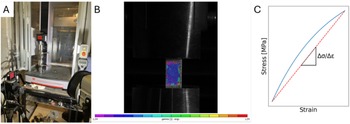
We aim to investigate the effect of PDT on tensile modulus, strain at break and UTS. The specimens were tested using an MTS criterion tensile testing machine (USA, Eden Prairie, MTS Systems Corporation) at a crosshead speed of 5 mm/min with a 5 Hz sampling rate. Following annealing, the specimens were transported in sealed bags directly to the testing setup to minimise moisture uptake. To obtain accurate tensile modulus measurements, strain was recorded using Digital Image Correlation (DIC) via the VIC-2D program (Correlated Systems, 2020). A Stingray F503B (Germany, Stadtroda, Allied Vision) camera recorded the Strain. The setup had a resolution of - 2452 (H) × 2056 (V) and pixel size 3.45 μm × 3.45 μm where placed approximately 1 meter from the test specimen, recording data at 5Hz as seen in Figure 3A. Figure 3B shows the camera view as seen in VIC-2D during analysis. The tensile modulus was derived from the full stress–strain response from zero strain to fracture, as shown in Figure 3C. This approach captures the overall stiffness behaviour but does not isolate the anisotropic contributions characteristic of MEX-produced materials.
A) Specimen mounted in MTS Criterion tensile test machine with DIC camera and light B) Specimen under analysis as seen by camera in VIC-2D C) Tensile modulus approximation

Figure 3 Long description
Panel A: A photo of a specimen mounted in an MTS Criterion tensile test machine. The setup includes a digital image correlation (DIC) camera and light. Panel B: A diagram showing the specimen under analysis as seen by the camera in VIC-2D. The diagram includes a color scale ranging from -1.54 to 1.54, indicating strain values. Panel C: A graph plotting stress (in MPa) against strain. The graph includes a blue line representing the tensile modulus approximation and a red dashed line indicating the slope (Δσ/Δε).
3. Results
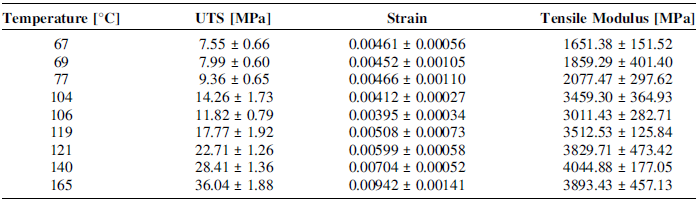
In this study, we analysed the thermal influence on UTS, tensile modulus, and strain. Mechanical data were collected across a range of PDT conditions. Table 3 presents the averaged values of UTS, maximum strain, and tensile modulus for each temperature setting, together with the corresponding standard deviations.
UTS, Maximum Strain, and Tensile Modulus at different temperatures

3.1. Ultimate tensile strength
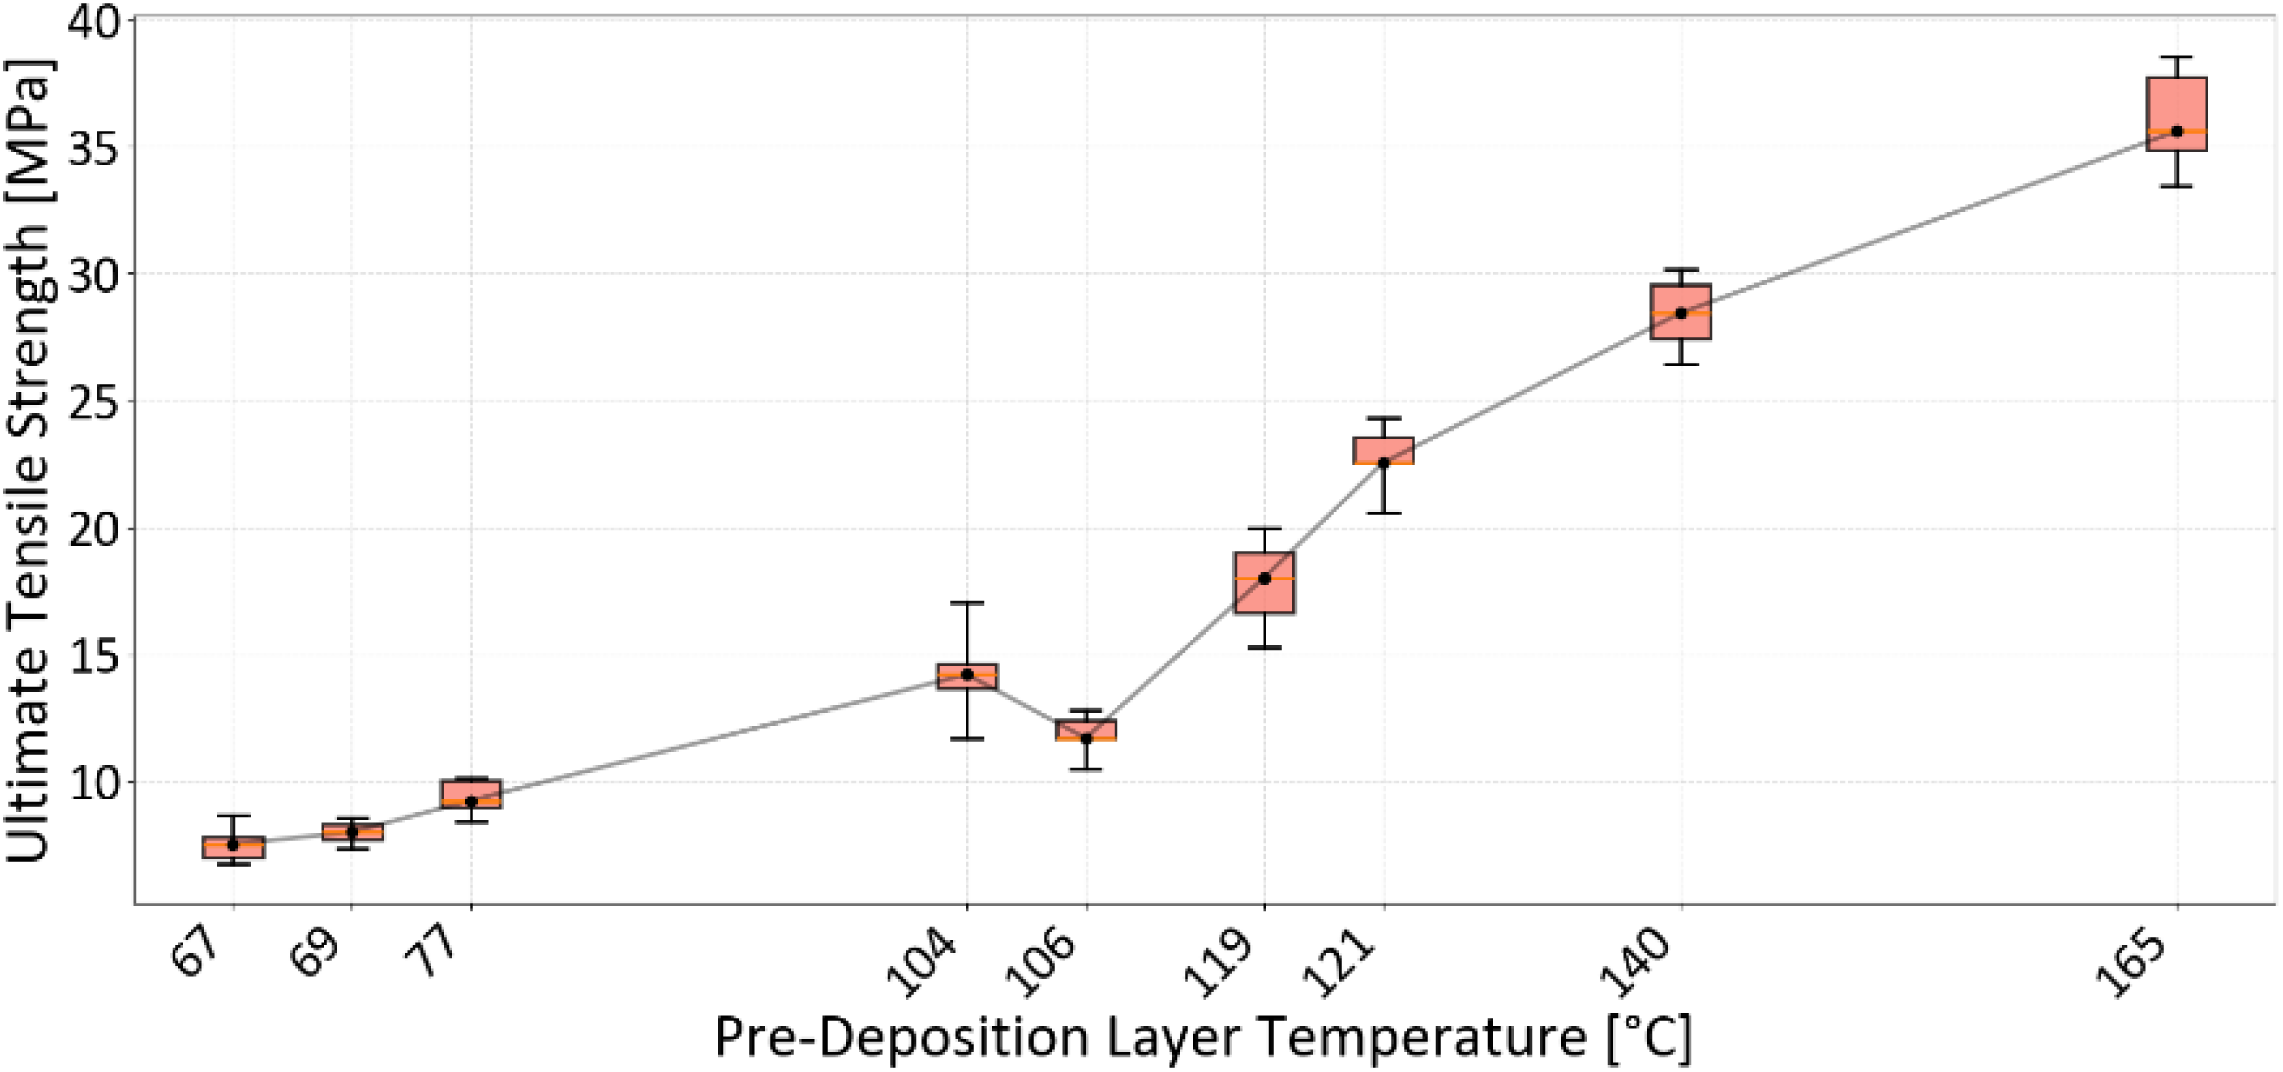
In Figure 4, the UTS measured at different PDT is illustrated.
UTS vs PDT

When analysing Figure 4, the average UTS ranged from 7.5 MPa to 36 MPa. The increase in PDT from 67 °C to 165 °C resulted in a 4.8× increase in UTS. In the low-temperature region (67–77 °C), we observed a small standard deviation. At 104 °C, where the average UTS increased to 14.26 MPa, there was a higher variation between the specimens, giving a standard deviation of 1.73 MPa. At 106 °C, we unexpectedly observed a reduction in UTS to 11.82 MPa, with a lower standard deviation of 0.79 MPa. The specimens for 104 °C were manufactured with an open enclosure, while those at 106 °C were produced in a closed enclosure with increased fan speed. From 106 °C to 165 °C, we observe an expected trend, showing the correlation between PDT and UTS.
3.2. Strain
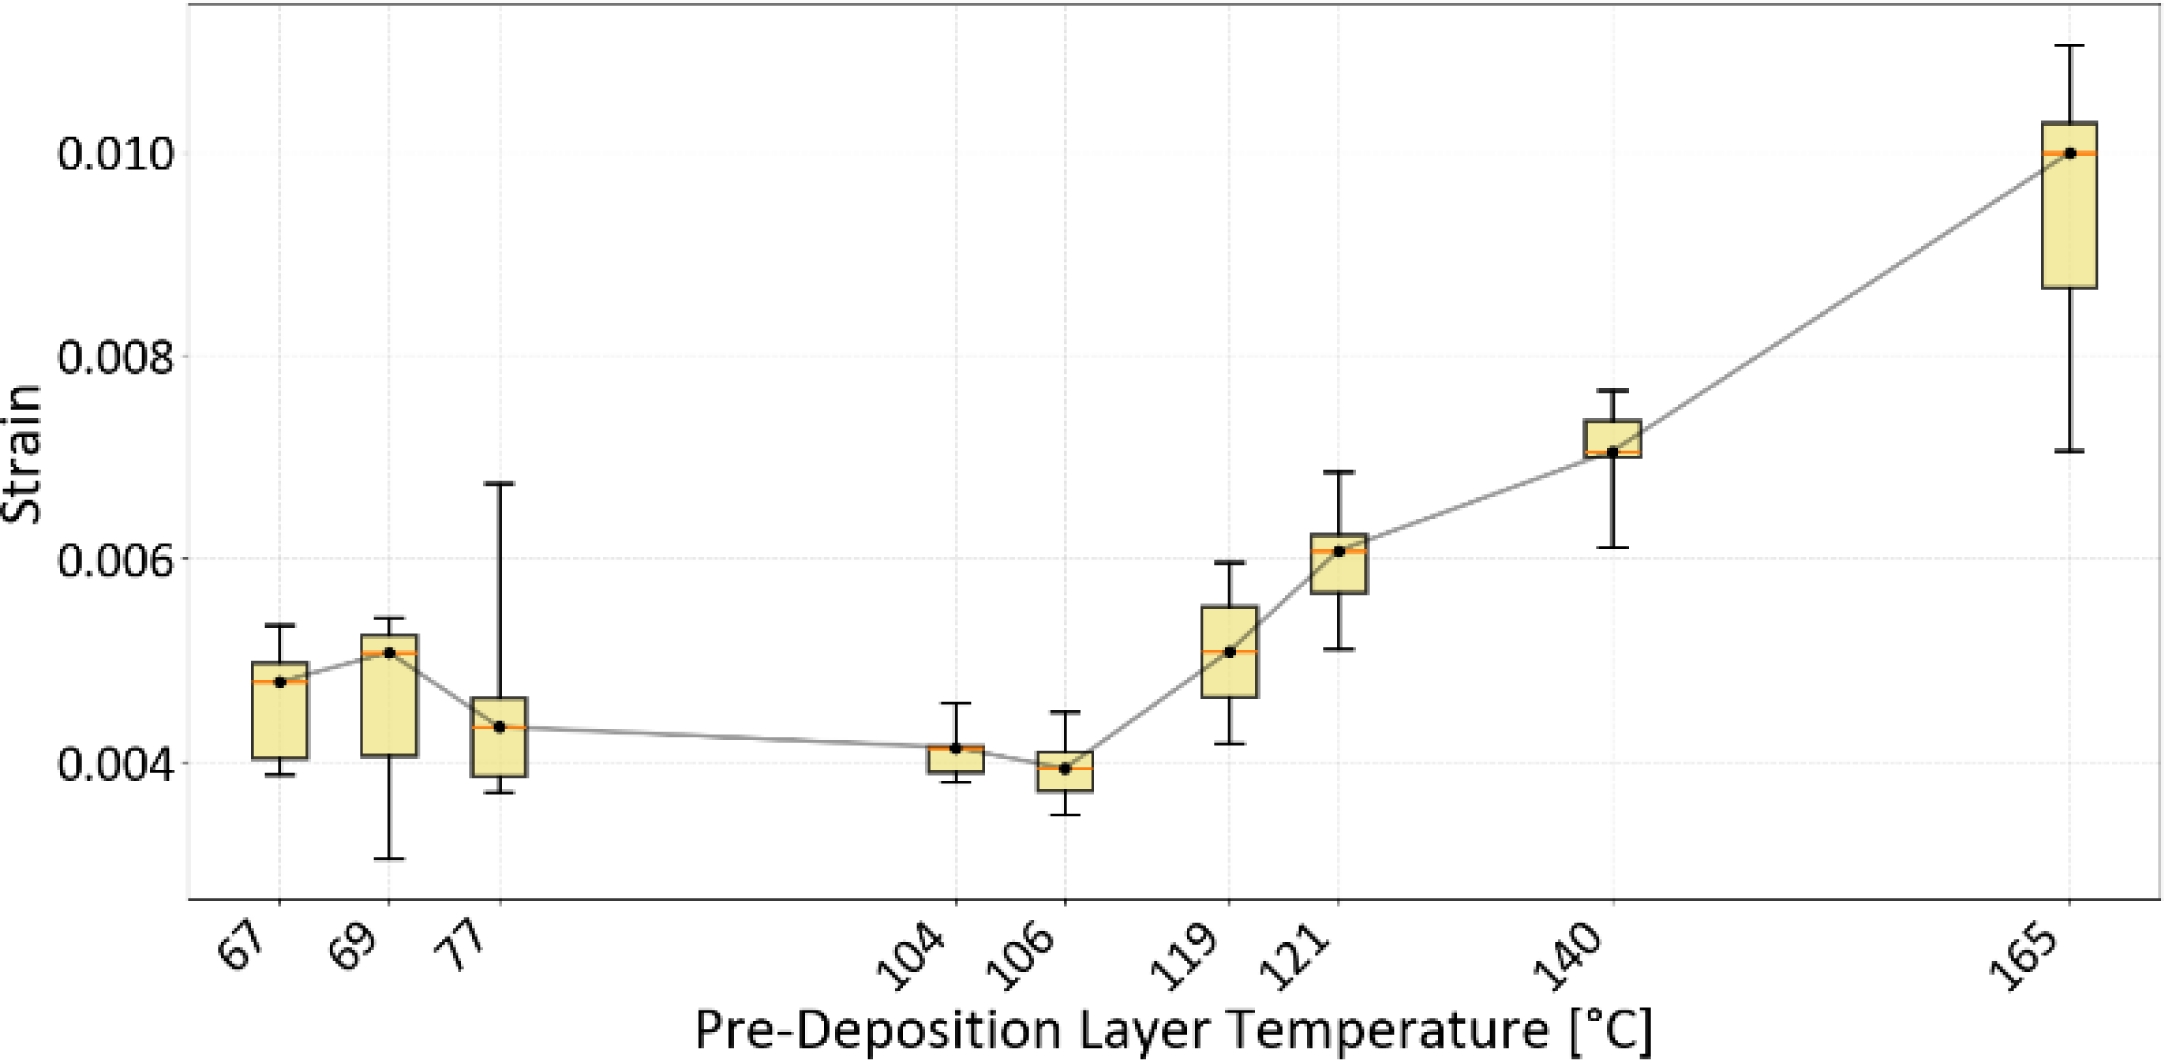
In Figure 5, the maximum strain measured at different PDT is illustrated.
Strain vs PDT

When analysing Figure 5, the average strain ranged from 0.00395 to 0.00942. Between 106 °C and 165 °C, the increase in PDT resulted in a 2.38× increase in average strain. The low-temperature region 67–77 °C resulted in strain readings with a high standard deviation, with 69 °C giving a standard deviation of 0.00105 and 77 °C giving a standard deviation of 0.00110. In addition, the transition from 67 °C to 106 °C resulted in a slightly lower average strain, decreasing from 0.00452 to 0.00395, with a much lower standard deviation of 0.00034. From 106 °C to 165 °C, the increase in PDT showed a clear correlation with increased strain, ranging from 0.00395 to 0.00942. While having the highest average strain, 165 °C also had a relatively high standard deviation of 0.00141.
3.3. Tensile modulus
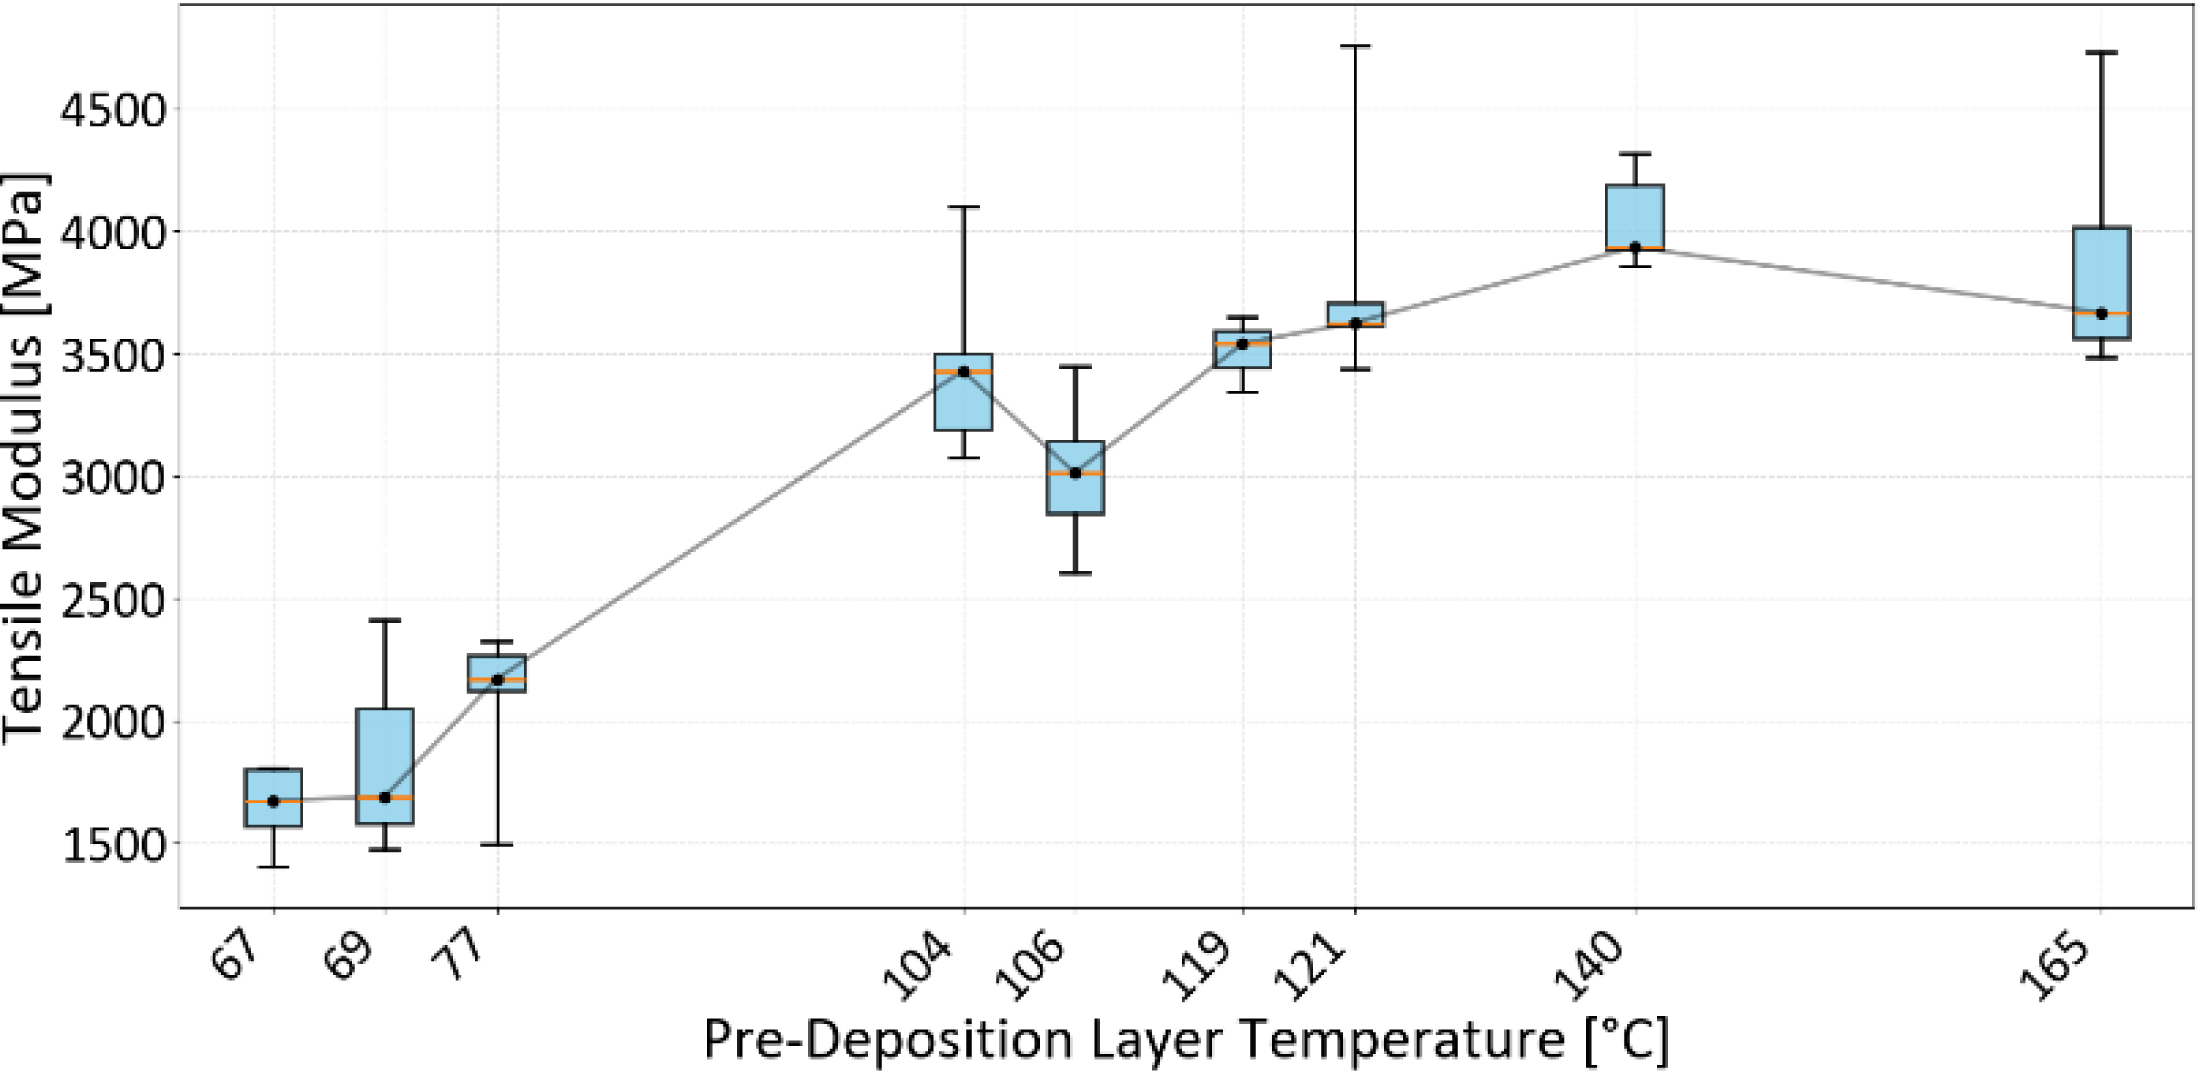
Figure 6 shows the relationship between PDT and tensile modulus. The measured values ranged from a minimum of 1651 MPa at 67 °C to a maximum of 4044 MPa at 140 °C.
Tensile Modulus vs PDT

As seen in Figure 6, the low-temperature region between 67 °C and 77 °C shows a slight increase in tensile modulus from 1651.38 MPa to 2077.47 MPa, with a standard deviation of 297.62 MPa. Between 104 °C and 106 °C, there is a small decrease in tensile modulus from 3459.30 MPa to 3011.43 MPa, accompanied by a reduction in standard deviation from 364.93 MPa to 282.71 MPa. From 106 °C to 140 °C, increasing PDT leads to a rise in average tensile modulus, reaching a maximum of 4044.88 MPa with a standard deviation of 177.05 MPa at 140 °C. From 140 °C to 165 °C, there is again a slight decrease in tensile modulus, with an average of 3893.43 MPa and a standard deviation of 457.13 MPa at 165 °C. Overall, the increase in PDT from the lowest to the highest setting results in a 2.45× increase in tensile modulus.
4. Discussion
The results of this study show that the PDT plays a significant role in the components’ mechanical properties. The worst result in terms of UTS, strain, and tensile modulus occurred at a PDT of 67 °C. At this temperature, UTS, strain, and tensile modulus are all substantially below the expected values from the datasheet, and the components printed with these PDTs were easily broken by hand. This low UTS is likely due to the DT and PDT remaining below the material’s melting point, resulting in poor interlayer fusion and, consequently, low strength. Above 106 °C, the UTS increases steadily with PDT, reaching its highest value at 165 °C. As seen in Table 3 and Figure 5, strain remains nearly constant up to 106 °C; beyond this temperature, the strain increases with temperature. This might be caused by a low degree of crystallinity at lower temperatures. Further studies should use differential scanning calorimetry (DSC) to investigate the level of crystallinity at these temperatures.
The tensile modulus as a function of PDT ranged from 1.65 GPa to 4.04 GPa. Interestingly, the highest tensile modulus was obtained at 140 °C; at higher temperatures, no further increase was observed comparable to that seen at lower temperatures. For product simulations, tensile modulus is a critical parameter for obtaining accurate predictions of structural behaviour. To the authors’ knowledge, the anisotropic and temperature-dependent effect on tensile modulus has not previously been reported for polymer-based material extrusion.
With the current state of knowledge, simulation prior to manufacturing will not accurately represent the real product, making iteration by CAD-based simulations difficult. However, the ability to monitor the process and relate it to PDT is a first major step towards enabling load-bearing components produced by MEX using high-performance polymers. Conventional simulation methods that assume a constant tensile modulus for the entire component are inadequate to capture the behaviour of materials with temperature-dependent mechanical properties. According to the manufacturer-supplied datasheet, this material can be printed with a chamber temperature of 25 °C while achieving a UTS of 64.5 ± 5.6 MPa and a tensile modulus of 4353 ± 206 MPa in the Z-direction. However, the results of this study demonstrate that this is not the case, as the mechanical properties are highly dependent on PDT.
The closest we came to these datasheet values in testing was for the 140 °C specimens, which reached a tensile modulus of 4044.88 ± 177.05 MPa and a UTS of 28.41 ± 1.36 MPa, and for the 165 °C specimens, which reached a tensile modulus of 3893.43 ± 457.13 MPa and a UTS of 36.04 ± 1.88 MPa. While these results are relatively close in terms of tensile modulus, the highest measured UTS remains far below the values stated in the datasheet. Furthermore, these PDT were achieved on very small geometries. As our component-scale experiments show, larger geometries result in PDT that are too low to realise the full potential of the material. Due to data corruption, the 69 °C and 119 °C results are based on three specimens instead of the five used for the other temperatures. This introduces some uncertainty regarding the accuracy of the results at these temperatures, although this is partially mitigated by the neighbouring 67 °C and 121 °C datasets.
The thermal component monitoring shows that the PDT ranges from a low of 88.5 °C to a high of 123.6 °C, and as seen in Table 3, these regions of the component will exhibit markedly different mechanical properties. Based on the results in Table 3, within this temperature range the UTS nearly doubles: the 88.5 °C region has a UTS of slightly above 9.36 MPa, while the 123.6 °C region has an expected UTS of around 22.71 MPa. In contrast, a direct reading of the datasheet would suggest an expected UTS of approximately 67.7 MPa for both regions. These results demonstrate that the datasheet values cannot be assumed to represent the properties achieved under realistic printing conditions, and that care must be taken to validate such claims for this material.
The sampling rate of the thermal measurements proved to be a challenge during data collection. As seen in Figure 2C, the raw data from the thermal camera exhibits sharp jumps between low and high temperatures. Although the camera operates at a frame rate of 25 Hz, the TCView software provides only a 1 Hz sampling rate. This low sampling rate necessitates monitoring multiple layers to capture the lowest PDT during printing. The PDT measurement method used here is an approximation suitable primarily for the small specimen geometries. A more accurate approach would track the nozzle and record PDT along its path. Future thermal monitoring work should employ higher sampling rates to capture a more detailed representation of temperature evolution during printing
The PDT is a function of layer time, geometry, layer height, and ambient temperature. This implies that small components with short layer times can be printed on low-cost equipment while still achieving relatively high mechanical properties, without additional investment in hardware. However, as component complexity and size increase, the performance of the polymer drops significantly toward unusable mechanical properties due to reduced processing temperatures. For low-cost equipment, great care must therefore be taken to control PDT, as excessively low temperatures prevent the expected properties from being realised and lead to underutilisation of the material’s potential.
Based on the findings of this paper, material characterisation is the first major step towards part certification in MEX. The results can support designers both in certifying components and in predicting their in-service performance. Certification of load-bearing products and prototypes requires accurate data on the mechanical properties of the materials employed. PA6-CF can, in principle, be used directly as a structural material in final products due to its excellent mechanical performance. Although the fatigue properties of this specific material were not characterised in the present work, a study on a similar carbon fibre–reinforced polyamide reported a fatigue limit of 39% of UTS after 5 million cycles (Reference Azizian-Farsani, Rouhi Moghanlou, Mahmoudi, Wilson and KhonsariAzizian-Farsani et al., 2025) indicating strong potential for both static and cyclic load applications. However, as demonstrated in this study, the mechanical properties of this polymer are highly sensitive to the thermal conditions during manufacturing. While its full potential can be realised on low-cost equipment, and at relatively low cost and short lead times compared to conventional manufacturing processes, the process parameters have a major impact on the outcome. Temperature and geometry play a critical role in achieving the expected material properties, and without proper monitoring and control of these variables, datasheet values do not provide sufficiently accurate input for reliable design.
5. Conclusion
In this study, the PDT of vertically MEX printed PA6-CF specimens was measured using thermal imaging. Process parameters were manipulated to achieve a PDT range from 67 °C to 165 °C. The specimens were subjected to quasi-static tensile testing to determine the relationship between thermal history and mechanical performance. The results showed a nearly linear increase in UTS (from 7.5 to 36 MPa) with rising PDT. For stiffness and ductility, distinct behavioural regimes were revealed. The tensile modulus more than doubled (1651 to 4044 MPa) from 69 °C to 104 °C and then plateaued around 4000 MPa. Conversely, failure strain remained very low (<0.5 %) below 119 °C but increased nearly linearly to 0.94 %. These findings demonstrate that thermal history is critical to interlayer bonding and overall mechanical performance. While desktop printers can process PA6-CF, their ability to achieve optimal properties is strongly limited by the thermal conditions present during printing. As a result, datasheet material values cannot be assumed to apply to components, where the PDT varies. This underscores the need for simulation models to incorporate temperature-dependent material properties to ensure predictive accuracy. Future work should integrate in-situ thermal monitoring as input for such models and, ultimately, for validation, in order to unlock the full potential of high-performance polymers in MEX.
Acknowledgement
Thanks to Matilde Cassandra Fjeld that provided the figures on the printed component and thermal monitoring measurements in section 2.1 that motivated this current study.



 Open access

