

INTRODUCTION
Zika infection is an arboviral disease characterized by subclinical or mild dengue-like illness, with severe manifestations such as Guillain-Barre syndrome in adults and microcephaly in babies born to infected mothers [Reference Plourde and Bloch1]. During 2015 and 2016 the disease affected several South-American countries, especially Brazil and Colombia. In Colombia, a total number of 104 755 cases were recorded, from which 8826, 92 113, and 3816 cases were confirmed by laboratory, diagnosed by clinical symptoms, and suspected without confirmation, respectively. Zika cases were recorded between the 32th epidemiological week, 2015 until the 42nd epidemiological week, 2016 (09/08/2015–22/10/2016) [2]. For the analysis presented in this paper we use the data from four cities, Bucaramanga (3651 cases), Cali (12 220), Cúcuta (4287), and Neiva (1940).
Mathematical and statistical models are increasingly being used to facilitate the estimation of the primary epidemiological parameters in infectious disease outbreak. During a single-peak outbreak, the turning point (or primary inflection point), i.e. the point in time at which the rate of accumulation changes from increasing to decreasing, and the final size of the epidemic are among the epidemiological parameters of interest to be estimated [Reference Hsieh, Lee and Chang3–Reference Hsieh and Cheng5]. Once an outbreak has begun, knowledge about the potential severity in real-time (i.e. before the end of the outbreak) can help public health authorities to respond effectively [Reference Hsieh and Cheng5].
Various epidemiological studies used mathematical and statistical models to describe the evolution and spread of severe acute respiratory syndrome (SARS) and dengue and to evaluate the impact of control interventions. In particular, Hsieh et al. [Reference Hsieh, Lee and Chang3, Reference Hsieh and Cheng5] and Zhou et al. [Reference Zhou and Yan4] proposed to use a non-linear model, the Richards model [Reference Richards6], in order to model the cumulative number of reported cases, to estimate the turning point and the basic reproduction number, R 0. Hsieh et al. applied non-linear models to model epidemics of SARS [Reference Hsieh, Ma, Wu and Zhoue7], dengue disease [Reference Hsieh and Ma8–Reference Hsieh, Arazoza and Lounes10], Influenza A (H1N1) [Reference Hsieh11] and Ebola [Reference Hsieh12]. In addition to the estimation of the epidemiological parameters, Hsieh et al. [Reference Hsieh, Lee and Chang3] used the model for real-time prediction of these parameters for dengue and SARS outbreaks.
Hsieh et al. estimation and prediction is based on the Richards model and considers only the cumulative infective population size with saturation in growth as the outbreak progresses. The basic premise of the Richards model is that the incidence curve consists of a single peak of high incidence, resulting in an S-shaped epidemic curve and a single turning point of the outbreak [Reference Hsieh, Ma, Wu and Zhoue7, Reference Hsieh and Ma8]. Hsieh et al. [Reference Hsieh, Ma, Wu and Zhoue7, Reference Hsieh and Ma8] also showed that the Richards model can be used to model multi-wave outbreaks as well. In this paper we focused on a single-wave outbreak.
A variety of non-linear models have been developed to model growth data. Among them, we consider the three-parameter logistic (3P logistic) [Reference Hsieh, Ma, Wu and Zhoue7, Reference Rozema13, Reference Tsoularis and Wallace14], five-parameter logistic (5P logistic) [Reference Liao and Liu15], Sigmoid Emax [Reference MacDougall and Ting16], Gompertz [Reference Tsoularis and Wallace14, Reference Wellock, Emmans and Kyriazakis17], and Weibull [Reference Seber and Wild18] models. All these models can be used to fit epidemic data as well. Fitting several models to the same data raises the issue, central in statistical modeling, of model selection. Indeed, a model selection procedure is needed in order to choose the model with the best fit to the data. Often, one is confronted with the problem that several models are performing almost equally well over the range of observed data. Typically, one selects the best-fitting model out of the set of fitted models and ignores the uncertainty due to model selection in estimation and inference. For these reasons, several authors (i.e. Burnham & Anderson [Reference Burnham and Anderson19], Claeskens & Hjort [Reference Claeskens and Hjort20], Posada [Reference Posada and Buckey21], Moon [Reference Moon22], and Lin [Reference Lin23]), advocate the use of model averaging (MA) techniques to perform multimodel estimation and inference. MA is a method that takes into account all fitted models for the estimation of the parameters of primary interest. It is based upon a weighted average of the parameter of primary interest obtained from different models, giving largest weights to those models that best fit the data [Reference Faes24].
In the current paper we analyse Zika outbreak data and estimate a model average of the final size and the turning point of the epidemic, and perform a real-time prediction using several non-linear models. A real-time prediction is a procedure in which the final size of the outbreak is estimated as early as possible. An elaborate description of the procedure is given in the supplementary material for the paper (Supplementary Fig. S1). The proposed method is applied to four Zika outbreaks that occurred in four cities in Colombia during the 2015/2016 outbreak.
DATA
The data used in this paper were collected from four cities from Colombia, where Zika disease cases were reported to the Instituto Nacional de Salud (Colombian National Institute of Health) in a weekly basis. The study locations represent cities with the highest number of Zika cases within all the cities in Colombia. Two of the cities are located to the northeast of Colombia (Bucaramanga and Cúcuta) and two are located to the southwest (Cali, Neiva).
The weekly counts of clinical Zika cases by date of onset of symptom per city were converted into cumulative case curves starting on the 50 epidemiologic week (EW) of 2015 for Cali and Bucaramanga, and the 47 EW for Cucuta and Neiva. The starting and ending dates of the outbreaks, as well as the observed number of cases at the end and the observed attack rates are shown in Table 1.
Epidemiological information on the 2015/2016 Zika outbreak in the four cities from Colombia

Figure 1 shows incidence and cumulative number of cases for the four cities under study. The outbreaks in Cúcuta and Neiva started and ended earlier (47 EW 2015 until 13 EW 2016) than the outbreaks in Cali and Bucaramanga (50 EW 2015 until 36 EW 2016).
Weekly number of cases (left) and cumulative cases (right) of Zika disease for the 2015/2016 outbreak in four cities from Colombia.The time scale is given in EW.

METHODS
Modeling Zika outbreak using non-linear models
The Richards model [Reference Richards6, Reference Jorgensen25, Reference Wang, Wu and Yang26] has often been used to model reported cumulative cases in disease outbreaks. In particular, Hsieh et al. [Reference Hsieh and Cheng5, Reference Hsieh, Ma, Wu and Zhoue7] demonstrated that Richards model can be used for real-time prediction of outbreak severity by estimating the carrying capacity (i.e.the final size of the epidemic) as well as real-time detection of the turning point (i.e. the time point with the peak number of cases) of the epidemic.
In Hsieh et al. [Reference Hsieh and Cheng5–Reference Hsieh, Arazoza and Lounes10], the estimates were obtained under the assumption that the cumulative number of reported cases at time t, Y t , are normally distributed with mean μ(t, θ) and variance σ 2, Y t ~ N(μ(t, θ), σ 2). The mean structure for μ(t, θ) is given in the first line in Table 2. As pointed out by Hsieh et al. [Reference Hsieh and Cheng5–Reference Hsieh and Chen9] the parameter vector to be estimated is θ = (α, γ, k, η), where α is the final size of the epidemic, γ is the per capita intrinsic growth rate of the infected population, k is the exponent of the deviation from the standard logistic curve and η is the turning point.
Non-linear models considered to fit the cumulative cases of Zika outbreak

The cumulative number of reported cases in a Zika outbreak is an example of growth data. For many types of growth data, the growth rate does not steadily decline, but rather increases to a maximum before steadily declining to zero. In such models, η is the position of the point of inflection (turning point of the epidemic for the application presented in this paper), the time when the growth rate is greatest.
Table 2 presents other five possible non-linear models. Note that all these models are scaled in calendar time (for which t = 1 is the first epidemiological week in which the outbreak ocurred). The 3P logistic model [Reference Rozema13, Reference Tsoularis and Wallace14] is a special case of the Richards model, obtained when the exponent k = 1. For the 3P logistic model, the growth curve is symmetric around turning point and has equal periods of slow and fast growth. The Gompertz model [Reference Tsoularis and Wallace14, Reference Wellock, Emmans and Kyriazakis17] is another special case of the Richards function when γ → 0 and is frequently used in situations where growth is not symmetrical about the turning point. There are many variants of the Weibull model, the one we use in this paper is a modification of the Gompertz model when its independent variable, time, is rescaled by logarithmic transformation [Reference Seber and Wild18]. Note that for all the models in Table 2 the turning point and the final size of the epidemic are parameters in the model.
The sigmoid Emax model and the 5P logistic are commonly used in dose–response modeling [Reference Lin23]. The sigmoid Emax model [Reference MacDougall and Ting16] is obtained by mathematical transformation of 3P logistic model and rescaling the independent variable by a logarithmic transformation. Similarly, the 5P logistic model is obtained by rescaling the independent variable by logarithmic transformation and by doing a reparametrization, so that the model evaluated at the inflection point (η) reaches 50% of maximum response [Reference Liao and Liu15].
The first derivative of μ(t, θ), μ′(t, θ) = (∂μ(t, θ)/∂t), is the number of cases at time t, i.e., the incidence at time t. Except for the 3P logistic model, μ′(t, θ) is not symmetric around the turning point.
Model uncertainty, model selection, and MA
In the previous section, we presented six non-linear models that can be used for the estimation of epidemiological parameters and for real-time prediction. In this section, we describe the MA technique (Burnham & Anderson [Reference Burnham and Anderson19, Reference Burnham and Anderson27], Claeskens & Hjort [Reference Claeskens and Hjort20]), which is used to account for model uncertainty by combining together the estimates from all the fitted models. Within the MA framework, one fits a set of R candidate models, g
1, g
2, …, g
R
, to the data in order to obtain the parameter estimates from all models, $\widehat{{\theta _1}}, \;\widehat{{\theta _2}}, \; \ldots, \;\widehat{{\theta _R}} $
. A post selection procedure [Reference Claeskens and Hjort20, Reference Lin23] implies that we first need to select the model with the best goodness-to-fit to the data, say g
ℓ, and to estimate θ by
$\widehat{{\theta _1}}, \;\widehat{{\theta _2}}, \; \ldots, \;\widehat{{\theta _R}} $
. A post selection procedure [Reference Claeskens and Hjort20, Reference Lin23] implies that we first need to select the model with the best goodness-to-fit to the data, say g
ℓ, and to estimate θ by $\widehat{{\theta _\ell }} $
. The model selection can be based on an information criteria. However, this procedure does not take into account model uncertainty since the estimation is based on a single model. The MA techniques allow us to estimate the component in θ using information obtained from all fitted models and in that way to account for model uncertainty. Let us assume that the Akaike's Information Criterion (AIC [Reference Akaike, Petrov and Csaki28]) is used for model selection. For a given set of R candidate models, g
1, g
2, …, g
R
, Burnham & Anderson [Reference Burnham and Anderson27] proposed to rescale the AIC to
$\widehat{{\theta _\ell }} $
. The model selection can be based on an information criteria. However, this procedure does not take into account model uncertainty since the estimation is based on a single model. The MA techniques allow us to estimate the component in θ using information obtained from all fitted models and in that way to account for model uncertainty. Let us assume that the Akaike's Information Criterion (AIC [Reference Akaike, Petrov and Csaki28]) is used for model selection. For a given set of R candidate models, g
1, g
2, …, g
R
, Burnham & Anderson [Reference Burnham and Anderson27] proposed to rescale the AIC to
 $$\Delta {\rm AIC}_i = {\rm AIC}_i - {\rm AIC}_{{\rm min}} {\rm,} \quad i = 1, \ldots, R$$
here, AICmin is the smallest AIC value across the set of R models. The AIC differences, ΔAIC i , are interpreted as the information loss when model g i , rather than the best model g min, is used to approximate the true and unknown model. Burnham & Anderson [Reference Burnham and Anderson19] defined Akaike's weights as
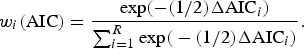 $$w_i ({\rm AIC}) = \displaystyle{{{\rm exp}( - (1/2)\Delta {\rm AIC}_i )} \over {\sum\nolimits_{i = 1}^R {{\rm exp(} - (1/2)\Delta {\rm AIC}_i {\rm )}}}}. $$
Akaike's weight w i (AIC) can be interpreted as the weight of evidence that model g i is the best model given a set of R models and given that one of the models in the set must be the best model. The non-linear model with the highest Akaike's weight (i.e. the minimum AIC) is considered as the model with the best goodness-to-fit to the data.
Following Burnham & Anderson [Reference Burnham and Anderson19], we can calculate the model averaged estimator for turning point ( $\widehat{\eta} _{{\rm MA}} $
) and the final size of outbreak (
$\widehat{\eta} _{{\rm MA}} $
) and the final size of outbreak ( $\widehat{\alpha} _{{\rm MA}} $
) as follow:
$\widehat{\alpha} _{{\rm MA}} $
) as follow:
 $$\widehat{\eta} _{{\rm MA}} = \sum\limits_{i = 1}^R w_i ({\rm AIC})\widehat{{\eta _i}}, $$
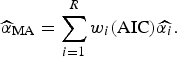 $$\widehat{\alpha} _{{\rm MA}} = \sum\limits_{i = 1}^R w_i ({\rm AIC})\widehat{{\alpha _i}}. $$
Here, $\widehat{{\eta _i}} $
and
$\widehat{{\eta _i}} $
and $\widehat{{\alpha _i}} $
are the parameter estimates for the turning point and final size of outbreak of ith model, respectively. The estimators for variance for
$\widehat{{\alpha _i}} $
are the parameter estimates for the turning point and final size of outbreak of ith model, respectively. The estimators for variance for $\widehat{\eta} _{{\rm MA}} $
and
$\widehat{\eta} _{{\rm MA}} $
and $\widehat{\alpha} _{{\rm MA}} $
are given, respectively, by:
$\widehat{\alpha} _{{\rm MA}} $
are given, respectively, by:
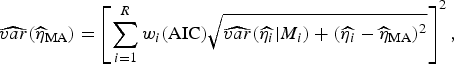 $$\widehat{{var}}(\widehat{\eta} _{{\rm MA}} ) = \left[ {\sum\limits_{i = 1}^R w_i ({\rm AIC})\sqrt {\widehat{{var}}(\widehat{{\eta _i}} \vert M_i ) + (\widehat{{\eta _i}} - \widehat{\eta} _{{\rm MA}} )^2}} \right]^2, $$
 $$\widehat{{var}}(\widehat{\alpha} _{{\rm MA}} ) = \left[ {\sum\limits_{i = 1}^R w_i ({\rm AIC})\sqrt {\widehat{{var}}(\widehat{{\alpha _i}} \vert M_i ) + (\widehat{{\alpha _i}} - \widehat{\alpha} _{{\rm MA}} )^2}} \right]^2. $$
Note that one can replace the AIC by other information criteria such as Bayesian information criterion (BIC), Kullback information criterion (KIC) and calculate the model's weight based on these criteria.
In addition, since the models’ weights are based on the AIC (or any other information criterion) the MA approach described above ensure that the parameter estimates for the turning point and final size of the epidemic (and their standard errors) will be dominated by the model(s) with the best goodness-of-fit.
RESULTS
Estimation of the final size and turning point using MA methods
All non-linear models discussed above were fitted to the single-phase Zika outbreak in the cities of Bucaramanga, Cali, Cúcuta, and Neiva. The models were fitted to the weekly cumulative number of reported cases and the turning point and the final size were estimated for each city. The models were fitted using R software 3·3·1 [29], using the gnls function from package nlme [Reference Pinheiro30].
Table 3 shows the parameter estimates, Akaike's information criteria and the Akaike's weights for all non-linear models used to calculate the model averaged estimates for the turning point and the final size of the outbreak. Figure 2 displays the cumulative predicted values and the incidence predicted values obtained for the fitted models to the complete data in each city, together with the observed values.
Predicted cumulative and incidence cases based on six non-linear models for Zika outbreaks in four Colombian cities. Prediction is done when all data are used for the estimation of model parameters.

Parameter estimates for the turning point and final size of the epidemic obtained for the six non-linear model and their model average estimates per city

For Bucaramanga, the 5P logistic model (AIC = 348·6), the Richards model (AIC = 361·9), and the 3P logistic model (AIC = 397·0) had lower AIC than the four-parameter (4P) Gompertz model (AIC = 424·1), the sigmoid Emax model (AIC = 405·5), and the Weibull model (AIC = 468·3). The MA final size estimate of the Zika outbreak is equal to 3700 cases (95% CI 3632–3768) with a turning point close to the 19·1 weeks (95% CI 18·8–19·3) after the begining of the outbreak. Note that the observed final size is equal to 3651 (Table 1). The 5P logistic model has an Akaike weight equal to 0·999, while the weights obtained for the other models are relatively small which implies that the model average parameter estimated will be dominated by the 5P logistic model for this city.
Similar pattern was observed in Cali. The 5P logistic model (AIC = 451·6), the Richards model (AIC = 494·9), and the 3P logistic model (AIC = 511·7) had lower AIC than the 4P Gompertz model (AIC = 527·0), the sigmoid Emax (AIC = 521·1), and the Weibull model (AIC = 567·2). The final size estimate for the Zika epidemic from the MA is equal to 12 458 cases (95% CI 12 023–12 893), with an estimated turning point of 20·3 weeks (95% CI 19·9–20·8) after the Zika epidemic starts. As for Bucaramanga, in Cali, the Akaike's weight from the 5P logistic model is the highest and closed to 1, which implies that MA parameter estimates are mostly based on the 5P logistic model. The 5P logistic model is the model with the smallest AIC (AIC = 196·8) in Cúcuta as well. The 3P logistic (AIC = 196·8) and Richards model (AIC = 197·4) have similar AIC. Once again, the Weibull model has the highest information criteria (AIC = 247·9). The MA estimate for final size is 4285 cases (95% CI 4199–4372), with an estimated turning point of 8·93 weeks (95% CI 8·72–9·15) after the outbreak begins. For this city Akaike's weights for the 3P logistic, the Richards and the 5P logistic models are equal to 0·370, 0·265, and 0·365, respectively. Hence, the MA estimates of final size and turning point are dominated by the parameter estimates obtained for these three models.
The model fit for the city of Neiva is sligthly different from the other cities reported above. Here, the models with the lowest AIC were the sigmoid Emax model (AIC = 173·8), the 5P logistic model (AIC = 175·7), and the Richards model (AIC = 176·9), while the model with the highest AIC corresponded again to the Weibull model (AIC = 198·3). The MA final size estimate for Neiva is equal to 1943 cases (95% CI 1913–1972), and an estimated turning point of 8·9 weeks (95% CI 8·7–9·3) after the outbreak starts. In Neiva, the highest Akaike's weight is for the sigmoid Emax model (0·613), followed by the 5P logistic (0·236) and Richards model (0·133).
Real-time prediction
The model average framework is particularly useful for real-time prediction since we use only part of the data for long-term prediction. In this case, we do not want to base the estimation on a single model. Point estimates and 95% CI obtained for all non-linear models and from the MA are presented in the supplementary appendix of the paper, for the turning point and final size of the outbreak in Bucaramanga, Cali, Cúcuta, and Neiva (Supplementary Tables S2–S5, respectively).
For Bucaramanga, the MA point estimate for the final size of the epidemic is 3452 cases (95% CI 2982–3922), for the model fitted using the data of the first 26 weeks after the epidemic starts (Fig. 3d and Supplementary Table S2), while the observed final size of the outbreak is 3651 cases (Table 1). This implies that around 4 months before the end of the epidemic this valuable information could be available for the health authority. Furthermore, for the same estimation period, the MA estimate for the turning point becomes stable with a point estimate of 18·6 weeks (17·4,19·8) (Fig. 3b and Supplementary Table S2). These results indicate that the health authority could estimate the turning point of the outbreak about 6 weeks after its occurrence in Bucaramanga.
Parameter estimates for the turning point and final size of the outbreak, from the non-linear models under study (point estimates), and from MA (point estimates and 95% CI) per city. Dashed lines represent the observed values. The time scale in all figures present the last week in the estimation period. For example in panel a, 22 implies that the estimation period is 1–22 weeks, etc.

For Cali, the observed final size of the Zika epidemic is 12 220 cases (Table 1). All the models overestimate the final size of the epidemic. The model average estimate stabilizes around the estimate of 12 560 cases (95% CI 11 848–13 272) for the models fitted to the period 1–33 weeks after the epidemic starts (i.e. 6 weeks before the end of the epidemic Fig. 3h and Supplementary Table S3). The MA estimate for the turning point obtained from the model fitted to the estimation period 1–33 weeks is 22·5 weeks (95% CI 21·5–19·4) (Fig. 3f and Supplementary Table S3).
For Cúcuta, The final size estimate from MA is stable from the model fitted for the estimation period 1–14 week, with a point estimate of 4308 cases (95% CI 4039–4578) (Fig. 3l and Supplementary Table S4). The observed final size for Cúcuta is 4287 cases (Table 1). The turning point estimate from MA is equal to 8·9 weeks (95% CI 8·6–9·2), for the models fitted to the period 1–14 weeks after the epidemic starts (i.e. 5 weeks before the end of the outbreak Fig. 3j and Supplementary Table S4).
For Neiva, the observed final size of the epidemic is 1940 cases (Table 1). The model average estimate for the final size of the epidemic is equal to 1899 cases (95% CI 1742–2055) obtained for the model fitted to the data of the first 13 weeks of the outbreak (i.e. 6 weeks before the end of the outbreak Fig. 3p and Supplementary Table S5). The turning point estimate from MA becomes stable for the models fitted to period 1–13 week, showing a point estimate of 8·9 weeks (95% CI 8·5–9·3) (Fig. 3n and Supplementary Table S5).
In general, the models seem to fit the data for the shorter outbreaks (Cúcuta and Neiva) better than for the longer outbreaks (Bucaramanga and Cali). In addition, the Weibull model fits the data poorly for all cities. An elaborate discussion about the performance of the Weibull model in Bucaramanga and Cali is given in the supplementary material of the manuscript. The 95% CIs for the final size of the epidemic for all cities contain the observed final size, which implies that around 2–4 months before the end of the outbreak an accurate estimate for the outbreak's final size could be provided to the health authorities. The turning point estimates for Cúcuta and Neiva understimate the observed value by 1 week, but for Bucaramanga and Cali, the estimates are in line with the observed values, while the final size estimates estimate accurately the observed values for all cities (Fig. 3). The MA estimates for the turning point and final size of the epidemic were stable around the first 2/3 of the total outbreak duration.
DISCUSSION
Modeling a single-wave outbreak requires to use a non-linear growth model in order to estimate the epidemiological parameters of interest. In this study we have shown that several non-linear models, the Richards, the 3P logistic, 5P logistic, the Weibull, sigmoid Emax and 4P Gompertz models, can be used to model the data. Alternatively, a model average technique that used a weighted parameter estimate, based on the model posterior probability, can be applied. In this paper we advocate the use of the MA technique since it does not ignore uncertainty related to model selection which is ignored when post selection inference and estimation is conducted.
Further, we have shown that the MA approach can be used in order to perform a real-time estimation for the turning point and prediction for the final size of the epidemic. We have shown that in the case of the Zika outbreak in 2015/2016 in Bucaramanga and Cali, an estimate with 95% CI that cover the observed final size could be given to the health authorities 4 months before the end of the epidemic, and for Cúcuta and Neiva accurate estimates for the final size could be provided 2 months before the end of the epidemic. Further, for a real-time prediction, the MA offers an attractive modeling approach since the data available for modeling represents only a part of the outbreak data (from the start to the time in which the real-time prediction is performed). Hence, to our opinion, taking into account several possible models is appropriate in this setting.
Since this study was conducted retrospectively, with data from routine surveillance system, potential biases could not be prevented. Some limitations include data quality associated with real-time modeling (as data are often subject to ongoing cleaning, correction, and reclassification of onset dates as further data become available) and reporting delays. Whether reporting delays or dates of reporting and date of onset were known, it would be possible to perform more realistic analyses that include only cases known about at the end of the most recent time period. This would likely make the models appear less attractive, but might provide a more realistic lower bound in terms of how quickly turning points can be identified.
Predicting the trend of an epidemic from limited data during early stages of the epidemic can be sometimes misleading. Nevertheless, early prediction of the magnitude of an epidemic outbreak is more important than retrospective studies [Reference Hsieh, Lee and Chang3]. The methodology proposed in the paper does not allow for a prediction of the turning point but only for the estimation. This is due to the fact that the non-linear models presented in the paper fit poorly the data in the initial stage of the outbreak, i.e., when the turning point of the outbreak can be predicted. As was observed in other attempts at real-time prediction, the forecast appears to be very vulnerable to the timing of predictions, especially during the early phase of epidemic [Reference Nishiura31]. As long as the data include this inflection point and a time interval shortly after, the curve fitting and predicting future case number will be reasonably accurate [Reference Hsieh, Lee and Chang3].
The MA modeling approach provides an attractive framework for real-time prediction since it takes into account a set of models and the real-time prediction is dominated by the model(s) with the best goodness-of-fit to the data. In the case of Bucaramanga and Cali, one model dominated the estimation and prediction (the 5P logistic), while in the case of Neiva and Cucuta the model average estimates was dominated by several models (3P logistic, Richard and 5P logistic in Cucuta with a combined weight >0·999 and Richard, 5P logistic, and sigmoid Emax with a combined weight of 0·982 in Neiva). This is the main advantage to use the MA framework for real-time prediction since, taking into account that only a part of the data is available and can be used for prediction, the estimation procedure is based on the best-fitted models.
The present study successfully offers a modeling strategy to implement real-time prediction of an epidemic in the midst of its course. The methodology discussed in this paper was developed for a single-wave outbreak. In future research we will extend the MA approach to a multi-wave outbreaks setting as well.
DECLARATION OF INTEREST
None.
SUPPLEMENTARY MATERIAL
The supplementary material for this article can be found at https://doi.org/10.1017/S0950268817001078
ACKNOWLEDGEMENTS
This research received no specific grant from any funding agency, commercial or not-for-profit sectors. D.A. Martínez Bello acknowledges the support of COLCIENCIAS by the grant 646-2014.


