

Introduction
The goal of this paper is to investigate the role played by ice motion and subglacial cavity enlargement in the melt-season transition from distributed to more channelized subglacial drainage. Evidence for subglacial cavity enlargement by vertical uplift of a glacier from its bed is found in anomalous vertical motion of the upper surface during periods of enhanced horizontal velocity (Reference Iken, Röthlisberger, Flotron and HaeberliIken, and others, 1983; Reference Iken and BindschadlerIken and Bindschadler, 1986; Reference Kamb and EngelhardtKamb and Engelhardt, 1987). Determining the extent, or even the existence, of subglacial cavity opening from surface vertical motion is problematic since vertical motion may also arise from flow along a sloping bed and vertical strain (Reference Hooke, Calla, Holmlund, Nilsson and StroevenHooke and others, 1989). Where the bed topography is not known, the bed slope can be estimated by monitoring the movement of a point throughout the winter flow regime (assuming no basal sliding) and comparing its actual position at the end of the summer flow regime (assuming basal sliding) with its expected position under a continued winter flow regime (e.g. following Reference Iken, Röthlisberger, Flotron and HaeberliIken and others, 1983, p. 35). Accurately determining vertical strain rates at the glacier surface requires spatially widespread measurements of surface horizontal motion. If vertical strain rates vary with depth, then it may also be incorrect to assume strain rates that are constant at surface values, or that vary linearly with depth as a basis for determining vertical motion due to straining (Reference Balise and RaymondBalise and Raymond, 1985; Reference Hooke, Calla, Holmlund, Nilsson and StroevenHooke and others, 1989). Reference Balise and RaymondBalise and Raymond (1985) modelled how basal velocity anomalies are expressed at the glacier surface over a variety of spatial scales. They show that it is important to establish the spatial pattern of surface velocities over length scales of several ice thicknesses before one can attempt to interpret surface motion in terms of basal velocities.
Previous investigations of subglacial cavity enlargement caused by bed separation that were based on measurements of surface vertical motion are limited by the inadequate spatial resolution of the available surface motion data (Reference Iken, Röthlisberger, Flotron and HaeberliIken and others, 1983; Reference KambKamb and others, 1985; Reference Raymond and MaloneRaymond and Malone, 1986; Reference Kamb and EngelhardtKamb and Engelhardt, 1987). In this paper, patterns of surface motion of an alpine glacier during an early melt-season period of enhanced surface velocity (hereafter referred to as a “spring event”) are analyzed at high spatial resolution to evaluate the extent of enlargement of subglacial cavities by bed separation. The spatial pattern of possible cavity enlargement is then compared with the structure of the subglacial drainage system, as deduced from previous hydrological research, to assess the role of cavity opening during spring events in promoting drainage-system evolution. The results contribute towards a better understanding of the mechanisms underlying apparently rapid transitions in subglacial drainage systems.
Field Site and Methods
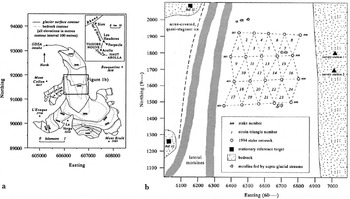
Haut Glacier d’Arolla is located above the village of Arolla at the head of the Val d’Hérens, Valais, Switzerland (Fig. 1). The glacier consists of a 2.2 km long, north–south-trending tongue, approximately 750–800 m wide, fed by two separate firn basins. The glacier snout lies at an elevation of 2560 m, while the main eastern basin rises to 3500 m, and the western tributary basin rises to 3325 m. Total glacier length along the centre line of the main flow unit is about 4 km, and the total area of the glacier is 6.33 km2. Ice thicknesses in the study area range from ∼130 m along the glacier centre line to ∼30 m towards the glacier margins where ice-cored moraines flank the valley sides. The glacier has been the subject of an integrated study of glacier hydrology and meltwater quality that has included work to: (1) determine the subglacial drainage configuration, and (2) determine the temporal evolution of the morphology of subglacial drainage-system pathways (e.g. Reference SharpSharp and others, 1993; Reference Hubbard, Sharp, Willis, Nielsen and SmartHubbard and others, 1995; Reference RichardsRichards and others, 1996; Reference Arnold, Richards, Willis and SharpArnold and others, 1998; Reference Gordon, Sharp, Hubbard, Smart, Ketterling and WillisGordon and others, 1998; Reference Nienow, Sharp and WillisNienow and others, 1998). Over most of the glacier, the subglacial drainage network is dominated by two main preferential drainage axes (PDAs; Reference SharpSharp and others, 1993). Within the glacier tongue, the eastern PDA is located to the east of the glacier centre line (Reference Mair, Nienow, Willis and SharpMair and others, 2001, fig. 2) centred along ∼606650E. The morphology of the drainage system within the eastern PDA has been shown to evolve throughout the melt season from a hydraulically inefficient, distributed drainage system to a hydraulically efficient, channelized drainage system (Reference Gordon, Sharp, Hubbard, Smart, Ketterling and WillisGordon and others, 1998; Reference Nienow, Sharp and WillisNienow and others, 1998). Predominantly channelized drainage systems are characterized by high-amplitude diurnal water-pressure fluctuations concentrated along narrow axes (variable-pressure axes (VPAs)). These are a response to large diurnal variations in water input and discharge (Reference Hubbard, Sharp, Willis, Nielsen and SmartHubbard and others, 1995).
Location of Haut Glacier d’Arolla, Switzerland, with close-up of stake network, survey stations and reference targets.
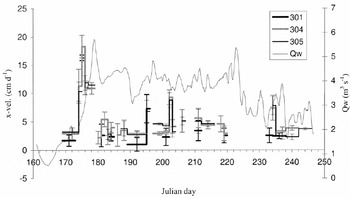
Temporal record of longitudinal velocities, vx, throughout the 1994 melt season with smoothed (24 hour running mean) proglacial stream discharge, Qw, superimposed. Although referred to as “daily” velocities, some of the measurements are averages over longer periods because surveys could not be undertaken during bad weather. The gaps in the velocity records resulted when stakes could not be resurveyed after they had been redrilled, or if measurement errors were very high.
Surface motion
To investigate the potential influence of subglacial hydrology on glacier dynamics, surface motion was recorded across an area centred ∼1500 m from the glacier snout (Fig. 1) through which the eastern PDA is predicted to pass (Reference SharpSharp and others, 1993). Glacier surface motion was determined by repeatedly surveying to prisms mounted on stakes drilled into the glacier surface. In early June 1994 a network of 20 motion stakes was established. Rows of stakes were staggered to create a network of surface strain triangles (Fig. 1). Surveys were carried out using a Geodimeter 410 total station system with an accuracy in the distance measurement of ±(2 mm + 3 ppm). This instrument error combined with human measurement error led to horizontal and vertical accuracy in stake positions of 9 and 4 mm, respectively, during the study period over the distances surveyed. Further details of survey set-up and errors can be found elsewhere (Reference Mair, Nienow, Willis and SharpMair and others, 2001).
Surface strain rates
Surface strain rates were calculated from the deformation of strain triangles formed by the staggered rows of motion stakes (Fig. 1). For each strain triangle, the position of the centre of the strain triangle, the two perpendicular principal strains (ε 1,2) and the angle of orientation of the first principal strain relative to north (θ) were calculated. Strain rate was assumed to be homogeneous within the strain triangles. Reference RamsayRamsay (1967) describes in full the method by which the magnitude and direction of the principal strains were calculated. Longitudinal strain (εxx ), transverse strain (εyy ) and shear strain (εxy ) were calculated where x is the flow direction, which is north, and y is cross-flow direction increasing to the east. Vertical strain (εzz ) was calculated, assuming incompressibility of ice (the vertical dimension, z, is measured in m a.s.l). Strain rates were obtained by dividing the strains by the time period between surveys.
Results
From 23 to 29 June (Julian days 173–179 (JD173–179)) 1994, horizontal glacier surface velocities increased by up to 500% relative to their annual averaged velocity. This highvelocity event, or “spring event”, was coincident with a rapid rise in water discharge from the glacier (Fig. 2). In Reference Mair, Nienow, Willis and SharpMair and others (2001), the spatial patterns of surface velocity, surface strain rates and the components of the force budget are analyzed in detail for periods before, during and after this spring event. In this paper we are concerned primarily with estimating what component of the vertical motion of the glacier during the event may have been caused by cavity opening at the glacier bed, and with determining the spatial pattern of cavity opening. We therefore concentrate our analysis of patterns of glacier motion on: (a) the period immediately before the spring event (JD169–173); (b) the period of surface uplift during the first 3 days of the spring event (JD173–176); and (c) the period of surface lowering during the last 4 days of the spring event (JD176–180). Spatial patterns of surface longitudinal and vertical velocities are shown for these periods (Figs 3 and 4).
Spatial patterns of surface longitudinal velocities (m d−1). (a) JD169–173, (b) JD173–176, (c) JD176–180. Positions of velocity stakes marked with crosses.
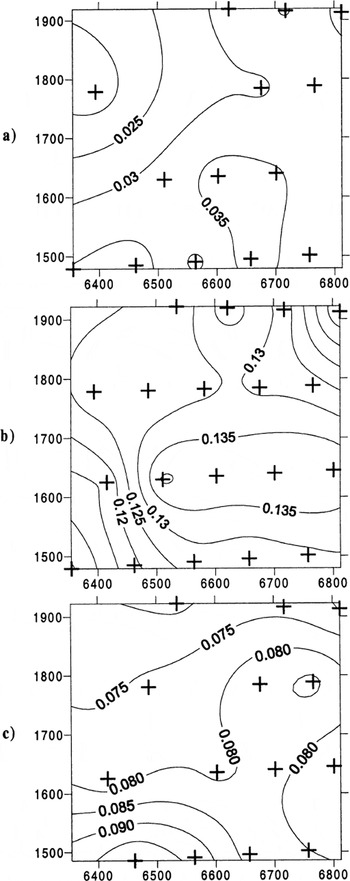
Spatial patterns of surface vertical velocities (m d−1). (a) JD169–173, (b) JD173–176, (c) JD176–180. Positions of velocity stakes marked with crosses. Positive values indicate surface uplift.
Before the spring event (JD169–173) the magnitudes and spatial pattern of surface velocity are similar to the longterm flow regime measured over the winter and during the period immediately preceding the first spring event of the year in other years. Before the event (JD169–173) and during deceleration (JD176–180), surface lowering occurred across the entire study area, with greatest lowering to the east of the glacier centre line. Surface longitudinal velocities were highest during the period JD173–176, when surface uplift occurred across most of the study area. Uplift was greatest in the southeast corner of the study area.
Analysis of Vertical Motion
Following Reference Hooke, Calla, Holmlund, Nilsson and StroevenHooke and others (1989), the vertical component of surface velocity (w s) can be expressed
where u
b is the horizontal component of the sliding velocity, β is bed slope (taken as positive when the bed slopes upward in the direction of flow), ![]() is the vertical strain rate, averaged over the ice thickness Z, and
is the vertical strain rate, averaged over the ice thickness Z, and ![]() is the rate of uplift due to cavity opening. Equation (1) simply says that the average vertical strain rate is equal to the difference in vertical velocity between the upper and lower surfaces divided by ice thickness, correcting for the component of vertical motion due to sliding on an inclined surface. β and Z have been estimated from radio-echo sounding measurements (Reference SharpSharp and others, 1993).
is the rate of uplift due to cavity opening. Equation (1) simply says that the average vertical strain rate is equal to the difference in vertical velocity between the upper and lower surfaces divided by ice thickness, correcting for the component of vertical motion due to sliding on an inclined surface. β and Z have been estimated from radio-echo sounding measurements (Reference SharpSharp and others, 1993). ![]() , u
b and
, u
b and ![]() must be considered to be unknown. Measured surface strain rates can be used to constrain
must be considered to be unknown. Measured surface strain rates can be used to constrain ![]() . However,
. However, ![]() may vary with depth in valley glaciers (Reference RaymondRaymond, 1971; Reference HarrisonHarrison, 1975; Reference Hooke, Calla, Holmlund, Nilsson and StroevenHooke and others, 1989, Reference Hooke, Pohjola, Jansson and Kohler1992). In order to determine whether cavity opening contributed to observed patterns of w
s, we investigated whether w
s could be explained solely as a product of
may vary with depth in valley glaciers (Reference RaymondRaymond, 1971; Reference HarrisonHarrison, 1975; Reference Hooke, Calla, Holmlund, Nilsson and StroevenHooke and others, 1989, Reference Hooke, Pohjola, Jansson and Kohler1992). In order to determine whether cavity opening contributed to observed patterns of w
s, we investigated whether w
s could be explained solely as a product of ![]() given plausible patterns of variation of
given plausible patterns of variation of ![]() with depth.
with depth.
In addition to spatial patterns of surface longitudinal (u
s) and vertical (w
s) velocities shown above, maps of u
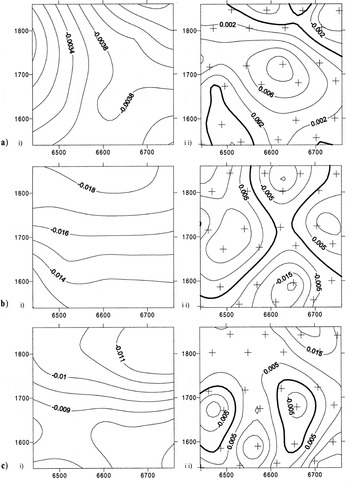
s tan β and ![]() were constructed (where
were constructed (where ![]() is the vertical strain rate measured at the glacier surface) for the periods JD169–173, JD173–176 and JD176–180 (Fig. 5) as follows. Firstly, values for β were calculated by considering the change in bed elevation between positions on the bed directly beneath stake positions and points 60 m further down-glacier, i.e. approximately half the distance between stake rows. β is everywhere negative across the study area. Values of u
s tan β were then calculated for each motion stake to estimate the maximum amount of vertical motion due to flow along an inclined bedrock surface. Values of
is the vertical strain rate measured at the glacier surface) for the periods JD169–173, JD173–176 and JD176–180 (Fig. 5) as follows. Firstly, values for β were calculated by considering the change in bed elevation between positions on the bed directly beneath stake positions and points 60 m further down-glacier, i.e. approximately half the distance between stake rows. β is everywhere negative across the study area. Values of u
s tan β were then calculated for each motion stake to estimate the maximum amount of vertical motion due to flow along an inclined bedrock surface. Values of ![]() were calculated for each strain triangle. Both sets of values were used to construct interpolated 10 m × 10 m grids using the point kriging routine of the Golden Software package “Surfer”. Grid areas and node positions were the same as used to construct the above interpolated contour plots of surface longitudinal and vertical velocities.
were calculated for each strain triangle. Both sets of values were used to construct interpolated 10 m × 10 m grids using the point kriging routine of the Golden Software package “Surfer”. Grid areas and node positions were the same as used to construct the above interpolated contour plots of surface longitudinal and vertical velocities.
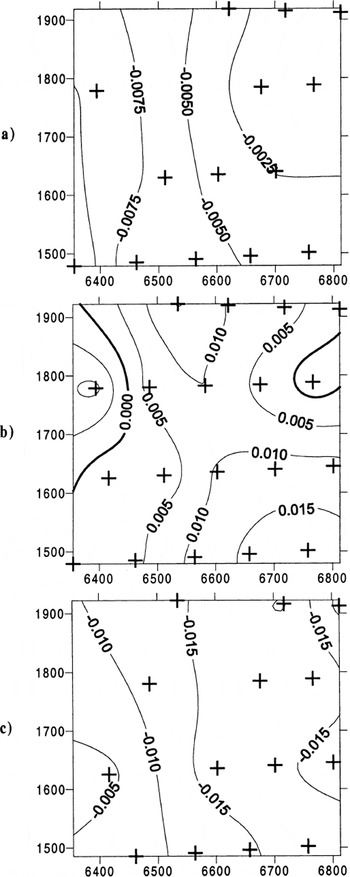
Spatial patterns of (i) us tan β and (ii) ![]() . (a) JD169–173, (b) JD173–176, (c) JD176–180. Centres of strain triangles marked with crosses in part (ii). Negative values indicate contribution to surface downward movement; positive values indicate contribution to surface uplift.
. (a) JD169–173, (b) JD173–176, (c) JD176–180. Centres of strain triangles marked with crosses in part (ii). Negative values indicate contribution to surface downward movement; positive values indicate contribution to surface uplift.
Limitations of vertical motion analysis
The greatest limitation in using Equation (1) with field data lies in deciding upon an appropriate spatial scale over which these measurements may be representative and in the uncertainties in the measured quantities. In most studies of ice dynamics, bed and surface slopes and surface velocities are averaged over spatial scales of about 10 ice thicknesses. However, the surface vertical velocity pattern during the spring event shows dramatically anomalous surface uplift concentrated over areas with a spatial scale of about one or two ice thicknesses (Fig. 4b). The coincidence of the event with a period of high meltwater input and discharge suggests that some of this uplift may be induced by hydraulic processes at the glacier bed. Previous investigations of the subglacial hydrology of the glacier have shown dramatic spatial heterogeneity in the glacier drainage system over spatial scales of about one ice thickness (Reference Hubbard, Sharp, Willis, Nielsen and SmartHubbard and others, 1995). The dilemma is that horizontal averaging of surface velocities and strain rates over large dimensions, of the order of 10 ice thicknesses, may increase our confidence in interpreting the basal flow regime from surface measurements, but that such a scale of horizontal averaging is too large to be directly associated with expected patterns of subglacial hydrological forcing. Conversely, interpreting the basal flow regime from surface measurements over the scale of expected patterns of subglacial hydrological forcing, i.e. about one ice thickness, means that measurements and interpretation are at a horizontal scale over which there is an expectation for strain rates to vary with depth. Therefore, to determine whether there is a relationship between subglacial hydrology and surface uplift, we adopt a compromise. Patterns of surface velocities within a study area with side dimensions of about five ice thicknesses are analyzed to identify areas with horizontal dimensions of one ice thickness in which basal flow anomalies are most likely to occur. Analysis over this intermediate spatial scale is theoretically justified by Reference Balise and RaymondBalise and Raymond’s (1985) model which suggested that over spatial scales of between one and five ice thicknesses, a basal vertical flow anomaly may induce a surface response with the same spatial pattern but with reduced amplitude. We then examine the extent to which strain rates are expected to vary with depth within areas of anomalous basal flow, and assess the likelihood that cavity opening at the bed contributes to the anomaly.
The spatial scale over which the bed slope, β, is averaged was chosen to be less than the spatial resolution of the stake network in case any local variation in surface velocity between stakes may have been due to a localized bed-slope anomaly. However, the down-glacier bed slope in this region of the valley is low and fairly constant over length scales an order of magnitude greater than this. Small-scale averaging of β does not change its value significantly and is therefore not considered a major limitation. Interpolated patterns of surface horizontal and vertical velocity are highly influenced by the spatial resolution of the stake network. The higher the spatial resolution, the more confident we can be of interpolated grid values. Since patterns of horizontal velocity (Fig. 3) and of surface uplift (Fig. 4) generally extend over areas larger than the distance between adjacent stakes (∼100–150 m) the spatial resolution of the stake network appears to be good enough to constrain the interpolated grid values effectively. Although strain rates are calculated on the assumption that strain is homogeneous across strain triangles with dimensions of ∼100–150 m, the grids are constructed by interpolating between the values of homogeneous strain rate located at the centre of each triangle. This interpolation therefore treats values which are really areal averages as point data. This has the effect of focusing strain-rate values around specific points even though each value is calculated from the relative displacement of three points distributed over a much larger area. However, this problem will be reduced by the relatively high density of strain-rate measurements within the stake network. The surface expression of the basal velocity anomaly may be spread over a larger area than the basal anomaly due to the attenuation of vertical velocities between the bed and the surface over short length scales, i.e. of the order of one ice thickness (Reference Balise and RaymondBalise and Raymond, 1985). Thus basal cavity opening may be concentrated in only a part of the areas identified by the following analysis. However, this effect may be partly cancelled out by the effect of interpolating strain rates between the centre points of strain triangles as discussed above. Given these limitations, the following quantitative analysis can at best qualitatively identify areas where subglacial cavity enlargement was most likely to be within a spatial scale of about one ice thickness.
Using strain rates to constrain identification of most likely areas of subglacial cavity opening
Again, following Reference Hooke, Calla, Holmlund, Nilsson and StroevenHooke and others (1989), if ![]() and u
b are both 0,
and u
b are both 0, ![]() . If
. If ![]() and u
b = u
s,
and u
b = u
s, ![]() . Thus, in the absence of cavity opening, and assuming that 0 ≤ u
b ≤ u
s (i.e. excluding the possibility of extrusive flow), w
s and w
s − u
s tan β represent limiting values of
. Thus, in the absence of cavity opening, and assuming that 0 ≤ u
b ≤ u
s (i.e. excluding the possibility of extrusive flow), w
s and w
s − u
s tan β represent limiting values of ![]() . Furthermore, if
. Furthermore, if ![]() were independent of depth,
were independent of depth, ![]() would equal
would equal ![]() . Thus when
. Thus when ![]() does not lie between the limiting values for
does not lie between the limiting values for ![]() , it is likely that
, it is likely that ![]() is varying with depth.
is varying with depth.
For ease of interpretation we can categorize the relationships between w
s, u
s tan β and ![]() as follows. If
as follows. If ![]() lies between w
s and w
s − u
s tan β then it is possible that all surface vertical velocity could be due to vertical strain and basal sliding without any cavity opening or enlargement. We call this category 1 (Cat.1). If
lies between w
s and w
s − u
s tan β then it is possible that all surface vertical velocity could be due to vertical strain and basal sliding without any cavity opening or enlargement. We call this category 1 (Cat.1). If ![]() is higher than w
s − u
s tan β then w
s could only be due to vertical strain and basal sliding without cavity opening if strain rates decrease (i.e. more vertical compression) with depth. We call this category 2 (Cat.2). If
is higher than w
s − u
s tan β then w
s could only be due to vertical strain and basal sliding without cavity opening if strain rates decrease (i.e. more vertical compression) with depth. We call this category 2 (Cat.2). If ![]() is lower than w
s then surface velocity could only be due to vertical strain, basal sliding and no cavity opening if strain rates increase (i.e. more vertical extension) with depth. We call this category 3 (Cat.3). For each of the time periods, before the event (JD169–173), during widespread surface uplift (JD173–176) and during widespread surface lowering (JD176–180), the study area can be divided according to these categories (Fig. 6).
is lower than w
s then surface velocity could only be due to vertical strain, basal sliding and no cavity opening if strain rates increase (i.e. more vertical extension) with depth. We call this category 3 (Cat.3). For each of the time periods, before the event (JD169–173), during widespread surface uplift (JD173–176) and during widespread surface lowering (JD176–180), the study area can be divided according to these categories (Fig. 6).
Spatial categorization of the relationships between ws, us tan β and ![]() . (a) JD169–173, (b) JD173–176, (c) JD176–180. Definition of each category is explained in the text. Differences (mc−1) between
. (a) JD169–173, (b) JD173–176, (c) JD176–180. Definition of each category is explained in the text. Differences (mc−1) between ![]() and ws − us tan β are overlain where Cat.2 is most prevalent (a,c). Differences (m d−1) between
and ws − us tan β are overlain where Cat.2 is most prevalent (a,c). Differences (m d−1) between ![]() and ws are overlain where Cat.3 is most prevalent (b). Location of supraglacial stream-fed moulins (i.e.“active”moulins) marked.
and ws are overlain where Cat.3 is most prevalent (b). Location of supraglacial stream-fed moulins (i.e.“active”moulins) marked.
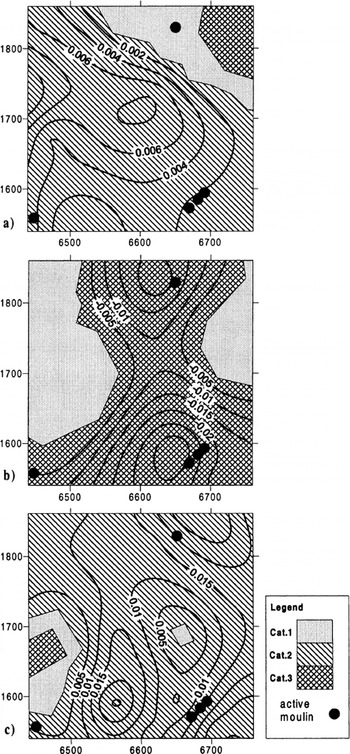
If cavity opening occurred, it is most likely to have done so during the initial stages of the spring event (JD 173–176) within the Cat.3 area. At this time, ![]() was most strongly negative whilst w
s was most strongly positive over much of the study area (cf. Figs 4b and 5b(ii)). For this time period, the differences between
was most strongly negative whilst w
s was most strongly positive over much of the study area (cf. Figs 4b and 5b(ii)). For this time period, the differences between ![]() and w
s are overlain on the Cat.3 region (Fig. 6b). The more negative these differences are, the greater the increase in strain rates with depth must be if no cavity opening occurs. Reference Hooke, Calla, Holmlund, Nilsson and StroevenHooke and others (1989) suggested that where their results showed a value of
and w
s are overlain on the Cat.3 region (Fig. 6b). The more negative these differences are, the greater the increase in strain rates with depth must be if no cavity opening occurs. Reference Hooke, Calla, Holmlund, Nilsson and StroevenHooke and others (1989) suggested that where their results showed a value of ![]() that was ∼0.003 m d−1 less than w
s then this may be interpreted as indicating that
that was ∼0.003 m d−1 less than w
s then this may be interpreted as indicating that ![]() was positive. Ice thickness at the study location on Storglaciären, Sweden, was similar to the maximum ice thickness in our study area. At Haut Glacier d’Arolla, differences between
was positive. Ice thickness at the study location on Storglaciären, Sweden, was similar to the maximum ice thickness in our study area. At Haut Glacier d’Arolla, differences between ![]() and w
s are >0.003 m d−1 across almost the entire Cat.3 area during the period JD173–176. The biggest difference measured is >0.03 m d−1, an order of magnitude greater than at Storglaciären.
and w
s are >0.003 m d−1 across almost the entire Cat.3 area during the period JD173–176. The biggest difference measured is >0.03 m d−1, an order of magnitude greater than at Storglaciären.
Identification of Cat.3 areas will be affected by errors in measurements to ![]() and w
s. Estimates of sources of error are presented for the period JD173–176, i.e. the time of the highest surface uplift (Table 1: note that the values of the errors differ from Reference Mair, Nienow, Willis and SharpMair and others (2001), since this earlier paper discussed errors from the whole melt season whilst in this paper we quote errors from a specific short time period during the spring event; this whole analysis of vertical motion was carried out partly because vertical velocity errors were lower than average during the spring event). The total measurement error quoted in Table 1 assumes that all the sources of measurement error are cumulative. Since this is unlikely, the value of 0.016 m d−1 is probably a high estimate for the measurement error. If the measurement error in Table 1 acted only to reduce the differences between
and w
s. Estimates of sources of error are presented for the period JD173–176, i.e. the time of the highest surface uplift (Table 1: note that the values of the errors differ from Reference Mair, Nienow, Willis and SharpMair and others (2001), since this earlier paper discussed errors from the whole melt season whilst in this paper we quote errors from a specific short time period during the spring event; this whole analysis of vertical motion was carried out partly because vertical velocity errors were lower than average during the spring event). The total measurement error quoted in Table 1 assumes that all the sources of measurement error are cumulative. Since this is unlikely, the value of 0.016 m d−1 is probably a high estimate for the measurement error. If the measurement error in Table 1 acted only to reduce the differences between ![]() and w
s uniformly across the Cat.3 area shown in Figure 6b, which is highly unlikely, then
and w
s uniformly across the Cat.3 area shown in Figure 6b, which is highly unlikely, then ![]() would still be less than w
s over a large area in the southeast of the study area (reducing the maximum difference to 0.016 m d−1) and over a significant area further down-glacier and towards the glacier centre (reducing the difference here to 0.008 m d−1).
would still be less than w
s over a large area in the southeast of the study area (reducing the maximum difference to 0.016 m d−1) and over a significant area further down-glacier and towards the glacier centre (reducing the difference here to 0.008 m d−1).
Estimation of errors in terms affecting the identification of areas of cavity opening or enlargement, ![]() , JD173–176
, JD173–176
Since vertical strain-rate gradients are likely to express themselves as similar to horizontal gradients, horizontal gradients in ![]() can be used to help constrain vertical variations in
can be used to help constrain vertical variations in ![]() . During the period JD173–176, in the southeast area of the stake network,
. During the period JD173–176, in the southeast area of the stake network, ![]() and Z = 130 m, giving
and Z = 130 m, giving ![]() (Fig. 5b(ii)). Horizontal gradients in
(Fig. 5b(ii)). Horizontal gradients in ![]() were greatest at this time, reaching a maximum of ∼0.00035 a−1 m−1. If
were greatest at this time, reaching a maximum of ∼0.00035 a−1 m−1. If ![]() increased linearly with depth at this rate then
increased linearly with depth at this rate then ![]() . If
. If ![]() increased linearly to reach zero at the bed (with a depth gradient of ∼0.00049 a−1 m−1), then
increased linearly to reach zero at the bed (with a depth gradient of ∼0.00049 a−1 m−1), then ![]() . In addition to the errors above, such increases in
. In addition to the errors above, such increases in ![]() with depth could reduce the differences within Cat.3 areas in Figure 6b by a further 0.008 or 0.0112 m d−1, respectively. Even an unlikely combination of maximum error and these high depth gradients would leave differences of >0.003 m d−1 in this southeast region. To completely account for the difference between
with depth could reduce the differences within Cat.3 areas in Figure 6b by a further 0.008 or 0.0112 m d−1, respectively. Even an unlikely combination of maximum error and these high depth gradients would leave differences of >0.003 m d−1 in this southeast region. To completely account for the difference between ![]() and w
s in this area,
and w
s in this area, ![]() must increase with a depth gradient of at least 0.00166 a−1 m−1, i.e. almost five times greater than the highest measured horizontal strain-rate gradient. Furthermore, these drastic measurement-error and strain-rate corrections are required simply to bring the value for
must increase with a depth gradient of at least 0.00166 a−1 m−1, i.e. almost five times greater than the highest measured horizontal strain-rate gradient. Furthermore, these drastic measurement-error and strain-rate corrections are required simply to bring the value for ![]() up to its lower limiting value which assumes no basal sliding. Since surface velocities during this time period are 400–500% higher than annual average surface motion (Fig. 3b), this assumption is very unlikely. It seems more likely that cavity opening or enlargement did occur within a broad axis of the study area, centred along ∼6650E, during the period JD173–176. By similar analysis, it is likely that similarly high positive differences between
up to its lower limiting value which assumes no basal sliding. Since surface velocities during this time period are 400–500% higher than annual average surface motion (Fig. 3b), this assumption is very unlikely. It seems more likely that cavity opening or enlargement did occur within a broad axis of the study area, centred along ∼6650E, during the period JD173–176. By similar analysis, it is likely that similarly high positive differences between ![]() and w
s − u
s tan β, evident within Cat.2 regions during the period of surface lowering (JD176–180) (i.e. ∼0.02–0.03 m d−1, Fig. 6c), are at least in part caused by cavity closure. This analysis strongly suggests that cavity opening or enlargement is widespread during the spring event and that the surface uplift cannot simply be explained as a consequence of measurement errors or by depth variation of vertical strain rates. The possible spatial patterns of cavity enlargement (and closure) are now discussed in more detail.
and w
s − u
s tan β, evident within Cat.2 regions during the period of surface lowering (JD176–180) (i.e. ∼0.02–0.03 m d−1, Fig. 6c), are at least in part caused by cavity closure. This analysis strongly suggests that cavity opening or enlargement is widespread during the spring event and that the surface uplift cannot simply be explained as a consequence of measurement errors or by depth variation of vertical strain rates. The possible spatial patterns of cavity enlargement (and closure) are now discussed in more detail.
Discussion
Relationship between spatial pattern of cavity opening and subglacial drainage-system configuration
The conclusion of the above analysis is further strengthened by the fact that, during the period of surface uplift (JD173–176), the differences between ![]() and w
s are highest in those areas located immediately down-glacier of clusters of active moulins (cf. Figs 1 and 6b). Very high subglacial water pressures, capable of promoting widespread bed separation, would be expected in these areas where increasing surface meltwater discharges are conveyed rapidly to the subglacial drainage system. More detailed analysis of the potential spatial patterns of cavity opening and closure identifies further evidence for a relationship with subglacial drainage-system configuration.
and w
s are highest in those areas located immediately down-glacier of clusters of active moulins (cf. Figs 1 and 6b). Very high subglacial water pressures, capable of promoting widespread bed separation, would be expected in these areas where increasing surface meltwater discharges are conveyed rapidly to the subglacial drainage system. More detailed analysis of the potential spatial patterns of cavity opening and closure identifies further evidence for a relationship with subglacial drainage-system configuration.
Areas where cavity closure is most likely during surface lowering (i.e. areas of largest differences in Fig. 6c) are located adjacent to areas where cavity opening is most likely during surface uplift (i.e. areas of largest differences in Fig. 6b). The fact that the areas of greatest opening and greatest closure are not coincident indicates that by the end of the spring event, on JD180, areas of the bed may have existed where cavities remained open, i.e. where net cavity enlargement had occurred. Areas of most likely net cavity enlargement can be identified by integrating the magnitude of the differences between ![]() and w
s − u
s tan β over the period JD176–180, then subtracting this from the time-integrated differences between
and w
s − u
s tan β over the period JD176–180, then subtracting this from the time-integrated differences between ![]() and w
s for the period JD173–176. Net cavity enlargement may have occurred within areas where the residual at the end of the spring event is positive (Fig. 7). There is a strong association between the spatial pattern of positive values and the location of the eastern PDA predicted from the map of the up-glacier contributing area on the subglacial hydraulic potential surface. The locations of areas of most likely net cavity enlargement also lie close to the VPAs that have been identified from borehole water-level measurements (Reference Hubbard, Sharp, Willis, Nielsen and SmartHubbard and others, 1995; Gordon, 1996). The similarities between these completely independently derived datasets add further support to the idea that subglacial cavities were enlarged by high subglacial water pressures during the spring event.
and w
s for the period JD173–176. Net cavity enlargement may have occurred within areas where the residual at the end of the spring event is positive (Fig. 7). There is a strong association between the spatial pattern of positive values and the location of the eastern PDA predicted from the map of the up-glacier contributing area on the subglacial hydraulic potential surface. The locations of areas of most likely net cavity enlargement also lie close to the VPAs that have been identified from borehole water-level measurements (Reference Hubbard, Sharp, Willis, Nielsen and SmartHubbard and others, 1995; Gordon, 1996). The similarities between these completely independently derived datasets add further support to the idea that subglacial cavities were enlarged by high subglacial water pressures during the spring event.
Identification of areas of most likely net cavity enlargement. The magnitude of the differences between ![]() and ws − us tan β during surface lowering, JD176–180, are integrated through time and subtracted from the time-integrated differences between
and ws − us tan β during surface lowering, JD176–180, are integrated through time and subtracted from the time-integrated differences between ![]() and w
s
during surface uplift, JD173–176. Areas where the residual (measured in m) is positive will be those most likely to have experienced net cavity enlargement by the end of the spring event. Location of the eastern PDA is marked with dashed lines.
and w
s
during surface uplift, JD173–176. Areas where the residual (measured in m) is positive will be those most likely to have experienced net cavity enlargement by the end of the spring event. Location of the eastern PDA is marked with dashed lines.

Relationship between subglacial equipotentials, net cavity enlargement and evolution of channelized drainage?
It appears that during the spring event supraglacial water accessed the bed of the glacier via moulins and was forced by hydraulic gradients to flow across those areas of the bed predicted by the mapping of subglacial equipotentials. Most of the water flowed along the eastern PDA. Large increases in water input to a distributed system may have led to very high subglacial water pressures. These in turn may have promoted bed separation and the enlargement of basal cavities as the glacier sole was displaced vertically upwards and rapidly down-glacier by hydraulic jacking. Net cavity enlargement would have increased the hydraulic efficiency of subglacial drainage along these axes after the spring event. Water would therefore subsequently have drained at lower pressures along these axes than elsewhere, causing an increase in the hydraulic gradient forcing water towards these axes from adjacent areas of the glacier bed. A greater proportion of subglacial discharge may therefore have drained along the axes created by the cavity enlargement. Thus the vertical and horizontal movement of the base of the glacier during the spring event, causing axes of enlarged basal cavities, may have created a positive feedback whereby greater discharges were subsequently able to drain along these axes.
Later in the melt season, removal of the surface snow-pack results in increases in the magnitude and amplitude of diurnal discharge cycles entering the moulins (Reference Nienow, Sharp and WillisNienow and others, 1998). Higher discharges will increase the size of the cavities further and enlarge drainage pathways between cavities by frictional melting (Reference KambKamb, 1987). It is likely that the drainage system will develop so that water flows through a network of small channels located within the broad axis of net cavity enlargement. Larger channels within the axis will capture water from smaller ones, causing drainage to eventually be concentrated in a main channel concentrated in a relatively small area of the bed (Reference RöthlisbergerRöthlisberger, 1972). This mechanism for generating a zone of concentrated flow may solve the problem of having to assume an initial channel when trying to model channel evolution over a melt season.
Many previous field and theoretical studies indicate that cavity enlargement during periods of high subglacial water pressure and enhanced basal motion plays a crucial role in the subsequent development of more efficient, low-pressure subglacial drainage. Reference KambKamb (1987) developed a theoretical model to show that if water-pressure perturbations within linked-cavity drainage systems are high enough and sustained for long enough, linked cavities may evolve rapidly by frictional melting into large channels. This theory has support from field evidence. Rapid increases in subglacial discharge during early-melt-season rainstorms have been suggested to play a key role in initiating the opening of subglacial channels (Reference Hock and HookeHock and Hooke, 1993; Reference Gordon, Sharp, Hubbard, Smart, Ketterling and WillisGordon and others, 1998; Reference Nienow, Sharp and WillisNienow and others, 1998). Such early-melt-season high subglacial discharge events have been frequently associated with short-term glacier speed-up events (Reference Röthlisberger, Lang, Gurnell and ClarkRöthlisberger and Lang, 1987). Reference Raymond, Benedict, Harrison, Echelmeyer and SturmRaymond and others (1995) found that at both a surge-type glacier (Black Rapids Glacier, Alaska, U.S.A.) and a non-surge-type glacier (Fels Glacier, Alaska) spring events signalled a rapid evolution of the subglacial drainage system. Changes in mean water and sediment discharges indicated the enlargement of existing, and the opening up of new, drainage pathways (Reference Raymond, Benedict, Harrison, Echelmeyer and SturmRaymond and others, 1995). Our results add strong support to these suggestions. We demonstrate that it may be possible to actually determine the locations of cavity growth and that these locations are coincident with areas in which channelized drainage is shown to exist later in the melt season.
Reference KambKamb (1987) considered that the enlargement of highly pressurized orifices connecting subglacial cavities was dominated by the mechanism of frictional heating rather than by bed separation. However, as cavities grow larger during the spring, they may start to link up, with the result that orifices no longer provide the main means of connection. Cavity enlargement, due to the vertical and horizontal movement of the glacier sole, may enable the drainage system to accommodate the large discharges required for the eventual development of subglacial channels without requiring such high water pressures as envisaged by Kamb’s model. Hence separation, rather than melting, is the key to rapid drainage development.
Conclusions
To summarize, the above results and analyses suggest that:
the onset of the first spring event of the 1994 summer was characterized by the opening and/or enlargement of cavities between the glacier and its bed;
the areas with the highest rates of cavity opening corresponded with areas immediately down-glacier of clusters of moulins;
the areas of potential net cavity enlargement correspond closely with the previously predicted eastern PDA and the previously measured VPA.
The displacement of the glacier sole during the spring events may be a crucial factor contributing to the conditions necessary for the rapid development of a channelized drainage system. The correspondence between likely areas of cavity opening and the previously identified location of subglacial drainage axes (Reference SharpSharp and others, 1993; Reference Hubbard, Sharp, Willis, Nielsen and SmartHubbard and others, 1995) suggests that glacier motion is not simply a passive response to hydrology, but that it is an active factor in determining the spatial configuration and the rate of evolution of subglacial drainage-system morphology.
Acknowledgements
Our work was supported by U.K. Natural Environment Research Council (NERC) Studentship GT4/93/6/P and NERC grant GR3/8114. D.M. gratefully acknowledges the support of the Leverhulme Trust. Fieldwork was carried out with much help from P. Nienow, B. Hubbard and M. Nielsen. We thank Grande Dixence SA, Y. Bams, V. Anzevui and P. and B. Bournissen for logistical support. The comments of H. Gudmundsson, R. Naruse and an anonymous reviewer helped improve this paper substantially.


