

1. Introduction
The term engineering for sustainable development describes how engineering contributes to the 17 UN Sustainable Development Goals and any combination of economic, environmental, or social priorities (Reference Nair-BedouelleNair-Bedouelle, 2021; Reference Burleson, Lajoie, Mabey, Sours, Ventrella, Peiffer, Stine, Stettler Kleine, MacDonald, Austin-Breneman, Javernick-Will, Winter, Lucena, Knight, Daniel, Thomas, Mattson and ArandaBurleson et al., 2023). Engineered products and systems have social impacts, which are effects on the day-to-day lives of people (Reference BurdgeBurdge, 2015). One way the engineering design community has responded to this is by focusing more on sustainability the past several years (Reference Bhamra and HernandezBhamra and Hernandez, 2021). This focus has produced methods for sustainable product development (Reference Stark, Buchert, Neugebauer, Bonvoisin and FinkbeinerStark et al., 2017; Reference Faludi, Yiu and AgoginoFaludi et al., 2020), and for socio-technical systems analysis (Reference Clegg, Robinson, Davis, Bolton, Pieniazek and McKayClegg et al., 2017). Some examples include social life cycle analysis (Reference Benoît Norris, Traverzo, Neugebauer, Ekener, Schaubroeck and Russo GarridoBenoît Norris et al., 2020), circular economy assessments (Reference Ruiz-Pastor, Altavilla and BorgianniRuiz-Pastor et al., 2024), and machine learning models for sustainability (Reference Bertoni, Hallstedt, Dasari and AnderssonBertoni et al., 2020).
One area of focus in engineering for sustainable development is the application of optimization methods. Optimization for sustainable development can become quite complex, given the uncertainties and dynamic behavior of socio-technical systems (Reference Riondet, Rio, Perrot Bernardet and ZwolinskiRiondet et al., 2024). However, numerical optimization is valuable to the design process because it enables the deep exploration and study of economic, environmental and social impacts, and the tradeoffs between them (Reference Mabey, Dickerson, Salmon and MattsonMabey et al., 2023). An optimization study without a meaningful social benefit function cannot fully explore those tradeoffs (Reference Barlow, Biddanda, Mendke, Miyingo, Sicko, Papalambros, Chien and O’NealBarlow et al., 2021). Therefore, incorporating social impact objective functions is necessary to understand community impacts (Reference Rajski and PapalambrosRajski and Papalambros, 2021). Several objective functions for social impact are described in the literature, including for product development (Reference Stevenson, Mattson, Salmon and HatchStevenson et al., 2024) and systems design (Reference Richards, Stevenson, Mattson and SalmonRichards et al., 2023).
Although social impact optimization has advanced, there are no objective functions that calculate how social impacts spread from technologies to users and nonusers. In this paper, we describe how objective functions with social impact diffusion (Reference McKinnon, White, Mattson and SalmonMcKinnon et al., 2024) fill this gap. There are two advantages to using social impact diffusion in an objective function:
1) Social impact diffusion can represent primary users, secondary users, and nonusers of a technology, and how social impacts spread between them. This calculation happens at a node- by-node level, which allows for a more granular examination of social impact across individuals. Many other objective functions only consider social impacts at an aggregate stakeholder level.
2) Social impact diffusion provides a deterministic calculation for a technology’s social impact on society. This is fundamentally different from many other social impact models which are stochastic. While useful, stochastic models require several analyses and a distribution of results before final conclusions can be made. This is a barrier to using stochastic social impact models in optimization practice.
In this paper, we describe a new social impact objective function and illustrate how it can aid systems and engineering design. First, we summarize key aspects of social impact diffusion. Then, we set up an optimization problem, using social impact diffusion to create an objective function. Next, we use the problem setup to optimize the design of a water pump system in a theoretical rural community. We conclude with a discussion on current limitations and the notable findings from this study.
2. Graph-Based Social Impact Diffusion
Previously, we have introduced graph-based social impact diffusion, a theory to predict or estimate the social impact that technologies, such as engineered products, may have on society (Reference McKinnon, White, Mattson and SalmonMcKinnon et al., 2024). Graph-based social impact diffusion represents a socio-technical system as a graph. Socio- technical systems are systems whose performance cannot be maximized without considering its social and technical elements (Reference Walker, Stanton, Salmon and JenkinsWalker et al., 2008). Representing socio-technical systems as graphs is common to the design sciences (Reference Xiao and ShaXiao and Sha, 2022; Reference Wang, Sha, Huang, Contractor, Fu and ChenWang et al., 2018). There are two types of nodes in graphs for social impact diffusion: technical nodes, representing technologies, and social nodes, representing primary users, secondary users, or nonusers. Finally, there are edges that connect the nodes, which represent the following:
1) An edge between a social node and a technical node in the network, or a type one edge, represents someone who uses a technology in the network. These are primary users.
2) An edge between two social nodes, or a type two edge, represents a human relationship in the network as it is relevant to the technology. Social nodes that are influenced by, but not directly connected to, a technology are considered secondary users.
Technical nodes offer benefit to social nodes. Benefit is the “advantage or value that a product affords social nodes” (Reference McKinnon, White, Mattson and SalmonMcKinnon et al., 2024). Every social node has a benefit state. This benefit state is a measure of a social node’s well-being relative to a social impact being studied. Benefit can diffuse—or flow—from technical nodes, along edges, to other social nodes in the network. Benefit flow is the diffusion or propagation of benefit across socio-technical networks. Benefit flows from technologies to social nodes, and from social nodes to each other, along edges.
For example, Figure 1 represents a socio-technical network of water fetchers in a theoretical rural community (this network is also the basis of the illustration in Section 4). Water fetchers in this community acquire water for their household. Each water source is a technical node, represented with a square, and each person is a social node, represented with a circle. Some technical nodes offer more benefit than others. The lighter, yellow square represents a water hand pump. This pump decreases a person’s risk of acquiring a diarrheal disease, which is a health benefit (Reference Wolf, Johnston, Ambelu, Arnold, Bain, Brauer, Brown, Caruso, Clasen and ColfordWolf et al., 2023). The darker, purple square is an unimproved water source, and does not lower someone’s risk of acquiring a diarrheal disease. Type one edges connect the water sources with water fetchers (Reference Daly, Lowe, Hornsby and HarrisDaly et al., 2021). Type two edges connect water fetchers with their household members. Health benefit flows from the pump to people in the network. A water fetcher’s preference (Reference Smiley and StolerSmiley and Stoler, 2020) toward using the pump determines how much benefit they and their household receive.
A socio-technical graph for impact diffusion. A health benefit is flowing from the water hand pump to people in the network.Footnote 1

Benefit state and benefit flow, as modeled in social impact diffusion, are similar in some ways to temperature and heat flux, as modeled in heat transfer analysis. Just as there are physical properties that describe a material’s conductivity to heat flux, there are analogous properties that describe benefit diffusion in socio-technical systems. Spectral graph theory has been demonstrated to accurately model heat flux and calculate the temperatures in a solid object by representing the object with a graph (Reference Cole, Riensche and RaoCole et al., 2022). Similarly, spectral graph theory can calculate benefit diffusion and benefit states in socio-technical systems (Reference McKinnon, White, Mattson and SalmonMcKinnon et al., 2024). Socio-technical parameters in these types of systems include:
1) Willingness, W, to accept a technology.
2) Resources, R, to accept a technology.
3) Awareness, A, of a technology.
4) Availability, V, of a technology.
5) Benefit state, Bi , of the ith node.
These parameters are used to calculate edge weights, which quantify the strength of a connection between two nodes. In this paper, the edge weight between any two nodes i and j is calculated as the following:
 $$e_{ij} = W_{ij} R_{ij} A_{ij} V_{ij} $$
The edge weights for every edge in the graph are stored in a weighted adjacency matrix W. Flow between nodes in the network is represented with a Laplacian matrix L. Spectral graph theory uses these matrices to solve diffusion problems in networks (Reference Timilsina, Figueroa, d’Aquin and YangTimilsina et al., 2021). The benefit state of each node can be calculated with the following equation from Reference McKinnon, White, Mattson and SalmonMcKinnon et al. (2024):
 $$B_S (t) = L_{SS}^{-1} W_{ST} \beta_T + e^{-tL_{SS} } C$$
The array Bs
(t) contains the benefit states of every social node in the graph. Matrix Lss
is a subset of the Laplacian matrix L that exclusively pertains to edges between social nodes (type two edges). Matrix WST
is a subset of the adjacency matrix W that exclusively pertains to edges between social and technical nodes (type one edges). Array β
T
contains how much benefit every technical node in the network offers. The term t is time, or how long the technical nodes have diffused benefit to social nodes. The constant is calculated as $C = B_S (0)\gt -L_{SS}^{ - 1} \gt W_{ST} \beta _T $
, as suggested by Reference Timilsina, Figueroa, d’Aquin and YangTimilsina et al. (2021).
$C = B_S (0)\gt -L_{SS}^{ - 1} \gt W_{ST} \beta _T $
, as suggested by Reference Timilsina, Figueroa, d’Aquin and YangTimilsina et al. (2021).
When reality can be represented in a socio-technical network as described above, then a meaningful calculation for social impact can be calculated for each social node in the network. This deterministic model allows decision makers to explore the design space and understand the relationship between design variables and nodal and global-level social impact. An important advantage of this social impact diffusion model is its deterministic nature, which can enable a variety of optimization methods. The next section of this paper presents an optimization problem formulation for the design of products or systems with highly desirable social impacts.
3. Optimization Problem Formulation
In social impact modeling, a decision maker may intend for an engineered product or system to raise social nodes to a specific target benefit state. The mean and variance of benefits states across the social nodes in the network can be calculated to assess how well the impact goals are being met. The optimizer will drive the mean benefit state to this target, while also minimizing the variance. Minimizing the variance ensures that impacts are less stratified.
3.1. Optimization Formulation
We define an objective function that minimizes the difference between the mean benefit state and the target benefit state, while also minimizing variance:
 $$\qquad\qquad\qquad\matrix{{\matrix{{\min } \cr x \cr } J(x)\gt = \sqrt {(B_\tau -\mathop{ B}\limits^{-})^2 + \sigma ^2 } } \hfill \cr {subject\ to \ \bar{B} = {1 \over {n_s }}\mathop \sum \limits_{i = 1}^{n_s } B_i } \hfill \cr {\sigma ^2 = {1 \over {n_s }}\mathop \sum \limits_{i = 1}^{n_s } (B_i - \mathop{ B}\limits^{-})} \hfill \cr {g_k (x) \le 0\quad \forall k \in \{ 1,2, \ldots ,n_k \} } \hfill \cr {h_m (x) = 0\quad\forall m \in \{ 1,2, \ldots ,n_m \} } \hfill \cr {x_{l_j } \le x_j \le x_{u_j } \quad\forall j \in \{ 1,2, \ldots ,n_j \} } \hfill \cr} $$
The term Bi
is the benefit state of the i-th social node in the network; this is computed using Eq. 2. Variable $B$
is the average benefit state of the social nodes in the network. Variable Bτ
is the target benefit state, or the benefit state goal for each social node. The term ns
is the number of social nodes in the network. The k-th inequality constraint and m-th equality constraint are represented by gk
and hm
, with nk
number of inequality constraints and nm
number of equality constraints. Term xj
is the j-th design variable, and x
l
j and xu
j are the lower and upper bounds on the j-th design variable, respectively. There are nj
number of design variables.
$B$
is the average benefit state of the social nodes in the network. Variable Bτ
is the target benefit state, or the benefit state goal for each social node. The term ns
is the number of social nodes in the network. The k-th inequality constraint and m-th equality constraint are represented by gk
and hm
, with nk
number of inequality constraints and nm
number of equality constraints. Term xj
is the j-th design variable, and x
l
j and xu
j are the lower and upper bounds on the j-th design variable, respectively. There are nj
number of design variables.
3.2. Setting Up the Problem
The following guidelines describe how to set up an optimization problem with impact diffusion:
1) Identify the technologies and population of interest.
2) Identify the social impact of interest.
3) Select indicators for the social impact (Reference Stevenson, Mattson, Bryden and MacCartyStevenson et al., 2018).
4) Identify design variables of the technology that influence the social impact indicators.
5) Create mathematical expressions of the relationship between the technology’s design variables and the social impact indicators, using the parameters described in Section 2. These expressions will be used to calculate the edge weights.
6) Create a socio-technical graph (i.e., calculate the edge weights, adjacency matrix, and Laplacian matrix for the graph).
7) Identify social and technical constraints for the system.
8) Solve the optimization problem described in Section 3.1, using Equations 2 and 3.
Following these steps is demanding, but possible. The modeler should recognize that many socio- technical models are lower fidelity than other areas of engineering, but they still yield useful insight in design space exploration and analysis. Data for these models can be acquired from archival literature and public databases such as those run by governments or NGOs.
4. Illustration
This section demonstrates how the social impact of a socio-technical system can be improved using the optimization formulation provided in Section 3.1. We build upon an illustration from Reference McKinnon, White, Mattson and SalmonMcKinnon et al. (2024), which explores the social impact of installing improved water sources in a theoretical rural community.
Suppose that a community of approximately 3000 people desires to install water hand pumps in their community. This community is modeled as a socio-technical network where water fetchers collect water for their households. Water fetchers and their household members are represented as social nodes. Water sources in the network are represented as technical nodes. There are improved water sources, such as hand pumps, which if used can decrease someone’s risk of diarrheal disease by 19–52% (Reference Wolf, Johnston, Ambelu, Arnold, Bain, Brauer, Brown, Caruso, Clasen and ColfordWolf et al., 2023). However, there is still an incentive to use unimproved water—e.g., it may be more convenient to visit a close by unimproved water source than a farther improved water source (Reference Smiley and StolerSmiley and Stoler, 2020).
Benefit in this network is a reduced risk of acquiring a diarrheal disease. Improved water sources offer a benefit of one (meaning that an individual receives the fullest risk reduction possible), while unimproved water sources offer no benefit (an individual does not recieve any risk reduction). An individual’s benefit state will depend on their willingness or preference to drink improved or unimproved water. Willingness is calculated with data on water source preference from Reference Smiley and StolerSmiley and Stoler (2020).
Our previous paper showed that the design of the water pump system was significant, and that the placement of the pumps in the network had effects on the mean and variance of benefit states. This illustration uses the optimization formulation described in Equation 3 to find optimal installation locations for the improved water sources. The target benefit state is set to one, which means the goal is for individuals to receive as much health benefit as possible. The optimizer will vary the x and y coordinates of each improved water source in search of optimal social impact. Using the model laid out in Equations 1 and 2, we will compare three different water pump layouts:
1) A random layout, where pump location coordinates are assigned by a random number generator.
2) A best guess layout, where pump location coordinates are assigned given a user’s best guess as to where the pumps should be placed.
3) An optimized layout, where the best guess is given as a starting point, and the optimizer calculates new locations.
This illustration uses the limited-memory Broyden-Fletcher-Goldfarb-Shanno algorithm from python scipy.optimize.minimize to call the objective function (Reference Byrd, Lu, Nocedal and ZhuByrd et al., 1995).
4.1. Optimization Results
The calculated benefit states and their distributions are shown in Figure 2. The subplots on the left are bird’s eye views of the community. Each circular node represents one person (a social node), and square nodes represent water sources (technical nodes). The color of the node correlates to the benefit state of a social node, or to how much benefit a technology offers. Each household has one water fetcher. Each water fetcher has access to every water source in the network, although their willingness to use different water sources will vary (Reference Daly, Lowe, Hornsby and HarrisDaly et al., 2021; Reference Smiley and StolerSmiley and Stoler, 2020). Edges, represented by the gray lines, connect water fetchers with every water source in the network, and every water fetcher with the members of their household. The location of each household was randomly assigned with a higher proportion of households assigned to be in the community center. Subplots (a) and (b) show the results of the random pump layout, subplots (c) and (d) show the best guess placement, and subplots (e) and (f) show the optimized results. The results in subplots (e) and (f) were obtained by passing in the best guess placement as an initial start to the optimizer, and the optimizer was run until it was terminated several hours later.
The results indicate that the best guess and optimized placements have a greater social impact than a random placement. The random pump placement has the lowest mean benefit state of the three pump layouts. While the random pump placement has a smaller standard deviation than the best guess placement (subplots (b) and (d)), the optimized placement has a smaller standard deviation than the random placement (subplots (b) and (f)).
Random, best guess, and optimized placements for a pump. Node color indicates benefit state. Squares represent water sources and circles represent people

The optimizer minimizes the function J(x) described in Equation 3

Furthermore, the optimized placement has the greatest mean benefit state, and the smallest standard deviation, of the three placements. There is a 19.6% increase in mean benefit state from the random pump placement to the best guess pump placement (subplots (b) and (d)), and a 26.4% increase in mean benefit state from the random pump placement to the optimized pump placement (subplots (b) and (f)). The optimized placement also increases the best guess placement mean benefit state by 5.6% and decreases the standard deviation by 23.8% (subplots (d) and (f)).
Optimization algorithms will occasionally yield results counterintuitive to the user’s best guess. For example, the user’s best guess placement (subplot (c)) was to spread out pumps and minimize a water fetcher’s distance to a pump. Alternatively, the optimizer learned to minimize a water fetcher’s preference for an unimproved water source compared to an improved water source (subplot (e)). It did so by placing some water pumps next to unimproved water sources, and leaving other water pumps in the more populated city center where the most people would benefit. These unanticipated optimization outcomes foster design space exploration in ways that may have been previously unknown to the designer. Even if the model outputs are not exactly followed or implemented, this depth of exploration can be valuable in socio-technical systems design for sustainable development.
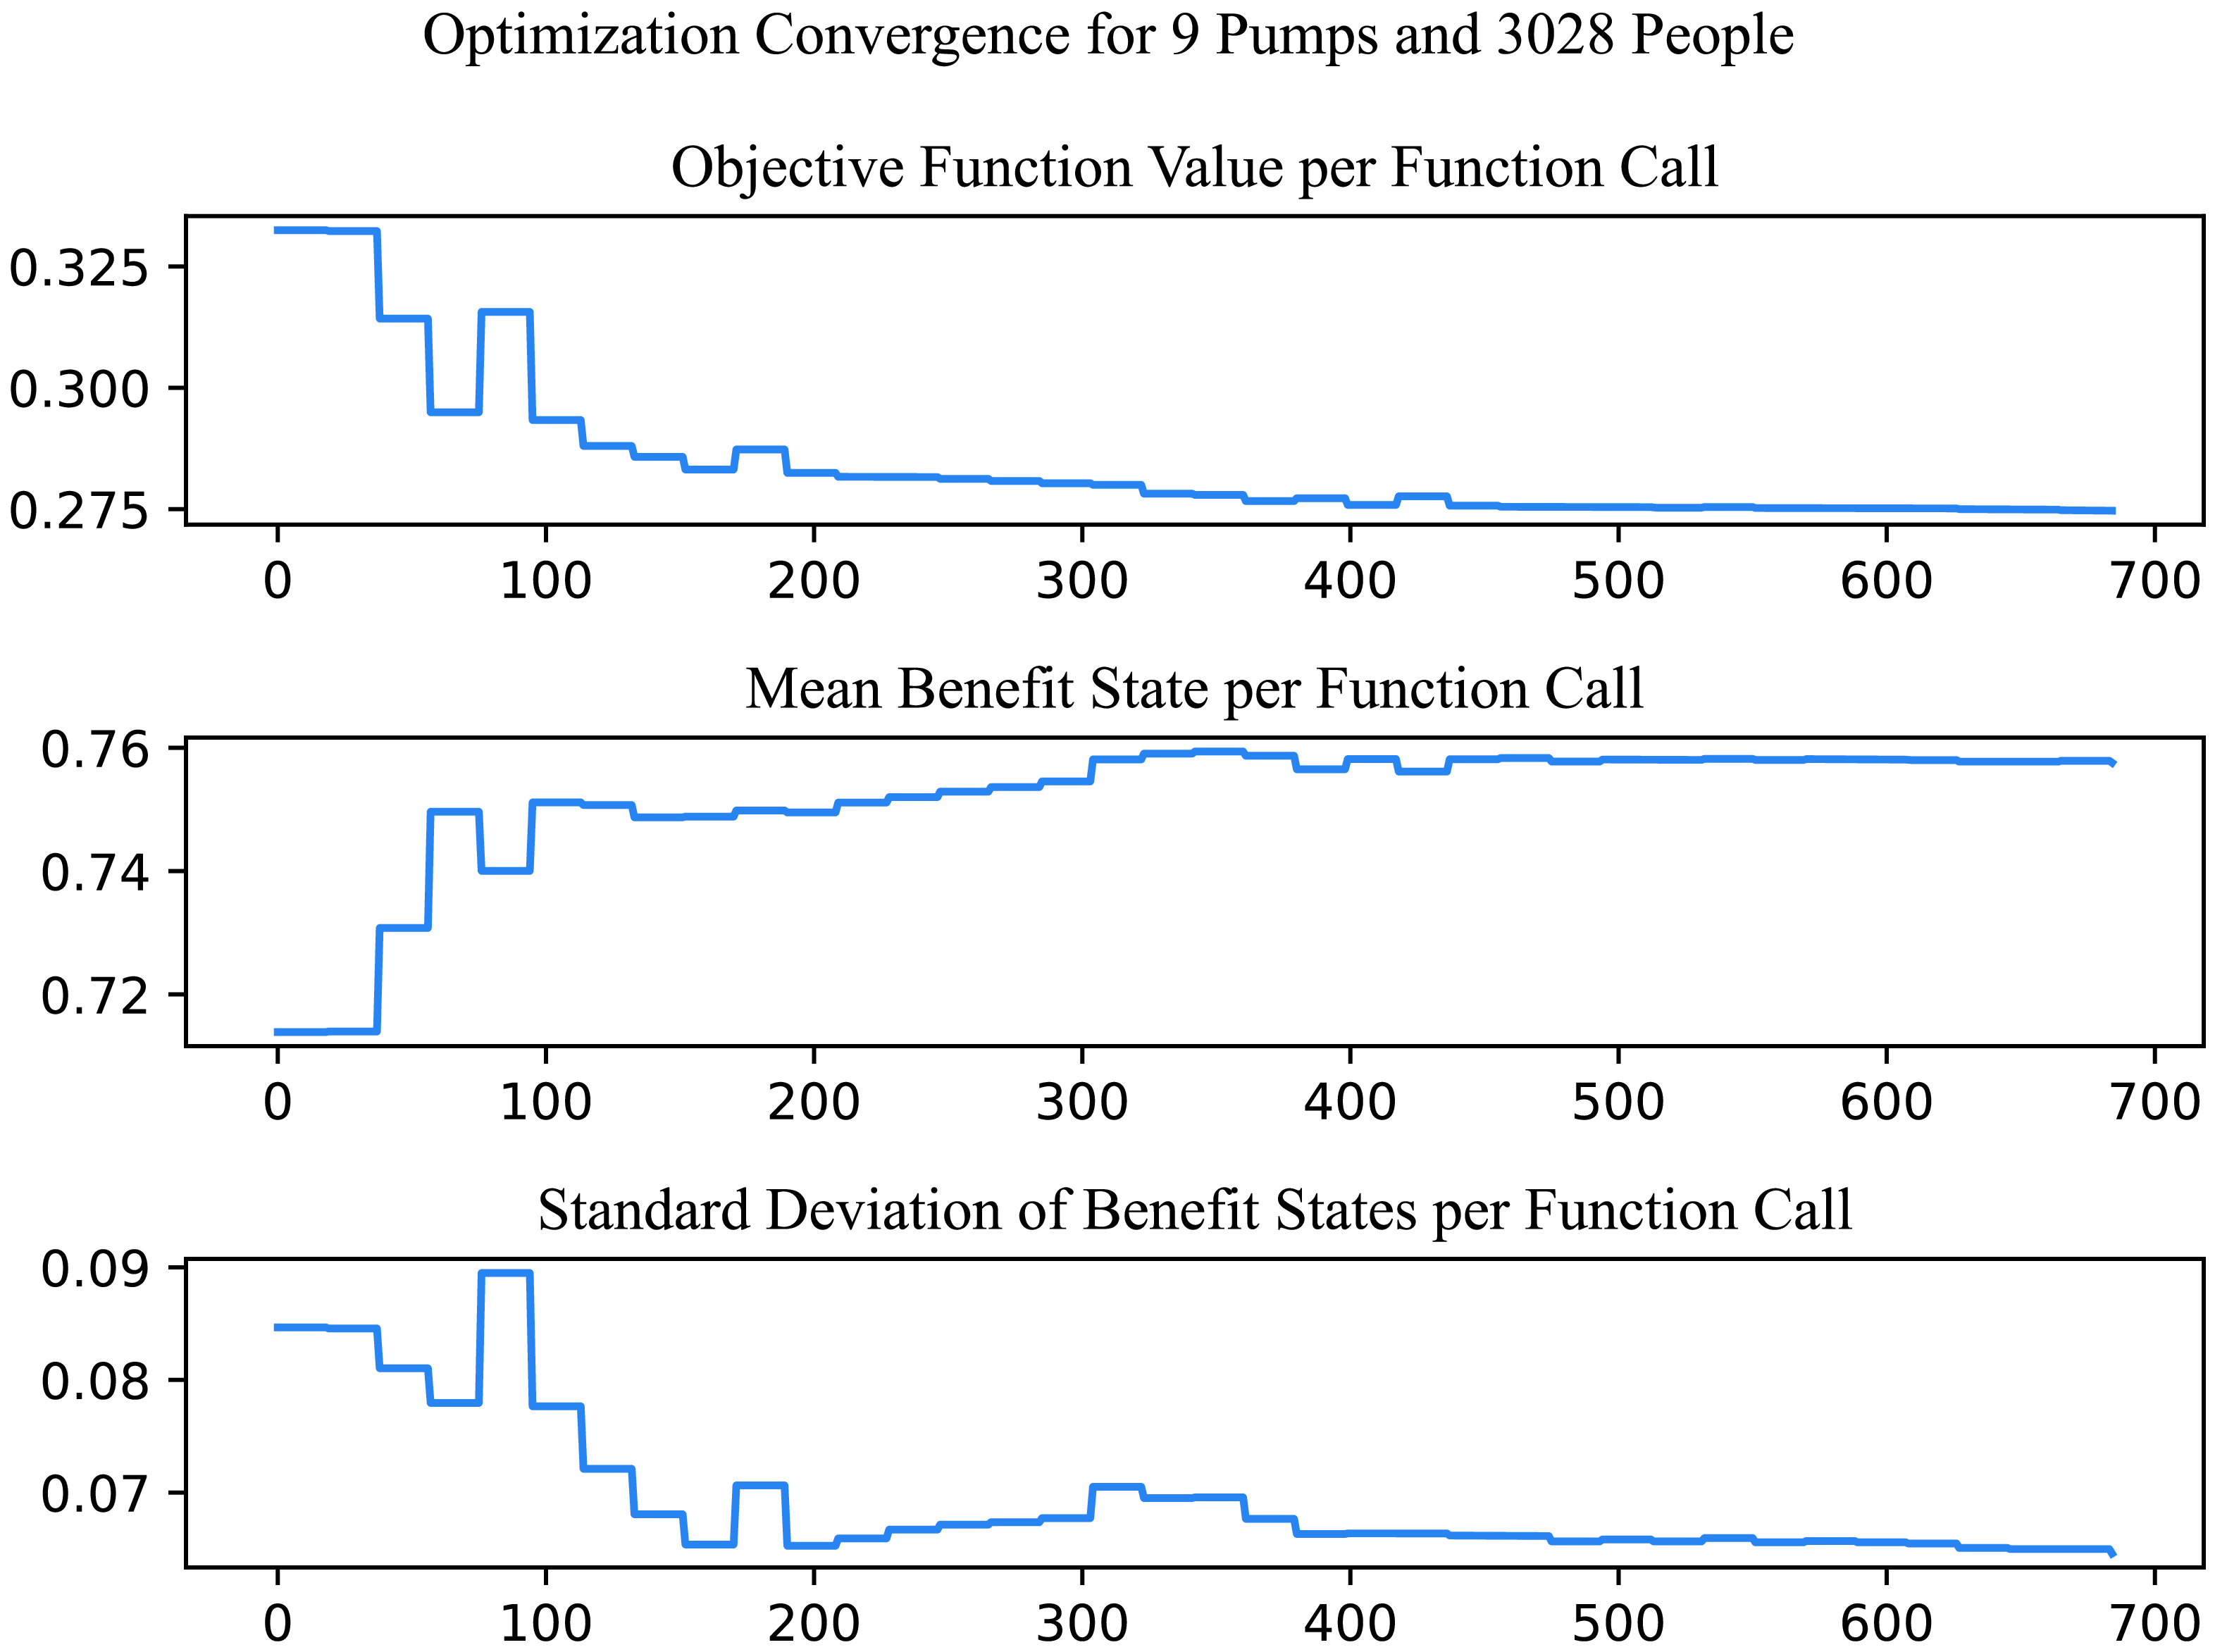
4.2. Convergence
Figure 3 shows the convergence plots for the function J(x) (Equation 3), mean, and standard deviation of the benefit states in Figure 2 (e) and (f). The results in Figure 2 (e) and (f) were generated over the course of about 700 function calls. Maximizing the mean and minimizing the standard deviation may sometimes compete with each other, as is shown around the 100th function call. Between the 200th and 300th function calls, the standard deviation was allowed to increase as the mean also increased. After the 300th function call, the mean did not see any other improvements and the optimizer changed the pump coordinates to lower the standard deviation.
The improvements to mean and standard deviation, albeit small in this specific illustration, show that it is possible to increase the mean benefit state while decreasing standard deviation. This suggests that engineered products and systems, when designed well, can introduce benefit while minimizing stratifying effects on a community.
4.3. Validation
Validating socio-technical models such as the one discussed in this paper is recognizably difficult. Nevertheless, there are multifaceted approaches to evaluate model validity found in the literature, including Reference North and MacalNorth and Macal (2007) and Reference Wilensky and RandWilensky and Rand (2015). North and Macal describe seven validation facets for validating agent based models, six of which are relevant to the models presented in this paper. They recommend (1) requirements validation, (2) data validation, (3) face validation, (4) process validation, (5) model output validation, and (6) theory validation.
This section discusses each of these except (5), which is presented as a limitation in the next section.
-
Requirements Validation checks if the model is answering the right question. In this paper, we answer how the layout of water hand pumps, and someone’s willingness to fetch water, effect their likelihood of using an improved water source and reducing the risk of diarrheal disease.
-
Data Validation checks whether the input data for the model is verified or correct. In this model, we used data from archival literature to describe someone’s preference for drinking water from different sources (Reference Smiley and StolerSmiley and Stoler, 2020), and the likelihood of them acquiring a diarrheal disease from such sources (Reference Wolf, Johnston, Ambelu, Arnold, Bain, Brauer, Brown, Caruso, Clasen and ColfordWolf et al., 2023).
-
Face Validation and Process Validation asks whether model assumptions seem plausible, if the model acts as is expected to, and whether the model corresponds to real-world processes. From Figure 2, we see that people closer to water hand pumps receive more benefit than those further away, which is consistent with real-world findings (Reference Smiley and StolerSmiley and Stoler, 2020).
-
• Theory Validation asks whether the theory used in the model is valid. In this paper we use a diffusion model laid out in Reference McKinnon, White, Mattson and SalmonMcKinnon et al. (2024), which computes benefit flow from technologies to people in ways analogous to other proven systems.
For this paper, each of the validation facets described above indicates that a reasonable approach has been taken to model social impact diffusion. This paper’s lack of Model Output Validation is a limitation.
4.4. Limitations
North and Macal’s fifth facet of validation—Model Output Validation—asks how well the model output represents real-world findings (Reference North and MacalNorth and Macal, 2007). Model output validation is clearly the most recognized and valued validation strategy in engineering, and something we anticipate achieving for the impact diffusion models described in this paper. At present, however, we are working toward that goal by purposefully exploring hypothetical socio-technical systems first. We anticipate that with further learning and model advancements (such as those presented in this paper) the uncertainty and risk will be adequately minimized to experiment with actual socio-technical systems.
Another limitation of the model used in this paper is that it only considers a single health benefit—risk of diarrheal disease. Social impacts of technology expand beyond health benefits to include impacts on education, paid work, conflict and crime, and more (Reference Rainock, Everett, Pack, Dahlin and MattsonRainock et al., 2018).
5. Conclusion
In this paper, we propose an optimization formulation for maximizing the social impact of an engineered product in a community. What makes this optimization formulation distinct from other existing socio-technical models is that it uses graph-based social impact diffusion, which allows predictions of social impacts on and across individual people. The utility of this kind of impact diffusion modeling is demonstrated in Section 4, where the social impact diffusion optimization model improves the design of a water hand pump system, finding desirable locations of each pump. The final optimized design significantly outperformed the random design and best guess design. Being based in graph theory, social impact diffusion modeling also has the advantage of being able to characterize impacts at both the nodal level (individual level) and the system level, yielding insights not possible with other social impact models that only consider impact at an aggregated system or stakeholder level.
Coupling the models presented in (Reference McKinnon, White, Mattson and SalmonMcKinnon et al., 2024) with the numerical optimization problem formulation presented in this paper has allowed us to show the following:
1) Design space exploration can be a valuable part of socio-technical systems design because it can numerically search for designs that balance the needs of numerous individuals in the system, as well as the needs of the overall system.
2) The graph-based social impact diffusion models used in this paper are adequately behaved to allow convergence in a computational setting. Such convergence may have been challenged by the complex nature of the graphs being optimized.
3) The complexity of stakeholder interests and tradeoff balancing is not trivial. This was illustrated in the apparent conundrum to have higher impacts in a more stratified society, or lower impacts in a less stratified society. The optimization results indicate that greater overall impact and less stratification is possible.
We conclude that social impact diffusion models, even when created and optimized at low fidelity levels, reveal insights about socio-technical systems that can aid engineering design for sustainable development.
Acknowledgments
The authors acknowledge funding from Crocker Ventures for this research.


 Open access