


1. Introduction
In recent years, the unexpected event during survey design (UESD) has gained great popularity in political science and beyond. Muñoz et al. Reference Muñoz, Falcó-Gimeno and Hernández(2020) describe it as a research design where an unexpected event happening during the survey field phase divides respondents into two groups: those interviewed after the event (treatment group) and those interviewed before the event (control group). This treatment assignment is considered as-if-random whenever the interview timing is unrelated to the event under study.
Among the most commonly analyzed events using this method are terrorist attacks (Harding and Nwokolo, Reference Harding and Nwokolo2024) and incidents of police violence (Laniyonu, Reference Laniyonu2022). Both these event types have one thing in common: they are frequently occurring and can thus be expected to overlap with survey field phases on many occasions. Yet, despite these favorable conditions, most published UESDs (on these topics and other similar ones) only analyze single case studies with little or no case selection justification.Footnote 1 One might even argue that this phenomenon of analyzing idiosyncratic case studies, without much regard for generalizability, is common to most of the quasi-experimental research methods that emerged from the credibility revolution in the social sciences.
In this research note, I suggest that the UESD lends itself to break this trend and advocate for researchers to employ an extension of the UESD when analyzing frequently occurring events to test the generalizability of their results: the multiple unexpected events during survey design (MUESD). Replicating the same analysis steps across multiple cases based on a systematic case selection reduces the possibility of unreliable, idiosyncratic results and should thus become standard practice for these specific event types.Footnote 2
To demonstrate the empirical benefits of the MUESD, I re-evaluate the results of a recent working paper by Charitopoulou and Cavalli Reference Charitopoulou and Cavalli(2023) analyzing the effect of the catastrophic 2013 Lampedusa shipwreck on immigration attitudes. Their claim is that exposure to migrant deaths in the Mediterranean Sea triggers empathy toward migrants and substantially decreases preferences for restrictive immigration policies in host countries. Replicating the original single case study and analyzing 15 comparable events with richer data, I find, contrary to Charitopoulou and Cavalli, that Mediterranean shipwrecks have not caused Italians or Europeans more generally to become more supportive toward immigration. A significant effect of shipwrecks is only predicted when newspaper coverage is exceptionally high. Across high-powered UESDs, even an event receiving as much media attention as the original Lampedusa shipwreck is predicted to have an effect that is statistically indistinguishable from zero (with the point estimate being less than 10% of the size of the originally found effect). Given twice that level of newspaper coverage, the effect is still predicted to be less than 20% of the size of the original finding.
I proceed by first introducing previous research on the relationship between Mediterranean shipwrecks and immigration attitudes. Next, I make transparent my systematic case selection procedure for the MUESD (with more details on the proposed MUESD workflow given in Appendix A9), which leaves me with a final sample of 15 additional shipwrecks of similar magnitude to the original Lampedusa shipwreck, spanning a total of over 100,000 survey responses. I present the estimation strategy for my replication and extension analysis, which closely mirrors the regression discontinuity design (RDD) estimated by Charitopoulou and Cavalli Reference Charitopoulou and Cavalli(2023). Finally, I discuss the results of the replication and extension and summarize the new insights about UESDs and shipwrecks.
2. Mediterranean shipwrecks and immigration attitudes
In the last 30 years, there have been more than 45,000 documented migrant deaths in the Mediterranean Sea. The real figure, including undocumented deaths, is likely far higher. Mediterranean shipwrecks are thus one of the most severe, longstanding humanitarian catastrophes of the present. Despite the severity of the problem and its coverage by news media, Non-governmental organizations (NGOs), and other civil actors, not much is being done to stop it (Steinhilper and Gruijters, Reference Steinhilper and Gruijters2018). This lack of responses is contradicted by a series of recent publications claiming pro-immigration attitudinal shifts in response to Mediterranean shipwrecks (Slovic et al., Reference Slovic, Västfjäll, Erlandsson and Gregory2017; Sohlberg et al., Reference Sohlberg, Esaiasson and Martinsson2019). Most recently, Charitopoulou and Cavalli Reference Charitopoulou and Cavalli(2023) found, using a single case UESD, that Italians expressed significantly less anti-immigration sentiment following the 2013 Lampedusa shipwreck. The theory behind all these findings is that exposure to the suffering of an outgroup triggers empathy and compassion toward that outgroup (in this case immigrants). Exposure to migrant deaths in the Mediterranean Sea is thus hypothesized in these studies to decrease preferences for restrictive immigration policies.
I build on this line of research but theorize reactions to Mediterranean shipwrecks in the framework of compassion fade: the decline of compassion in the face of lasting challenges and increasing numbers of victims (see Västfjäll et al., Reference Västfjäll, Slovic, Mayorga and Peters2014; Thomas et al., Reference Thomas, Cary, Smith, Spears and McGarty2018). Under this framework, the abovementioned findings, which all leveraged variation in response to either the 2013 Lampedusa shipwreck or the 2015 death of Alan Kurdi, can be seen as those outliers that raise initial compassion before it falls off again. Studies on compassion fade have found that people are less affectionate toward large groups of victims than toward victims who are presented in isolation (Butts et al., Reference Butts, Lunt, Freling and Gabriel2019). This decline of affection already sets in with the second endangered life when compared to the first one and leads to a reduced willingness to help (Västfjäll et al., Reference Västfjäll, Slovic, Mayorga and Peters2014).
In line with compassion fade, Thomas et al. Reference Thomas, Cary, Smith, Spears and McGarty(2018) have shown that while people initially expressed great interest in the case of Alan Kurdi, leading to empathy and solidarity, over time they became distressed by further information about the extent of the Mediterranean crisis and seized interaction with this topic. The study concludes that “engagement may dissipate in the face of ongoing challenges” (Thomas et al., Reference Thomas, Cary, Smith, Spears and McGarty2018). I thus expect that when using the MUESD to comparatively analyze a series of multiple shipwrecks, previous UESD results do not replicate, instead showing null effects.
3. Systematic selection of multiple UESD cases
Most published UESDs analyze single cases of frequently occurring events with little or no case selection justification. If researchers are free to selectively report results for an isolated case that supports their hypotheses, while discarding results for other cases that do not, this raises doubts about both the validity and the generalizability of published results with this method. To improve the credibility of the UESD when analyzing frequently occurring events, multiple events should be compared based on a justified, systematic case selection.
Rather than arbitrarily deciding on one isolated case and then briefly justifying it post hoc, the whole universe of potential cases is considered in the MUESD in the initial selection stage. After establishing the universe of potential cases and the population of interest, infeasible cases are excluded based on event salience, data constraints, and considerations for statistical power. The analysis step is then replicated across all remaining cases that meet the case selection criteria. An important improvement over traditional case selection justification in UESDs is that there is a justification given not just for the included case(s)Footnote 3 but also for all the excluded cases. A more detailed outline of the MUESD workflow is tabularized in Appendix A9.Footnote 4
To demonstrate how such a procedure could work, I replicate and extend the single case UESD by Charitopoulou and Cavalli Reference Charitopoulou and Cavalli(2023). The universe of potential cases thus encompasses all Mediterranean shipwrecks since the 2013 Lampedusa shipwreck. The population of interest includes all Italian citizens for a direct replication and all European citizens for an extended replication.Footnote 5
Considering how frequently shipwrecks occur, and how little coverage some of them receive, the final sample of cases needs to be substantially circumscribed to ensure high compliance with treatment assignment. Based on the assumption that the most devastating shipwrecks attract the most media attention, I only analyze the most lethal shipwrecks, which I define as those that led to the deaths of over 100 migrants. I consulted the list of documented migrant deaths by the organization “UNITED”, from which I assembled a register of every documented shipwreck with over 100 deaths from 2014 to 2022. A total of 49 of these severe shipwrecks happened in this period, from which the final sample is systematically selected based on data availability and statistical power considerations.
To closely match the conditions in Charitopoulou and Cavalli’s UESD, I utilize the same survey project they did: the European Social Survey (ESS).Footnote 6 Fifteen shipwrecks coincided with active ESS fieldwork periods in waves seven, eight, nine, and 10. Several additional accidents happened during ESS fieldwork periods, but there are not enough observations available to meaningfully interpret their effects. A minimum criterion of 500 observations within a 7-day bandwidth is imposed to ensure that even small effects can be detected at 80% statistical power.Footnote 7 Shipwrecks that were succeeded by follow-up shipwrecks within 7 days are excluded to avoid misestimated treatment effects due to multiple treatments.
With these selection criteria, each of the 15 cases has enough observations to detect small effects at 85% power, which means that the conventionally acceptable threshold of 80% power is met for every case. Appendix B5 shows the complete list of included and excluded cases with reasons for inclusion/exclusion given. The sample sizes for every study are reported in Appendix A5, and power analyses for the original study and the lowest-powered replication are reported in Appendix A6. Appendices B1 and B2 show histograms of the daily interview density for each ESS wave.
For each shipwreck, news archives in Germany, the UK, and Italy are consulted to determine news salience and assess the likelihood of compliance with treatment assignment. Except for two of the 15 shipwrecks, they all received considerable news coverage,Footnote 8 suggesting high compliance with treatment assignment as most people who follow the news should have been aware of the shipwrecks. This is crucial since we can only estimate intent-to-treat (ITT) effects for the effects of exposure to news about a shipwreck. The higher the compliance, the closer the ITT converges toward the average treatment effect (ATE). If every single respondent has been exposed to the news, the ITT is the ATE.
4. Estimation strategy
My estimation strategy closely mirrors Charitopoulou and Cavalli’s working paper to establish the comparability of results: I leverage as-if-random assignment of ESS interview dates as an exogenous source of exposure to Mediterranean shipwrecks in a sharp RDD. The outcomes of interest are attitudes toward immigrants and attitudes toward immigration. The same analysis steps are replicated across all shipwrecks because the external validity of results can be best assessed when keeping all aspects of the estimation constant across studies (Slough and Tyson, Reference Slough and Tyson2025).
For individual survey respondents i interviewed in country c, the RDD specification is formalized below:
 \begin{equation}
\begin{aligned}
{Y}_{ic} = \alpha + \beta_{1} {Tr}_{ic} + \beta_{2} (X_{ic} - c_{ic}) + & \beta_{3} {Tr}_{ic} (X_{ic} - c_{ic}) + V_{ic} + {FE}_{c} + e_{ic} \in B_{30}\\
& \text{with}\\
\text{Tr} =
& \begin{cases}
\textbf{1} & \text{for post-shipwreck interviews,} \\
\textbf{0} & \text{for pre-shipwreck interviews.}\\
\end{cases}
\end{aligned}
\end{equation}
\begin{equation}
\begin{aligned}
{Y}_{ic} = \alpha + \beta_{1} {Tr}_{ic} + \beta_{2} (X_{ic} - c_{ic}) + & \beta_{3} {Tr}_{ic} (X_{ic} - c_{ic}) + V_{ic} + {FE}_{c} + e_{ic} \in B_{30}\\
& \text{with}\\
\text{Tr} =
& \begin{cases}
\textbf{1} & \text{for post-shipwreck interviews,} \\
\textbf{0} & \text{for pre-shipwreck interviews.}\\
\end{cases}
\end{aligned}
\end{equation}On top of the binary treatment indicator Tr, this RDD specification includes a term for the running variable X, centered around the date of the event c. A second additional term is included in the form of an interaction between the binary treatment indicator and the centered running variable. In this specification, β 1 represents the treatment effect, while β 2 represents the pre-treatment slope, and β 3 represents the post-treatment slope change. V is a vector of covariates included in alternative specifications as a robustness check. FE are country fixed effects included in those models with cross-country samples. The main analyses are conducted within a 30-day bandwidth to precisely replicate the bandwidth chosen by Charitopoulou and Cavalli. Appendix B6 reports results at alternative bandwidths.
5. Replication and extension
For ESS waves 6 to 10, I create two separate factors as outcome variables, one for attitudes toward immigrants and one for attitudes toward immigration, similar to Charitopoulou and Cavalli. The exact formulations of the six items behind these two factors are listed in Appendix B3, along with a table depicting the factor loadings in Appendix B4. All factors are transformed to make high values show positive attitudes toward immigrants/immigration, and low values show negative attitudes.
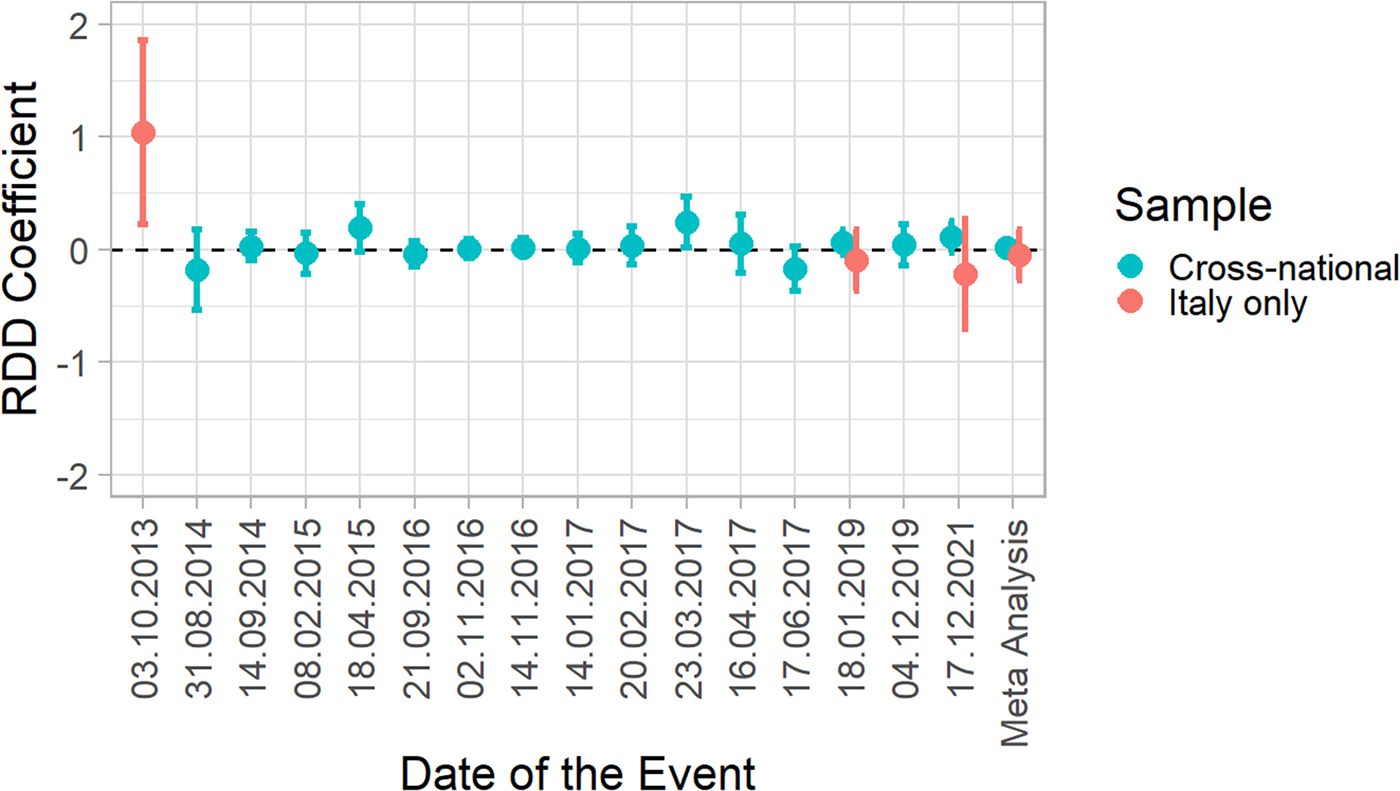
The left panel of Figure 1 shows ITTs for all RDDs in chronological order.Footnote 9 Like in the original study, the effect of the 2013 Lampedusa shipwreck on immigration attitudes is statistically significant (ITT = 1.04 or 1/5th of the scale range; SE = 0.42).Footnote 10
Of the other ITTs, only one is significant. The shipwreck near Tripoli on 23 March 2017 significantly improved immigration attitudes (ITT = 0.24; SE = 0.11), but this treatment effect is less than a quarter the size of the one from 2013. Apart from the coefficients themselves, the size of the confidence intervals is salient: while the original study was conducted on a sample of fewer than 250 respondents, most replications are conducted on samples of several thousand respondents to detect even small effects at 85% power. The original study has less than 10% power to detect small effects.
Shipwreck ITTs for immigration attitudes in all RDDs in chronological order. The error bars are 95% confidence intervals.

Since the original study was limited to an Italian sample, I also conduct replications on the two Italian samples that are sufficiently large to do so, on 18 January 2019 and 17 December 2021, both of which produce null results. The same results are reported in regression tables in Appendix A5 with and without the inclusion of a set of covariates largely identical to those used by Charitopoulou and Cavalli. This does not substantively alter the results either. Results from an alternative specification with region fixed effects are reported in Appendix B13. There, not a single estimate is statistically significant.
The results for lumped samples with event fixed effects combining all cross-country and Italian analyses are also reported in Figure 1. For these meta-analytic models, the sample size is 101,940 (cross-country) and 2471 (Italian), respectively, which would allow for the detection of very small effects. Again though, the results are precisely estimated null effects. The same holds when I analyze only shipwrecks that are not preceded by another highly lethal shipwreck within 60 days to account for potential overlaps more conservatively (Appendix A5) and when I employ fixed-effect and random-effects meta-analyses (Appendix A8).
While all replications in the main manuscript are conducted with an RDD, to closely resemble the analyses of the original UESD, I acknowledge that there is no clear consensus on the issue of ordinary least squares (OLS) with a dummy indicator vs RDD in the UESD community, with some studies analyzing RDDs and others using OLS. To ensure robustness across specifications, I thus report non-interactive OLS results in Appendix B12. Here, three of the shipwrecks produce small, statistically significant effects (between 10% and 25% of the original effect size).
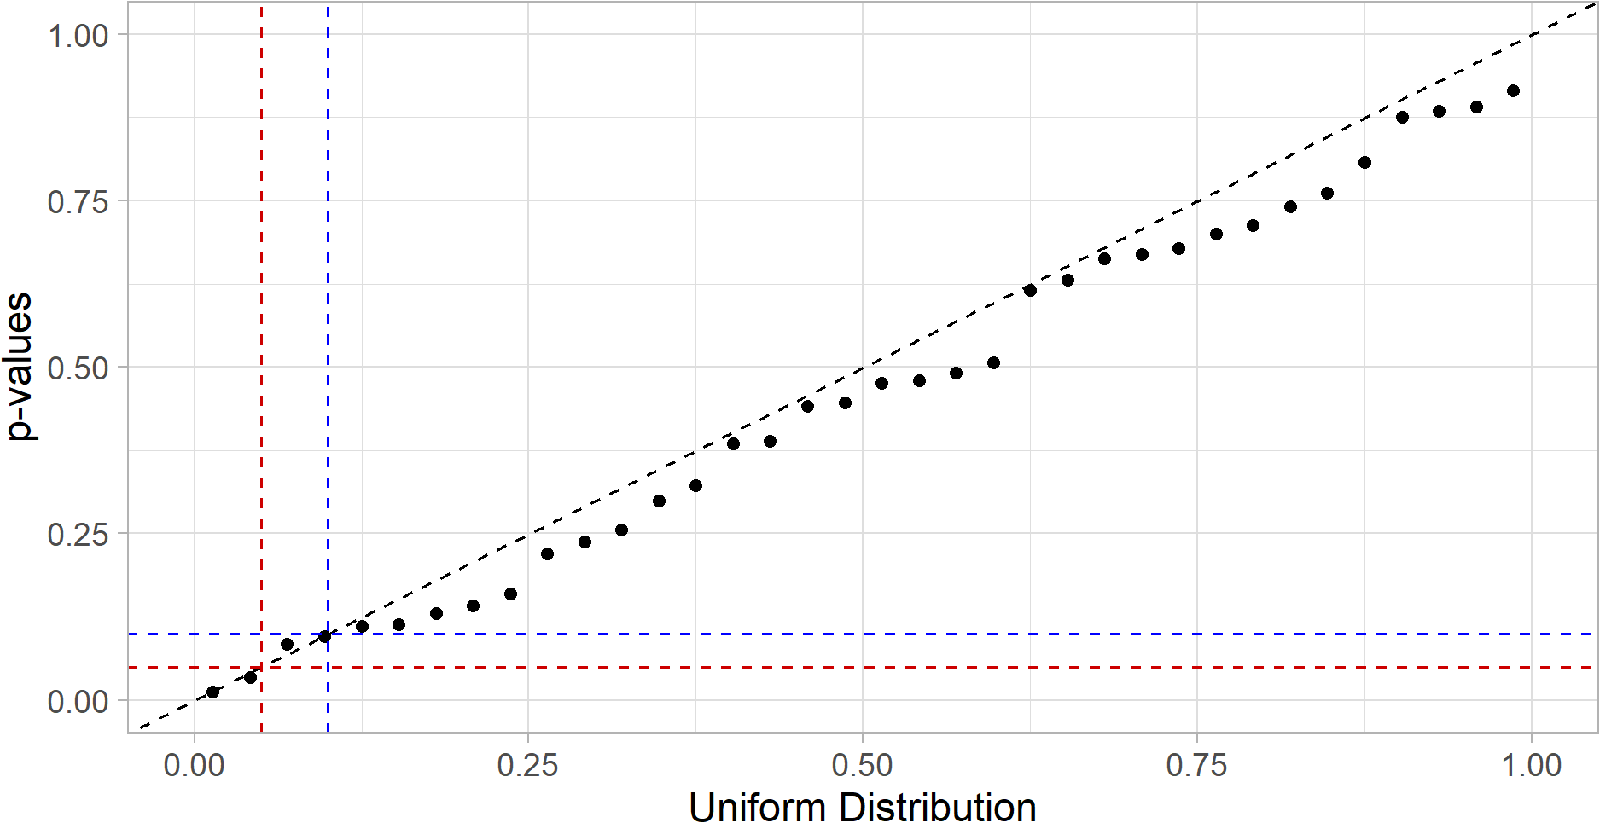
Figure 2 shows the p-values of all shipwreck ITTs plotted against a uniform distribution. The distribution of p-values largely follows that uniform distribution, which would be expected when regressing unrelated outcomes on a truly randomized treatment.
Overall, the MUESD analyses give a more comprehensive overview of the effects of shipwrecks on public opinion and indicate that the result of the original single case UESD should be taken with a note of caution. While it seems plausible that this particular event briefly improved attitudes toward immigration, that does not warrant the assumption of a generalizable effect of Mediterranean shipwrecks or other humanitarian catastrophes on immigration attitudes. Only one well-powered RDD had any effect whatsoever. Furthermore, as I show in Appendix A3, even the original 2013 Lampedusa shipwreck only had a very shortlived effect (with a significantly negative downward trend in immigration attitudes post-treatment). All the established UESD robustness checks are conducted and reported in Appendices A4–A5 and B6–B11, further strengthening this assessment.
P-values of all shipwreck ITTs plotted against a uniform distribution. The dotted red lines indicate p < 0.05. The dotted blue lines indicate p < 0.1.

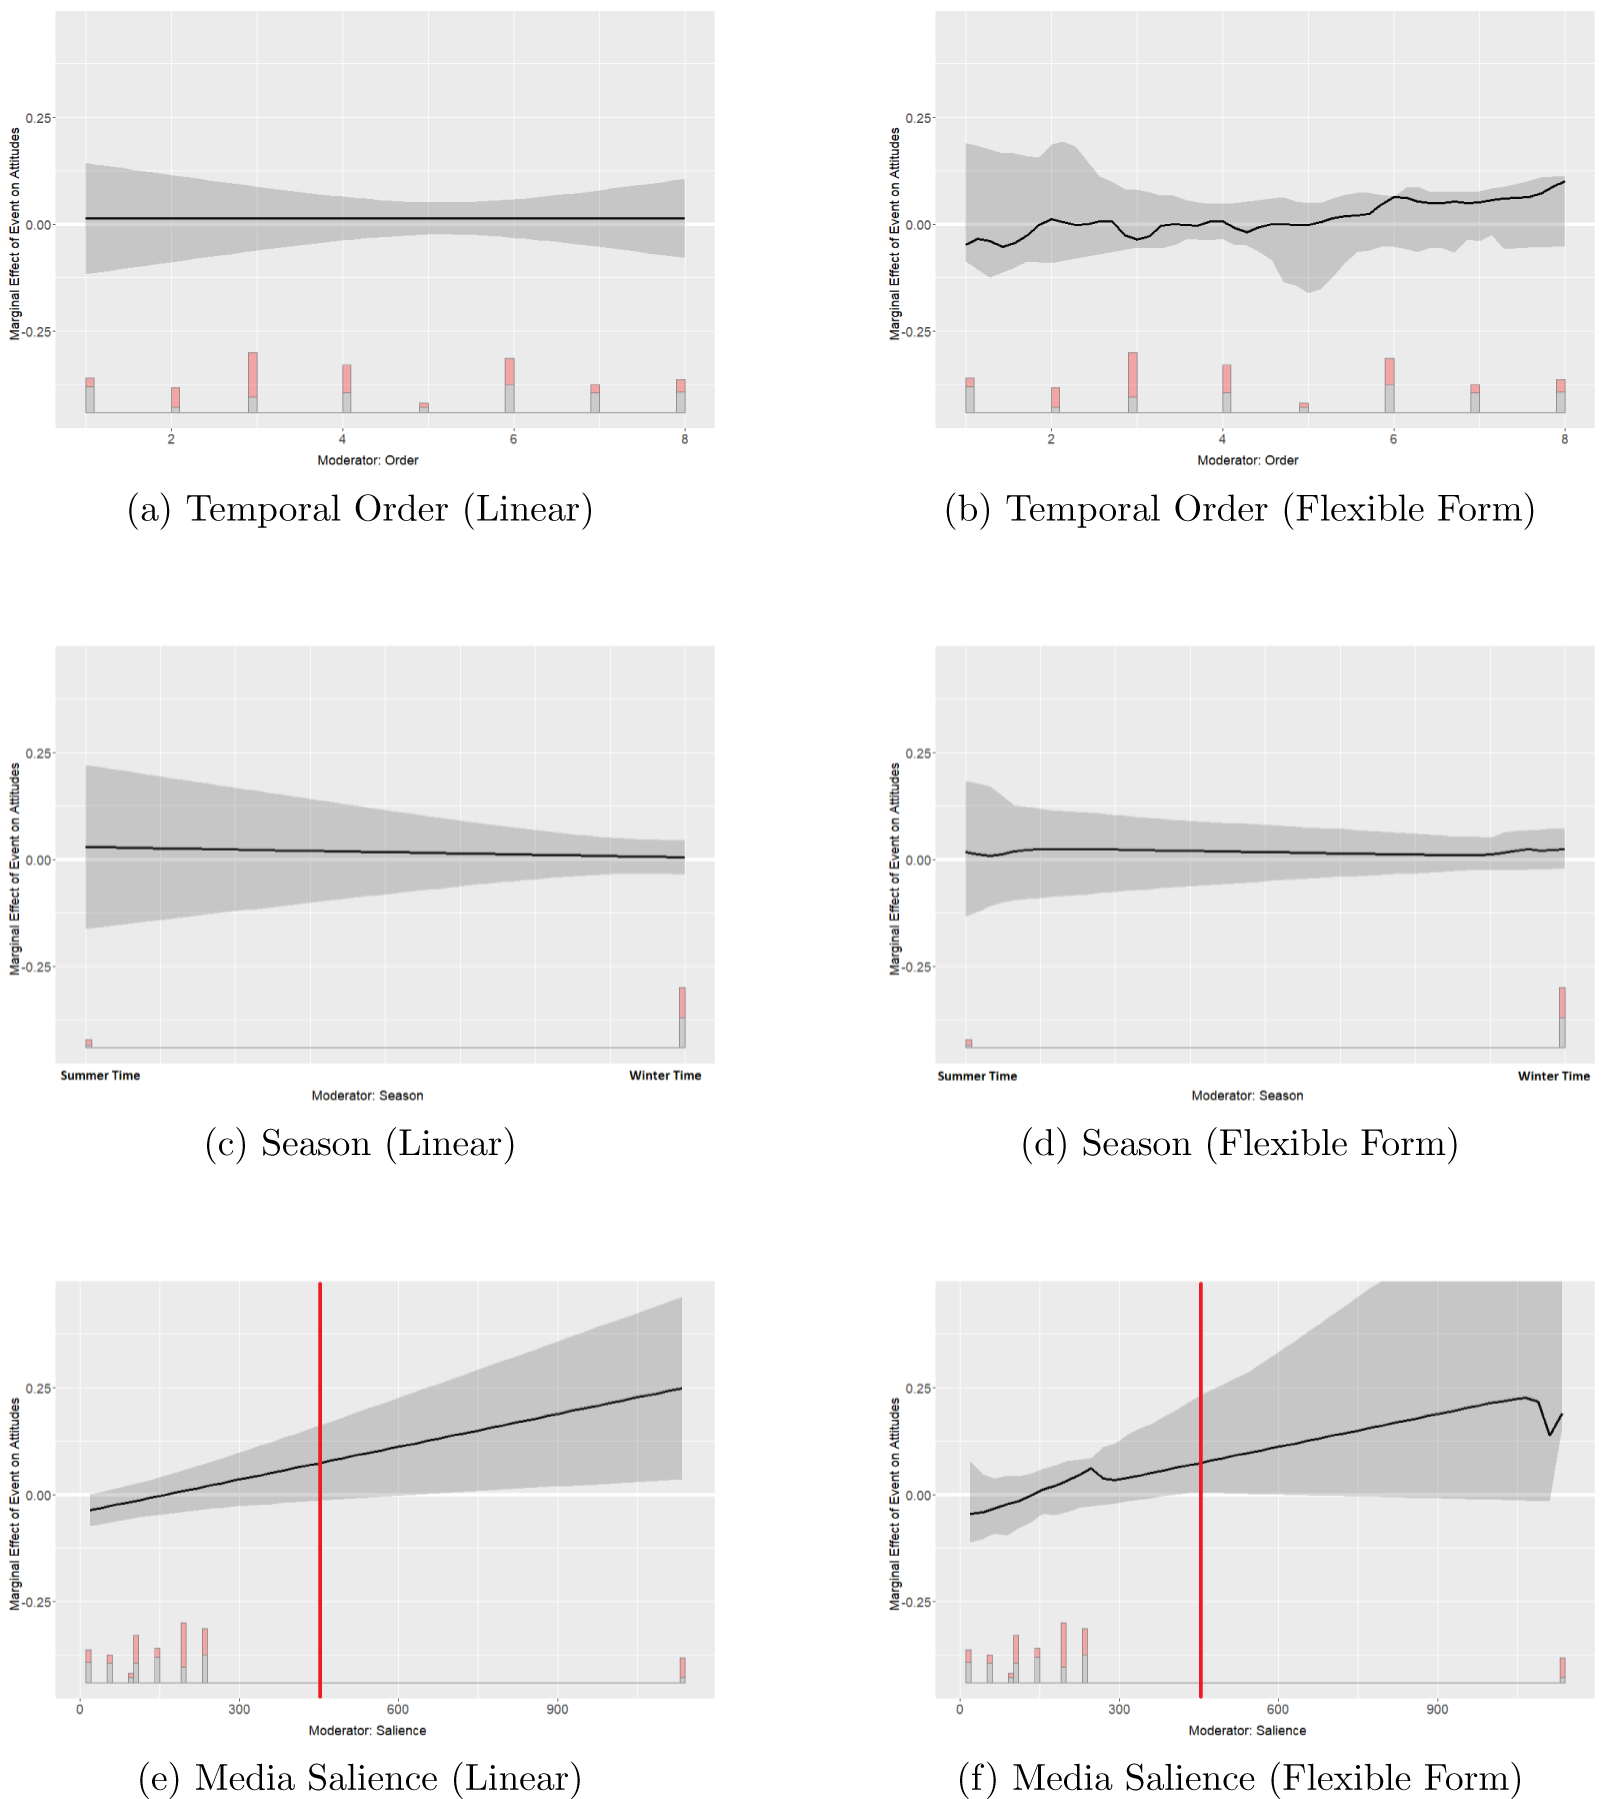
The MUESD enables analyses of cross-event heterogeneity to investigate the conditions under which events have stronger or weaker effects. In the case of shipwrecks, I test three plausible expectations: (1) a weaker effect of follow-up events compared to initial events, (2) a weaker effect of events in the wintertime compared to the summertime, and (3) a stronger effect of more salient events in the news. Figure 3 shows linear and flexible form interaction analyses across all replications that are a minimum of 60 days apart. Panels (a)–(d) show that the temporal order of events has no moderating effect, neither on the decadal nor the seasonal scale. Panel (e) shows that media salienceFootnote 11 has a moderating effect in the expected direction: only the most widely reported shipwrecks have a significant effect on immigration attitudes. However, even a shipwreck with the exceptional media coverage of the 2013 Lampedusa shipwreck (marked by the vertical red line) is only predicted to have a very small effect that is statistically indistinguishable from zero. A shipwreck that is covered in 1000 news articles per countryFootnote 12 is predicted to have an effect about 20% the size of the original single case UESD. As can be seen in the flexible form interaction in panel (f) though, this estimate has considerable amounts of uncertainty attached to it, precisely because shipwrecks are almost never this widely reported on in the media, so data coverage is low.
Interactions of the treatment with event order, season, and media salience. The vertical red line in panel (e) and (f) denotes the media salience of the original Lampedusa shipwreck. The gray areas are 95% confidence intervals. (a) Temporal order (linear). (b) Temporal order (flexible form). (c) Season (linear). (d) Season (flexible form). (e) Media salience (linear). (f) Media salience (flexible form).

6. Conclusion
There is now a wide availability of large-scale survey data which produces consistent overlaps of events such as terrorist attacks or shipwrecks with survey field phases. Despite these promising conditions, most UESD practitioners only analyze single case studies without properly justifying their case selection. I showcase an extension of the UESD to test its generalizability: the MUESD. With this design, a systematic case selection, followed by analyses of multiple events, allows for an improved assessment of the generalizability of results across cases (see Appendix A9 for a detailed rundown of the proposed MUESD workflow).
I demonstrate the benefits of the MUESD in an empirical application where I first replicate the findings of Charitopoulou and Cavalli Reference Charitopoulou and Cavalli(2023), who found a significant improvement in immigration attitudes following the 2013 Lampedusa shipwreck. Extending their analysis to 15 further cases of similarly devastating shipwrecks with better data coverage, I find no evidence for a generalizable effect of shipwrecks on immigration attitudes.
Finally, I also analyze cross-event heterogeneity, finding that neither decadal nor seasonal patterns moderate the effect of shipwrecks on immigration attitudes. The only shipwrecks that are predicted to cause small reductions in anti-immigration attitudes are those with extensive media coverage, exceeding even the coverage of the 2013 Lampedusa shipwreck. Even in those extremely rare cases of exceptional salience, the point estimate is 5x smaller than the one originally found.
This research note has two main takeaways: First, methodologically, UESD practitioners are well advised to justify their case selection systematically, making inclusion and exclusion criteria transparent while taking into account considerations of data availability, statistical power, and media salience. When analyzing frequently occurring events, replicating the same analysis steps across multiple cases greatly increases the generalizability and comparability of results. Second, empirically, previous findings about the large effects of shipwrecks on immigration attitudes are put into perspective. The 2013 Lampedusa shipwreck had a shortlived effect on Italian citizens, but in the following decade, shipwrecks with comparable levels of news coverage failed to replicate this in Italy or the rest of Europe. Exposure to migrant suffering does not seem to substantially reduce anti-immigration sentiments among the European public.
Supplementary material
The supplementary material for this article can be found at https://doi.org/.10.1017/psrm.2025.17. To obtain replication material for this article, please visit https://doi.org/10.7910/DVN/2LDTMS.
Acknowledgements
Many of the ideas for this article originated from discussions with Simon Hix, whom I thank for his great support from start to finish. I thank Jordi Muñoz, Albert Falcó-Gimeno, and Enrique Hernández for their paper on the UESD as well as Effrosyni Charitopoulou and Nicolo Cavalli for their paper on Mediterranean shipwrecks, both of which inspired this article greatly. I am thankful for valuable feedback from Cathrine Valentin Kjaer, Eréndira León Salvador, Elias Dinas, the participants of the EUI Political Behavior Colloquium, and the participants of the DVPW Methods Conference. I also thank Konstantinos Matakos and the three reviewers at Political Science Research and Methods (PSRM) for their thorough engagement with an earlier version of this paper and their excellent feedback.
Competing interests
The author declares none.


 Open access