


INTRODUCTION
The La Draga archaeological site is located on the eastern shore of the Lake of Banyoles, at 172 meters above sea level, in the northeastern part of the Iberian Peninsula. The site is located at an intermediate point between the Pyrenean Mountain ranges, 40–50 km, and 35 km from the current Mediterranean coastline (Figure 1). Nowadays the site is partially on dry land and partially covered by the lake water table, and these conditions have favored the extraordinary state of conservation of built structures and objects made from wood and vegetable fibers, as well as other organic materials.
La Draga archaeological site in northeastern Iberian Peninsula and general plan of the excavated sectors. The modern lake boundary clearly marks the location of Sector C under the water table.

Since the site’s discovery in 1990, archaeological excavations have documented various structures that would correspond to an Early Neolithic settlement in which evidence of Cardial pottery has been identified (Bosch et al. Reference Bosch, Chinchilla, Nieto, Raurich, Tarrús, Palomo and Saüch2000, Reference Bosch, Chinchilla and Tarrús2006, Reference Bosch, Chinchilla and Tarrús2011; Tarrús Reference Tarrús2008; Palomo et al. Reference Palomo, Piqué, Terradas, Bosch, Buxó and Chinchilla2014; Bogdanovic et al. Reference Bogdanovic, Bosch, Buxó, Chinchilla, Palomo and Saña Seguí2015; Terradas et al. Reference Terradas, Palomo and Piqué2020). The site’s location corresponds to a repeated pattern during the first Neolithic occupations of the western Mediterranean. These are humid areas, on the shores of lakes, lagoons, or marshes, and close to land potentially suitable for agricultural practices, in areas of great ecological diversity (Bernabeu et al. Reference Bernabeu, Lozano and Pardo-Gordó2017; Guilaine Reference Guilaine2018; Revelles et al. Reference Revelles, Burjachs, Palomo, Piqué, Iriarte, Pérez-Obiol and Terradas2018; Martínez-Grau et al. Reference Martínez-Grau, Jagher, Oms, Barceló, Pardo-Gordó and Antolín2020; Piqué et al. Reference Piqué, Palomo, Terradas, Andreaki, Barceló, Bogdanovic, Bosch, Gassmann, López-Bultó and Rosillo2021). Archaeological studies suggest that the prehistoric settlement covered an area greater than 15,000 m2. Topographically, the settlement lies on a smooth downward slope from east to west and from south to north, towards the lakeshore.
So far, a total extension of 1000 m2 has been excavated, distributed into three sectors (A, B–D and C) (Figure 1). The first excavations were carried out between 1991 and 2005 (Bosch et al. Reference Bosch, Chinchilla, Nieto, Raurich, Tarrús, Palomo and Saüch2000, Reference Bosch, Chinchilla and Tarrús2006, Reference Bosch, Chinchilla and Tarrús2011) discovering an area of 328 m2 in Sector A, and 132 m2 in Sector B. In the underwater sector (Sector C), exposed in prehistoric times, 310 m2 were also excavated (Bosch et al. Reference Bosch, Chinchilla, Nieto, Raurich, Tarrús, Palomo and Saüch2000). Archaeological excavations resumed in 2010. A new excavation area of 55.5 m2 was opened, adjacent to Sector B, which was named Sector D, and another new area of 178 m2, adjacent to Sector A, was also investigated (Palomo et al. Reference Palomo, Piqué, Terradas, Bosch, Buxó and Chinchilla2014).
The oldest well-documented human occupation at La Draga is characterized by the construction of wooden platforms on piles driven into the lake marl substrate, on the shore of the lake, above the water table of that time. On top of these wooden platforms, the dwellings were built, probably with a gable roof (Figure 2). After the abandonment of this first settlement, a new pavement was built to insulate the surface from the phreatic level, and a new habitation took place over the same area and sectors.
Virtual and idealized reconstruction of one of the Neolithic huts that may have been built at La Draga during its early occupation (Campana Reference Campana2019; Barceló et al. Reference Barceló, Calvano, Campana, Piqué, Palomo and López Bultó2020). Pile alignment in the geometrical model does not reflect the reality of the terrain.

The entire settlement raised above the lake water table in prehistoric times. In Sectors B–D and C, the oldest stratigraphic layers are found below the water table, which has favored the preservation of organic materials. In contrast, in Sector A, archaeological layers remained above the water table for most of their post-depositional history and plant remains have only been preserved by carbonization. The different states of preservation of the archaeological record at the three excavated areas of the site and the distinct post-depositional processes generate additional problems when correlating the structures of the different sectors. This is not only due to the site’s elevation in relation to the groundwater, but also the dynamics of the phreatic level (Figure 3).
Stratigraphic correlation of all three excavated sectors in La Draga. (Modified after Palomo et al. Reference Palomo, Terradas, Andreaki and Rosillo2017.)

Stratigraphic observation suggests the existence of a minimum of two different site occupations. They are clearly differentiated at Sector B–D, as the travertine pavement overlaps the wooden layer. In Sector A, stratigraphical dynamics are totally different, and the correlations of the layers and phases are unclear (Palomo et al. Reference Palomo, Piqué, Terradas, Bosch, Buxó and Chinchilla2014). The goal of this paper is to place both Neolithic occupations in the calendrical scale by integrating radiometric and dendrochronological dates, as well as sedimentary and micro-stratigraphic information and archaeological materials. The resulting chronological model is discussed amid current debates on the origins of the Early Neolithic in the western Mediterranean region and the Cardial pottery context.
MATERIAL AND METHODS
Methodology and Theoretical Background
All radiocarbon samples and tree-ring data have been organized into depositional events, using archaeological contexts and micro-stratigraphic information. In so doing, we have followed the general approach by Barceló and Andreaki (Reference Barceló and Andreaki2020) and Barceló and Bogdanovic (Reference Barceló and Bogdanovic2020). A depositional event is the material expression of an archaeological event: something happened at a specific place during an interval of time and modified the physical appearance of the ground surface where the action took place, differentiating specific areas from their neighbors. Therefore, a depositional event will correspond to the smallest differentiable spatial unit, that is, a particular closed area where the values of some spatial variable(s) are homogenous and statistically different from the values the same spatial variable(s) had at neighboring closed areas. It is important to consider that social action alone is not the only cause for a depositional event to occur. This is because an archaeological site is not only the place where human action took place at a certain time, but also, where numerous post-depositional processes (geological, chemical, physical, mechanical, biological, etc.) modified or altered that initial anthropic deposition.
A depositional event is thus the smallest spatial referential archaeological unit of observation showing some degree of homogeneity, and it should be defined according to the modification of the surface generated by the activity at that place: the accumulation of materials on the surface, and/or the excavation of the same ground surface. In so doing, depositional events should be defined according to the following:
-
the archaeological materials they contain (what has been deposited),
-
the microstratigraphical information revealing the formation processes in situ (the way the ground was altered as a result of deposition),
-
the relative (stratigraphic order) and absolute chronological information (dendrochronological and radiocarbon data) for each of them (the order in which different depositions occurred, and the position of each deposition in the calendar scale) (Barceló and Andreaki Reference Barceló and Andreaki2020).
It is generally assumed that the most likely position of a depositional event on the time scale should be close to the temporal position of a majority of the isotopic events it contains (Barceló and Bogdanovic Reference Barceló and Bogdanovic2020). Van der Plicht et al. (Reference van der Plicht, Van Strydonck, Bronk, Scott, Nelson, Hedges and Crombe1999: 434) referred to 14 C events, defining them as “the separation of a certain substance containing carbon from the source from which the carbon was obtained.” Generalizing to any kind of isotopic clock, we refer to an isotopic event (see also, Lanos and Philippe Reference Lanos and Philippe2017, Reference Lanos and Philippe2018, Reference Lanos and Philippe2020). Since the temporal position of each isotopic event on the time scale is necessarily uncertain, we need a series of isotopic events (the larger, the better), and a combination of their respective confidence intervals, to estimate the temporal position of the depositional event. The rationale for this chronological inference is that the material consequences of activities performed at the same time should be closer spatially to each other than to those materials that were deposited farthest in time. Synchronicity of depositional processes suggests that all things being equal, activities occurring at the same time will tend to increase the joint frequency of their effects, and this can be observed in the spatial density of such effects. Nevertheless, this assumption is not always correct. Not only must we keep in mind the possible time lag between the isotopic event and the depositional event, but we must also know in detail the content-container relationship that may exist between the dated sample and the minimum spatial unit of reference in which it has been found (Roskams Reference Roskams1992; Berry Reference Berry2008; Thorpe Reference Thorpe2012). To solve the question whether all the materials found at a referential spatial unit were deposited at the same time, the significance of the differences in the estimated 14C age can be calculated using the classical Ward and Wilson test (1978). If the result is positive for all the isotopic events within the same depositional event, we can conclude that the duration of the deposition was short, and the position in the calendar scale of the depositional event will be calculated in terms of the statistical combination (average) of the uncalibrated 14C ages of the samples contained in the spatial unit.
In the case that the combination of isotopic events from the same depositional event fails the Ward and Wilson statistical test, the estimation of the temporal position of the depositional event will be compromised. The samples either were deposited as a consequence of different depositional actions, or the time lag between different effects of the same action is too great to be effectively detected in terms of a chi-square statistical distribution. Depositional events can be fast—a day, a week, less than a year; medium slow—less than 20 years; or slow—more than 20 years. That is the reason why some authors suggest distinguishing between “strict contemporaneity” and “broad contemporaneity” (Sharon Reference Sharon1995; Holst Reference Holst2001; Desachy Reference Desachy2008). Two elements are strictly contemporaneous if they were deposited at exactly the same time; “broad” contemporaneity expresses those two depositional events that may have occurred within the same temporal interval, but not necessarily simultaneously. The duration of the depositional process, its continuity, and the longitude of the temporal gap between the start and the end of the deposition also introduce strong and weak synchronisms. This distinction is important, because weak synchronisms or broad “contemporaneities” would not allow us to establish temporally ordered relationships: if A is later than B, and if B is possibly contemporaneous with C (but we do not know with certainty), then we cannot affirm that A is later than C, although the degree of certainty can be expressed in probabilistic terms.
The slower the depositional event, and the longer time it needed to end, the more difficult it can be to fix the temporal positioning on the calendar scale. On one hand, the statistical combination of estimated dates for isotopic events in the same depositional event is more difficult, because the precision of radiocarbon estimate is often “lost” in the calibration to calendar time scale (Blaauw et al. Reference Blaauw, Christen, Guilderson, Reimer and Brown2005). In the scenario the depositional event is assumed to have occurred along a relatively large time span (it was “slow”), the contemporaneity of constituting isotopic events is “broad,” or the different depositional events seem to be functionally related in some way, we can build chronological units defined as phases.
We have used OxCal 4.4. (Bronk Ramsey Reference Bronk Ramsey1994, Reference Bronk Ramsey2019) and ChronoModel 2.0.18 (Lanos et al. Reference Lanos, Philippe, Lanos and Dufresne2016; Lanos and Dufresne Reference Ph and Ph2019) software tools to integrate isotopic events that were depositionally associated with a single depositional event. In addition to that, depositional events were ordered according to stratigraphic constraints. The term “phase” is used here in the same way as Bronk Ramsey (Reference Bronk Ramsey, Barceló and Bogdanovic2015) and Lanos and Philippe (Reference Lanos and Philippe2018, Reference Lanos and Philippe2020): as a group of events—isotopic and/or depositional—that are related in some way but for which there is no information on the internal ordering, and no (prior) chronological distinctions or temporal ordering can be assumed. That means, that phases are undetermined temporal intervals and the only way of estimating their temporal position depends on the probability of fixing the temporality of their start and end events (Andreaki et al. Reference Andreaki, Barceló-Álvarez, Antolín i Tutusaus, Bogdanovic, Gassmann, López-Bultó, Morera, Palomo, Piqué, Revelles and Terradas2020).
In the remaining of the paper, a phase is thus an aggregation of broadly contemporary depositional events, or a single depositional event whose formation process has been extremely slow. Martín-Rodilla et al. (Reference Martin-Rodilla, Gonzalez-Perez, Mañana-Borrazás and Campana2016) qualify the supposed contemporaneity of events belonging to the same phase by saying that it is a circumstance occurring over a long-time interval, during which no changes appear in the associated entities. It is the interval of the calendar scale fulfilling the condition: “there is a non-zero and calculable probability that any depositional event included within its limits contains at least one of the isotopic events to which it refers” (Barceló Reference Barceló2009). Furthermore, phases are groups of functionally linked archaeological units, in the sense expressed by E. Harris (Reference Harris1989): they are the result of a structural combination of structural archaeological spatial reference units, and not necessarily of temporal (chronostratigraphic) units (see also Cox Reference Cox2001; Traxler and Neubauer Reference Traxler and Neubauer2008). Although different, both uses of the term “phase” have similar explanations when used to reconstruct the “biography” of an archaeological site. They can be viewed as individual steps in the temporal trajectory of the site occupation and formation. In both cases, a single scalar calendar date for positioning such steps is not enough, however, we could fix in some way the start and end of the activity or processes responsible for the formation of the individual event or the functionally connected set of events.
Stratigraphy and the Ordering of Depositional Events
The Harris Matrix diagrams (Figure 4) describing stratigraphic relationships between excavated units were translated into a sequence of depositional events, whose temporal range depend on the isotopic events depositionally identified at each minimum spatial unit of reference.
Harris Matrix Diagrams from Sectors D (left) and A (right) at La Draga. The stratigraphic units are defined either as surfaces (green) or deposits (blue) and are organized in three phases in Sector D and four phases in Sector A.

The oldest depositional events correspond to the construction of foundational wooden platforms, and integrate the isotopic events measured from the foundational vertical piles at each sector: Event 1 in Sector A, Event 2 in Sector B, and Event 3 in Sector D.
In Sector A, more than 400 wooden pile tips have been recovered stuck deep in the geological lake marl under the archaeological level. Only the bottom part of the vertical piles driven into the original carbonate sands has been preserved (Event 1), while the occupation layers with organic and anthropogenic remains are affected and compacted by direct or indirect trampling from the travertine slabs above. Event 4 corresponds to the piles used for the successive repair of the platforms documented at this area, but also archaeological material found in the sedimentary filling of post-holes.
Sectors B and D, where wooden elements and organic material have been very well preserved under the actual phreatic level, present a more complex stratigraphy. High-resolution microstratigraphic analysis (Andreaki Reference Andreaki2022) reveals a compact sediment, because of trampling action of the surface, while at the same time the decomposition of organic matter is observed. Sector B is the closest to the old lake shoreline. Radiocarbon dated samples from wooden piles related with platform repair have been integrated into Depositional Event 5. Event 8 includes nine faunal bones, cereal seeds and wooden tools found in contact with preserved wooden elements. A further distinction has been made between materials found directly on the occupation surface (Depositional Event 8a) and organic material over it but in close connection with the collapsed wooden remains (Depositional Event 8b).
Over the lake marl surface, a dark organic sediment, NAVIII, is found in some parts of Sector D; several well-preserved leaves have been identified in this layer. A dark grey sediment, NAVII, with abundant and well-preserved wooden elements (tools, branches, twigs, boards) and other organic remains as leaves or fungi, associated with charcoals, and accumulations of cereal seeds, stratigraphic unit 7001, was found in between the wooden elements. Depositional Event 6a includes a single associated isotopic event, a cereal seed (Beta 315052), found at the bottom of stratigraphic unit NAVII. Event 6b is defined by the presence of four additional cereal seeds (Hordeum and Triticum), associated with domestic activities that occurred on the wooden platforms (filling of stratigraphic unit NAVII), and probably also affected by minor post-depositional activity related with the fluctuations of the water table. Depositional Event 28 is also functionally associated with Event 6b, and it corresponds to stratigraphic unit 7001 from which, two seeds (Triticum and Papaver somniferum) were dated.
In Sector C, currently submerged underwater, the stratigraphic sequence is affected by subsequent lake marl depositions, preceding and following the archaeological layers. The alteration between depositional processes of peat, carbonate sandy sediments and lake marl silt is usual in wetland sites. The first archaeological layer, in close contact with the carbonated sands of the original lake ground, has a mean thickness of 15 cm. It is characterized by the presence of wooden elements, and a big amount of vegetal remains, as well as remains of fauna, pottery, and animal bones (Depositional Events 7a and 7b).
At some point, after the construction of wooden platforms and the building of dwellings and other functional structures on them, the ground surface subsided and as a result, lake water partially flooded parts of the settlement. Current phreatic level can be related to the lake water level fluctuations. At the same time, a ground subsidence of the original lake marl substrate affecting Sectors B and D of the current site has been geomorphologically identified (Iriarte et al. Reference Iriarte, Cho, Revelles, Burjachs, Piqué, Palomo, Terradas and Peña-Chocarro2014), and it may have contributed to the collapse of the old wooden structures in this part of the site. The interplay of water input and sediment accumulation rate constrained the continuity of human activity.
The practical response to ground sinking and flooding was probably to insulate the swamped and partially inundated surface with locally available travertine slabs in Sector B–D, as the ground subsidence continued to grow with the passage of time. In this sector, immediately below this accumulation of travertine slabs, the sediment appears to be ashy and oxidated towards the top making more probable the hypothesis of an insulation layer before the deposition of travertine as the influence of dry conditions is greater. Over the travertine layer, a peaty layer was gradually formed with charred plant material, faunal remains and malacofauna.
In Sector A, most travertine slabs marking the probable second occupational surface are in contact with the original lake marl surface, probably because of the poor preservation of the wooden platforms at this sector of the site. Depositional Event 9 can be defined based on a radiocarbon dated sample from stratigraphic layer IIIB, in contact with the travertine slabs. Forty combustion features (hearths) have been identified, arranged with travertine slabs, sandstones or burnt pebbles, and include charcoal, remains of the firewood used and other burnt and unburnt material. They appear in the form of pits with basal depression of 80–90 cm in length, and with a sedimentary filling of 10–20 cm thick, approximately. The stratigraphical sequence of most of those hearths is very characteristic: a first layer containing some charcoals and mixed archaeological material, fragmented travertine slabs and some sandstones and a second layer above, with a bigger number of charcoals. The top of the second layer is covered by a new accumulation of travertine slabs. Depositional Events 10–19 have been identified corresponding to samples dated from different hearths. Cereal seeds and charcoal remains in 10 out of the 40 differentiated hearths contribute to their chronological definition.
Apart from the identified hearths, there are other differentiated spatial units in Sector A, also formed by arranged travertine slabs of various measures, with a certain basal depression approaching 20 cm of thickness. These distinct structures are filled with large quantities of diverse archaeological material such as charred seeds, animal bones, fragments of pottery, quartz, flint and bone tools, pieces of ornaments and grinding tools. Because of the kind of materials they contain, such structures have been interpreted as landfills for food waste and remains of discarded objects (rubbish) (Figure 5).
Spatial distribution of the excavated structures in Sector A mentioned in this analysis, La Draga (Morera and Terradas Reference Morera and Terradas2017).

Depositional Event 20 corresponds to E254, an irregularly shaped pit filled with a brownish grey sediment of clayey texture (total extension: 5.20 × 3.80 m) and containing abundant archaeological material such ornamental objects. A single isotopic event corresponds to it. Event 21 defines the temporal position of E260, another small oval shaped arrangement of travertine slabs (75 × 54 cm), with a maximum thickness of 17 cm, found over the lake marl substrate. It is filled with a greyish clayey sediment and contains travertine slabs of different measurements between 5 and 30 cm. The material recovered, apart from the slabs, is characterized by an accumulation of faunal remains anatomically connected. An isotopic event associated to this deposition has been measured from a bone.
Depositional Event 24 corresponds to the formation of E263, another arrangement of travertine slabs, whose bottom part was dug into the lake marl substrate. Its sediment is organic of darkish color, containing charcoals and a large amount of archaeologic material, especially faunal remains. A single isotopic event from this deposit comes from an animal bone fragment. An isolated seed coming from a concentration of pottery sherds located in an extreme corner of the excavated area contributes to defining Event 27.
E258, an irregular oval shaped arrangement (5.10 × 1.30 m) of different sized travertine slabs between 5 and 50 cm, has been divided into two differentiated depositional events (Events 22 and 25). Although the structure is filled with a homogenous dark clayey sediment containing a big number of charcoals, sedimentary differentiation between the bottom and the top allows distinguishing two different moments in its construction and filling. A single isotopic event for each of these depositional events comes from animal bones identified at a precise location. This is also the case of E261, a big distinctive spatial unit (5.40 × 2.95 m), with a basal depression dug into the lake marl substrate and a filling sediment and content like E258. Its differentiated sedimentary sublayers have been distinguished depositionally (Events 23 and 26).
Stratigraphic and depositional units defined in Sector A can be explained as synchronous and/or post-depositions of travertine arranged features. A darkish brown sediment with some modern archaeological material, extending all over Sector A, covers them. The top of the second layer is covered by a new accumulation of travertine slabs. Overlying the travertine associated features, there is a darkish grey sediment, marking the end of travertine use in Sector A.
The second occupation in Sector D seems to be slightly different. It contains stratigraphic units characterized as pre-depositional and/or synchronous with the paved surface made of travertine slabs of various sizes. This includes, stratigraphic unit NAVI extending all over the excavated sector immediately below the paved surface of travertine slabs and just above the preserved wooden elements from previous occupation. Stratigraphic units NAVIa, NAVIa-a, and 6005 have been detected only in some parts of this sector. Stratigraphic unit NAV corresponds to travertine slabs defining an apparently paved surface, and NAIV is found above this accumulation of travertine slabs. These sediments are of terrestrial origin, either from fluvial transport or from accumulation after torrential rains, and they deposited in a very short time interval covering the trenches and basins caused by ground surface subsidence. Those layers are mainly composed of clays, and very poor in archaeological material.
The fact that the plant remains from this second occupation have only been preserved by carbonization suggests that these more recent layers remained above the water table for most of their post-depositional history. Event 29 contains a cereal grain coming from a stratigraphical layer immediately above the wooden collapse layer. It is defined sedimentologically by clays with plastic texture and a high presence of organic material, and extends throughout the excavated Sector D. Stratigraphically above it, depositional event 30 is defined by another cereal grain coming from a restricted area characterized by a peaty sediment of dark color, with little presence of archaeological material and mostly consisting of decayed organic matter, whose inferior part is in contact with the travertine paved area.
Apart from these depositional events, additional excavated units have been associated to second occupation syn-depositional and/or post-depositional events. These are stratigraphic units III, II and I. Stratigraphic unit III contains fragmented travertine slabs and coincides with the upper part of the paved surface. Stratigraphic units II and I are clearly post-depositional events, as they consist of a darkish sediment with decayed organic matter and scarce mixed archaeological material. Event 31 contains a sample of fauna from a sandy greyish sediment containing travertine sand and fragmented slabs and is stratigraphically correlated with this upper part of the travertine slabs found in the paved area.
Radiocarbon Dating
There are 62 14C dates from short and medium long-lived samples from all the sectors of the site (Table 1). Cereal and fauna samples refer to domesticated species. All dates correspond to singular elements, and their precise 3D location and stratigraphical association allows assigning all of them to depositional events.
Radiocarbon (14C) dates from archaeological samples in La Draga and their respective ChronoModel events. δ13C and δ15N values of the samples are also included.

The dated samples correspond mainly to short-lived samples as cereal seeds and bones, but also charcoal and wooden material retrieved during the excavation, among them several wooden piles. In order to avoid the old wood effect, when possible, the last rings of the wooden piles were sampled for radiocarbon dating. Sectors A and B–D are the best dated, with 29 dated samples coming from Sector A, 15 from Sector B, and 12 from Sector D. In contrast, we dispose of only six radiocarbon dated samples from the underwater Sector C.
Most samples have been retained for analysis, even with relatively large lab errors. Only when statistical analysis proves that there is an error in the estimate, the date has been processed as an outlier. AMS and conventional methods have been both considered, and only when discrepancies are very clear, a separate analysis has been carried out.
Dendrochronological Analysis
The excavations carried out to date at the site, have made it possible to recover 1271 piles and 494 horizontal timbers, counting 1765 structural timber logs that can potentially be dendrochronologically measured. The dendrochronological analysis of the piles is still in progress (Piqué et al. Reference Piqué, Palomo, Terradas, Andreaki, Barceló, Bogdanovic, Bosch, Gassmann, López-Bultó and Rosillo2021; López-Bultó et al. forthcoming). The vast majority (>95%) of timber logs have been determined as oak wood (Quercus sp. deciduous) (Bosch et al. Reference Bosch, Chinchilla and Tarrús2006; López-Bultó and Piqué Reference López-Bultó and Piqué Huerta2018). Other taxa identified are hazel, laurel, and dogwood. Another main characteristic of the archaeological wooden timbers from La Draga is their relatively small average diameter, especially the low average number of tree rings per sample. The number of samples with less than 30 tree rings is higher than 70% (López-Bultó and Piqué Reference López-Bultó and Piqué Huerta2018). Many samples with higher number of tree rings have very narrow rings, with almost no latewood, which make their measurement difficult.
So far, tree rings from 136 piles and horizontal timber logs have been described and measured, providing a floating dendrochronological sequence that covers an interval of 265 years. The dendrochronological sequence could not be correlated with any other, due to the absence of an absolutely dated dendrochronological sequence covering the Neolithic period up to the present of the northeastern part of the Iberian Peninsula.
Prehistoric inhabitants used “fresh” tree trunks for building. The preservation of the last growth ring (cambium. cf. Rathgeber et al. Reference Rathgeber, Cuny and Fonti2016) in 66% of the dendrochronologically measured piles allows establishing a single depositional event of tree felling during the winter of the year 237/238 of the local tree ring sequence. Eight percent of the measured logs appear to be older, however, having been cut between winter 233/234 and winter 236/237, and they may come from reuse, stored wood, or dead standing trees. The latter (year 236) may have the same origins as the older ones or, more plausibly, have been part of a preparatory felling for the main site that would begin the following year.
After the year 237/238, new piles were added as reinforcement and repair of the structures (platforms and/or dwellings). These trees were cut between three and 28 years after the first tree-felling. Given that no other pile has a more recent tree ring, we may assume that maintenance and repair of built structures stopped after 28 years. However, it is important to consider that tree trunks used for repair appear to be younger and thinner than those used for initial construction, and they are more difficult to recognize as construction elements. There are still many thin trunks waiting for tree ring count, and therefore the available last tree ring (265 in the local sequence) is not necessarily the last one, nor does it represent the final event of the first occupation (Figure 6).
The local dendrochronological sequence at La Draga site. The wooden posts corresponding to both construction and repair phases are represented in the diagrams.

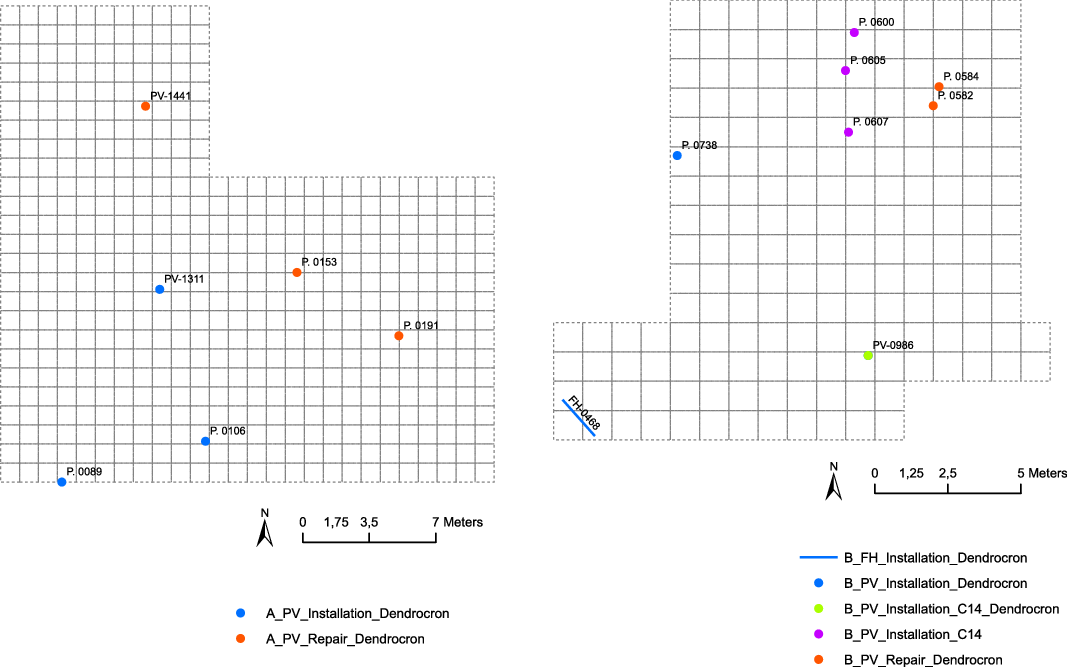
From the concentration of trunks cut at the same year, it appears that most wooden structures in the prehistoric settlement were built in one year (perhaps two), during the winter of the dendrochronological year 237/238 and during the previous year 236 of the local tree-ring sequence. In all four excavated sectors (A, B, C, D) we found logs coming from the same foundational forestry cut of 237/238, suggesting the strict contemporaneity of wooden structures all along the Neolithic settlement (Figure 7). This would imply that the first village of la Draga was built in one go, building wooden constructions all around the settlement area.
Map of spatial distribution of the dated wooden piles at La Draga, including both the installation (year 237/238) and the repair associated piles. Sector A on the left and Sector B–D on the right.
The strict contemporaneity of most of the wooden elements used for construction is quite unusual compared with other apparently contemporaneous lakeside settlements. In Switzerland (and throughout the Alpine Arch) in sites dating to the Early Neolithic period, settlements are generally smaller, and it is unlikely that the construction of built structures occurred simultaneously. On the contrary, settlements grew gradually, expanding to neighbouring areas, such as the case of Hornstaad-Hörnle IA, built from 3910 BC onwards (Billamboz Reference Billamboz2006), and Sutz-Lattrigen/Riedstation, built between 3393 and 3389 BC (Hafner 1994). Similar processes are also documented for more recent settlements like Cortaillod-Est, dated in the Final Bronze period (Gassmann Reference Gassmann1984; Arnold Reference Arnold1986).
Cross Dating: Dendrochronology and Radiocarbon Dating
A sample of 13 architectonical wooden elements have been dated by radiocarbon. For nine of them, the last growth ring (cambium) has been dated by AMS. The other three dates come from conventional radiocarbon dates of groupings of outermost rings of the same log. Seven samples correspond to the foundational tree felling, and other six to timber logs used for the repair of the wooden structures after that date (see Table 2).
Results of the dendrochronological analysis of the wooden piles and horizontal elements used either for construction or/and repair purposes in La Draga.

Results of La Draga’s Chronological 9 Phases Model (OxCal 4.4.) after outlier elimination (68.3% confidence interval).

Results of La Draga’s Chronological 9 Phases Model (Chronomodel) after the elimination of outliers. (HPD and Phase Time Range 68.3%).

All samples are water-saturated wood sherds, which could have altered the original radiocarbon content. Waterlogged samples have poor cellulose preservation; although ABA treatment should have removed possible contaminants, it is not as effective dealing with problems that may have been caused by potential rootlets of plants living around or on the wood (Haesaert et al. Reference Haesaerts, Damblon, Nigst and Hublin2013). Since several different laboratories have been implied in dating wood samples from La Draga, differences in pretreatment may be among the causes for estimated ages differences, as has been suggested by other authors dealing with the same problem (Sjögren Reference Sjögren2011). Furthermore, there are relevant differences in the post-depositional alteration generated by the differential accumulation of water under the wooden platforms. Water should have been accumulated during humid winters and evaporated during dry summers. This summer evaporation, however, would have been different in open areas than in built areas, where the ground retained moisture (eastern part of the excavated area of this sector). As a result, organic material from open areas between buildings, and materials below wooden platforms would have reacted differently to waterlogged conditions, variations in phreatic level and the differential accumulation of decomposed organic material.
Unlike the rest of the logs, used as vertical piles, sample TT0468, the thickest preserved log, is the only dated horizontal board, and therefore its post-depositional reaction to waterlogged conditions would have been different.
RESULTS: THE TEMPORALITY OF THE ARCHAEOLOGICAL SITE’S BIOGRAPHY
Dendrochronological and Radiocarbon Data: Wiggle-Matching
Most radiocarbon dated wood samples associated to the same dendrochronological year 237/238 (Beta-481571, UA-62942, UA-62940, UA-62941, UBAR-314, UBAR-1308) pass the Ward and Wilson (Reference Ward and Wilson1978) test. Samples Beta-505910, UA-62943, UA-65467 appear to be clear outliers.
Using the IntCal20 calibration curve, the statistical combination of the 6 radiocarbon dates that passed the test give an estimate of 6311 ± 17 BP, and a calibrated confidence interval between 5313 cal BC and 5222 cal BC (68.3% interval). The median is situated at 5254 cal BC.
A preliminary wiggle-matching Bayesian model using most radiocarbon dates and the dendrochronological gaps between foundational piles and the ones assigned to later repairs has been estimated. The model has very poor agreement (Acomb= 28.7) given the presence of three additional outliers (UA-62940, UBAR-314, and Beta-505910). After deleting those outliers, general agreement increases significantly (Acomb= 136.6) (Figure 8). In practice, the size of the index of agreement in a wiggle-matching model varies depending on the way original dates over-quote or under-quote their respective lab errors, but also on how constrained the wiggle-match sequence is by the shape of the calibration curve (Wacker et al. Reference Wacker, Scott, Bayliss, Brown, Bard and Bollhalder2020). At this point, it is important to remark the clear bimodality of IntCal13 and IntCal20 calibration curves after 7100 BP, probably caused by variability of atmospheric 14C content at this time interval or by poor original sampling (Oms et al. Reference Oms, Martín, Esteve, Mestres, Morell, Subirà and Gibaja2016; Manen et al. Reference Manen, Perrin, Guilaine, Bouby, Bréhard, Briois, Durand, Marinval and Vigne2019; Reimer et al. Reference Reimer, Austin, Bard, Bayliss, Blackwell and Bronk Ramsey2020; Bayliss et al. Reference Bayliss, Marshall, Dee, Friedrich, Heaton and Wacker2020). This adds uncertainty to the estimation of the calendar age of outer tree rings. For the time being, only outer tree rings have been dated using radiocarbon. We are aware that using inner rings of some of the piles we will have the chance to get a steeper part of the calibration curve into our wiggle-match. Dendrochronological analysis is not yet finished and when more samples get extracted, the more they will “spread out” and the better the resulting precision will be. This can be achieved by minimizing the number of possible positions where the distribution of radiocarbon dates can match the calibration curve. For the moment, existing dates only serve as an initial hypothesis.
Wiggle-matching of dendrochronological ordered piles after deleting outliers. Calculated using OxCal 4.4. and IntCal20 calibration curve.

Our best model suggests an estimated date around 5293 cal BC (median of the 5312-5233 cal BC at 68.3%) for the precise moment original trees were logged (year 237/238). Tree ring 247 cannot be differentiated from tree ring 237/238. However, the model seems to differentiate successive tree rings correctly: TR248: 5284 cal BC, TR256: 5283 cal BC, TR259: 5275 cal BC. The last well documented repair (Tree ring at the year 265) has been documented at an estimated date around 5272 cal BC (median of the 5291–5212 cal BC at 68.3%).
Dating the First Occupation at La Draga
Wiggle-matching only allows for an estimate of the temporality of depositional events 1, 2, and 3, based on isotopic events associated with the last growth ring of piles used for construction and posterior repair. There are additional radiocarbon dated samples that have been stratigraphically associated with this first occupation (from Depositional Events 4, 5 and 6a, 7a, 8a). They do not pass the Ward and Wilson test and therefore we cannot assume directly the strict contemporaneity of all archaeological deposited material from this first occupation. Nonetheless, its duration was presumibly very short given the small number of tree rings between piles used for the initial foundation and the youngest piles used for repair (approximately 30 years).
In Sector A, Depositional Event 4 is statistically coherent around 5266 cal BC (median of the 5303–5217 confidence interval 68.3%), well within the most probable period of use of the wooden platforms estimated by the wiggle-matched model.
In Sector B, all dated samples from Depositional Event 5 pass the Ward and Wilson test and appear to be strictly contemporaneous with sampled dates from Depositional Event 8a. A combined date around 5271 cal BC (5298–5216 cal BC, 68.3% confidence interval) seems to be a good estimate for the moment of platform use and successive repairs. Although sample Beta-315052 from Depositional Event 6a seems to be older, all dates related with platform use and repairs from Sectors B and D pass the Ward and Wilson test. The same can be said about contemporaneous dated samples from Sector A.
Two dated samples come from Depositional event 7a from underwater Sector C and pass the Ward and Wilson test. One of these, however, Beta-27856, becomes an outlier when compared with all contemporary sampled dates related with this moment of use and repair of wooden platform.
Dated samples from depositional events 6b, 8b from Sector B and D, and depositional event 7b from Sector C, show recurrent estimates much younger than any sampled date from this first occupation, related with the use and repair of wooden platforms. All of them pass the Ward and Wilson test and give a combined estimate 68.3% confidence interval around 5206–5032 cal BC. They cannot be used to suggest the moment of use or repair of the wooden platform, although stratigraphically they are in close connection with horizontal timber boards. This apparent contradiction could be solved by considering hypothetically two differentiated moments of platform use, one centered around 5270 cal BC and the other around 5097 cal BC (median of the 68.3% confidence interval 5206–5030 cal BC). However, this hypothesis contradicts with dendrochronological data and the results of high-resolution spatial analysis (N. Morera, forthcoming) suggesting a single and relatively short occupation of no more than 30/40 years.
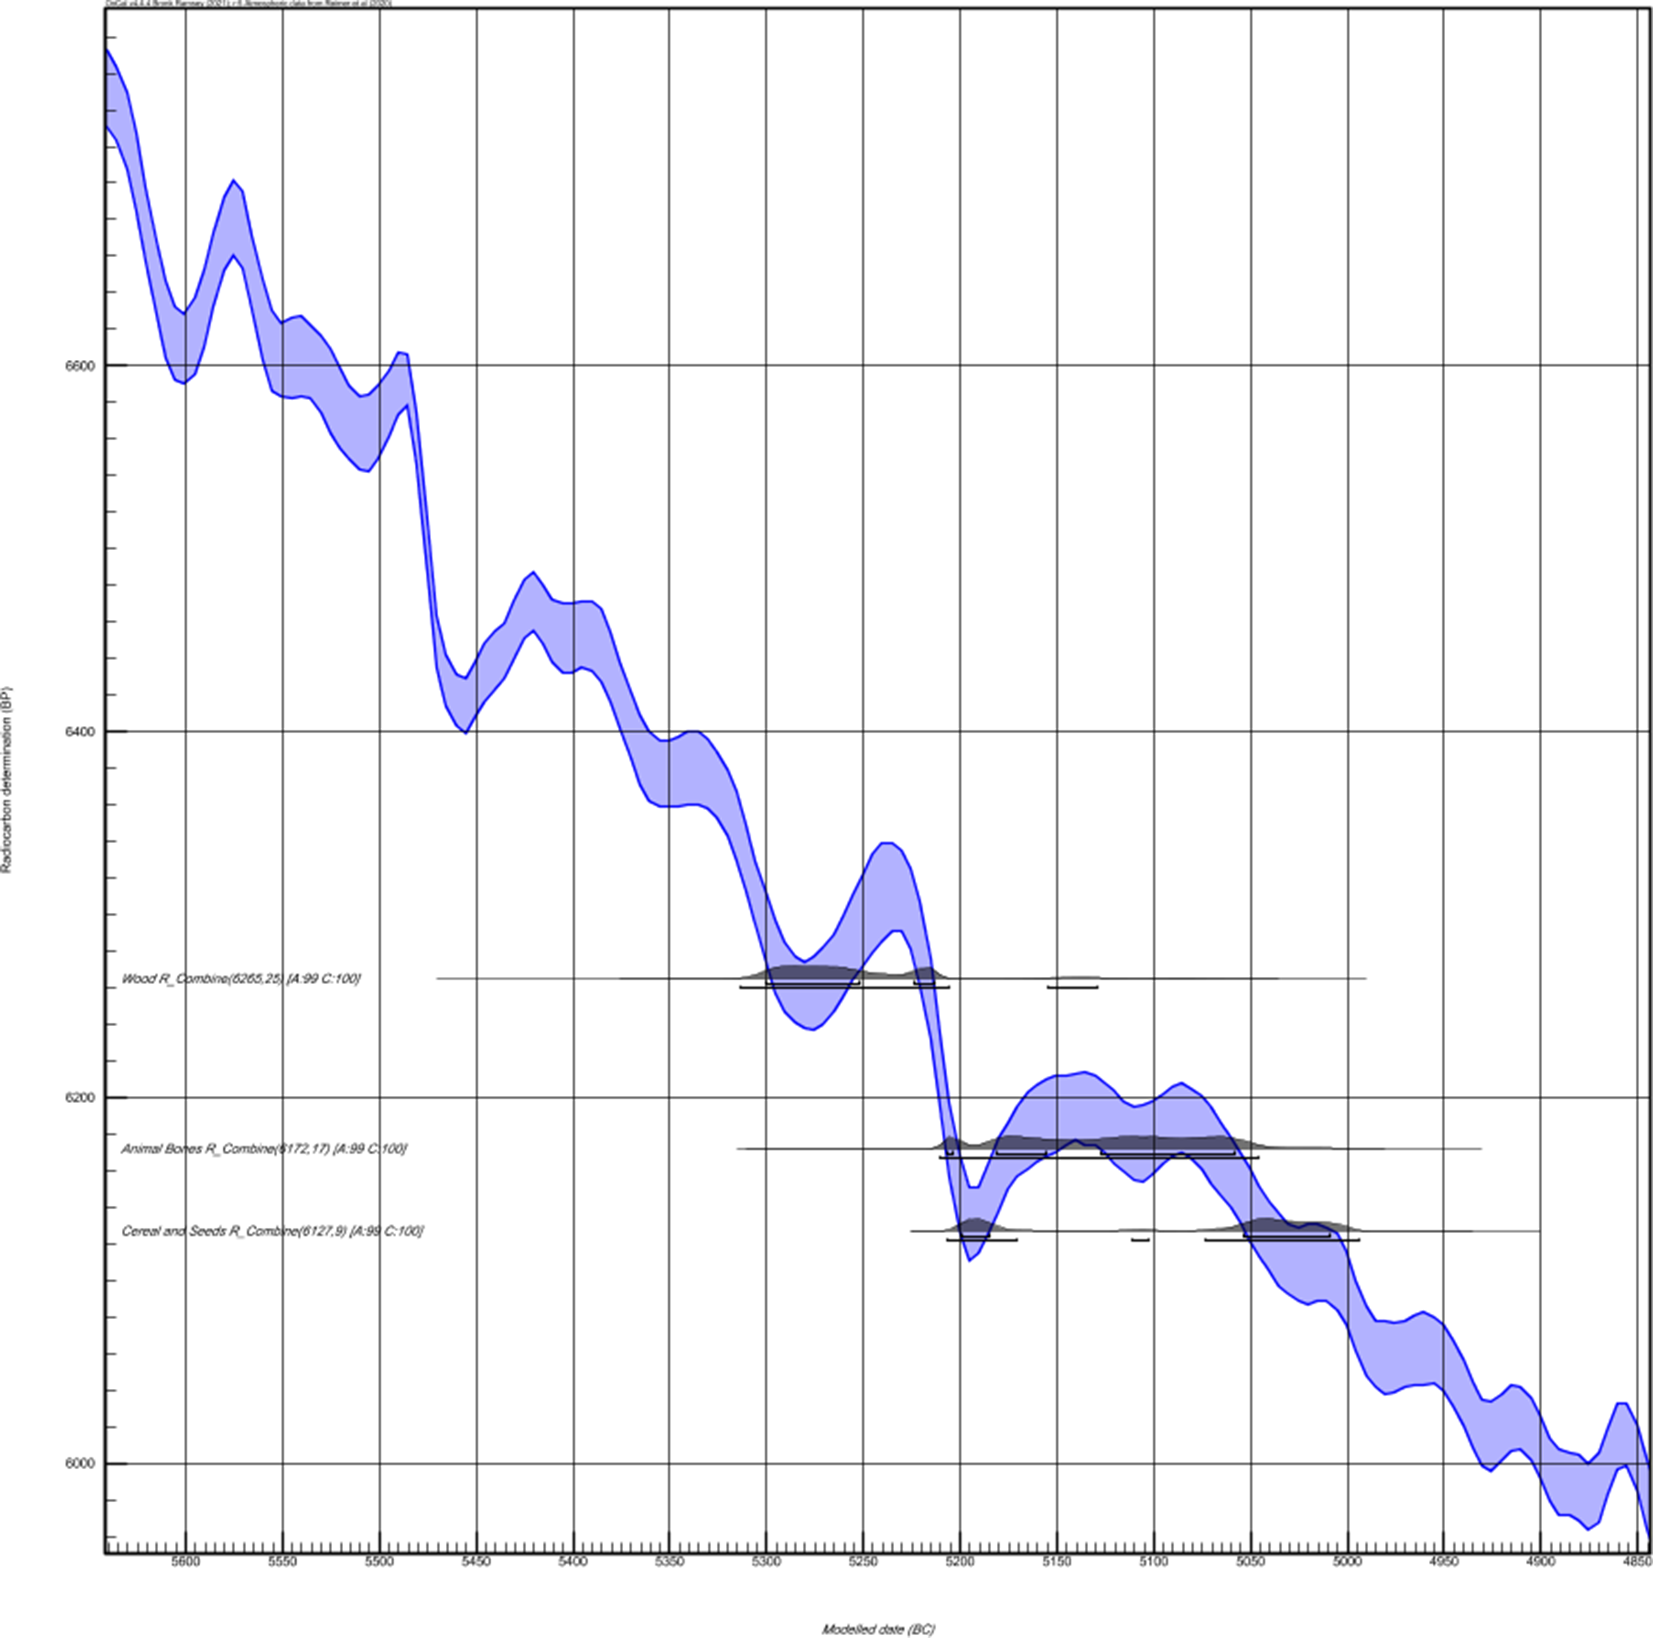
The reasons for this apparent chronological difference within the first occupation lie in post-depositional factors (Andreaki Reference Andreaki2022). A pre- and post-depositional subsidence of the original surface (Iriarte et al. Reference Iriarte, Cho, Revelles, Burjachs, Piqué, Palomo, Terradas and Peña-Chocarro2014) observed in Sectors D and B but not at Sector A- altered the original deposition at those areas. To test partially this post-depositional alteration hypothesis, we have compared differences in radiocarbon calibrated dates depending on the material of the dated sample. Wooden objects (Beta-137197 and Beta-137198) are clearly older than seeds coming from the same stratigraphic layer NAVII (Figure 9). Faunal samples show a clear stratigraphic inversion, where samples found at the top of the archaeological layer NAVII (Beta-588213; Depositional Event 8a), appear to be older than samples found at the bottom, in contact with the original lake substrate (Beta-588214; Depositional Event 8b). Social life occurred on platforms, but also on the ground surface, therefore material elements may have been deposited above horizontally disposed boards and below them. Puddled water below wooden platforms may have caused the slow sinking of material fallen from the platform during use (cereal grains and charcoals) (Andreaki Reference Andreaki2022), but there is also the possibility of the intentional anthropic burial of materials. No chronological difference should exist between samples found in contact with the preserved wooden elements, and those under them, found in contact with the original lake marl surface. The spatial microanalysis of animal bones gives partial support to this hypothesis (Morera et al. Reference Morera, López-Bultó, Barceló-Álvarez, Palomo, Terradas-Batlle and Piqué2019).
Comparison of wood, seeds and faunal samples from Sectors B and D, First Occupation. Using Oxcal 4.4 and IntCal20 calibration curve. In all three cases, R_Combine has been used to create the posterior distribution. In the case of wood and seed samples, this procedure pass Ward and Wilson test. In the case of faunal samples, there is an outlier (Beta-278255), 100 radiocarbon years older than the rest. See discussion in text.
Results of a model of 9 partially contiguous, partially sequential and partially overlapping phases and sequences. Oxcal 4.4. IntCal20 calibration curve.

An Event and Phase Model with stratigraphic constraints and temporal boundaries based on dendrochonological and Wiggle-Matching estimates. ChronoModel 2.0. IntCal20 calibration curve.

Results of a 9 Phases Chronological model. ChronoModel 2.0. IntCal20. Each Phase is depicted with a different color. The lighter color corresponds to the a priori confidence interval, whereas the darker color depicts the a posteriori Bayesian estimation.

It is then very difficult to identify the very last moment of this first occupation associated to the wooden structures. Some elements coming from the second occupation may have been infiltrated into the older occupation debris because of indirect pressure from the accumulation of travertine slabs above. Some light charcoal and seed samples would have floated as they felt in the water table, and as a result would not get sunk immediately, as in the case of heavier wooden artefacts. Furthermore, Depositional Event 28 appears to be a small pit excavated penecontemporaneously or after the start of the second occupation, and stratigraphically affecting the ground below.
The end of La Draga’s First Occupation and the probable abandonment of the site for some years can be explained by a combination of environmental changes that occurred on the shores of Lake Banyoles, given intense forest exploitation and the geomorphological evolution of the lake shoreline. Although some short and temporal reoccupations cannot be excluded given the number of piles that have not yet been dendrochronologically dated, a subsidence of the ground surface of those parts of the settlement nearer to the shoreline marks a probable interruption of social life at the site, as the micromophological data suggest. Those analysis suggest that the ground subsidence was already present before the first occupation, to a lower degree, although it would probably not have been perceptible to the inhabitants of La Draga. In fact, the earlier beginning of this subsidence at a smaller degree is what made possible the accumulation of organic materials in Sectors B–D and the formation-preservation of peaty strata. Further subsidence during the following years and the parallel increase of the water table in this sector of the site may have been the reason of its abandonment. The constant water presence in this area would have also delayed the site’s re-occupation for some time.
Dating the Second Occupation at La Draga
There is a possible gap of approximately 100 years (or a bit more) between the collapse of the wooden structures and the beginning of a new occupation, a time interval in which the site may have been abandoned. Signs of exposure have been detected microscopically in the sediment of Sector D just above the preserved timber planks, highlighting a period of exposure before the arrangements for the new occupation (Andreaki Reference Andreaki2022). Pollen data retrieved from the beginning of the new occupation suggest that the forests around the new settlement would have experimented a clear recovery after a period of local deforestation during the first occupation (Revelles Reference Revelles2017, Reference Revelles2021; Revelles et al. Reference Revelles, Burjachs, Morera, Barceló, Berrocal, López-Bultó, Maicher, Le Bailly, Piqué, Palomo and Terradas2017). 100 years seems a likely estimate for the time interval during which the forest recovered.
This new occupation is associated with the arrangement of travertine slabs forming a pavement, perhaps as a kind of insulation platform to reduce the passage of groundwater and isolate the occupation floor from the mud. The new occupation would have been longer than the first, and some different moments can be distinguished (Andreaki Reference Andreaki2022).
In Sector A, the first and second occupations are clearly differentiated. A two sequential phases OxCal model gives a Aoverall=134.9 after deleting three outliers. The end of the first occupation can be estimated around 5252 cal BC (median of the 68.3% confidence interval), a transition between both phases around 5211–5199 cal BC, and the beginning of the new occupation after a probable hiatus of more than 50 years, well attested in the settlement areas less affected by the changing levels of the lake’s water table.
Material from hearths in Sector A (Depositional Events 9-19), made of travertine slabs located in close stratigraphic contact with the original lake marl surface, is the oldest from this occupation. All available dated samples (bones and seeds) have been combined after passing successfully the Ward and Wilson test, suggesting a date around 5066 cal BC (median of the 5205–5013 cal BC, 68.3% confidence interval). Two cereal samples from Sector D (Beta-315050, Beta-315051) are statistically contemporaneous. They come from two different Depositional Events: 29 and 30. Depositional Event 29 is a clay layer with high presence of organic material immediately above wooden collapsed materials from previous occupation. Depositional Event 30 is a sediment of dark color, with little presence of archaeological material and mostly consisted of decayed organic matter, whose inferior part is in contact with the travertine paved area (Andreaki Reference Andreaki2022). If we consider only the oldest dates from those depositional events (Beta-422871, Beta-315050 and Beta-315051), a date around 5140 cal BC would be a good preliminary estimate for the beginning of the new occupation. The reoccupation of Sectors D (near the lake shoreline) and Sector A (700 m away) would have been contemporaneous.
In Sector A, a new and later rearrangement of settlement areas can be suggested given the statistical difference between dates from the bottom of structures E258 and E261 (Beta-428247, Beta-422872) (Depositional Events 22, 23) and dates sampled at the top of the sediment filling those structures (Beta-422869, Beta-425198) (Depositional Events 25, 26). The oldest dates pass the Ward and Wilson test and can be considered strictly contemporaneous within the interval 5043–5007 cal BC. Younger dates from the same structures, together with other dates from samples found at E263, and the top part of structures E258 and E261 are clearly later (Depositional Events 24, 27), and they would be dated around 4930–4882 cal BC (68.3% confidence interval), suggesting a possible modification of previous structures. Event 31, from Sector D, a sample of fauna from a sandy greyish sediment containing travertine sand and fragmented slabs, and stratigraphically correlated with the upper part of the travertine slabs found in the paved area, would also belong to this very last occupation.
Radiocarbon dates from underwater Sector C do not change the broader conclusions. Four faunal bones and cereal seeds come from this sector. Statistically, the four radiocarbon dates do not pass the Ward and Wilson (Reference Ward and Wilson1978) test. The stratigraphically deepest dated sample appears to be older (68.3% confidence interval: 5372–5067 cal BC) than samples coming from superior layers (68% confidence interval: 5216–4981 cal BC). Dates show however a relevant degree of chronological overlapping.
Global Chronological Model
A detailed chronological model has been calculated based on the assumption of 9 differentiated “phases” (Figure 10). The first one integrates the original tree-felling and the pile-dwellings construction (Phase “Construction”, Depositional Events 1, 2, and 3), whereas the Phase “Use and Repair” brings together all the samples associated to wooden structures use and repair (Depositional Events 4, 5, 6a, 7a, 8a). A single outlier (Beta-425194) has been deleted. These first two phases have TPQ and a TAQ constraints based on the results of the previous wiggle-matched model based on the difference in the number of tree rings between logs used for construction and logs used in later repairs from 5290 cal BC until 5250 cal BC. Both estimates have 10 years of standard error.
After a gap of 50 years representing a moment of abandonment of the local area, a “Transitional Phase” collects samples mostly from first occupation that experimented some form of stratigraphic inversion as a consequence of karstic subsidence and changing levels in phreatic level (Depositional Events 6b, 7b, 8b, 28). During this chronologically separated transition phase, reuse of space is not excluded.
The Second Occupation is analyzed as configured by three different moments: “Second Occupation” (Depositional Events 9–21 from Sector A, Depositional Events 29 and 30 from Sector D), “Spatial Rearrangement” (Depositional Events 22 and 23 from Sector A), and “Last Neolithic Occupation” (Depositional Events 24–27 from Sector A, and Depositional Event 31 from Sector D). Three posterior phases distinguish the dated samples found in more recent layers, affected by ancient and modern erosion.
A preliminary OxCal implementation of this model distinguish four outliers: HD-15451, UBAR-313, UBAR-311, too modern, although global model agreement is very high (Amodel=108 Aoverall=101). UBAR-311 is a problematic non-AMS sample, with an excessively long standard lab error. UBAR-313 is another non-AMS dated sample, and HD-15451 is an isolated finding. Beta-315051 is another problematic date. Initially considered characteristic of the second occupation, it was found very deep in the stratigraphic sequence (NAIV), but in close contact with travertine samples above. It seems much more related with use and repair of wooden structures than with later phases. We have deleted those dates and executed the model again, with a huge gain in agreement (Amodel =167.8, Aoverall= 167.8).
According to this model (Figure 10, Table 3), a first occupation on the shores of lake Banyoles can be placed along the temporal interval of 5302–5247 cal BC. The hiatus in which areas of the settlement were probably abandoned, although temporal and short reoccupations cannot be excluded would have arrived until ca. 5100 cal BC. The depositional events integrated into the so-called Transitional Phase appear to be later that the most probable start of the Second Occupation. On one hand, the oldest dates for second occupation (Beta-422871 and Beta-315050), around 5200 cal BC, are a priori too old for dating properly the moment the original ground was insulated with travertine slabs. The remaining dates are grouped around a median of 5075 cal BC. The best hypothesis would be to make emphasis on a relatively long period of abandonment (100 years) and a relatively later reoccupation with restructuring of the ground surface. On the other hand, most dated samples from the Transitional Phase are small seeds between the remains of the wooden debris and the travertine slabs, that may have been affected from the second occupation and the influence of groundwater.
The second occupation would be longer than the first one, from 5075 cal BC until 4860 cal BC. Two successive settlement rearrangements may be suggested, the first around 5061–5025 cal BC and the second and last one around 4917–4821 cal BC. Very few remains of occupation exist for the period after 4800 cal BC.
ChronoModel 2.0 (www.chronomodel.fr) has a different way to calculate the a posteriori temporal intervals. It is based on the concept of Event (Figure 11). An Event is a point in time for which a hierarchical Bayesian statistical model can be defined (Lanos and Dufresne Reference Ph and Ph2019). In our case, it corresponds to what we have defined as a depositional event, when the temporal duration can be argued as less than the lab error of the isotopic date. A Phase is a group of Events, and it is here defined as a series of related depositional events, whose joint temporal duration exceeds 30–40 years. The modeling approach is very different between OxCal and ChronoModel, although in both cases the temporal duration of phases is estimated in terms of the difference between a start and an end event. We have used exactly the same number and definition of phases in the models implemented in OxCal and ChronoModel. ChronoModel differs from the OxCal model in the way depositional events and their stratigraphic anterior/posterior constraints have been included. Unlike Event model, the Phase does not respond to a statistical model: indeed, we do not know how events can be a priori distributed in a phase. However, we may question the beginning, end or duration of a phase from the Events that are observed there (query). A level of a priori information can be added: the Events from one phase may be constrained by a known duration and a hiatus between two phases can be inserted (this imposes a temporal order between two groups of Events). In ChronoModel, constraints link events and not calibrated dates. (Lanos et al. Reference Lanos, Philippe, Lanos and Dufresne2016; Lanos and Philippe Reference Lanos and Philippe2017).
The idea is to estimate the unknown date of phases based on dated samples associated to Events, which in their turn, are associated to Phases. The event model, implemented in ChronoModel, combines contemporary dates, t 1 … t n , with individual errors, σ 1 … σ n in order to estimate the unknown calendar date θ. The following equation shows the stochastic relationship between t i and θ :
 $${t_i} = \theta + {\sigma _i} + \varepsilon _i^{CM}$$
where
 $$\varepsilon _i^{CM}\; \sim \;\;N\left( {0,1} \right)$$
for i=1 to n and
$$\varepsilon _i^{CM}\; \sim \;\;N\left( {0,1} \right)$$
for i=1 to n and $\varepsilon _i^{CM}$
, …,
$\varepsilon _i^{CM}$
, …, $\varepsilon _n^{CM}$
are independent. θ is the unknown parameter of interest and σ
1
… σ
n
are the unknown standard deviation parameters. That means that each parameter t
i
can be affected by errors σ
i
coming from different sources (Lanos and Philippe Reference Lanos and Philippe2017).
$\varepsilon _n^{CM}$
are independent. θ is the unknown parameter of interest and σ
1
… σ
n
are the unknown standard deviation parameters. That means that each parameter t
i
can be affected by errors σ
i
coming from different sources (Lanos and Philippe Reference Lanos and Philippe2017).
The temporal position of each phase on the calendar scale is estimated according to the events included in it. The following information are given for each phase:
-
The beginning of a phase, α, reflects the minimum of the r events included in the phase:
 $$a = min (\theta j,\ j = 1 \ldots r)$$
-
The end of a phase, β, reflects the maximum of the r events included in the phase:
$$\beta = max (\theta j, \ j = 1 \ldots r)$$
-
The duration, τ, is the time between the beginning and the end of a phase:
$$t = \beta - a$$


The posterior distribution of all these elements may be approximated by MCMC methods and statistical results such as the median, the standard deviation and so on, may be estimated (Lanos and Dufresne Reference Ph and Ph2019).
The idea is to reduce the uncertainty of calendar date estimates using hypothesis of starts and ends based on stratigraphic relationships, or the number of tree rings between different radiocarbon samples of the same tree-ring sequence. Both computer programs apply Bayesian probability reasoning to define the proper limits of their assumed broad contemporaneity in terms of the spread of the dates, and the interphases or boundary temporal limits of the phase. In ChronoModel, the radiometric date of an event is assumed to be affected by an unknown error sigma, which will be estimated a posteriori. If this error is too large, compared to the error of other dates, we will be dealing with an “outlier,” and in this case, OxCal would have displayed an A i lower than 60%. On the other side, in ChronoModel, there is no need to remove this date: it will be automatically discounted because of this high individual posterior error (Lanos and Philippe Reference Lanos and Philippe2018, Reference Lanos and Philippe2020). Consequently, in ChronoModel, there is no sorting of dates according to outlier elimination steps: all dates are considered, but some of them are later discounted, and as a result, do not affect the phase temporal range when they diverge from the other dates (Lanos, personal communication).
To reproduce exactly the model previously estimated using OxCal, two temporal bounds were included in our ChronoModel estimation (Figure 11), representing the dendrochronologically deduced temporal limits: 5293 cal BC for the beginning of the process (tree felling), and 5272 cal BC for the last documented repair. We have added 10 years in this last case concerning the uncertainty of the last moments of wooden platforms occupation. After that bound we have defined a “Transition Phase,” with an additional uncertainty of 100 years, and a gap of 50 years before the beginning of the second occupation. This is exactly the same model we defined using OxCal 4.4. The second occupation is differentiated from the later spatial arrangement and the last evidence of a Neolithic Occupation. Post-Occupation evidence has been integrated into three different phases.
MCMC has been configured with 1000 burn-in iterations, 500 further iterations for the adapting cycle, and finally 100,000 iterations for the final acquisition of posterior distributions (thinning = 10). Gelman-Rubin test is not yet implemented in the current version of ChronoModel 2.0. Consequently, we have checked the MCMC convergence visually by locking at the stability of autocorrelation plots. We have also checked the acceptance rate at 44% in the case of a Metropolis-Hastings with a Gaussian random walk (Roberts et al. Reference Roberts and Rosenthal2001), and the decorrelation of the variables (Lanos, personal communication).
The same outliers that were deleted in the OxCal model were eliminated, once we have checked that acceptance rate in ChronoModel for those dates was also around the 44% threshold.
Results obtained by ChronoModel are in good consonance with those obtained with OxCal (Figure 12, Table 4). Both models give support to the hypothesis of a hiatus of nearly 100 years between the end of the first occupation and the beginning of the second, but precise estimates for their start and end slightly differ. It is important to consider, however, that this is not an occupation phase, with clear-cut start and end, but a region of temporal uncertainty where post-depositional processes affected previous and posterior stratigraphic layers.
Both models agree with an estimate for the beginning of the second occupation around 5090 cal BC. Nearly 70 years after, there is evidence of a spatial arrangement of built spaces. According to both models, the last evidence of Neolithic occupation was not later than 4780 cal BC.
Using the above stratigraphical ordering and radiocarbon estimates for the duration of depositional events, a general temporal sequence was defined based on Allen algebra estimated temporal relationships (Allen Reference Allen1983; Zoghlami et al. Reference Zoghlami, De Runz, Akdag and Pargny2012; Dye and Buck Reference Dye and Buck2015; Belussi and Migliorini Reference Belussi and Migliorini2017; Drap et al. Reference Drap, Papini, Pruno, Nucciotti and Vannini2017; Barceló and Andreaki Reference Barceló and Andreaki2020) (Figure 13). The period of transition between the first and second occupation remains in the temporal interval from 5200 to 5100 cal BC, although there is a clear overlapping with depositional events from the second occupation (Depositional Events 29 and 21).
Allen Algebra adapted diagram for site occupational temporal sequence representing depositional events E-1 to E-31 and their respective phases. Black vertical lines mark the end of clear evidence from first occupation (5200 cal BC), as well as the beginning (5100 cal BC) and end of second occupation (4800 cal BC).

DISCUSSION
La Draga in the Chronological Context of the Early Neolithic of the Western Mediterranean Region
Very few traces of pre-farming, Hunter-Gatherer Mesolithic occupations, are known for the Lake Banyoles area. At Bauma del Serrat del Pont (Tortellà) (Alcalde et al. Reference Alcalde, Saña and Tornero2009; Alcalde and Saña Reference Alcalde and Saña2017), 20 km from La Draga site, in a slightly different ecological niche, a human occupation dated around 7380–6000 cal BC has been identified. Its material culture can be attributed to a local technological tradition referred to as “notches and denticulate Mesolithic” (Martínez-Grau et al. Reference Martínez-Grau, Jagher, Oms, Barceló, Pardo-Gordó and Antolín2020), which developed locally in NE Iberian Peninsula and extended from the Pyrenees to the Mediterranean seaboard and in the Ebro basin. Bauma del Serrat del Pont is a small rock shelter, and it was occupied repeatedly during this period, with at least five different seasonal occupations registered, the last one extending until ca. 6000 cal BC. The archaeological record suggests a recurrence of short occupations by small groups, probably between the end of summer and the beginning of winter, practicing a very homogenous strategy based on intensive exploitation of medium and large mammals. There is evidence derived by marine valves concerning river fishing and travels to the Mediterranean coast (Alcalde and Saña Reference Alcalde and Saña2017).
The abandonment of Mesolithic occupations in the area near the Banyoles lake is not an isolated historical event. Studies based on the sum of probability intervals of radiocarbon dates have suggested a decay in the number of known sites between 5900 and 5700 cal BC (Balsera et al. Reference Balsera, Díaz-del-Río, Gilman, Uriarte and Vicent2015; Bernabeu et al. Reference Bernabeu, García Puchol, Barton, McClure and Gordó2016; Bernabeu et al. Reference Bernabeu, Lozano and Pardo-Gordó2017; Fyfe et al. Reference Fyfe, Woodbridge, Palmisano, Bevan, Shennan, Burjachs, Legarra Herrero, García Puchol, Carrión, Revelles and Roberts2019; Pardo-Gordó and Barceló Reference Pardo-Gordó and Barceló2020; Martínez-Grau et al. Reference Martínez-Grau, Morell-Rovira and Antolín2021). Bernabeu et al. (Reference Bernabeu, Lozano and Pardo-Gordó2017) have linked this occupational interruption with dry and cold intervals having occurred regularly on the area. One of them would have happened before the arrival of farmers, possibly related with the North Atlantic ice rafting debris 5b IRD event, dated around 5900 cal BP (Frigola et al. Reference Frigola, Moreno Caballud, Cacho Lascorz, Canals Artigas, Sierro Sánchez and Flores Villarejo2007; Wanner et al. Reference Wanner, Solomina, Grosjean, Ritz and Jetel2011; Finné et al. Reference Finné, Woodbridge, Labuhn and Roberts2019). We must be careful about using these climatic anomalies to explain changes in the archaeological record. The Banyoles lake is in a humid region and such an event would not have implied dramatic changes in the landscape, as might have happened in more arid regions such as the southeast of the Iberian Peninsula. We must bear in mind that in the case of the lake, a phase of higher humidity or an increase in rainfall (lake flooding and inundation) would probably have more effect than aridity. With available data, we cannot be certain whether a temporal increment in aridity caused variations on the lake shoreline and the phreatic water level to explain the probable abandonment of the settlement for a while. The last volcanic eruptions in the neighboring volcanic area of Garrotxa-Olot—20 kms from the lake—may have also some impact on depopulation (Maria Saña, personal communication).
In stratigraphic continuity with the last Mesolithic occupation, but nearly 500 years after (5470–5380 cal BC), a new occupation at Bauma del Serrat del Pont differentiates from previous occupations by the presence of a very early appearance of Cardial pottery (Alcalde et al. Reference Alcalde, Molist and Saña2001; Alcalde et al. Reference Alcalde, Saña and Tornero2009; Alcalde and Saña Reference Alcalde and Saña2017; Palomo et al. Reference Palomo, Gassiot, Bosch, Mazzucco, Tarrús, Díaz, Andreaki, Obea, Barceló and Salvador2021). It is a very short occupation by a small group of people within a rock shelter, and a very thin stratigraphic layer. No remains of domestic animals or plants have been discovered. Cova del Toll, at 86 km southwest of Bauma del Serrat del Pont, also shows the same kind of pottery material in an archaeological record with similar dating (5510–5310 cal BC; 5490–5290 cal BC) (Cebrià et al. Reference Cebrià, Fontanals, Martín, Morales, Oms and Rodríguez-Hidalgo2014; Oms et al. Reference Oms, Esteve, Mestres, Martín and Martins2014, Reference Oms, Terradas, Morell and Gibaja2018). It is associated mostly to wild animals, but with possible presence of ovis/capra remains.
The beginning of the first occupation at La Draga is clearly later (from 5290 cal BC onwards, as suggested in this paper), and the Cardial pottery decoration seems also to be stylistically more developed than the oldest sherds from Bauma del Serrat del Pont and Cova del Toll (Bosch and Tarrús Reference Bosch, Chinchilla and Tarrús2011; Bosch Reference Bosch, Bosch, Buxó, Chinchilla, Palomo, Piqué and Saña2012). Nevertheless, immediately before the foundation of La Draga settlement, there is some indirect evidence of human occupation on the shores of Lake Banyoles, although it has not produced any archaeological record up to now. Based on the thickness variability of oak trunks used as vertical piles in the construction of the wooden platforms at La Draga, the number of tree rings and their estimated age spread, dendrochronologists suggest that timber came from already cleared different forest stands. According to the known growth rate of Mediterranean oaks, this period of area exploration before full sedentary settlement can be estimated in ca. 150 years (López-Bultó et al. forthcoming).
The arrival of new populations with a new economy and a new material culture to the Northeastern region of the Iberian Peninsula around the Banyoles lake coincides with a humid period with very dense vegetation cover. Those conditions would have been detrimental to the easy expansion of agricultural practices (Pérez-Obiol et al. Reference Pérez-Obiol, Jalut, Julià, Pèlachs, Iriarte, Otto and Hernández-Beloqui2011; Moreno et al. Reference Moreno, Sancho, Oliva, Bartolome, Cacho, Stoll, Edwards, Cheng and Hellstrom2013; Berger et al. Reference Berger, Delhon, Magnin, Bonté, Peyric and Thiébault2016; Peñuelas et al. Reference Peñuelas, Sardans, Filella, Estiarte, Llusià and Ogaya2017; Bergadà et al. Reference Bergadà, Cervelló, Edo, Cebrià, Oms and Martínez2018; Brisset et al. Reference Brisset, Burjachs, Navarro and de Pablo2018; Revelles et al. Reference Revelles, Burjachs, Palomo, Piqué, Iriarte, Pérez-Obiol and Terradas2018; Mercuri et al. Reference Mercuri, Florenzano, Burjachs, Giardini, Kouli and Masi2019; Revelles Reference Revelles2021). This fact could offer an explanation to the scarcity and dispersion of early Neolithic sites. At a very local level, a climatic anomaly around 5500–5000 cal BC suggests some abrupt cooling associated to temporally reduced precipitation (Jalut et al. Reference Jalut, Amat, Bonnet, Gauquelin and Fontugne2000; Frigola et al. Reference Frigola, Moreno Caballud, Cacho Lascorz, Canals Artigas, Sierro Sánchez and Flores Villarejo2007; Vegas et al. Reference Vegas, Ruiz-Zapata, Ortiz, Galan, Torres and García-Cortés2010; Pérez-Sanz et al. Reference Pérez-Sanz, González-Sampériz, Moreno, Valero-Garcés, Gil-Romera and Rieradevall2013). The hypothesis of colder environmental conditions at the time of settlement foundation is reinforced by δ18O values obtained from archaeological wooden remains of Phase I of La Draga (Aguilera et al. Reference Aguilera, Ferrio, Araus, Tarrús and Voltas2011). Differences between sub-fossil and extant samples in δ13C and δ18O records suggest slightly lower temperatures and higher plant water availability than at present during the establishment of agricultural practices at the site. These environmental conditions at the time of the first settlement building could possibly explain the exposure of the shoreline of Banyoles Lake allowing its human occupation. A regression of the lake level, exposing carbonate sandy beaches at some points along the lake margin, would make it attractive for Neolithic communities to settle in a place devoid of vegetation. This would be a highly valued space in the context of a densely forested landscape.
Cardial Pottery for the first occupation in La Draga (ca. 5293–5272 cal BC/5298–5245 cal BC) are characterized by the predominance of shell impressions, together with dragged shell impressed motives, organized in one or two bands parallel to the vessel rim, that were absent in older settlements (Bosch and Tarrús Reference Bosch, Chinchilla and Tarrús2011; Bosch Reference Bosch, Bosch, Buxó, Chinchilla, Palomo, Piqué and Saña2012). The relative frequency of shell and comb impressions, and the presence of smooth non digitized cords seems analogous to elements from the French region of Languedoc (Manen and Guilaine Reference Manen and Guilaine2007; Binder et al. Reference Binder, Clop, Convertini, Manen and Sénépart2010; Bosch Reference Bosch, Bosch, Buxó, Chinchilla, Palomo, Piqué and Saña2012; Oms et al. Reference Oms, Terradas, Morell and Gibaja2018; Oms Reference Oms, Esteve, Mestres, Martín and Martins2014; Breu and García Reference Breu and Garcia2017; Palomo et al. Reference Palomo, Gassiot, Bosch, Mazzucco, Tarrús, Díaz, Andreaki, Obea, Barceló and Salvador2021). Radiocarbon dates from Leucate-Corrège are within the limits of La Draga’s first occupation (Manen et al. Reference Manen, Perrin, Guilaine, Bouby, Bréhard, Briois, Durand, Marinval and Vigne2019). The use of flint raw material from the Narbone-Sigean area at La Draga at this time is another evidence of the particular relationship with South France (Terradas et al. Reference Terradas, Bach Gómez, Borrell, Bosch, Clemente-Conte, de Diego, Edo, Gibaja, Herrero-Otal and López-Bultó2021) during the first occupation.
Geomorphological and sedimentary history of Lake Banyoles has always been really very active and complex (Valero-Garcés et al. Reference Valero-Garcés, Zeroual, Kelts, Benito, Baker and Gregory1998; Höbig et al. Reference Höbig, Weber, Kehl, Weniger, Julià and Melles2012; Lacey et al. Reference Lacey, Leng, Höbig, Reed, Valero-Garcés and Reicherter2016) and it would have affected human activites at their changing shores. The end of La Draga’s First Occupation and the suggested abandonment of the site for some years can be explained by a combination of environmental changes that occurred on the shores of Lake Banyoles because of intense forest exploitation and the geomorphological evolution of the shoreline which also affected the ground near the lake.
The intensive and continued exploitation of forests for various activities, such as obtaining raw material for tools, platforms, and dwellings, or as fuel in several domestic and communal productions became the main cause for the anthropic transformations documented at the end of the First Occupation (Revelles Reference Revelles2017; Mercuri et al. Reference Mercuri, Florenzano, Burjachs, Giardini, Kouli and Masi2019). Human impact on the forests around the Banyoles lake is not associated with increasing levels of Cerealia-t pollen nor spores of coprophilous fungi. It suggests the limited impact of agriculture and herding on the landscape but the relevance of timber procurement for building issues as a probable cause for small-scale forest modifications (Revelles et al. Reference Revelles, Antolín, Berihuete, Burjachs, Buxó, Caruso, Palomo, Piqué and Terradas2014; Revelles Reference Revelles2021). According to excavation results, the density of oak trunks used for building wooden platforms and other structures clearly exceeds 1 trunk per square meter, which amounts to the felling of 1000 trees, only for the excavated area of 800 m2 (Revelles et al. Reference Revelles, Burjachs, Palomo, Piqué, Iriarte, Pérez-Obiol and Terradas2018), and the felling of 18750 trees for the estimated 15,000 m2 of the settlement’s total extension. Using modern figures for oak density in Pyrenean forests (927 trees per hectare. Cf. Banquét et al. Reference Banquét, Grau, Martínez-Vilalta and Vayreda2013), this would have involved the logging of twenty hectares of forest in a very short period.
The site is reoccupied less than 100 years after the abandonment of the first occupation, and important work is made for conditioning the ground surface. This new occupation, 5111–4788 cal BC/5095–4861 cal BC), coincides with the full spread of farming economies in the whole NE Iberian Peninsula. This scenario of human expansion in the area explains the increase in the number of contemporary archaeological sites around the Banyoles Lake. Nearby la Draga, we must consider the case of the open-air settlement of Plansallosa, whose first occupation presents some materials that can be related to La Draga’s second occupation, but with imprecise dates around 5250–4940 cal BC and 5230–4910 cal BC. Balma del Serrat del Pont (Alcalde et al. Reference Alcalde and Saña2017) also shows some short occupations that can be contemporaneous or slightly later than La Draga’s second occupation. La Dou is a sparsely distribution of hardly contemporaneous huts over an area of 800 m2, clearly later than archaeological evidence from La Draga. In the lowlands around the Mediterranean coast, at 50 km from Banyoles Lake, two new settlements have been identified at a swamped landscape near the shoreline (Ca n’ Isach, Puig Mascaró). At Serra del Mas Bonet (Vilafant) (Rosillo et al. Reference Rosillo, Palomo, Tarrús, Bosch, Antolín and Campeny2012), an open-air settlement has been excavated (4909-4862 cal BC). In general, we can say that the expansion of farming settlement around the Banyoles lake area is contemporaneous with Full Neolithic population expansion in the Northeastern Iberian Peninsula (Barceló Reference Barceló2009; Martín et al. Reference Martín, Edo, Tarrús, Clop, Manen, Convertini, Binder and Sénépart2010; Oms et al. Reference Oms, Martín, Esteve, Mestres, Morell, Subirà and Gibaja2016; Bernabeu et al. Reference Bernabeu, Lozano and Pardo-Gordó2017; Oms Reference Oms2017; García Puchol et al. Reference García Puchol, Diez Castillo and Pardo-Gordó2018; Manen et al. Reference Manen, Perrin, Guilaine, Bouby, Bréhard, Briois, Durand, Marinval and Vigne2019; Martínez-Grau et al. Reference Martínez-Grau, Jagher, Oms, Barceló, Pardo-Gordó and Antolín2020).
No Neolithic remains can be dated in La Draga after 4800 cal BC. Balsera et al. (Reference Balsera, Díaz-del-Río, Gilman, Uriarte and Vicent2015), Bernabeu et al. (Reference Bernabeu, Lozano and Pardo-Gordó2017), García-Puchol et al. (Reference García-Puchol, Castillo and Pardo-Gordó2017, Reference García Puchol, Diez Castillo and Pardo-Gordó2018 ), Drake et al. (Reference Drake, Blanco-González and Lillios2017), Fyfe et al. (Reference Fyfe, Woodbridge, Palmisano, Bevan, Shennan, Burjachs, Legarra Herrero, García Puchol, Carrión, Revelles and Roberts2019), Pardo-Gordó and Barceló (Reference Pardo-Gordó and Barceló2020) have argued about a probable decline in accumulated probability of dating archaeological sites after 4700 cal BC, and hence a relevant change in settlement patterns and population estimates from this date on. The causes of this sudden “bust” following the demographic boom of period around 5100/5000 cal BC remain unclear, but it should be related with the rapid fission within early farming communities, fission in turn caused by competing centrifugal and centripetal economic forces within small-scale egalitarian groups (Leppard Reference Leppard2022). Internal (Shennan et al. Reference Shennan, Downey, Timpson, Edinborough, Colledge and Kerig2013; Bernabeu et al. Reference Bernabeu, Barton, Pardo-Gordó and Bergin2015, Reference Bernabeu, Lozano and Pardo-Gordó2017) and externals drivers (Gronenborn Reference Gronenborn2009; Walsh et al. Reference Walsh, Berger, Roberts, Vanniere, Ghilardi, Brown, Woodbridge, Lespez, Estrany, Glais, Palmisano, Finné and Verstraeten2019) have been proposed to explain this phenomenon. In any case, at la Draga, post-depositional activity and erosion of the upper layers at the site cannot allow explaining the possible abandonment of the site nor its connection with higher scale depopulation trends in temperate Europe, like those analyzed by Shennan et al. (Reference Shennan, Downey, Timpson, Edinborough, Colledge and Kerig2013) among many others. At La Draga, no particular geomorphological event seems to be related with the last evidence of Neolithic occupation, nor we have any evidence regarding a change in local environmental circumstances after 4800/4700 cal BC. Erosion has heavily affected the upper layers of La Draga, however, and archaeological remains are not as abundant or well preserved than those from the first occupation. From 4500 cal BC onwards, that is, during the Middle Neolithic period, the Lake Banyoles area would have been less frequented than in the previous period, although not depopulated. Short time occupations are known, around Serinyà, during the so-called Post Cardial Neolithic period (4500–3900 cal BC) (Revelles et al. Reference Revelles, Antolín, Berihuete, Burjachs, Buxó, Caruso, Palomo, Piqué and Terradas2014). A relevant impact of agricultural practices is not well confirmed until Late Neolithic-Chalcolithic (after 3500 cal BC), when short deforestation processes occur, producing a combination of evidence of crops (Cerealia t-type) and weeds (Plantago major-media, Chenopodiaceae) and local fire episodes affecting riparian forests, probably associated with slash-and-burn agriculture (Revelles et al. Reference Revelles, Antolín, Berihuete, Burjachs, Buxó, Caruso, Palomo, Piqué and Terradas2014). Post-Occupation dated samples from the underwater Sector C could be related.
CONCLUSIONS
The site of La Draga is a lakeside archaeological settlement in the NE Iberian Peninsula, with extraordinary preservation of wooden elements and other organic materials. A local tree-ring sequence of 265 years has been obtained from the piles used for the construction during the settlement’s First Occupation. The research carried out so far concludes that most trees used for construction were cut in the same year (the winter of the 237/238 year in the local sequence), suggesting a single prominent construction event at the beginning of the occupation. Using radiocarbon dates from the last ring in 7 of these logs, we have estimated the installation year at around 5300 cal BC. This first occupation ended rather suddenly 30/40 years after the first construction. Two different wiggle-matching models estimate a transition period around 5200 cal BC. The first occupation of the shores of the Banyoles Lake correspond to a classical Cardial Pottery Early Neolithic, and relationships with contemporaneous settlements in Southern France have been argued. La Draga’s first occupation constitutes the largest known settlement in the extreme NE of the Iberian Peninsula, and it appears to be more carefully planned in its construction and organization than others in the region. This gives an image of very dispersed small groups during Early Cardial Neolithic, occupying a mostly depopulated area, and concentrating the settlements in rationally selected points that had the best conditions for their initial and still partial farming economy.
The transition period of the site after the first occupation would coincide with a decay in the population signal in the Northeastern Iberian Peninsula and elsewhere, related with changing local environmental conditions and a transformation in the way of occupying the territory. In the present case, this transitional period could be associated with occasional occupation and reuse of space and/or abandonment.
One hundred years after the end of the first occupation, around 5100/5090 cal BC, the settlement is reoccupied. Important preparatory work of the ground surface probably to prevent swamping is attested since the earliest moments of this new occupation. Its architecture, however, has not been recovered, but the archaeological materials show cultural relations with most sites around, within the global trend of Full Neolithic population expansion in the Northeastern Iberian Peninsula. Most recent layers are damaged and post-depositionally altered, and therefore not many details are available about possible post-Neolithic occupations. There are very few remains of human population dated after 4800 cal BC at the site, but dispersed archaeological evidence is present in the area of Banyoles lake. Although the period after 4800 cal BC has been explained in terms of depopulation and involution, also related with climatic oscillations, nothing in the archaeological record of La Draga can be used to test such hypothesis.
The combination of radiocarbon dating and dendrochronological analysis with the depositional sequence of the different sectors at La Draga, permitted in high grade to evaluate the chronological framework of the settlement. Additional ordering of the depositional events in a relative temporal scale throughout all the excavated sectors allowed understanding even in a schematic way their time-space correlations. As every site is a living organism, changing through time, in order to decipher its biography, is necessary to take into account not only the depositional processes that have formed it but also the post-depositional effects that have altered its course.
ACKNOWLEDGMENTS
The excavation campaigns were undertaken since 2010 under the coordination of the Local Archaeological Museum of Banyoles (MACB) and the participation of the Autonomous University of Barcelona (UAB), the Archaeological Museum of Catalonia (MAC), the Spanish National Research Council–Institution Milà and Fontanals (CSIC-IMF), with the collaboration of the Center of Underwater Archaeology of Catalonia (CASC). Fieldwork seasons and archaeological studies at the Neolithic site of La Draga have been carried out within the framework of various research projects funded by the Ministry of Science and Innovation: HAR2009-13494-C02-01/02, HAR2012-38838-C02-01/02, HAR2016-76534-C2-1/2-R in the lasts years, and currently by “Landscape modelization and resource management in the transition to farming in northeastern Iberia” (PID2019-109254GB-C21), “Territories, technical productions and technological innovation in the Mesolithic Neolithic transition” (PID2019-109254GB-C22) and “Archaeological housing on wooden piles in European Mediterranean lakes: strategies for their exploitation, monitoring and conservation” (PCI2020-111992). The excavation campaigns at La Draga are currently undertaken in the frame of additional funding by Generalitat of Catalonia (CLT009/18/00050).
The first author was also granted a four-year scholarship for her PhD dissertation by funds of the European Union and the Catalan Governement (“FI-DGR2017-2020”). Further support to the project was also given by the autonomous government of Catalonia by means of two research projects granted by the Department of Culture – Generalitat de Catalunya: “La Draga within the Neolithisation process in the Northeastern Iberia” (2014–2017) and “La Draga (Banyoles) and the Neolithisation process in the prelitoral plain and prepyrenees of Girona” (2018–2021). The Agency for Scientific Quality – Generalitat de Catalonia, awarded two research groups with a special distinction (Research group of Special Merit, 2017–2021): “Digital technologies for Social Archaeology” (TEDAS 2017 SGR 243) and “Archaeology of Social Dynamics” (ASD 2017 SGR 995).
We also wish to thank the Swiss National Science Foundation for the funding provided as part of a SNF Professorship (PI: F. Antolín), grant number: PP00P1_170515. We acknowledge comments and suggestions from different colleagues, among them Àngel Bosch and Salvador Pardo-Gordó. Philippe Lanos and Philippe Dufresne contributed by adapting the use of ChonoModel 2.0 to the use of the IntCal20 calibration curve.
We are most grateful to two anonymous reviewers from Radiocarbon for detecting some substantial errors and contributed to their correction. Any errors remaining are responsibility of the authors.


 Open access