

List of symbols

1. Introduction
A special type of mountain glacier is formed by snow and ice that accumulate in craters of volcanoes at high altitudes. Due to intense volcanic heating, ice accumulation on such glaciers may be essentially balanced by bottom melting. The water thus produced penetrates into and runs off through the fractured volcanic basement. As a result, the ice flux over the crater rims is low. Surface slopes are thus low, and longitudinal velocities small. These peculiarities make such glaciers especially valuable as paleoclimatic archives.
The thermal and hydrodynamic interactions in such glaciers manifest themselves through the thermal state and vertical movement of the glacier, and the history of volcanic eruptions in the vicinity of the glacier is preserved as a sequence of ash layers distributed through it. Thus, ice-core data and borehole thermometry can be used to study volcanic activity in the region, while historical eruptions are reliable age markers which help to interpret ice-core records.
Mathematical modelling provides a theoretical basis for processing proxy climate signals from glaciers, but in this special case the models need additional elaboration. High lateral aspect ratios of glaciers in craters require appropriate adjustment of the boundary-layer approximations conventionally used in the theory of ice dynamics (e.g. Reference Grigoryan, Krass and ShumskiyGrigoryan and others, 1976; Reference Fowler and LarsonFowler and Larson, 1978; Reference Salamatin and MazoSalamatin and Mazo, 1984; Reference HutterHutter, 1993). Densification of snow to firn and bubbly ice with minimal surface melting at low surface temperatures makes it necessary to account for compressibility effects in the glacier body (Reference SalamatinSalamatin, 1991). Finally, ice flow in our case is strongly influenced by the thermal state of the glacier and by bottom melt rates.
Reference Murav’yev and SalamatinMurav’yev and Salamatin (1989) and Reference Salamatin and Murav’yevSalamatin and Murav’yev (1991) first attempted to use heat-transfer models to deduce subglacial volcanic heat fluxes on Ushkovsky and Kluchevskoy volcanoes in Kamchatka, Russia, but the over-rim ice discharge was neglected. Hence, the primary theoretical goal herein is to re-examine the general equations of ice dynamics on the basis of scale analysis, and to derive a simplified thermomechanically coupled model for ice flow and heat transfer in crater glaciers with such flow over the rim.
In particular, this study concerns Kamchatka Peninsula which is a key region, geographically and climatically linked to the Okhotsk Sea. Glaciological observations at Kamchatka have been carried out for many years, mainly by Russian scientists. Since 1995 a joint Russian–Japanese research project has been active (Reference Kobayashi, Murav’yev, Kodama and ShiraiwaKobayashi and others, 1997). The principal emphasis of this program is on glacier monitoring and ice-core studies (Reference KodamaKodama and others, 1996; Reference Shiraiwa, Murav’yev and YamaguchiShiraiwa and others, 1997, Reference Shiraiwa and Naruse1999). The Gorshkov and Herz crater glaciers on the summit of Ushkovsky volcano (Figs 1 and 2) are the primary areas of field observation and drilling. The theory developed herein is used to predict ice-flow patterns and the age of ice in the larger (Gorshkov) crater, using available field data (Reference Murav’yev and SalamatinMurav’yev and Salamatin, 1989; Reference Shiraiwa, Murav’yev and YamaguchiShiraiwa and others, 1997, Reference Shiraiwa and Naruse1999; Reference Matsuoka and NaruseMatsuoka and others, 1999) to constrain the model.
Topographic map of the summit ice cap on Ushkovsky volcano, Kamchatka. Solid and dotted contours are on the glacier surface and adjacent bedrock, respectively. The topography of the summit craters is shown in detail in Figure 2

Composite map (10 m contour interval) and air photograph of Gorshkov crater at the summit of Ushkovsky volcano. The principal ice flowline, deduced from surface topography, is shown as a curved arrow. R2–5, K2, K4 and BH1 are sites of radioecho soundings, located by hand-held global positioning system and theodolite survey in 1997. Snow-temperature measurements were made over a full year, 1996/97, at BH1 using a 27 m deep borehole.

2. Examination of General Ice-Flow Equations
Let us first consider the general equations of non-inertial ice motion. The cross-section of Gorshkov crater glacier along the central flowline shown in Figure 3 illustrates the principal notations used in this paper: x, y, z are the Cartesian coordinates with the z axis vertical and directed upward, and the x axis oriented along the general ice-flow direction. The position of the origin of the coordinate system is not critical at this stage, but it is fixed later at the ice dome (at the upstream end of a reference flowline, s, as shown in Figure 2), at the mean elevation level of the ice surface in the crater. Respective components of the velocity vector v are designated as u, v, w, while τi j and eij (i, j = x, y, z) are used to denote the tensor components of the stress and strain-rate deviators. Accordingly, l is the height of the glacier surface, and z 0 is the depth of the crater. Owing to the low annual surface temperatures and despite the intense volcanic heating, much of the glacier is composed of snow, firn and bubbly ice with the density ρ = ρ i(1 − c) noticeably different from the density of pure ice ρ i, where c is the ice porosity.
Typical cross-section of a crater glacier along a reference flowline, illustrated by the ice cap in Gorshkov crater (3903 m a.s.l). Predicted ice-particle paths (lines with arrows) and isochrones are shown.

Consequently, we write the mass and momentum conservation equations as


where t is the time, p is the pressure and g is the gravitational acceleration. The depth profile of ice porosity, c, is assumed, based on experimental data, so no additional theoretical equations are needed to simulate snow densification.
An ice-flow law relates the stress tensor to the strain-rate tensor and completes the system of equations of glacier motion. Rheological properties of bubbly ice were theoretically described by Reference Salamatin and DuvalSalamatin and Duval (1997). Based on these results as well as on laboratory and field observations, Reference Lipenkov, Salamatin and DuvalLipenkov and others (1997) and Reference Salamatin, Lipenkov and DuvalSalamatin and others (1997b) studied the process of densification of dry bubbly ice in glaciers, and showed that, at the small stresses (approximately 0.01–0.05 MPa) typical of large polar ice sheets, isotropic polycrystalline ice behaves as a linear viscous body. As discussed below, in crater glaciers the stresses are even less: approximately 0.005–0.02 MPa. Hence, in accordance with Reference Salamatin and DuvalSalamatin and Duval (1997), we have, for porous glacier ice,
Here the factor μ(T) is the viscosity of pure ice which, being a function of temperature T (in K), is conventionally presented as

where μ b is the ice viscosity at a typical basal temperature T b 0, assumed to be close to or equal to the ice melting point T f, Q is the activation energy and R g = 8.314 J mol−1K−1 is the gas constant.
Although the linear approximation embodied in Equation (3) is not generally accepted (e.g. Reference HookeHooke, 1981), nevertheless it may be regarded here, at least, as a reasonable approximation which makes the mathematics more tractable. Possible implications of a non-linear (Glen’s) flow law are discussed in Appendix 3. Furthermore, it is important to note that the activation energy Q in Equation (4) is not constant, especially at temperatures above −10°C; rather, it increases considerably as the melting point is approached (Reference HookeHooke, 1981; Reference Budd and JackaBudd and Jacka, 1989). This peculiarity must be taken into account in the theory of ice dynamics in volcanic craters.
Scale analysis of governing equations
To scale characteristics of ice dynamics typical values, designated by the superscript “0” (see Fig. 3), are used in this subsection. The longitudinal scale of the crater glacier is the diameter of the crater, d 0. Two typical values of the vertical scale are introduced: l 0 for the altitudinal range of the glacier surface (for the elevation of the ice surface over the crater rim), and z 0 for the crater depth z 0 (ice thickness and z coordinate). It is also clear that ρ 0 ∼ ρ i and w 0 ∼ b 0, where b 0 is a typical value of the net ice-mass balance (accumulation rate) b. Following Reference Dahl-JensenDahl-Jensen (1989) and Reference Salamatin, Duval, Castelnau and MalikovaSalamatin and others (1997a), we distinguish here a separate scale τ 0 for the normal stresses in the glacier body. Both l 0 and τ 0 are to be found in the course of the scale analysis, and l 0 is expected to be much less than z 0.
The secondary scales for the terms in Equations (1) and (2) now become obvious:

The next step is to transform Equations (1) and (2) to non-dimensional forms, scaled in accordance with the above choice of the typical values and Expressions (5). Thus, keeping, for simplicity, the same notations (i.e. t, x, z, ρ, τxz
, … for
![]() , we leave the mass-conservation equation unchanged and obtain the following representation of the uniformly normalized momentum equations:
, we leave the mass-conservation equation unchanged and obtain the following representation of the uniformly normalized momentum equations:

The three dimensionless numbers are defined as
All of these have clear physical meanings: Kd is a crater form factor, Kl is the relative elevation of the glacier surface above the crater rim, and Kτ is the ratio between the normal stresses and pressures acting in the glacier body. The scales l 0 and τ 0 can now be determined through scaling the glacier ice-flow law.
As pointed out by Reference Dahl-JensenDahl-Jensen (1989), two specific zones with different types of deformation should be distinguished in non-isothermal glaciers: (1) an upper cold stratum where normal strain rates and compression effects prevail, and (2) a warmer basal layer subjected to intensive shearing. This is especially true of crater glaciers. With this in mind, let us introduce the typical value T s 0 of the annual surface temperature, T s, and the corresponding ice viscosity μ s = μ(T s 0). We can also set the scales for the strain-rate tensor components to be consistent with those given by Expressions (5),
and write, by definition, the normalized strain rates as

Consequently, the ice-flow law (Equation (3)) directly yields the following relations between the stress and strain-rate scales in the two zones

These result in explicit expressions for the similarity numbers defined by Equations (7):

For the natural talus slopes of volcanic craters, Kd ∼ 0.2–0.3, and preliminary calculations show that for the crater glaciers on the summit of Ushkovsky volcano (b 0 ∼ 0.6 m a−1, T s 0∼−20°C, z 0 ∼ 250 m) Kl ∼ 0.01–0.1 and Kτ ∼ 0.5–1. In accordance with the definitions in Equations (7), these estimates lead us to the principal conclusions: (1) the ice surface slope is relatively small, and the surface elevation above the crater rim does not change noticeably in time; (2) longitudinal stresses play a significant role in the dynamics of crater glaciers.
Correspondingly, the factor K d 2 in Equations (9), as well as the factors Kl , K d 2 Kl and KτKl in the last of Equations (6), are hereinafter regarded as negligibly small. From the latter equation it follows that the pressure in the ice thickness is close to hydrostatic. Thus, in the dimensionless presentation we have

If the density ρ is a function of depth only and does not vary significantly in lateral directions, then we obtain, after Reference SalamatinSalamatin (1991),

and finally the first two scaled equations (6) take the form:

These equations serve as a starting point for modelling ice flow in volcanic craters.
Flowline Model
It is important to emphasize here that Kτ , determined by Equations (7), becomes significant (together with the longitudinal normal stresses) only because of the large temperature difference between the surface and the bed which results in a large ratio μ s/μ b in Equations (10). The corresponding terms in Equations (11) are still small and are of the order O(K d 2) within the basal layer, where the shear stresses τzx , τzy reach their maximum and are responsible for horizontal motion of the ice. The longitudinal velocities u, v, in turn, are practically constant in the upper cold stratum of the glacier where the longitudinal normal stresses become dominant. Thus, as in the shallow-ice approximation (e.g. Reference Salamatin and MazoSalamatin and Mazo, 1984), the flow vector in a crater glacier remains collinear with the gradient of the glacier surface. This allows us, at least approximately, to employ traditional flowline modelling (e.g. Reference ReehReeh, 1988; Reference SalamatinSalamatin, 1991) for the crater ice-cap simulations.
To take into account the specific features of the ice flow, let us apply a local horizontal orthogonal curvilinear coordinate system (s, ξ), where s is the distance measured from the ice divide (ice dome) along the reference flowline (Figs 2 and 3) and ξ is the transverse coordinate with a ξ axis oriented along an elevation contour. We also introduce H(s), the width of the flow tube formed by the reference flowline and a neighboring one. Furthermore, the same notations (u, v) are used for the longitudinal and transverse components of the ice-flow vector in this coordinate system. We no longer need scaling. Hence, all the characteristics are hereinafter considered as dimensional values.
By definition, v = 0, and mass conservation (Equation (1)) takes the form:
The curvature of the reference flowline is assumed to be mall, and the flow tube is quasi-symmetric. In accordance with the projection of the force-balance equations (2) onto the ξ direction, this results in additional simplifications: τ sξ ≈ 0 or (e sξ ≈ 0, ∂u/∂ξ ≈ 0). Correspondingly, the components of the strain-rate deviator, given by Equations (9), can be rewritten using Equation (12) as

where dρ/dt is the particle derivative.
It remains to project the force-balance equations (2) onto the s axis. Consequently, instead of Equations (11), we have
Neglecting small temporal variations of the glacier surface elevation and taking into account the kinematic boundary condition governing the movement of the free ice surface, we can integrate Equation (12) over the glacier thickness to obtain the ice-volume flow rate as a function of the total mass balance:

where w 0 is the bottom melt rate. It is also assumed that the water formed at the ice–rock interface flows downward through the porous and fractured volcanic substrate.
This flowline model (Equations (12–15)) allows us to construct a feasible approximation for the main dynamic characteristics l, u and w, but it needs to be coupled with a heat-transfer model.
3. Thermomechanically Coupled Model of a Crater Glacier
Surface elevation and velocity profiles
To account for the firn–ice compressibility effects, it is relevant to introduce, after Reference SalamatinSalamatin (1991), the normalized vertical coordinate ζ defined as the relative distance from the glacier bottom and measured in terms of the equivalent thickness of pure ice:

where Δ is the ice-equivalent thickness of the glacier.
Now, using Equations (3), (4) and (13), we can try to integrate Equation (14) with respect to ζ to derive the profile of the longitudinal velocity, u, expressed explicitly in terms of ζ and the surface slope ∂l/∂s. Further integration of u would convert the first of Equations (15) into a relation determining the ice-cap surface gradient along the reference flowline. Certainly, such a procedure is only approximate. Reference SalamatinSalamatin (1991) and Reference Salamatin, Lipenkov and BlinovSalamatin and others (1995) have elaborated upon its principal steps. This technique, combined with the modelling approach of Budd and Jenssen (Reference Budd and Jenssen1975), is applied now (see Appendix 1) to Equation (14) which is more general than those considered in the studies cited above. Additionally, since the activation energy Q in Equations (3) and (4) effectively changes near the melting point, we have also modified Lliboutry’s (1981) approximation for the ice viscosity μ and write separately

within the cold upper part of the glacier and

near the glacier bottom.
The indices β s and β b are similar: β s is determined primarily by the activation energy, Q s, at the surface temperature T s 0, while the definition of β b is based on the activation energy, Q b, related to the basal temperature Tb 0. For typical conditions on Ushkovsky volcano, β s has a value of 2–4. Due to the difference between Q s and Q b (Budd and Jacka, Reference Budd and Jacka1989), β b may be 3–5 times larger than β s, reaching values of 10–15 or more. Both may be regarded as tuning parameters which control the change in ice viscosity with depth in the glacier.
Finally, using Expressions (17) and (18), we arrive (see Appendix 1) at a differential equation for the surface profile

where
An approximate expression for the longitudinal velocity is obtained simultaneously in the following form (Reference Salamatin, Lipenkov and BlinovSalamatin and others, 1995):

By definition, σ represents the proportion of the total ice-flow rate due to plastic deformation of the glacier body: 0 ≤ σ ≤ l. As shown in Appendix 1, this parameter can be directly related to the ice-sliding law (Reference FowlerFowler, 1981).
To formulate the heat-transfer problem and to determine ice-particle paths, we need the vertical velocity w. Actually in our case, when densification processes are important and the normalized “ice-equivalent” coordinate ζ is introduced instead of z, the particle derivative of any ice property, such as temperature, T, is defined (Reference SalamatinSalamatin, 1991) as

where
![]() is the rate of vertical ice-mass transfer:
is the rate of vertical ice-mass transfer:

Thus, the use of
![]() is preferred.
is preferred.
A general relation for the vertical mass-transfer rate is derived from Equation (12) in Appendix 2. Its simplest form, consistent with Reference Salamatin and Murav’yevSalamatin and Murav’yev (1991) and Reference Salamatin, Lipenkov and BlinovSalamatin and others (1995), is obtained as a consequence of Expression (20) when ∂σ/∂s ≈ 0:

The latter expression is accurate, at least in the limiting cases of σ = 0 and 1. Eventually, it will be convenient to employ Expressions (20) and (23) as plausible approximations of the ice-flow components, regarding σ as another tuning parameter responsible for ice sliding. It should also be emphasized that β b is large and the terms proportional to the factor σ in these equations are, if not negligible, at least not dominant. Possible generalization of Expressions (19), (20) and (23) for Glen’s flow law is discussed in Appendix 3.
For small surface slopes we have ∂Δ/∂s ≈ (l − c b) ∂z 0/∂s, and Equation (19) can be solved easily. However, if radio-echo sounding data provide ice thicknesses along the ice flowline, there is no need to simulate the surface elevation profile in Equation (19) as it does not deviate significantly from a horizontal plane. In fact, the glacier flow is fully prescribed in this case by the balance equations (15), (16), (20) and (23) provided that the porosity profile c and the melt rate w 0 are also known.
Quasi-stationary temperature distribution in a crater glacier
One of the unique features of ice dynamics in volcanic craters is that the vertical temperature difference over the ice thickness, T
f – T
s, remains spatially constant. For typical conditions, convective heat transfer in crater glaciers is characterized by moderate Peclet numbers Pe = b
0
z
0/κ
i ≤ 2–3, where κ
i = λi/(ρ
i
c
pi) is the thermal diffusivity of pure ice and c
pi and λi are the specific heat and the thermal conductivity of pure ice, respectively. Thus, vertical temperature profiles along a flowline are assumed to be similar to one another in shape, and do not differ much in the ζ-scale presentation. This means that the term u∂T/∂s in Equation (21) is small, and the effect of horizontal advection is mainly incorporated into the vertical mass-transfer rate
![]() given by Equation (22).
given by Equation (22).
Vertical heat transfer is primarily determined by the thermal conductivity of the snow, firn and bubbly-ice deposits: λ = λiΛ(c). The correcting factor Λ is a normalized function of porosity (e.g. Reference Murav’yev and SalamatinMurav’yev and Salamatin, 1989). It can be presented approximately in a form which generalizes Maxwell’s formula for a cubic array of spherical pores in an ice matrix:
a ≈ 2 for periodic structures, but this value appears to be noticeably less, approximately 0.5–1.0, in natural firn (Reference Vostretsov, Dmitriyev, Putikov, Blinov and MitinVostretsov and others, 1984) and seasonal snow (Reference Sturm, Holmgren, König and MorrisSturm and others, 1997).
If, additionally, surface temperature variations averaged over typical time periods, t 0 ∼ z 0/b 0, are relatively small compared with a large temperature difference over the ice thickness (low background surface temperatures), then the spatially one-dimensional and quasi-stationary description (see Equation (A9)) of the heat-transfer process is quite acceptable. The solution of this boundary-value problem, which is very similar to that solved by Reference RobinRobin (1955), can be found analytically (Reference Salamatin and Murav’yevSalamatin and Murav’yev, 1991). The vertical heat flux and the temperature distribution in the glacier body are

The melt rate, w 0, is determined by the heat balance and temperature conditions at the glacier bed (see Equation (A8)):

where
and q 0 and L are the volcanic heat flux and the latent heat of fusion, respectively.
Expressions (19), (20) and (23–26) make up a complete flowline model of non-isothermal dynamics of a crater glacier and represent a theoretical basis for computer simulations and analysis of field data.
Different reduced forms of the heat-transfer model related specifically to the conditions of crater glaciers are considered in Appendix 4.
4. Discussion: Applications to Gorshkov Crater Glacier
In the present discussion, we concentrate on interpretation of available data (including field observations by the 1996 and 1997 Russian–Japanese expeditions) from Gorshkov ice cap, which fills the larger of the summit craters (3903 m a.s.l.) of Ushkovsky volcano (Figs 1 and 2) and is being considered as a possible drilling site (Reference Shiraiwa, Murav’yev and YamaguchiShiraiwa and others, 1997, Reference Shiraiwa and Naruse1999).
General geographic information
The dome of Gorshkov ice cap is situated at the southern extremity of Gorshkov crater, which is nearly circular and about 850–900 m in diameter (Fig. 2). The main ice flow goes northward through the geometrical center of the crater. It can clearly be seen from Figure 2 that the ice-surface slope increases markedly as the ice crosses the rim and spills over the side of the crater. It thus has minimal influence on the glacier dynamics in the crater itself. Reconnaissance theodolite and radio-echo surveys (Matsuoka and others, Reference Matsuoka and Naruse1999; Reference Shiraiwa and NaruseShiraiwa and others, 1999) conducted in 1997 make it possible to draw a generalized picture of the glacier surface elevation and bedrock relief along this flowline (Fig. 3). The maximum glacier thickness, 240–250 m (Kd ≈ 0.28), is found at a site about 650 m from the dome. As might be expected from the theoretical estimates, the total change in the surface level across the crater does not exceed 20 m (K l ≈ 0.08). This corresponds to typical stresses of about 0.01 MPa.
Mass-balance measurements in pits (Reference Murav’yev and SalamatinMurav’yev and Salamatin, 1989) and in a 27 m borehole BH-1 (Reference Shiraiwa, Murav’yev and YamaguchiShiraiwa and others, 1997, Reference Shiraiwa and Naruse1999), drilled in 1996 not far from the geometrical center of the crater (Figs 2 and 3), provide a reliable estimate of the mass-balance rate: b ≈ 0.6 m a−1 of ice averaged over 28 years.
Ice-core analysis (Reference KodamaKodama and others, 1996; Reference Shiraiwa, Murav’yev and YamaguchiShiraiwa and others, 1997) has yielded the following mean-square approximation of the snow–firn density–depth (h = z – l) profile:
Equations (16) and (27) relate the coordinate ζ to h:
Temperature observations (Reference Shiraiwa, Murav’yev and YamaguchiShiraiwa and others, 1997, Reference Shiraiwa and Naruse1999) give a mean annual surface temperature, T s, of about −18°C. Experimental temperature–depth profiles also allow us to infer near-surface temperature gradients.
All these data are sufficiently complete to constrain, at least in general, our model of the dynamics of the crater glacier.
Predictive estimates of the volcanic heat flux and ice melting rate
The volcanic heating, q 0, and, as a consequence, the rate of ice melting, w 0, are the least certain parameters of the model. Thus, we start with a thermodynamic analysis of the data available from temperature measurements in the upper snow–firn stratum of the ice cap.
In accordance with Matsuoka and others (Reference Matsuoka and Naruse1999), the glacier thickness in the vicinity of borehole BH-1 is about 185 m (Fig. 3), and Equations (16), (27) and (28) predict the corresponding ice-equivalent thickness to be c s/γ less, or Δ ≈ 168 m. Furthermore, we assume the following thermophysical properties for pure ice at a mean temperature of about – 10°C:

and fix σ = 1, β b = 10 in Equation (23).
Now, for any given ice thickness, Δ, the local melt rate w 0 is related to the volcanic heat flux q 0 by Equation (26). The melt rate is zero for small values of q 0 when the bottom temperature is below the ice melting point T f. Once the bottom temperature becomes equal to T f, w 0 increases nearly linearly as q0 increases (Fig. 4). Similarly, the first of Equations (25) represents a relationship between q 0 and the temperature gradient Γ = −∂T/∂z. Of particular interest is the temperature gradient at the ice surface, Γs. As q 0 increases while the bottom temperature is below the melting point, Γ and also Γs increase nearly linearly (Fig. 4), thus providing for conduction of the heat from the bed to the surface. Once the bottom temperature reaches T f and melting starts, Γ s starts to decrease slowly (Fig. 4). This is because an increase in the melt rate increases the vertical velocity, w; thus more of the heat entering the ice at the bed is used to warm downward-moving ice, and less is conducted to the glacier surface (e.g. Reference RobinRobin, 1955; Reference HookeHooke, 1998, fig. 6.6). In principle, both q 0 and w 0 can thus be derived from the surface temperature gradient Γs measured below the level of the seasonal temperature fluctuations or estimated on an annual basis.
Calculated surface temperature gradient, Γ s , at 20 m depth and bottom ice-melting rate, w0, at BH-1 as a function of volcanic heat flux, q0( solid lines). Dotted lines with arrows show estimates of q0and w0 derived from the temperature-gradient values calculated from the mean annual 27 m temperature profile.

July temperature profiles in the center of Gorshkov crater obtained from a 13 m deep pit by Reference Murav’yev and SalamatinMurav’yev and Salamatin (1989) in 1986 and from the 27 m borehole BH-1 measured by Reference Shiraiwa, Murav’yev and YamaguchiShiraiwa and others (1997) 10 years later are very similar. Thus, local climatic conditions have not changed significantly. However, the temperature gradients are about 0.18 and 0.065°C m−1 over depth ranges of 5–8 m and 15–25 m, respectively, and reveal obvious seasonal variability. Thus, monthly temperatures from BH-1, measured during 1996–97 (Reference Shiraiwa and NaruseShiraiwa and others, 1999), have been used to calculate the mean annual temperature–depth profile from 2 to 27 m. The mean-square approximation gives Γs ≈ 0.049 ± 0.002°C m−1 within the firn layer from 15 to 25 m (for the estimated errors in individual temperature measurements of about ±0.05°C) and leads to an apparent (extrapolated) temperature at the glacier surface of −16.0 ± 0.1°C. This temperature, which is about 2°C higher than the observed value owing to seasonality in precipitation, is used as the boundary condition, T s, in Equations (25) and (26).
The corresponding plots of Γs (at h = 20 m) and w 0 as functions of the bottom heat flux, q 0, for BH-1 are shown in Figure 4. These simulations show that there is an upper bound for the surface temperature gradient, Γs 0, and no reasonable value of q 0 can be found if the observed (estimated) temperature gradient Γs is larger than Γs 0. On the other hand, two plausible values of q 0 are determined when Γs < Γs 0: the lesser one at w 0 = 0 and the larger one for non-zero melt rate (w 0 > 0) which is likely in crater glaciers. In our case, Γs 0 ≈ 0.055°C m−1 and the above experimental range in the surface temperature gradient suggests q 0 ≈ 1.4 ± 0.4 W m−2 and w 0 ≈ 0.11 ±0.04 m a−1. The dotted lines with arrows in Figure 4 illustrate this inverse procedure which appears to be rather sensitive to errors in the temperature-gradient estimation. On the other hand, the limiting temperature–depth profiles in Gorshkov ice cap presented in Figure 5 by curves 1 and 2 (simulated in accordance with Equations (25) and (26) for q 0 ≈ 1.0 and 1.8 W m−2 at BH-1) do not differ noticeably. Temperature measurements are shown in Figure 5 by solid squares. Curve 3 is computed for σ = 0 at q 0 ≈ 1.0 W m−2 and is quite close to curve 1, simulated for σ = 1. Thus, ice sliding has minimal influence on the temperature field in a crater glacier.
Simulated temperature-depth profiles at BH-1 for different conditions at the glacier base: (1) lower and (2) upper bounds of the volcanic heat flux (q0 ≈ 1.0 and 1.8 W m−2, respectively) without basal ice sliding (σ =1); (3) ice sliding (σ = 0) at q0 ≈ 1.0 W m−2.

The maximum value of q 0 ≈ 1.8 W m−2, derived from the borehole temperature measurements, is only about one-quarter of that obtained by Reference Murav’yev and SalamatinMurav’yev and Salamatin (1989), who neglected ice discharge from the crater, having assumed w 0 = b. As a result, their prediction of the glacier thickness was less than the real value by a factor of two.
The above considerations concerning the mean depths and typical conditions of Gorshkov ice cap reveal another important peculiarity of ice dynamics in volcanic craters. The heat flux through the glacier thickness is found to be much less than the bottom heating. Hence, the ice-melt rate must be practically constant along the flowline, provided that the volcanic heat flux remains unchanged.
Ice-particle trajectories and age–depth relation
The path of an ice particle deposited at t = 0 on the glacier surface a distance s0 from the dome is determined by two simultaneous differential equations:

where u and
![]() are given by Expressions (20) and (23), respectively.
are given by Expressions (20) and (23), respectively.
Simplified analytical solutions of this system can be useful for estimating the age of the ice. With this in mind, we first assume that b and w 0 are constant, at least within the major part of the crater area, and take the flow-tube width as
where the exponent v is a positive value for the typically divergent flow patterns in ice caps. Although rather unsophisticated, such an approximation is flexible enough to represent a variety of general configurations of ice streams in volcanic craters.
We neglect the secondary terms, proportional to σ/(β b + 2) in Expressions (20) and (23) and write
where θ is the relative melt rate, θ = w 0/b.
Next, for the naturally flattened ice-cap surface and a smoothed crater bottom (e.g. Fig. 3) the ice-equivalent glacier body has an approximately parabolic shape:

Here s * is the distance from the dome at which the maximum ice thickness Δ* is reached. Certainly, when the crater is not axially symmetric, the latter approximation is valid only for s ≤ s *.
Finally, Equations (29) take the form:

which permits immediate integration for θ < 1. Consequently, trajectories of ice particles are described by the one-parameter family of curves
and the age–depth relation at a fixed distance, s, from the dome is given explicitly as

Obviously, intense bottom melting limits the age of ice in a volcanic crater. In accordance with Equation (31), the age of the oldest ice is

and it should be found near the glacier bottom at location
In the case of Gorshkov ice cap, s * ≈ 650 m, Δ* ≈ 223 m and, for divergent radial flow (v ≈ 1) in the vicinity of the reference flowline (Fig. 2) with b = 0.6 m a−1 and maximum θ ≈ 0.25 (i.e. w 0 ≈ 0.15 m a−1), the age of ice at the maximum depth (s = s *) is about 610 years. For a symmetric crater, the maximum age of ice would not exceed 650 years at s ≈ 870 m, i.e. 220 m downstream from the position of maximum depth. For minimum θ ≈ 0.12 (i.e. w 0 ≈ 0.07 m a−1), the maximum age would be about 800 years at s ≈ 970 m.
Equations (30) and (31) are rather simple and directly reveal an important fact: namely, that basal melting constrains the glacier dynamics and ice-age distribution in volcanic craters. For example, in Gorshkov crater at θ ≈ 0.25, the maximum age of the ice does not change by >5% when v varies from 1 to ∞. Using Equations (27) and (28), the paths of ice particles and isochrones predicted by Equations (30) and (31) can be directly plotted in the (z, s)-coordinate system as shown in Figure 3 for θ ≈ 0.25.
More accurate and detailed simulations should be based on the general flowline model given by Equations (19), (20–26) and (29).
5. Conclusions
The boundary-layer approximation used in the theory of glacier dynamics is re-examined on the basis of scale analysis, and is applied to ice flow in volcanic craters. Due to the large aspect ratios, Kd ∼ 0.2, the ice-cap surface in a crater is expected to be practically flat, with slopes of the order of KlKd ∼ 0.01. Thus, longitudinal normal stresses in the glacier body become comparable to the basal shear stresses. The highly non-isothermal conditions of crater glaciers enhance the latter peculiarity. Intense volcanic heating should be considered as one of the principal factors controlling the motion of a crater glacier. A thermomechanically coupled flowline model is constructed for simulating the non-isothermal ice flow in volcanic craters, with special attention paid to snow–firn–bubbly-ice compressibility effects. The profiles of vertical and horizontal velocities are derived explicitly. The theory developed provides a basis for detailed computer simulations and interpretation of field data.
In accordance with the primary objectives of this study, we applied the model to Gorshkov ice cap in the larger summit crater of Ushkovsky volcano. Based on measured mass balances and temperature profiles in pits and shallow boreholes, the ratio between the basal melt and mass-balance rates is estimated to be θ ≈ 0.12–0.25. This means that up to 25% of the ice mass, accumulated in the crater, may be melted by the volcanic heat flux q 0 ≈ 1.0–1.8 W m−2, while the remaining 75% is discharged over the crater rim. Ice-particle paths and age–depth relations are presented in explicit analytical form. The age of the basal ice at the deepest point is predicted to be ≥610 years and is close to the maximum age of ice in the crater.
Acknowledgements
The authors would like thank all participants in the 1996 and 1997 summer expeditions to Kamchatka for their help with field studies. Among them special thanks are addressed to A. A. Ovsyannikov of the Institute of Volcanology, Russian Academy of Sciences, and S. Horikawa and S. Yamaguchi of the Institute of Low Temperature Science (ILTS), Hokkaido University. We are also grateful to T. Hondoh, R. Naruse and D. Kobayashi of ILTS for their interest in our work and useful discussions. The first version of the manuscript was kindly read by L. Lliboutry of the Laboratoire de Glaciologie et Geophysique de l’Environnement, Grenoble, France, and R. LeB. Hooke of the University of Maine, U.S.A. They made many constructive suggestions which improved the paper. We thank them as well as anonymous reviewers for useful comments which were taken into account during final preparation of the paper. We are also grateful for computational help from M. F. Ziganshin and E.V Silantyeva of the Kazan State University.
This study was conducted as part of the Russo-Japanese Joint Project, funded by a Grant-in-Aid for International Scientific Research Program (No. 08041090) and a Grant for Center of Excellence Program from the Ministry of Education, Science, Sports and Culture of Japan. In Russia it was partly supported by the Russian Basic Research Foundation (grant No. 97-05-64130).
Appendix 1: Integration of the stress equation
The normal stresses τss , τξξ are related by the flow law (Equation (3)) to the corresponding deviatoric strain rates ess , eξξ , given by Equations (13). By assumption, the relative rate of ice densification in Equations (13) does not depend on the coordinate s and hence does not noticeably affect the first term and is not present in the second term on the right-hand side of Equation (14). Thus, by means of Equations (3) and (13), after integration of Equation (14) with respect to z from z to l for a small surface elevation slope (Kl → 0), we find the shear stress τzs as

To evaluate the two integrals in Equation (A1), we use an appropriate approximation (Expression (17)) for the ice viscosity, µ, in the cold upper part of the glacier where µ is comparatively large and significant. Furthermore, as a firstorder iteration, we substitute the vertically averaged longitudinal velocity, given by Equations (15), for u in Equation (32). That is, we put u ≈ A/Δ. This leads to the shear-stress profile

with Ψ defined in Equation (19). The second term in Equation (A2) for τzs represents an interpolation between the boundary values at ζ = 0 and 1. The fact that τss is small near the bottom is also taken into account.
Substituting Equations (13) and (A2) for ezs and τzs into the flow law (Equation (3)) and integrating with respect to ζ, we obtain

where u 0 is the sliding velocity.
Owing to the effective change in Q near the melting point (Reference HookeHooke, 1981; Reference Budd and JackaBudd and Jacka, 1989), the ice viscosity µ, given by Equation (4), rapidly decreases with increasing temperature as the glacier bottom is approached. Only the basal values of the integrands are important in the integrals in the above relation for u. In this case, Lliboutry’s (1981) approximation (Expression (18)) becomes especially useful. Consequently, we come to a simplified presentation of the longitudinal velocity:

where c b is the basal porosity.
If the sliding velocity is introduced as
then Expressions (15), (A3) and (A4) straightforwardly yield Equation (19) for the surface elevation profile.
A sliding law links u 0 to the basal shear stress τzs (at ζ = 0). At high load pressures the meltwater is supposed to penetrate into the underlying fractured volcanic rocks, and, in the absence of cavity formation (ice–rock separation), by means of Equation (A2) we write, after Reference FowlerFowler (1981):

Here K 0 is a basal friction factor which depends inversely on the bedrock roughness and is proportional to the longitudinal scale of the substratum corrugations. For the specific dimensions of lava and tephra blocks in volcanic craters, K 0 is expected to be relatively small.
Equation (19) can be used now to eliminate the surface gradient from Equations (A3) and (A5). This results in Expression (20) for the longitudinal velocity profile and relates parameter σ to K 0:

Let us note that parameter σ is close to unity for small values of the ratio K 0 (β b + 3)/Δ.
Appendix 2: Vertical Ice-Mass Transfer
If the density ρ (porosity c) of the snow–firn–ice deposits depends only on depth, then, following Salamatin (Reference Salamatin1991) and calculating partial derivatives of ζ, defined by Equations (16), we can reduce Equation (22) for small K
l
to a relation between
![]() and w:
and w:
At the same time, integration of Equation (12) with respect to z gives (Reference SalamatinSalamatin, 1991):

where s and ζ should be considered as independent variables. The latter two equations straightforwardly lead to the final result

The integral in the latter equation can be evaluated easily after substitution of the u-velocity profile (Expression (20)) and finally Equation (23) is obtained.
Appendix 3: Comments on Implications of a Non-Linear Flow Law
Glen’s flow law, a power-law relationship between effective deviatoric strain rates
![]() and stresses
and stresses
![]() ,
,
is normally used to describe the non-Newtonian behavior of pure polycrystalline ice. Here the exponent α is the creep index, α ≥1, and the viscosity factor μ is defined by Equation (4).
We expect that Equations (13–15) are also valid in this case. If, as before, the ice densification effects are not important in the normal strain rates in Equations (13), the line of considerations of Appendix 1 can be extended to the nonlinear ice rheology.
For the cold upper (firn and bubbly-ice) stratum of the glacier, where the normal stresses prevail, in accordance with Equation (A6), we write (Reference Salamatin and DuvalSalamatin and Duval, 1997)
where

The substitution of these expressions into Equation (14) results in a generalized form of Equation (A1), and, for u ≈ A/Δ, the corresponding analogue of Equation (A2), based on Expression (17), transforms into

where

For the basal shear layer, Equation (A6) gives (Reference Salamatin and DuvalSalamatin and Duval, 1997):

and instead of Equation (A3) for large β b in Equation (18) determining μ, we obtain

This approximate relation for the longitudinal velocity, together with Equations (15) and (A4), straightforwardly leads to the corresponding generalization of Equation (19). Expressions (20) and (23) remain valid with β b+ 1 replaced with β b + α. This also means that all applications considered in section 4 do not depend directly on ice rheology.
Appendix 4: Reduced Forms of the Heat-Transfer Model
In the framework of the above scale analysis (see section 2), the thermal conductivity in lateral directions has a small effect, of the order O(K d 2), on the temperature field. The low dynamic activity of the glacier in combination with intense volcanic heating makes internal dissipation of mechanical energy also negligible. Consequently, the general heat-transfer equation in the flowline coordinate system s, ζ, in accordance with Equation (21), can be written in the following simplified form (Reference Salamatin, Lipenkov and BlinovSalamatin and others, 1995):

The principal boundary conditions on the bed and ice surface are
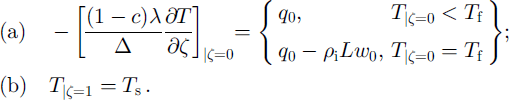
The basal temperature is supposed to be close to the melting temperature T f. Hence, Equation (A8a) determines the melt rate, w 0 ≥ 0. In a changing climate the annual surface temperature, T s, is a function of time.
Correspondingly, as explained in section 3, Equation (A7) can be reduced to a spatially one-dimensional form relevant to crater glaciers, and, for example, in the quasi-stationary state can be written as (Reference Salamatin and Murav’yevSalamatin and Murav’yev, 1991)

The latter boundary-value problem presented by Equations (A8) and (A9) leads to Equations (25) and (26).
Next, let us note that the most significant changes in c and λ (i.e. A) take place within the upper 30–50 m, in snow and firn. Below this level, which also bounds the depth of seasonal temperature fluctuations, the variations in c and λ do not exceed 10%. With this in mind, it is relevant, at least in the deeper central area of the crater, to simulate the temperature profile, based on the assumption that the thermophysical properties of ice in Equation (A9) are constant, i.e. c ≈ 0, Λ ≈ 1. The enhanced thermal resistance of the near surface snow-and-firn stratum in this case might be taken into account by a special boundary condition (Reference Salamatin, Lipenkov and BlinovSalamatin and others, 1995) imposed on the glacier surface instead of Equation (A8b):

The apparent heat-transfer coefficient χ is defined here so that it is constant. Using Expressions (24) and (27) it can be evaluated explicitly as χ = [ac s – (a + 1) ln(1 – c s)]/(aγ).
The above correction conserves the total heat balance of the glacier and represents the temperature field as ζ → 1as an extrapolation of the temperature–depth relation from the deeper part of the glacier, neglecting rapid changes in physical properties ρ and λ within the upper snow–firn stratum. Both the temperature profile and the heat flux in the basal layer remain unchanged. This is important for simulating bottom melting processes and predicting their impact on glacier motion. Such simplified formulation of the heat-transfer equations can be especially useful in completing the model of the dynamics of a crater glacier.


