

INTRODUCTION
Leptospirosis is an emerging infectious disease of global importance affecting millions of people every year [Reference Bharti1, Reference Pappas2]. In Sri Lanka, a tropical developing country, leptospirosis is endemic. Since national reporting for this disease began in 1991, the number of annual cases has averaged around 7/100 000 people [3]. A large outbreak of suspected leptospirosis starting in late 2007 and into 2008 occurred in Sri Lanka with over 7000 (35·7 cases/100 000) suspected cases reported in 2008. Leptospirosis risk in Sri Lanka is typically seasonal, with a small spike occurring in spring and a large spike later in autumn/winter [3]. This pattern roughly follows the seasonal variation in rainfall characterized by two monsoon seasons (maha, October–March and yala, April–September). It is generally thought that during paddy sowing and harvesting, farmers walking in flooded fields contract the disease when coming into contact with leptospires shed in the urine of infected rodents. There is also evidence that rodent populations expand in and around paddy fields during these periods [4].
Leptospirosis is a spirochetal disease caused by human contact with pathogenic leptospires present in the environment. Specific leptospire serovars are typically adapted to particular animal reservoir hosts that shed spirochaetes in urine [Reference Levett5]. Knowing which serovars are responsible for human infections can be extremely helpful in uncovering the local epidemiology of leptospirosis. Traditional understanding of the epidemiology of leptospirosis in Sri Lanka has held that the serovar commonly associated with human infection is Icterohaemorrhagiae, residing in rodent populations. However, there is contradictory evidence concerning the sources of the 2008 outbreak. In a preliminary study of 473 suspected cases in Kandy in the Central Province, only 15·6% tested positive for anti-leptospiral antibodies, 5·3% were equivocal, while 79·1% were negative [Reference Agampodi6]. Identified serovars of 31 analysed serum samples revealed a diverse array of serovars including Medensis, Australis, Ballum, Canicola as well as others. Similar analysis of 107 samples from the area found 24·3% of suspected cases tested positive for anti-leptospiral antibodies, with common serovars including Serjoe, Icterohaemorrhagia, Cynopteri, and Tarassovi among others [Reference Koizumi7].
Investigations of exposure history of 1957 confirmed cases in 2008 found that 60·9% of patients reported exposure to paddy fields during interviews [3]. Laboratory testing of 1404 suspected cases confirmed 37% as positive and 39% as equivocal. Nine samples had serovars isolated that revealed Pyrogenes, Australis, Weerasinghe, Gem, and Canicola. While rodents are thought to be the main reservoirs for leptospirosis, the role of other animals in the transmission dynamics in Sri Lanka is largely unknown. Canicola for example, is often found in dogs, cattle and swine [Reference Galloway and Levett8]. Testing in domestic animals is rarely done in Sri Lanka. In livestock, infection is often not severe or can be subclinical. Most commonly leptospirosis will mimic other production-related disease in buffalo and cattle that cause reductions in milk production, and in occasional cases, cause abortion [Reference Sullivan9]. The diversity of serovars circulating in Sri Lanka makes identifying the transmission and maintenance hosts, epidemiological risk factors, and appropriate control measures, difficult.
Where the understanding of disease risk is uncertain or incomplete, analysis of the geographical and temporal variation in cases can help reveal clues about the processes underlying observed disease patterns [Reference Odiit10, Reference Moffett, Shackelford and Sarkar11]. Spatial epidemiology is the study of the geographical variation of disease. In the context of leptospirosis, this might include both the detection and analysis of clusters in space and time, and the analysis of spatial variables that help to identify locations where populations are at high risk [Reference Reis12].
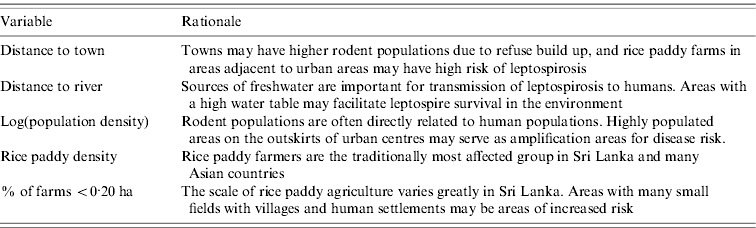
Variables possibly related to leptospirosis in Sri Lanka
Spatial risk factors in Sri Lanka may relate to characteristics of high-risk populations, the survival of the pathogen in the environment (i.e. surface waters), or factors related to population exposures to pathogens. In this analysis, we were primarily interested in outbreak-related spatial variables, i.e. possible correlates related to the marked rise in suspected cases observed in 2008.
Rodents and the environment
Rodent populations often expand where people and settlements are densely situated so population density may be a proxy for leptospirosis risk in some areas [Reference Moore, Gould and Keary13]. Household clustering of leptospirosis cases in Brazil suggested transmission dynamics are spatially structured [Reference Maciel14]. A study from Thailand, which experienced a leptospirosis outbreak similar to Sri Lanka during 2000–2002 [Reference Thaipadungpanit15], found prevalence of leptospires in household rats to be twice as high as rice-field rats [Reference Phulsuksombati16].
Waterborne transmission of pathogenic leptospires in tropical settings often occurs in rice paddy fields [Reference Victoriano17]. Locations where small-scale paddy fields are cultivated will be more highly populated, more heavily managed, and may therefore have more opportunities for exposure. Moreover, rivers can be sources of infection when people use them for swimming and bathing [Reference Levett5].
Rainfall
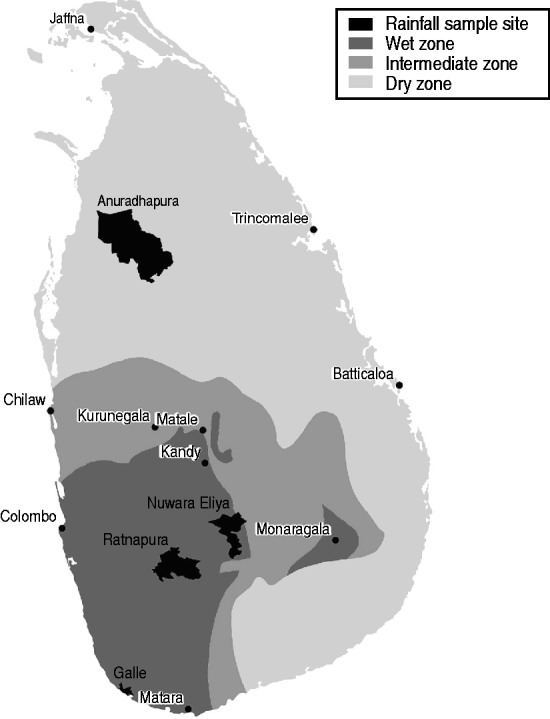
In Sri Lanka, leptospirosis is highly seasonal, and seasons are characterized by variation in rainfall. Two major seasons have been identified related to rainfall variability: the northeast (maha) monsoon from October to March, and the southwest (yala) monsoon from April to September. Within these, there are also inter-monsoons in March–April and October–November [Reference Domroes and Ranatunge18]. Generally the southwest monsoon sees rainfall on the order of 400–800 mm, and the northeast monsoon with rainfall ranging from 400 to 1200 mm [Reference Zubair19]. The spatial distribution of rainfall varies, with the southwest of the country receiving significant rainfall in all seasons, and the northern and eastern parts of the country being hot and dry during the southwest monsoon season. Due to these variations, Sri Lanka can be stratified into three agro-ecological regions based on annual rainfall: the wet zone in the southwest and central highlands area, the dry zone extending north and east of the highlands, and the intermediate zone transitioning between the two (Fig. 1). The majority of leptospirosis cases occur in the wet zone.
Map of Sri Lanka showing wet, dry, and intermediate zones, and locations where rainfall analysis was performed.
There are three primary mechanisms linking rainfall and leptospirosis cases in humans. There is evidence that increased rainfall during the monsoon season creates abundant food sources and optimal reproductive conditions for rats [Reference Madsen and Shine20]. Populations rise the following year, increasing opportunities for human exposure and disease transmission. However, links between rodent populations and disease prevalence in humans are not always clear [Reference Davis and Calvet21, Reference Mills, Singleton, Hinds, Leirs and Zhang22]. The second mechanism occurs over time scales of days or weeks, where rainfall-induced floods displace rats out of their burrows and into environments where they have more frequent contact with humans (e.g. households). This has been reported in both urban and rural environments, and is the most commonly cited link between rainfall and human cases of leptospirosis [Reference Sanders23, Reference Tassinari24]. The third mechanism is seasonal variation in rainfall that determines agricultural activities that put people at greater risk of exposure to contaminated surface waters. In Sri Lanka, this is thought to be the dominant process causing leptospirosis [Reference Dassanayake25].
The objectives of the current study were threefold. First, we investigated temporal correlation in suspected leptospirosis cases and rainfall pattern. Rainfall is often positively correlated to human leptospirosis in the tropics and large outbreaks can occur after rainfall events [Reference Victoriano17]. Second, we sought to identify clusters of cases during the 2008 outbreak of leptospirosis in Sri Lanka relative to the previous pattern of cases. Identifying locations and times of high risk and change in reported cases may elucidate factors driving the outbreak. Third, we investigated spatial factors useful in the context of disease surveillance activities. Geographical information systems (GIS) combined with cluster analysis were employed to identify clusters and spatial associations. We developed a new index of cluster-adjusted risk to aid in the prediction of future outbreak patterns in Sri Lanka as well as the geographical targeting of disease control activities and further sero-epidemiological studies. The study concludes with a discussion of our findings in terms of spatial risk modelling for surveillance data, understanding of leptospirosis risk in Sri Lanka, and areas of future research.
METHODS
Data and study area
Leptospirosis cases are reported to the Epidemiological Unit in the Sri Lankan Ministry of Health (MOH) on a weekly basis from public health inspectors in each of Sri Lanka's MOH administrative areas. Only a very small proportion of suspected cases are sent for laboratory diagnostic testing. Rather, reported cases are based on clinical signs such as fever, headache, muscle pain, cough, and haemoptysis for patients presenting at public hospitals. All analysis reported here is for suspected cases, indicating the earliest report of each case. Many cases may go unreported as mild forms of the disease where people do not seek treatment, as well as those who seek treatment at private hospitals [4]. While clinically diagnosed cases of leptospirosis could also be due to other febrile disease causing pathogens (e.g. dengue fever, hanatavirus), a recent validation study found the clinical case definition to be 82% accurate compared to results obtained by microscopy [Reference Dassanayake25].
Reported cases were obtained for all MOH areas for 2005–2009. Over the course of the study period, the number of MOH areas increased from 277 in 2005 to 310 in 2010. All counts were standardized to 2005 MOH areas through aggregation using GIS. Population data were obtained for MOH areas from the most recent estimates made by the Epidemiology Unit from 2010 (http://www.epid.gov.lk). Where 2010 estimates were not available, estimates from 2007 were used. In addition to providing a denominator in analysis of leptospirosis risk, population was used to calculate population density of each MOH area.
Data on agriculture and livestock were obtained for divisional secretariat divisions (DSDs), the main administrative planning units in Sri Lanka. DSDs generally correspond to the MOH area boundaries; although in some places multiple DSDs are covered by one MOH area and vice versa. DSD data were mapped onto MOH boundaries during GIS processing. The Census of Agricultural and Livestock conducted in 2002 recorded a number of variables describing livestock and agriculture in each DSD in Sri Lanka. The number of agricultural holdings greater than and less than 0·20 hectares (ha) were recorded, and these census data were used to calculate the percentage of ‘small’ agricultural holdings in each MOH area.
GIS maps were obtained from the Survey Department of Sri Lanka for areas of paddy agriculture mapped from aerial photographs, locations of urban centres, and rivers and streams. The total area of rice paddy fields in each MOH area was used to determine the paddy density. Finally, the average distance to urban centres and rivers/streams was computed for each MOH area, and new variables were created indicating if each MOH area had an average distance to rivers/streams and towns less than the median. The median average distance to streams/rivers was 400 m and the median average distance to urban centres was 12 km.
Data were obtained from the Meteorological Department of Sri Lanka on total monthly precipitation for four areas in Sri Lanka for 2005–2009. Only one station had one missing value, which was estimated as the average for that month from the other years.
Temporal analysis of rainfall pattern and reported leptospirosis cases
To investigate the role of rainfall in the 2008 leptospirosis outbreak, four locations were used to compare total monthly precipitation and total monthly leptospirosis cases in the surrounding district (see Fig. 1). Locations represent a large degree of variability in rainfall and leptospirosis cases. Comparison of cases and rainfall was done using the cross-correlation function which computes the correlation between series x and series y for multiple lags d. The cross-correlation function [Reference Diggle26]
was used to compute correlations between suspected cases of leptospirosis and total precipitation in Anuradhapura, Nuwara Eliya, Ratnapura, and Galle districts (Fig. 1). A total of 12 lags for the cross-correlation analysis was used, indicating the correlation of cases and rainfall up to a maximum of 12 months previously in order to be able to identify both short-term and long-term correlations.
Baseline reported leptospirosis prevalence analysis
MOH areas where leptospirosis was present during the baseline period were selected to model associations between prevalence (i.e. number of cases divided by the population) and the covariates identified in Table 1. Leptospirosis prevalence in each MOH area for November was the dependent variable, as this is a month when high numbers of suspected cases are reported throughout all endemic areas. The November prevalence was log-transformed to ensure normality and related to the dependent variables through a linear regression model (i.e. log-linear model).
Listing and rationale for covariates used in modelling reported leptospirosis risk and outbreak locations
Outbreak detection, modelling, and mapping
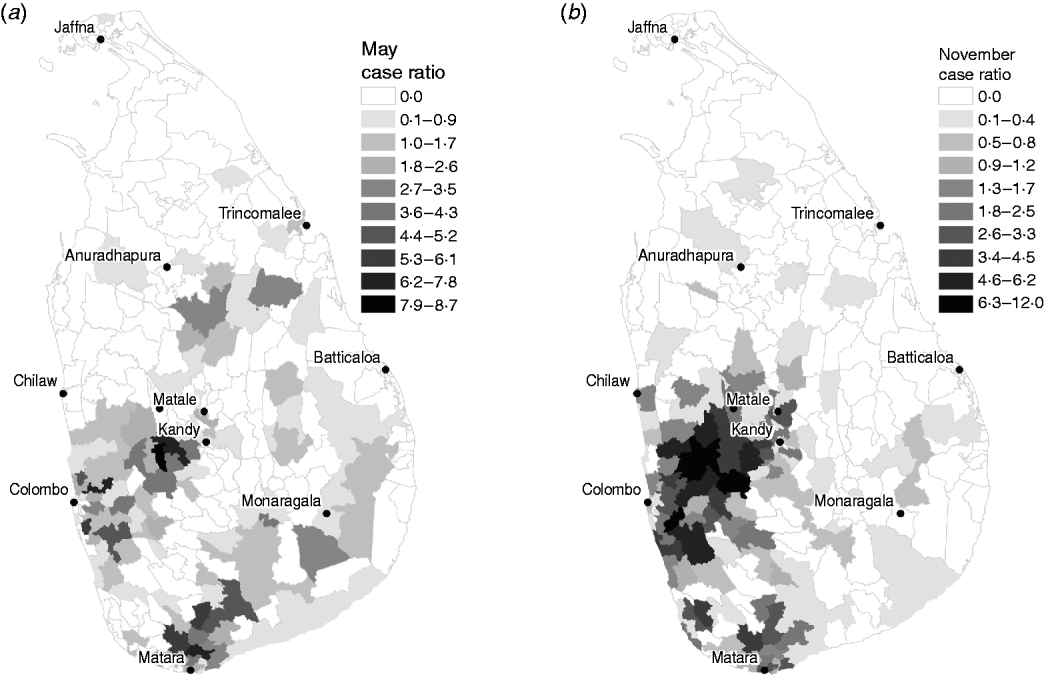
In order to detect clusters of cases in space and time during the 2008 outbreak year, a baseline of expected values was required. The first 3 years of data were used to determine the relative variation in the number of cases in each MOH area in each month. During these years, the number of annual cases ranged from 1552 in 2005 to 2198 in 2007, which are close to the historical norm [3]. Establishing the space and time case distribution allows us to identify unusual patterns of leptospirosis during years subsequent to 2007. A month-specific leptospirosis case ratio was calculated for each MOH during the endemic period using the monthly mean number of cases of all MOHs as the denominator and monthly mean number of cases over the 2005–2007 period for each area as the numerator. A value of 1 indicates the number of cases in a particular MOH area-month is equivalent to the average number of cases over all areas for that month, whereas values >1 indicate higher numbers of cases in that month, and values <1 indicate lower numbers. Figure 2 illustrates examples of the spatial distribution in relative case ratio for May and November. These estimates were then used to condition our analysis of the outbreak year (2008) in order to detect clusters in space and time.
Leptospirosis reported case ratios estimated from 2005 to 2007 baseline period for (a) May and (b) November.
The space–time scan statistic was used to identify unusual clusters of leptospirosis at the MOH-month level of resolution in 2008 (277 areas and 12 months). The null hypothesis in cluster analysis is that risk of disease is distributed proportionally to the population at risk and any known relative risk variations. Scan statistics are one of the most widely used approaches to detecting clusters in disease data [Reference Naus27–Reference Kulldorff29]. Briefly, the space–time scan statistic uses cylindrical scanning volumes where radius is defined by space and height is defined by time [Reference Kulldorff29]. Risk is calculated within each cylinder, and compared to the risk outside the cylinder, and cluster ‘unusualness’ is evaluated using a likelihood ratio. The cylinder that maximizes the difference between within-cylinder risk and outside-cylinder risk, adjusted for sample size, is the most likely space–time cluster. Cluster significance was evaluated using Monte Carlo randomization (P<0·05). Secondary clusters were defined subject to the constraint that clusters do not overlap geographically at the same time. The Poisson probability model was used for this analysis. SaTScan software was used for all scan statistic analysis [Reference Kulldorff30]. In the analysis reported here, expected numbers of cases in each MOH were proportional to the population multiplied by the leptospirosis case ratio during the endemic period. We report the clusters identified by the space–time scan statistic as risk clusters.
A second analysis was performed to identify clusters of rapidly increasing risk. Linearly increasing trends in the rate of disease can be identified in the same way as clusters of high risk; however, in this case the temporal dimension is fixed [Reference Kulldorff30]. The temporal trend in monthly rate of disease inside each cylinder is compared to the trend outside the cylinder, and the cylinder maximizing the difference in trend is the most likely cluster. Significance is determined using Monte Carlo randomization similar to the traditional scan statistic. Trend clusters of leptospirosis were used to indicate areas where disease patterns were changing rapidly.
Clusters identified in the scan analysis were then used to explore unusual risk factors at these locations. Because the scan statistic methodology uses circular scanning windows to identify compact geographical clusters, locations where risk or trend is negligible can be included in clusters if they are surrounded by high risk/trend areas. Moreover, areas of low relative risk can be seen as extremely high risk in the presence of only a few cases (i.e. small numbers problem). To account for these scenarios, MOH areas that were part of clusters but had fewer than six cases were re-coded as non-cluster areas in the risk-factor and subsequent analysis. This threshold constrains the risk-factor analysis to ensure cluster locations are truly unusual and unlikely due to random variation.
Logistic regression was used to model cluster membership (1=cluster, 0=no cluster) with the MOH area spatial covariates outlined in Table 1. Significant variables in the models for risk and trend clusters were used to predict 2009 cluster locations. The objectives of the regression modelling was to both characterize risk factors and use this information in a way that could be used to aid in the prediction of future patterns. As such, model estimates were transformed from log-odds to probabilities and multiplied by the mean relative risk for each area. These new risk estimates, called cluster-adjusted risks, were mapped and compared to clusters identified in the 2009 data.
RESULTS
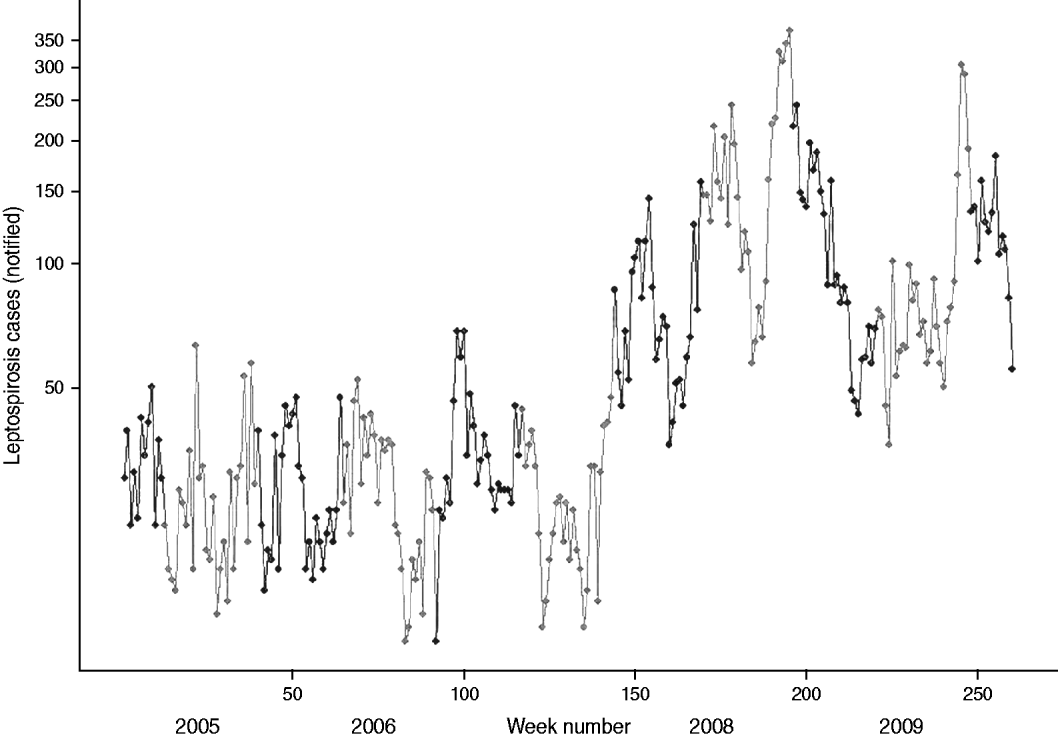
The 2008 outbreak of suspected leptospirosis cases in Sri Lanka is readily apparent from the graph of weekly cases in Figure 3 starting around week 150. There were 7421 cases in 2008, yielding a national average of 34·9 cases/100 000 people. The annual bi-modal distribution is also evident in the fluctuating peaks in the southwest (black symbols in Fig. 3) and northeast (grey symbols in Fig. 3) monsoon seasons. This seasonal pattern breaks down somewhat in 2007 with the delayed onset for the northeast peak into early 2008. High case numbers are sustained throughout 2008 and 2009. In both 2008 and 2009 the southwest peak in cases is much higher than the northeast peak. The spatial distribution of annual cases indicates that high-risk areas were located along a southwest–northeast trajectory during the outbreak (Fig. 4). The proportion of cases reported from the wet zone increased, with cases predominately occurring in the southwest–central corridor between Colombo and Matale.
Weekly number of reported cases of leptospirosis plotted on logarithmic scale, Sri Lanka 2005–2009, northeast (maha) monsoon in black, southwest (yala) monsoon in grey.
Annual number of reported cases of leptospirosis in Sri Lanka and the proportional distribution in ecological zones.

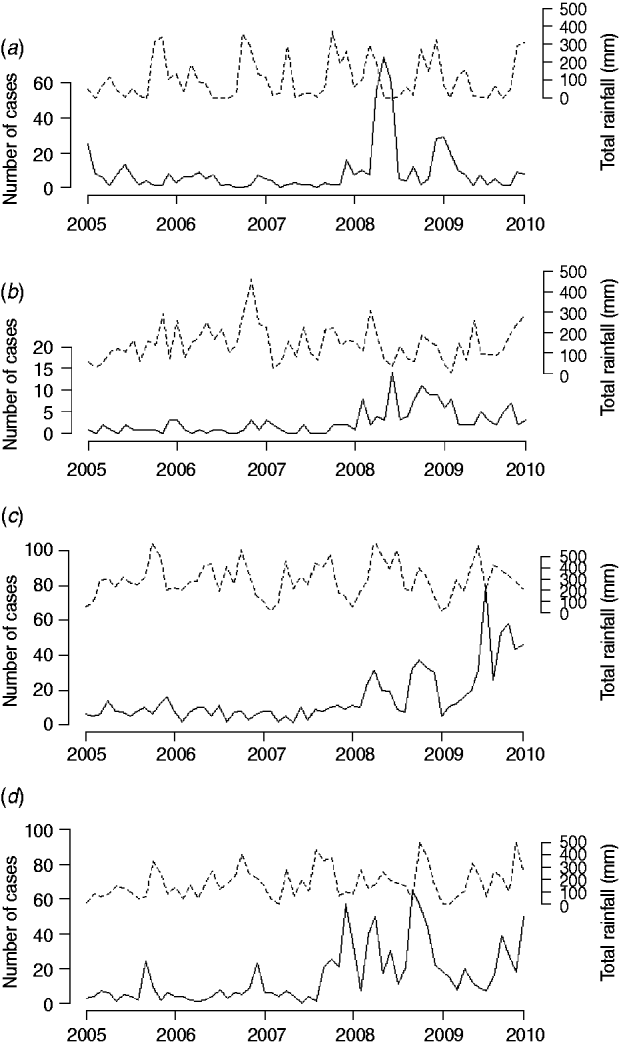
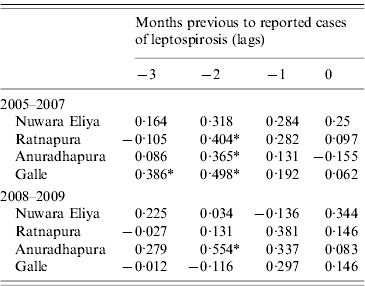
Correlation analysis of the time-series of cases and total rainfall in the four areas during the baseline period revealed significant correlations between reported cases of leptospirosis and total rainfall 2 months previously in three out of the four districts (Table 2). In 2008–2009, this correlation disappeared in Ratnapura and Galle, while strengthening in Anuradhapura. No significant correlations were found for Nuwara Eliya. Figure 5 shows the data used in the cross-correlation analysis. The number of cases in Nuwara Eliya during 2005–2007 was extremely low (Fig. 5 b); however, it began to increase in 2008. Ratnapura, where both rainfall and leptospirosis are more common, did not have any significant zero-lag correlations. One pattern that emerges from Figure 5 in Ratnapura, and to a lesser extent in Galle and Anuradhapura, is the timing of the first peak in rainfall. In 2007 and 2008, the first spike in rainfall occurs earlier in the year than in previous years, indicating heavy rainfall late in the northeast monsoon season.
Total monthly rainfall and total number of reported leptospirosis cases for (a) Anuradhapura, (b) Nuwara Eliya, (c) Ratnapura, and (d) Galle.
Cross-correlations between monthly cases of reported leptospirosis and total rainfall for baseline and outbreak periods in four districts of Sri Lanka
* Significant correlation.
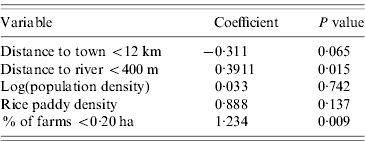
Linear regression analysis revealed positive association between leptospirosis prevalence and the percentage of farms <0·20 ha (0·391, P<0·02) in the MOH, and the average distance to rivers within an MOH <400 m (1·234, P<0·01). No other variables had significant effects on leptospirosis prevalence (Table 3). The model was significant (P<0·01) and model R 2 was 0·17. Residuals did not have any significant spatial autocorrelation and were approximately normal.
Linear regression model for reported leptospirosis prevalence, Sri Lanka, 2005–2007
Space–time cluster analysis revealed one large significant risk cluster in 2008 making up almost the entire southern half of the island (Fig. 6 a). The timing of this cluster was from October to December, roughly corresponding to the northeast monsoon season. There were 800 cases, distributed over a population of 1·09 million. The MOHs that met the selection criteria were all on the western and northwestern edge of the cluster. The trend cluster analysis (Fig. 6 b) revealed that the fastest increasing risks were in MOHs around Kandy, Matale, and Kurunegala. The characteristics of risk and trend clusters for 2008 are outlined in Table 4.
(a) Risk and (b) trend space–time clusters detected in 2008 reported cases of leptospirosis, Sri Lanka.
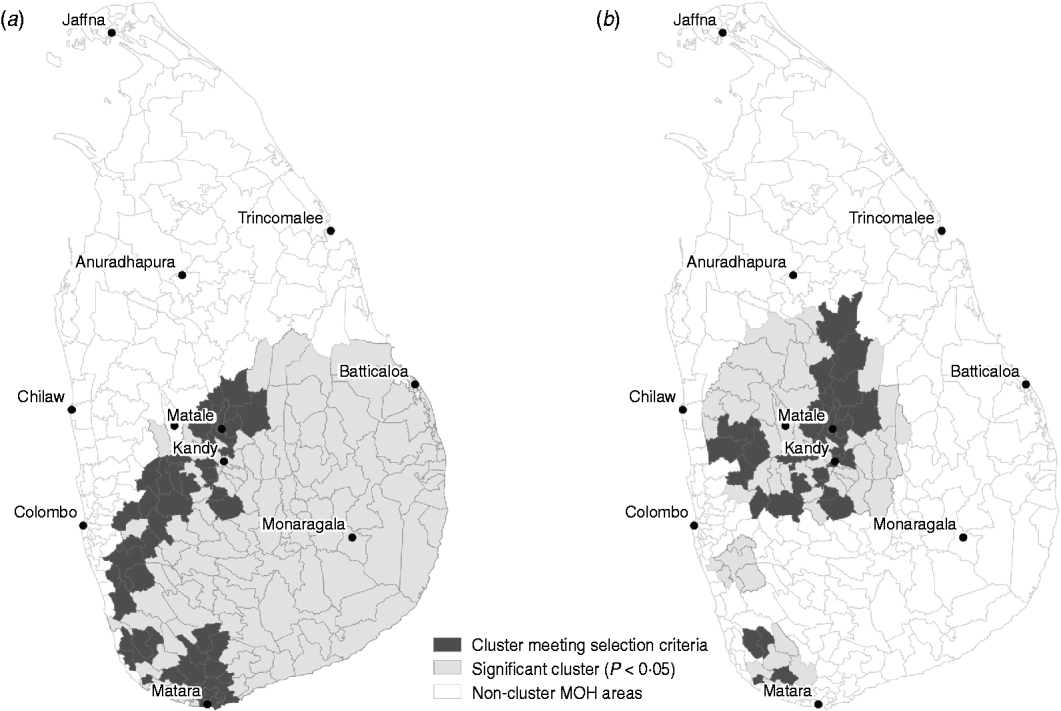
Risk and trend space–time clusters detected in 2008 reported cases of leptospirosis, Sri Lanka
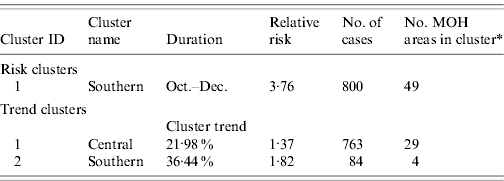
* Total number of MOH areas meeting selection criteria in each cluster. Selection criteria was more than five cases, and relative risk >1.
Results from logistic regression modelling are outlined in Table 5. Risk cluster locations had significant positive associations with population density (OR 1·57, P<0·05) and MOH areas where the average distance to a river was <400 m (OR 4·34, P<0·01). Trend cluster locations were positively associated with population density (OR 1·58, P<0·05), distance to a river (OR 2·84, P<0·05), and negatively associated with percentage of farms <0·20 ha (OR 0·11, P<0·05).
Spatial risk factors associated with risk and trend clusters identified in 2008 reported cases of leptospirosis, Sri Lanka
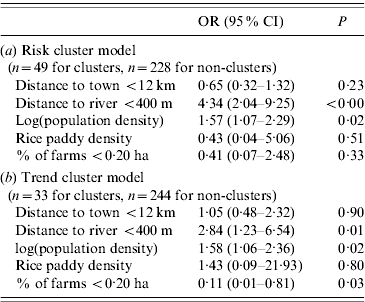
OR, Odds ratio; CI, confidence interval.
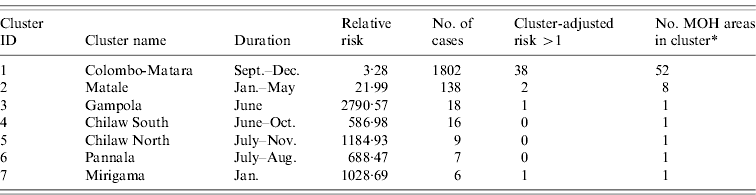
Cluster-adjusted risk-model maps are presented in Figure 7. Risk clusters identified from space–time scan analysis of the 2009 data are also shown. The details of the 2009 clusters are outlined in Table 6. The major cluster occurring from southeast Colombo into Ratnapura, Galle, and Matara contained 1802 cases occurring from September to December 2009. Out of 52 MOH areas meeting the selection criteria in this cluster, 38 had a cluster-adjusted risk >1. The second major cluster, although far less severe, was found in the Matale area, occurring between January and May. This cluster was made up of 138 cases in eight MOH areas, of which two had a cluster-adjusted risk >1. The remaining clusters were very small, containing between six and 18 cases.
Cluster map showing areas with cluster-adjusted risk >1 (dark grey) and 2009 clusters of reported leptospirosis detected using the space–time scan statistic (thick light grey outline). Numbers refer to cluster numbers described in Table 6.
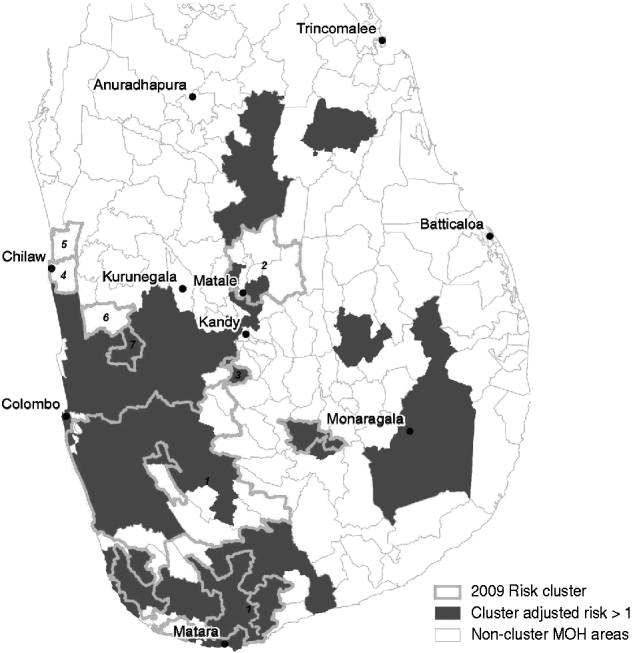
Space–time risk clusters detected in 2009 reported cases of leptospirosis, Sri Lanka, and cluster-adjusted risk-model results from 2008
* Total number of MOH areas meeting selection criteria in each cluster. Selection criteria was more than five cases, and relative risk >1.
DISCUSSION
There have been numerous hypotheses proposed regarding the cause of the 2008 leptospirosis outbreak in Sri Lanka. First is rainfall pattern, as it is typically the primary driver of leptospirosis incidence in the tropics [Reference Victoriano17]. During the baseline period, 2-month lags in correlation between rainfall and cases were detected in three out of four areas. Two mechanisms may explain this pattern. Rainfall occurs, causing floods which displace rodents into habitats in and around housing areas causing greater exposure risk to occupants. A small study in the Kandy area of south-central Sri Lanka which trapped 21 rats (Rattus rattus and Mus musculus) in and around houses found 13 tested positive for leptospira antibodies [Reference Mukthar, Dangolla and Priyantha31]. Second, the observed rainfall-case 2-month correlation may reflect an occupational risk associated with farming occurring in paddy fields during rainy seasons in Sri Lanka. Disentangling the causal relationship between rainfall patterns and incidence and distribution of leptospirosis in Sri Lanka requires further field study.
Correlations between rainfall and cases in Ratnapura and Galle in the baseline period disappear during 2008–2009, while the number of leptospirosis case reports increased dramatically. One reason this may have occurred is a large increase in the rat population. Rainfall and rat populations are often related over times scales of about a year, where rainfall alters habitat, resulting in changes in populations the following season [Reference Madsen and Shine20, Reference Taylor and Green32]. However, our analysis of long-term correlations (not shown) failed to find significant correlations. It may be that the relationship between rainfall and rat populations is more complicated than simple linear correlations [Reference Davis and Calvet21]. Temporal analysis of cross-correlations between suspected cases and rainfall did not provide any evidence of a causal link between rainfall pattern and leptospirosis in 2008 in terms of month-to-month correlation. Only Anuradhapura in the dry zone had significant correlation with rainfall in 2008. Anurhadupra also experienced a large increase in reported cases in 2008 that was extremely unusual compared to the previous years as well as a large amount of late-monsoon rainfall in 2008 that preceded the rise in reported cases. We also observed an early peak in rainfall in locations in the wet zone, which could have altered the endemic transmission cycle of leptospirosis. Early rainfall in 2007 and 2008 actually represents a prolongation of the normal northeast monsoon season. This may have created abundant rodent habitat, prolonging reproduction and causing a spike in rat populations in 2008. The impact of this change would be greater in Anuradahpura, which does not receive year-round rainfall. However, in order establish this connection, a substantive analysis of rainfall pattern and leptospirosis cases throughout all high-risk areas is needed.
Secondary hypotheses regarding the 2008 outbreak have suggested that what are being reported as suspected leptospirosis cases are actually diseases caused by some other pathogen. The serological testing done on cases in Sri Lanka does suggest the possible presence of other pathogens, as positive laboratory confirmations have commonly ranged from only 15–24% of tested samples [Reference Koizumi7, Reference Agampodi, Peacock and Thevanesam33]. In both India [Reference Clement34] and Brazil [Reference Hindrichsen35], hantavirus infections have been found in patients presenting with suspected leptospirosis. Differential diagnoses of leptospirosis from most hantavirus cases cannot be made based on clinical signs [Reference Clement36]. In India, a serological study found 12% of samples that were suspected to be leptospirosis but tested negative, reacted positively for hantavirus antibodies [Reference Clement34]. In Brazil, similar analysis found 5% tested positively for hantavirus infection.
To what extent does our analysis indicate the possibility of other pathogens mimicking symptoms of leptospirosis? The space–time cluster analysis revealed unusually high risk in a large cluster covering most of the southern half of Sri Lanka. The drivers of this cluster, MOH areas with more than five cases and relative risk >1, were all found on the western and southwestern edges. These areas are typical locations of high risk for reported leptospirosis (see Fig. 2). The timing of this cluster corresponded to the northeast monsoon season, a usual period of high risk suggesting an intensification of the normal pattern of leptospirosis in Sri Lanka. Intensifying endemic patterns are also illustrated by fact that the proportion of cases occurring in the wet zone increased during the study period. The association with distance to rivers and number of cases in the wet zone, evident during both endemic and outbreak years, while suggestive of waterborne transmission risk associated with leptospirosis, does not rule out the presence of other pathogens (e.g. rodent habitat for hantaviruses, mosquito habitat for dengue fever). These observations suggest that areas of endemic febrile illness became more prevalent rather than expanded to new areas. Whether this febrile illness is leptospirosis cannot be determined based on this analysis. Expanded testing of the rodent population in cluster locations might help shed more light on this.
The trend clusters identified in this analysis were concentrated north and west of Matale, and interior areas in the south situated northwest of Matara. These may indicate areas where dynamics of infection are rapidly changing, and may therefore be locations where surveys of patients or other forms of active surveillance might be targeted. In the annual risk maps in Figure 4, MOH areas north of Matale appear to have a change in risk starting in 2007. That these same areas are identified as statistically significant trend clusters in 2008 indicates these were areas that experienced the greatest change in risk.
Spatial variables associated with reported leptospirosis during the baseline period indicate higher risk in areas with a high percentage of small-scale agriculture and proximity to rivers and streams. These factors indicate a seasonal, endemic leptospirosis pattern, where human infections occur in areas near small-scale agriculture. Small-scale agriculture landscapes are heterogeneous, providing both habitat and food sources for rat populations.
During the outbreak year, covariates positively associated with risk cluster locations included proximity to rivers and population density. These relationships held for trend clusters as well, with the addition of the variable for percentage of farms <0·20 ha, which had a negative relationship, indicating these are more rural areas where farms are larger. The 0·20 ha threshold might be too small to capture regular small-scale paddy fields in outlying areas, but in areas near large urban centres, this threshold does capture them. The effect of population density and rivers in transmission are similar for both risk and trend clusters. In both models, the variable for average distance to a river being <400 m has a strong effect (although large confidence intervals). Interestingly, rice paddy density was not a significant variable in any of models.
Higher population density does not necessarily imply urban environments in Sri Lanka. Most of the wet zone is densely populated, and a large subset of the population lives in villages and commutes to urban centres for work. A population density association with leptospirosis risk may indicate that transmission during the outbreak period was not occurring in paddy fields, but in densely populated semi-rural villages. Household-level clustering of leptospirosis transmission in Brazil supports this hypothesis [Reference Maciel14]. Closer to Sri Lanka in the Andaman Islands, leptospirosis has been associated with presence of cattle in the home, drinking from streams, and housing characteristics such as thatched roofs [Reference Sugunan37], and in the Seychelles with a number of home-based factors such as walking barefoot, washing in streams, gardening, and presence of refuse around the home [Reference Bovet38]. As noted earlier, a small study in a high-risk leptospirosis area in the Central Province of Sri Lanka found 62% (13/21) of rats trapped around homes tested positive for leptospire antibodies [Reference Mukthar, Dangolla and Priyantha31]. Further study of household-level risk factors in Sri Lanka is needed.
The role of animal reservoirs other than rats remains an important area of inquiry in Sri Lanka. Leptospirosis is commonly known as ‘rat fever’ in Sri Lanka, and knowledge about rats as a risk of infection is accordingly well known, but knowledge is extremely limited about infection from domestic animals or dogs [Reference Agampodi39]. Additional laboratory testing of animals would aid in developing a thorough understanding of transmission processes in Sri Lanka.
When the outbreak-model probabilities were combined with relative risk estimates from 2005 to 2007 to produce cluster-adjusted risk values for each MOH area, and compared to clusters detected in 2009 (Fig. 7), the major cluster southeast of Colombo compared quite well to the cluster-adjusted risk estimates >1. However, large areas had cluster-adjusted risks >1 that were not part of 2009 clusters. For example, areas north of Colombo, west of Kandy, and south of Kurunegala had positive cluster-adjusted risks. This area may be at risk of future outbreak levels of reported cases. Similarly, the areas north of Matale, which were detected as rapidly increasing risk in 2008, may be important areas to focus surveillance on. The alternate explanation, however, is that there are unidentified factors keeping the reported number of cases below the threshold in these areas. This may be due to the dynamics of the pathogen itself, the role of other animal reservoirs, access to healthcare services, or education and surveillance initiatives in these MOH areas.
The major findings of this analysis are that there appears to be a semi-urban pattern to outbreak levels of leptospirosis in Sri Lanka. While proximity to rivers was significant for both the endemic and outbreak periods, population density only became significant in the outbreak model. While the location and timing of cases does suggest strong seasonal dynamics, monthly correlations to rainfall were not detected during 2008–2009. Further analysis of the role of rainfall during the outbreak is needed. Highly populated village areas in the wet zone are at greatest risk during outbreak periods, but not necessarily only those individuals working in the fields.
ACKNOWLEDGEMENTS
This project was funded in part by the Teasdale-Corti Global Health Partnership and the National Sciences and Engineering Research Council of Canada. The authors thank Dr Paba Palihawadana of the Sri Lanka Epidemiolgical Unit for providing access to the data.
DECLARATION OF INTEREST
None.


