

Introduction
The Late Glacial period is characterised by major changes in climate, and related changes in depositional environments, vegetation and human occupation in the NW European lowlands. At the Pleniglacial to Late Glacial transition, rapid temperature rise occurred within decades or less (Steffensen et al., Reference Steffensen, Andersen, Bigler, Clausen, Dahl-Jensen, Fischer, Goto-Azuma, Hansson, Johnsen, Jouzel, Masson-Delmotte, Popp, Rasmussen, Röthlisberger, Ruth, Stauffer, Siggaard-Andersen, Sveinbjörnsdóttir, Svensson and White2008). The Younger Dryas stadial is the final glacial phase of the Weichselian, related to changes in the thermohaline circulation (Bakke et al., Reference Bakke, Lie, Heegaard, Dokken, Haug, Birks, Dulski and Nilsen2009) or to a strongly debated extraterrestrial impact (Firestone et al., Reference Firestone, West, Kennett, Becker, Bunch, Revay, Schultz, Belgya, Kennett, Erlandson, Dickenson, Goodyear, Harris, Howard, Kloosterman, Lechler, Mayewski, Montgomery, Poreda, Darrah, Que Hee, Smith, Stich, Topping, Wittke and Wolbach2007; Van der Hammen & Van Geel, Reference Van der Hammen and Van Geel2008; Van Hoesel et al., Reference Van Hoesel, Hoek, Braadbaart, Van der Plicht, Pennock and Drury2012, Reference Van Hoesel, Hoek, Pennock and Drury2014). In response to these rapid climate shifts, major environmental changes have been observed in vegetation (Van Geel et al., Reference Van Geel, Coope and Van der Hammen1989; Hoek, Reference Hoek1997, Reference Hoek2000; Bos et al., Reference Bos, Verbruggen, Engels and Crombé2013), soil formation (Van der Hammen, Reference Van der Hammen1951; Kaiser et al., Reference Kaiser, Hilgers, Schlaak, Jankowski, Kühn, Bussemer and Przegiętka2009), hydrology (Bohncke, Reference Bohncke1991) and fluvial systems (Kasse et al., Reference Kasse, Vandenberghe and Bohncke1995, Reference Kasse, Hoek, Bohncke, Konert, Weijers, Cassee and Van der Zee2005, Reference Kasse, Van Balen, Bohncke, Wallinga and Vreugdenhil2017).
Aeolian activity changed accordingly during the Late Pleniglacial and Late Glacial (Van der Hammen & Wijmstra, Reference Van der Hammen and Wijmstra1971; Derese, Reference Derese2011; Meinsen et al., Reference Meinsen, Winsemann, Roskosch, Brandes, Frechen, Dultz and Böttcher2014). Aeolian deposition probably decreased due to the interstadial conditions since the onset of the Bølling. However, extensive sand-sheet deposition (Older Coversand II) continued over the Late Pleniglacial to Late Glacial climatic transition, since organic material dating from the Bølling is rarely found in coversand sequences, showing a delayed response to the climatic warming (Kasse, Reference Kasse1997, Reference Kasse2002; Vandenberghe et al., Reference Vandenberghe, Derese, Kasse and Van den haute2013). In many locations aeolian deposition continued (Younger Coversand I) up to the Allerød when the Usselo Soil was formed. The Younger Dryas cooling and reduction of the vegetation cover and fluvial system changes to a braided river style resulted in deflation and redeposition of previously deposited coversands and in local dune formation along rivers (Kasse, Reference Kasse2002).
Human occupation was absent in the NW European lowlands during the maximum cold of the last glacial (30–15.5ka cal BP) (Gamble, Reference Gamble1986; Peeters & Momber, Reference Peeters and Momber2014). From c. 13,000 BP (15.5ka cal BP) to 12,000 BP (14.0ka cal BP), groups of hunter-gatherers of two different cultural traditions were present in the region: first the Magdalénian people predominantly in the southern Netherlands and Belgium, and later also the Hamburgian people north of the Rhine–Meuse river area in the central Netherlands (Arts & Deeben, Reference Arts, Deeben, Burdukiewicz and Kobusiewicz1987; Lanting & Van der Plicht, 1995/Reference Lanting and Van der Plicht1996). From c. 12,000 BP (14.0ka cal BP) onwards, Federmesser groups are present in the Netherlands and Belgium, and Federmesser artefacts are encountered in the Usselo Soil of the Allerød interstadial (Deeben & Arts, Reference Deeben, Arts, Louwe Kooijmans, Van den Broeke, Fokkens and Van Gijn2005; Derese et al., Reference Derese, Vandenberghe, Van Gils, Mees, Paulissen and Van den haute2012). Federmesser hunter-gatherers hunted horse, elk, wild boar, hare and beaver and fished pike and salmonids (Lauwerier & Deeben, Reference Lauwerier and Deeben2011). Later, during the Younger Dryas stadial, Ahrensburg hunter-gatherers occupied the landscape (De Bie & Vermeersch, Reference De Bie and Vermeersch1998; Deeben & Arts, Reference Deeben, Arts, Louwe Kooijmans, Van den Broeke, Fokkens and Van Gijn2005; Crombé et al., Reference Crombé, Deeben, Van Strydonck, Jaubert, Fourment and Depaepe2014a,b). Reindeer was an important part of the subsistence of the Ahrensburgian hunter-gatherers during the Younger Dryas stadial. It has been postulated that the subsistence–settlement system and mobility was directed by the seasonal mobility of the reindeer herds from northern Germany or the dry North Sea basin to the south (e.g. Baales, Reference Baales1996); another view moderated to shorter distance migration between the SE Netherlands in summer and the Ardennes in winter (Arts & Deeben, Reference Arts and Deeben1981). The Federmesser and Ahrensburg habitation occurred predominantly on well-drained coversand ridges near lakes, fens and oxbow lakes (Deeben & Arts, Reference Deeben, Arts, Louwe Kooijmans, Van den Broeke, Fokkens and Van Gijn2005; Deeben & Rensink, Reference Deeben, Rensink, Deeben, Drenth, Van Oorsouw and Verhart2005; De Bie & Van Gils, Reference De Bie and Van Gils2006; Crombé et al., Reference Crombé, Sergeant, Robinson and De Reu2011, Reference Crombé, De Smedt, Davies, Gelorini, Zwertvaegher, Langohr, Van Damme, Demiddele, Van Strydonck, Antrop, Bourgeois, De Maeyer, De Reu, Finke, Van Meirvenne and Verniers2013; Van den Biggelaar & Kluiving, Reference Van den Biggelaar and Kluiving2015; Van den Biggelaar et al., Reference Van den Biggelaar, Kluiving, Kolen and Kasse2016 for an overview of Younger Dryas archaeological sites and dates in NW Europe).
Previously, landscape instability and aeolian sedimentation phases have often been indirectly dated, based on the lithostratigraphic position of sediment units (Van der Hammen & Wijmstra, Reference Van der Hammen and Wijmstra1971), the presence or absence of cryogenic structures (Vandenberghe, Reference Vandenberghe1985; Kasse, Reference Kasse1997, Reference Kasse2002), vegetation composition and radiocarbon dates of under- and overlying peats and soils (Van Geel et al., Reference Van Geel, Coope and Van der Hammen1989). The dating and correlation of Late Palaeolithic Ahrensburg sites was also based on the stratigraphic position of the artefacts and the nature of the lithic industry in combination with radiocarbon dating (Lanting & Van der Plicht, 1995/Reference Lanting and Van der Plicht1996; De Bie & Vermeersch, Reference De Bie and Vermeersch1998; Crombé et al., Reference Crombé, Deeben, Van Strydonck, Jaubert, Fourment and Depaepe2014a,b). However, sites have been attributed to the Ahrensburg culture based on artefact typology, but may lack a reliable stratigraphic and age control (Vermeersch, Reference Vermeersch2011). On the other hand, sites have been attributed to the Ahrensburgian although the artefacts typical for this period such as tanged points (in Dutch: steelspitsen) are missing (Veil, Reference Veil1987; Deeben et al., Reference Deeben, Dijkstra and Van Gisbergen2000, Crombé et al., Reference Crombé, Deeben, Van Strydonck, Jaubert, Fourment and Depaepe2014a,b). Finally, cultural remains from different periods or cultures (Federmesser, Ahrensburg and Mesolithic) may have been preserved in the same soil horizon due to surface stability and the absence of sedimentation (Vermeersch, Reference Vermeersch2011). Deflation can lead to a concentration of larger artefacts in the same horizon as well, but in that case the smaller flint chips are often absent.
Luminescence dating circumvents the problem of indirect dating as sand grains are dated from sand units. Luminescence dating therefore enables direct dating of aeolian sediments deposited during phases of landscape instability. Optically stimulated luminescence dating of quartz following the single-aliquot regenerative-dose (SAR) protocol (Murray & Wintle, Reference Murray and Wintle2000) has yielded reliable ages in different geomorphological settings (see e.g. Hilgers et al., Reference Hilgers, Murray, Schlaak and Radtke2001; Murray & Olley, Reference Murray and Olley2002; Wintle & Murray, Reference Wintle and Murray2006; Wintle, Reference Wintle2008 and references therein; Madsen & Murray, Reference Madsen and Murray2009). Late Weichselian fluvio-aeolian and aeolian successions in the NW European lowlands have been successfully dated (e.g. Vandenberghe et al., Reference Vandenberghe, Kasse, Hossain, De Corte, Van den haute, Fuchs and Murray2004, Reference Vandenberghe, Vanneste, Verbeeck, Paulissen, Buylaert, De Corte and Van den haute2009, Reference Vandenberghe, Derese, Kasse and Van den haute2013; Kasse et al., Reference Kasse, Vandenberghe, De Corte and van den Haute2007; Wallinga et al., Reference Wallinga, Davids and Dijkmans2007; Buylaert et al., Reference Buylaert, Ghysels, Murray, Thomsen, Vandenberghe, De Corte, Heyse and Van den haute2009; Derese et al., Reference Derese, Vandenberghe, Paulissen and Van den haute2009, Reference Derese, Vandenberghe, Eggermont, Bastiaens, Annaert and Van den haute2010a,Reference Derese, Vandenberghe, Zwertvaegher, Court-Picon, Crombé, Verniers and Van den hauteb, Reference Derese, Vandenberghe, Van Gils, Mees, Paulissen and Van den haute2012; Van Mourik et al., Reference Van Mourik, Nierop and Vandenberghe2010; Bogemans & Vandenberghe, Reference Bogemans and Vandenberghe2011; Beerten et al., Reference Beerten, Vandersmissen, Deforce and Vandenberghe2014).
The Geldrop-A2 site is characterised by a well-developed Late Weichselian coversand and Holocene drift-sand stratigraphy (Older Coversand II/Younger Coversand I, Usselo Soil, Younger Coversand II, Podzol, drift sand) (Fig. 1). In addition, the area is well-known for its Late Palaeolithic Ahrensburg occupation and therefore protected under the Monuments and Historic Buildings Act. Due to reconstruction of highway A2 in 2009, the area was reinvestigated and new Late Palaeolithic finds were made. Due to the presence of oblique truncated points (b-points), an elongated trapeze and asymmetrical trapeze (Zonhoven point) and their stratigraphic position, the finds could be attributed to the Ahrensburg culture (Tump et al., Reference Tump, Vroomans, Tebbens and Kasse2014: 149–153). The 2009 exposures (Geldrop-A2) therefore offered a unique opportunity to study the coversand stratigraphy, i.e. phases of landscape dynamics and palaeosoil formation during landscape stability, in relation to human occupation and associated archaeological sites (Derese et al., Reference Derese, Vandenberghe, Van Gils, Mees, Paulissen and Van den haute2012; Tump et al., Reference Tump, Vroomans, Tebbens and Kasse2014).
Chronostratigraphy, coversand stratigraphy and archaeological periods of the Late Weichselian aeolian sediments in the Netherlands; OC: Older Coversands; YC: Younger Coversands; LLB: Lower Loamy Bed (based on Van der Hammen, Reference Van der Hammen1951; Van der Hammen & Wijmstra, Reference Van der Hammen and Wijmstra1971; Van Huissteden, Reference Van Huissteden1990; Hoek, Reference Hoek2001; Van Huissteden et al., Reference Van Huissteden, Schwan and Bateman2001; Derese et al., Reference Derese, Vandenberghe, Eggermont, Bastiaens, Annaert and Van den haute2010a,Reference Derese, Vandenberghe, Zwertvaegher, Court-Picon, Crombé, Verniers and Van den hauteb; Vandenberghe et al., Reference Vandenberghe, Derese, Kasse and Van den haute2013).

The aim of the present study is to establish: (1) the Late Glacial aeolian coversand stratigraphy and depositional environments; (2) a chronological framework of the aeolian deposits and soils and changes in aeolian activity in the landscape; (3) a chronological framework of the archeological findlayer (Ahrensburg culture); and (4) the relation between environmental changes, aeolian activity and human occupation of the landscape during the Younger Dryas.
Geological and geomorphological setting
The site is located south of Eindhoven in the southern Netherlands (Dutch coordinate system x=163.400; y=378.250) (Fig. 2), in the SE–NW-oriented Roer Valley Graben. The current extension phase of the graben started during the Late Oligocene (Van Balen et al., Reference Van Balen, Houtgast and Cloetingh2005). The graben was filled during the Early and Middle Pleistocene with Rhine and Meuse river deposits and with local fluvial and aeolian sediments ~400,000 years ago (Schokker et al., Reference Schokker, Cleveringa, Murray, Wallinga and Westerhoff2005). The present-day landscape is characterised by aeolian landforms related to Late Pleistocene coversand and Holocene drift-sand deposition. The area has been mapped as inland dunes (code 4L8) on the geomorphological map 1:50,000, and according to the soil map 1:50,000 the soils are in an initial stage of formation (Dutch: Duinvaaggronden (code Zd21); world reference base for soil resources 2014: Arenosols).
Digital Elevation Model with location of the investigated site Geldrop-A2 (after Tump et al., Reference Tump, Vroomans, Tebbens and Kasse2014). Note the complex coversand and drift-sand morphology with linear and parabolic dunes and deflation hollows. Elevation in m above OD (Ordnance Datum) extracted from AHN2.

The area is situated generally between 20 and 26m above NAP (Dutch OD). The study site is located on a large coversand ridge complex, with a SW–NE orientation. Superimposed on this structure, parabolic dune forms and deflation hollows are present, indicating predominantly southwesterly winds during their formation. An extensive low-lying, former lake area is present southeast of the investigated site.
Previous age information
The area is well known for its Late Palaeolithic Ahrensburg occupation, previously investigated in the 1950s, 1960s and 1980s (Bohmers & Wouters, Reference Bohmers and Wouters1962; Taute, Reference Taute1968; Rozoy, Reference Rozoy1978; Deeben, Reference Deeben and Otte1988; Deeben & Schreurs, Reference Deeben, Schreurs, Niekus, Barton, Street and Terberger2012) (Fig. 3; Table 1). Archaeological site Geldrop 1, with the same stratigraphy and Ahrensburgian artefacts as Geldrop-A2, has been excavated in the near neighborhood (Wouters, Reference Wouters1957; Taute, Reference Taute1968: 150–151; Deeben, Reference Deeben and Otte1988). Two charcoal samples have been radiocarbon-dated at 11,020±230 BP (13,146–12,774 cal BP) (GrN-603) of the Usselo soil and 10,960±95 BP (12,988–12,790 cal BP) (GrN-1059) of a ‘fireplace’ (Vogel & Waterbolk, Reference Vogel and Waterbolk1963: 164; Lanting & Van der Plicht, 1995/Reference Lanting and Van der Plicht1996; Deeben et al., Reference Deeben, Dijkstra and Van Gisbergen2000: 96); calcined bone gave an age of 10,500±70 BP (12,635–12,441 cal BP) (GrA-15177) (Deeben et al., Reference Deeben, Dijkstra and Van Gisbergen2000: 106).
Location map of the study area and previous archaeological investigations.

Previous age control of nearby sites and comparison with the present results of site Geldrop A2.

Archaeological excavation of the Ahrensburg findlayer at the neighbouring site Geldrop Mie Peels has given ages of 10,610±100 BP (12,749–12,582 cal BP) (OxA-2563) on charcoal from Pinus and 10,090±110 BP (11,888–11,459 cal BP) (GrN-16507) (Deeben et al., Reference Deeben, Dijkstra and Van Gisbergen2000: 106; Deeben & Schreurs, Reference Deeben, Schreurs, Niekus, Barton, Street and Terberger2012: 310–311).
Previous investigations have shown that younger Ahrensburg sites also occurred in the upper part of the Younger Coversand II (YCII) unit and in the Holocene podzol (Geldrop 3-1: 10,190±60 BP (12,061–11,824 cal BP; GrA-15181) on burned bone; Geldrop 3-2/1: 9770±60 BP (11,304–11,223 cal BP; GrA-15182)), demonstrating that Ahrensburg people occupied the site in the course of YCII deposition during the final phase of the Younger Dryas and early Preboreal (Deeben et al., Reference Deeben, Dijkstra and Van Gisbergen2000: 106).
Site Geldrop-A2 has been studied and radiocarbon-dated in great detail in order to investigate the local archaeological stratigraphy and the proposed extra-terrestrial impact at the Allerød – Younger Dryas transition (Firestone et al., Reference Firestone, West, Kennett, Becker, Bunch, Revay, Schultz, Belgya, Kennett, Erlandson, Dickenson, Goodyear, Harris, Howard, Kloosterman, Lechler, Mayewski, Montgomery, Poreda, Darrah, Que Hee, Smith, Stich, Topping, Wittke and Wolbach2007; Van Hoesel et al., Reference Van Hoesel, Hoek, Braadbaart, Van der Plicht, Pennock and Drury2012, Reference Van Hoesel, Hoek, Pennock and Drury2014). Twelve radiocarbon dates of fine-grained, mm-size charcoal from the Usselo Soil at site Geldrop-A2 range between 11,020±75 BP (13,044–12,854 cal BP) and 10,755±55 BP (12,784–12,720 cal BP) with a mean age of 10,870±15 BP (12,809–12,774 cal BP) (Van Hoesel et al., Reference Van Hoesel, Hoek, Braadbaart, Van der Plicht, Pennock and Drury2012). Two radiocarbon samples of charcoal from the fine-grained lower part of the YCII unit have yielded dates of 10,765±50 BP (12,785–12,732 cal BP) and 10,735±45 BP (12,775–12,716 cal BP). Geldrop-A2 is the same site as Geldrop–Aalsterhut described by Van Hoesel et al. (Reference Van Hoesel, Hoek, Braadbaart, Van der Plicht, Pennock and Drury2012). However, a site named Aalsterhut already existed and was excavated in 1985 (Deeben, Reference Deeben and Otte1988). Therefore, the site name Geldrop-A2 is proposed in this study.
Methods
Related to the road reconstruction works an archaeological survey was done in 2009 and 2010 (Tump et al., Reference Tump, Vroomans, Tebbens and Kasse2014: 49–72). The exposure consisted of two sections (A in the south, B in the north) with a total length of 95m (Fig. 3). The interval between sections A and B was not exposed because it was a depression in the dune landscape. The profile, up to 2m high, was cleaned, photographed, drawn (scale 1:20), and described and sampled for optically stimulated luminescence (OSL) and radiocarbon dating and micromorphological analysis. Hand corings (21 with 1.3m depth) were performed in front of the exposed profile to investigate the stratigraphy below the exposed section. In one coring (number 17) iron-rich red sand was observed ~10cm above the Usselo Soil, and a small archaeological test pit (1×1m) was made. Red sand, charcoal, flint artefacts and chips and a scraper were found next to and within a concentration of large, cm-size charcoal pieces. Later, this test pit was enlarged to 4×4m in which several flint artefacts were found in (the top of) the Ahrensburg Culture findlayer (5cm thickness), but below the coarser-grained facies of YCII. Below the Ahrensburg findlayer, archaeological finds and large charcoal pieces were absent in the top of the Usselo soil. In a later phase (4b), more 2×2m excavation pits were dug and more stains of red sand and stone artefacts were found in the findlayer of the Ahrensburg Culture.
The excavation pit (‘pit 1’) was located west of the exposed lithological sections in the coversand ridge, c. 10m west of log B6 (Fig. 3). During excavation the remaining part of the coarser-grained YCII unit was removed by manually shovelling this sediment from the top of the Ahrensburg findlayer. Below the YCII a frost-crack polygon pattern became visible in the top of the Ahrensburg findlayer at ~22.85m OD. During excavation and upon deepening of the archaeological findlayer, profiles were drawn to enable comparison of the vertical excavation pit profiles with the large-scale lithological sections (Fig. 4). It appeared that the top (Ahb-horizon) of the underlying Usselo Soil was 5–15cm below the top of the Ahrensburg findlayer, while in the exposed sections the difference between these levels was at maximum 35cm.
(A) Profile 1, section A (south), with well-developed Holocene podzol (after Tump et al., Reference Tump, Vroomans, Tebbens and Kasse2014) and location of OSL samples 10 and 11. Note the absence of the Usselo Soil that was probably incorporated in the Holocene soil. (B) Profile 1, section B (north), with well-developed Usselo Soil and initial Geldrop Soil 1 in the lower part of YCII (after Tump et al., Reference Tump, Vroomans, Tebbens and Kasse2014) and location of OSL samples 1–5 (log B6), 6 (log B11), 7–9 (log B33) and C20, A37, A6 (log B29). The Holocene soil has been eroded prior to drift-sand deposition. The Ahrensburg site was situated in the top of GS1, 10m west of the profile, near log B6.

Radiocarbon-dating samples were collected from the Ahrensburg occupation level in excavation pit 1, situated c. 10m west of the profile (Fig. 3) near log B6. Large, cm-size, charcoal pieces related to red sand concentrations and – most importantly – in context with flint artefacts of the Ahrensburg Culture were selected, directly below the coarser-grained upper part of the YCII unit. The charcoal was determined as trunk wood of Pinus sylvestris /Pinus mugo. Millimetre-size charcoal, possibly incorporated in the Ahrensburg findlayer from the underlying Usselo Soil by upward bioturbation or originating from deflation elsewhere, was not selected. Radiocarbon dates mentioned in the text were calibrated using Oxcal 4.2 (Bronk Ramsey, Reference Bronk Ramsey2009; Reimer et al., Reference Reimer, Bard, Bayliss, Beck, Blackwell, Bronk Ramsey, Grootes, Guilderson, Haflidason, Hajdas, HattŽ, Heaton, Hoffmann, Hogg, Hughen, Kaiser, Kromer, Manning, Niu, Reimer, Richards, Scott, Southon, Staff, Turney and Van der Plicht2013). Calibrated ages are expressed in years BP (2009, the sampling year), using 1 sigma (68%).
In total, 14 samples were collected for OSL dating. The location of the samples is indicated in Figures 4, 5 and 7. The samples were taken by hammering stainless steel cylinders into freshly cleaned exposures. The sediment surrounding each sampling tube was collected for dose rate determination. From each unit, an additional undisturbed sediment sample was taken for assessing the effect of moisture; it was double-wrapped and tightly sealed to retain moisture.
Sedimentary logs of the coversands and drift sands with location of the OSL samples. For location see Figure 4.

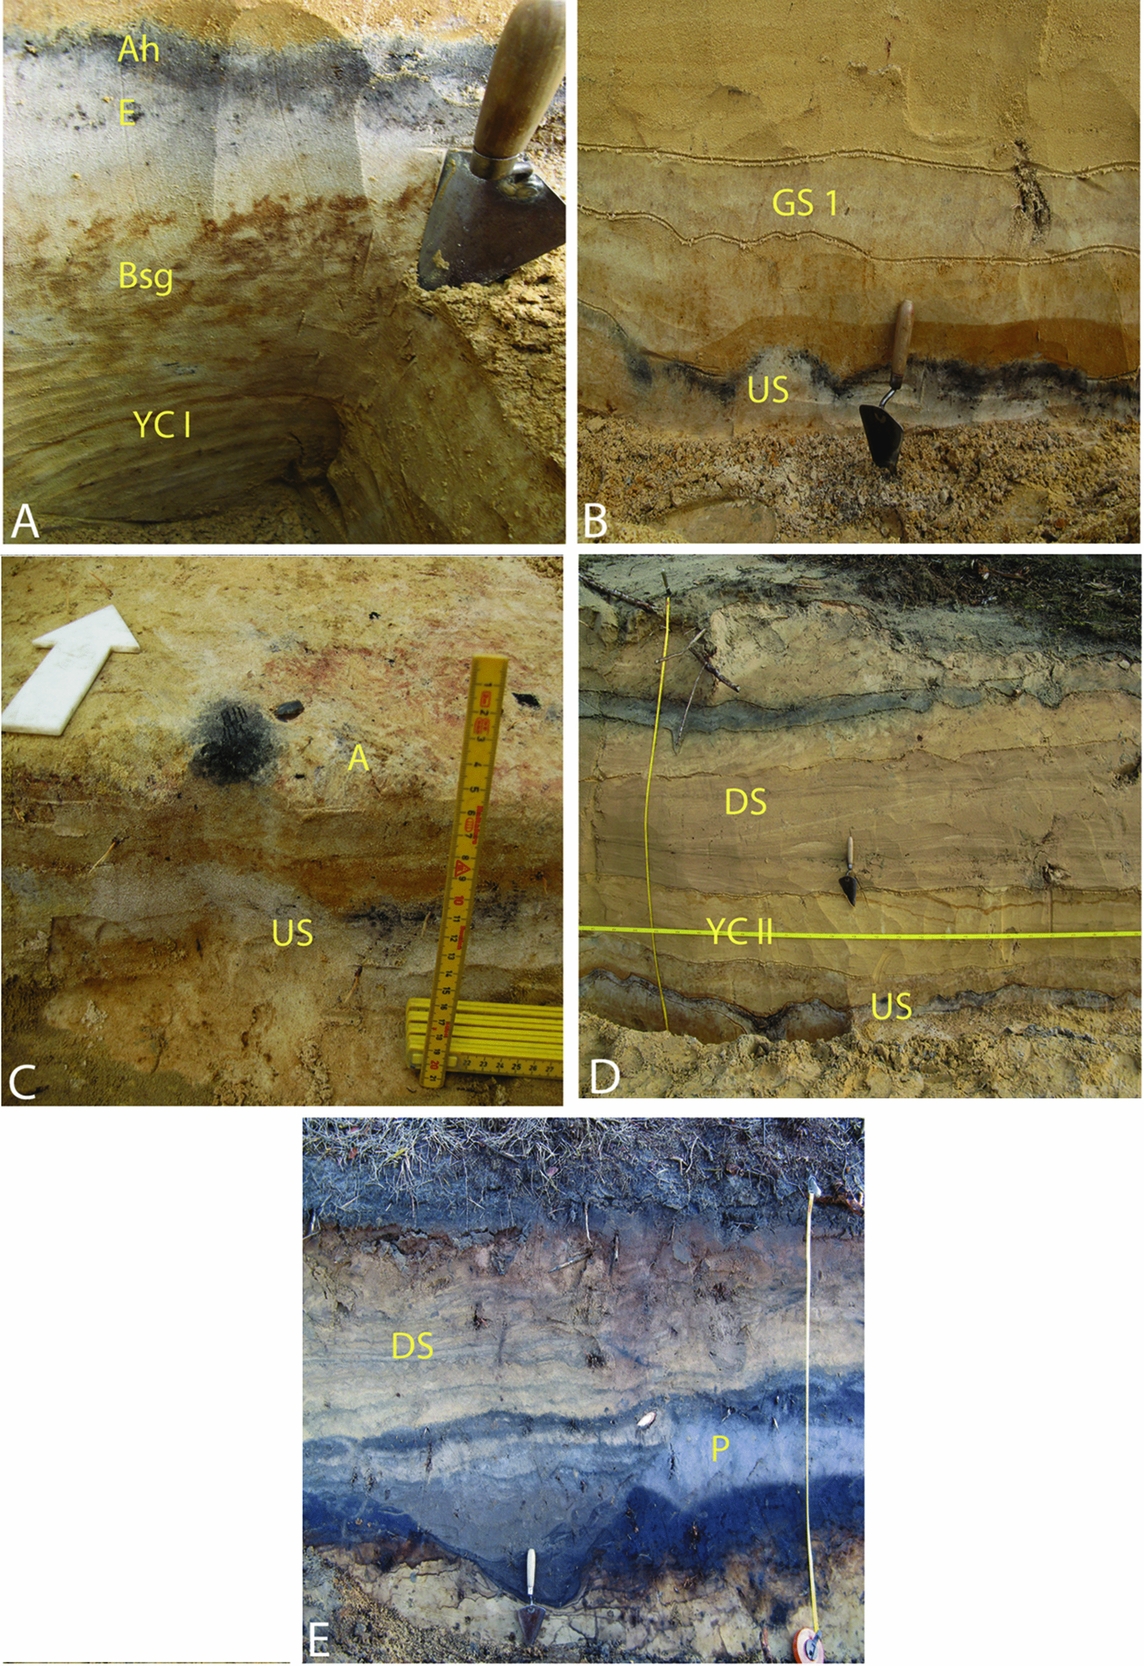
Late Glacial and Holocene aeolian units and intercalated soils. (A) Usselo Soil with Ah, E and Bsg soil horizons developed in YCI (profile 1 section B, log B6). (B) Fine-sandy lower part of YCII with slightly bleached GS1 (between the lines) and related Ahrensburg level, overlying the Usselo Soil (US) with Ah and E-horizons near trowel (profile 1 section B, log B6). (C) Large cm-size charcoal in context with flint and red-coloured sand in the top of the Ahrensburg find layer (A), some 5cm above the Usselo Soil (US) with mm-size charcoal. Note the absence of dung beetle burrows and intact stratigraphy. (D) Drift sand (DS) erosively (near trowel) overlying YCII and Usselo Soil (US); the Holocene podzol has been eroded prior to drift-sand deposition (profile 1 section B, log B11). (E) Drift sand (DS) on Holocene podzol (P) that developed in YCII deposits. Note cart track (near trowel) cutting through the podzol and covered by drift sand (profile 1 section A, log A7).
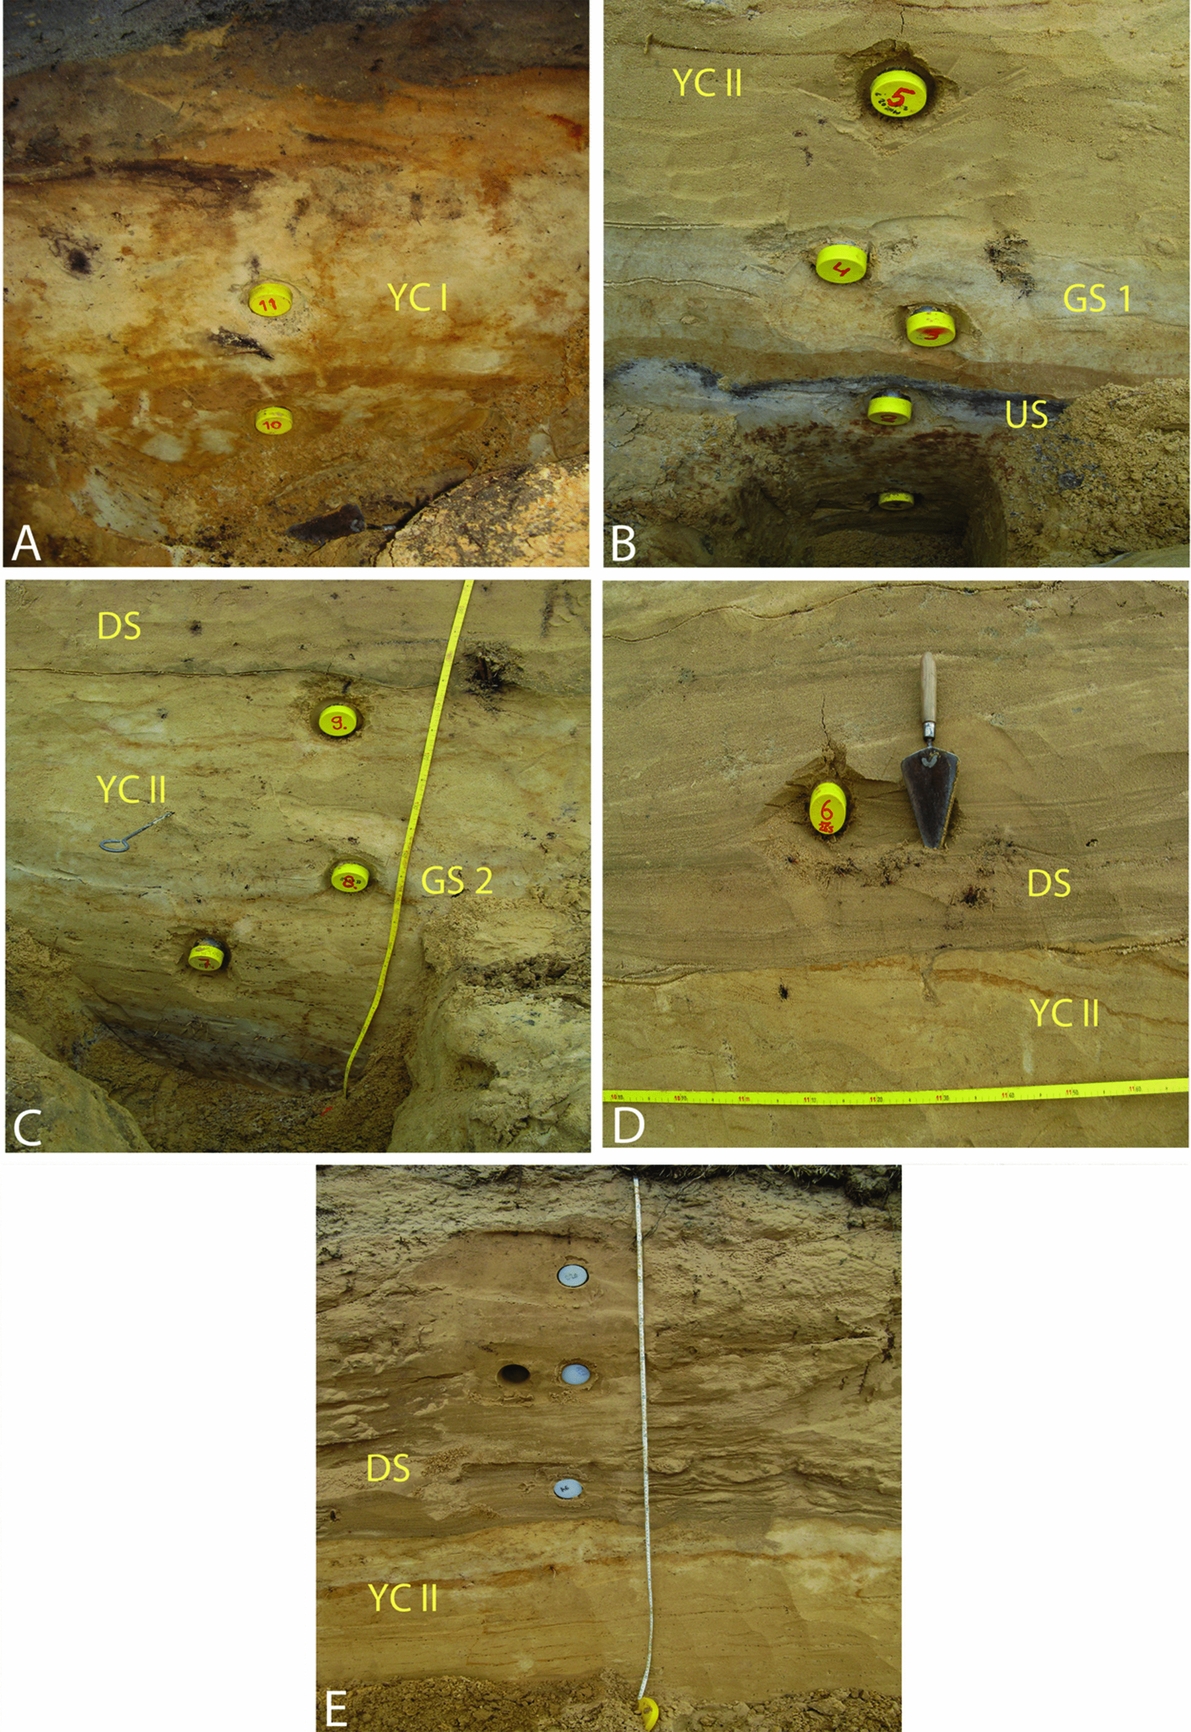
Sampling locations for optical dating. (A) YCI deposits with OSL samples 10 and 11 (profile 1 section A, log A20). (B) YCII (OSL 3,4,5) overlying the Usselo Soil (US) (OSL 2) and YCI (OSL 1). OSL3 and 4 (Geldrop Soil 1; GS1 with Ahrensburg occupation) are situated in the fine-grained lower part of the YCII (profile 1 section B, log B6). (C) Coarser-grained upper part of YCII (OSL 7,8,9) overlain by drift sand (DS). OSL8 is located in Geldrop Soil 2 (GS2) (profile 1 section B, log B33). (D) Drift sand (DS) (OSL 6) overlying YCII with erosive boundary (profile 1 section B, log B11). (E) Drift sand (DS) with OSL samples A4, A37, C20, overlying YCII with erosive boundary (profile 1 section B, log B29).
Coarse (180–212μm) quartz grains were extracted from the inner material of the sampling tubes using conventional sample preparation procedures (HCl, H2O2, sieving and HF). The purity of the samples was confirmed by the absence of a significant infrared stimulated luminescence (IRSL) response at 60°C to a large (~50Gy) regenerative β-dose. The sensitivity to infrared stimulation was defined as significant if the resulting IRSL signal amounted to more than 10% of the corresponding OSL signal (Vandenberghe, Reference Vandenberghe2004) or if the OSL IR depletion ratio (Duller, Reference Duller2003) deviated by more than 10% from unity.
For luminescence analyses, quartz grains were fixed on the inner 8mm of 9.7mm diameter stainless steel discs. All OSL measurements were performed using an automated Risø TL/OSL-DA-12 reader equipped with blue (470±30 nm) diodes and an IR laser diode (830 nm). The quartz luminescence emissions were detected through a 7.5mm thick Hoya U-340 filter. Irradiations were carried out with a 90Sr/90Y β-source mounted on the reader. Details on the measurement equipment can be found in Bøtter-Jensen et al. (Reference Bøtter-Jensen, Andersen, Duller and Murray2003) and references therein.
The equivalent dose (De) was determined by the single-aliquot regenerative-dose protocol as described by Murray & Wintle (Reference Murray and Wintle2000, Reference Murray and Wintle2003). A preheat of 10s at 240°C and a test-dose cutheat to 200°C were used for the coversand samples. To avoid dose overestimation as a result of thermal transfer, a preheat of 10s at 180°C and a cutheat to 160°C were chosen for the drift-sand samples (see e.g. Derese et al., Reference Derese, Vandenberghe, Eggermont, Bastiaens, Annaert and Van den haute2010a). Optical stimulation with the blue diodes was for 40s at 125°C. The initial 0.32s of the decay curve, minus a background evaluated from the 1.44–2.08s interval, was used in the calculations.
The overall suitability of the SAR laboratory measurement procedure was assessed through a dose recovery test (Murray & Wintle, Reference Murray and Wintle2003). In this test, three fresh aliquots of each sample were stimulated with the blue diodes at room temperature for 2× 250s, separated by a pause of 10ks. They were then given a known laboratory dose, and subsequently measured using the SAR protocol as outlined above.
Low-level high-resolution gamma-ray spectrometry was used to determine the dose rate (see Hossain, Reference Hossain2003 and Vandenberghe, Reference Vandenberghe2004). For this, the sediment collected around the OSL sample tubes was dried (at 110°C until constant weight), pulverised and homogenised. A subsample of ~140g was then cast in wax (see e.g. De Corte et al., Reference De Corte, Vandenberghe, De Wispelaere, Buylaert and Van den haute2006) and stored for 1 month before being measured on top of the detector.
The annual dose was calculated from the present-day radionuclide activities using the conversion factors of Adamiec & Aitken (Reference Adamiec and Aitken1998). The external dose rate was corrected for the effects of attenuation and etching using the data tabulated by Mejdahl (Reference Mejdahl1979). An internal dose rate of 0.01Gyka−1 was assumed (based on Vandenberghe et al., Reference Vandenberghe, De Corte, Buylaert, Kučera and Van den haute2008). Both the beta and gamma contributions were corrected for the effect of moisture following the procedure outlined in Aitken (Reference Aitken1985). The saturation water content was measured in the laboratory using the undisturbed sediment samples collected for this purpose. The time-averaged water content was estimated to increase gradually from 50% (for the drift-sand samples) to 80% (for the lowermost sample GLL-090714) of the water content at saturation; a relative uncertainty of 25% was associated with these values. The contribution of cosmic radiation was calculated following Prescott & Hutton (Reference Prescott and Hutton1994).
Results
Lithostratigraphy
The lithostratigraphic nomenclature follows Van der Hammen & Wijmstra (Reference Van der Hammen and Wijmstra1971) and Vandenberghe et al. (Reference Vandenberghe, Derese, Kasse and Van den haute2013) (Fig. 1). The lithostratigraphy and soil stratigraphy of the profiles and the location of the OSL samples are depicted in Figure 4A and B. Detailed sedimentary logs of the OSL-sample locations are given in Figure 5.
The exposed sections along the coversand ridge are generally 1–2m high. At the base the Usselo Soil was frequently encountered. The Late Glacial and Holocene aeolian sequence with intercalated soils is well-preserved, but not present as a layer cake over the whole length of the exposure. In the southern part (section A) the Holocene podzol soil is well-preserved, but the Usselo Soil was not observed as it was most likely overprinted during Holocene soil formation (Fig. 4A). In section B the Holocene podzol is generally absent due to deflation prior to the deposition of the late Holocene drift sands. On the other hand, the Usselo Soil, the overlying fine-grained facies of YCII with in its top the findlayer of the Ahrensburg Culture and the overlying coarser-grained facies of YCII are well developed here (Fig. 4B). The correlation and lithostratigraphy of the two sections is primarily based on the lithological characteristics of the units. Although the units are all of aeolian origin there are, for example, colour differences between the coversands (yellowish brown) and drift sands (greyish brown), even when the Holocene podzol has been eroded (e.g. Fig. 6D). In addition, the presence of soils (Usselo Soil and Holocene podzol) enables the lithostratigraphic interpretation and correlation.
Younger Coversand I
At the base of the profiles the upper c. 50cm of the Younger Coversand I (YCI) unit are exposed (Fig. 4A and B). The sand has a fine to medium grain size (150–210µm) and yellowish brown colour. The upper part is homogeneous by soil formation (Usselo Soil), while deeper a faint loamy lamination has been observed (Figs 5 and 6A). A hand coring at the base of the profile revealed the underlying stratigraphy. At 135–165cm (21.75–21.45m OD) below the base of the exposed profile, a loamy fine sand (105–210 µm) was found with some gleyic phenomena that might represent the Lower Loamy Bed separating the Older Coversand II (OCII) from the YCI (Fig. 1). At 250cm (20.6m OD) a sharp boundary with fine gravel (0.2–1cm), mostly milky quartz, was found that can be interpreted as the Beuningen Gravel Bed, separating the Older Coversand I (OCI) from the OCII.
Usselo Soil
The Usselo Soil (in section B) has developed in fine sand of the underlying YCI unit (Fig. 4B). The sand is homogeneous or massive by soil formation. The soil consists of a dark-grey, humic Ahb-horizon (1–5cm) locally (log B6) with many fine, mm-size charcoal particles (Fig. 5). Below the Ahb-horizon, a c. 10cm thick, light-grey, bleached Eb-horizon is present underlain by a c. 10cm thick, brown, locally mottled (gleyic) horizon (Bsb- or Bgb-horizon; Figs 6A and B and 7B). The soil shows a gently undulating relief of c. 50cm following the former aeolian relief of the YCI unit (Fig. 4B). In the central part of section B the Usselo Soil is higher in the topography. Here, the Bs-horizon has a brown colour since the soil was formed in drier conditions; to the south and north (in section B) the top of the Usselo Soil dips gently from c. 23.4 to 22.2m OD and gleyic phenomena point to periodic wetter soil conditions during its formation (Fig. 6A). North of section B the Usselo Soil grades into a gleyic soil horizon. In section A (south) the Usselo Soil and Holocene podzol soil seem to merge. The YCII unit is thin here and therefore the Usselo Soil has been partly overprinted by Holocene soil formation (Fig. 4A; Tump et al., Reference Tump, Vroomans, Tebbens and Kasse2014: 62–63). Artefacts and red sand spots have not been found in or on top of the Usselo Soil.
Younger Coversand II
The Usselo Soil is overlain by maximally 1.25m of sand of the Younger Coversand II (YCII) unit. The YCII unit thins to the south and north (Fig. 4B). The sand has a fine to medium grain size (105–300 µm) (Fig. 5).
The lower part of the YCII unit is c. 5–25cm thick and fine-grained (Fig. 4B). It consists of slightly loamy fine sand (105–210µm) without sedimentary bedding (Fig. 5) and resembles the sediment of the YCI unit. The upper 5–10cm are homogeneous and have a light-grey colour locally, with gleyic mottles, which is interpreted as an initial soil with a weakly bleached E-horizon (GS1 = Geldrop Soil 1; Figs 6B and 7B). The Ahrensburg find layer is located in the upper 5cm of this soil. No artefacts have been reported in the vertical sections (Fig. 4A and B). Flint artefacts, flint chips and concentrations of red sand (ochre) and charcoal pieces have been found especially in excavation pit 1, located c. 10m west of log B6 (Tump et al., Reference Tump, Vroomans, Tebbens and Kasse2014: 62, 71, 94–101). Based on the flint typology and technology, the finds are ascribed to the Ahrensburg Culture (Fig. 8). The fine-grained unit and incipient soil that developed in it dip gently and increase slightly in thickness to the south (Fig. 4B).
Archaeological finds from the Ahrensburg occupation level (photos from the excavation pit (‘werkput 1’) except for A). (A) Red-coloured feature (probably ochre) above the Usselo soil (test pit 4 during project phase 4b, slightly north of the excavation pit). (B) Red-coloured features (probably ochre) with abundant flint artefacts (too small to see) in the top of the Ahrensburg level. (C) Thumbnail scraper. (D) A selection of flint artefacts with adhering ochre. (E) A selection of b-points (Dutch: ‘b-spitsen’), most likely used for hunting. (F) A selection of flint artefacts. Nr. 650 is a trapeze (Dutch: ‘vierhoek’) or Zonhoven point (‘Zonhoven spits’).

A polygonal frost-crack pattern has been observed in horizontal sections in the finer-grained lower part of YCII with the associated Ahrensburg find layer (Tump et al., Reference Tump, Vroomans, Tebbens and Kasse2014: 70). Large-scale deformations or cryoturbations have not been observed. The vertical distribution of the archaeological finds is less than 5cm, indicating the absence of vertical displacement by periglacial processes.
The upper part of the YCII unit is maximally 1m thick, notably coarser-grained (150–300µm) and has a yellow colour (Figs 4B and 6D). Thin laminae with fine gravel and reworked fine mm-size charcoal particles have been observed locally. The bedding is dominated by parallel and wavy horizontal bedding and low-angle cross bedding (Fig. 5). In this coarser-grained upper part of YCII, one (GS2 = Geldrop Soil 2), possibly two (GS3 = Geldrop Soil 3), fine-grained sand beds occur (Figs 4B (bed 9), 5 (log B29/33) and 7C). GS3 was poorly developed and discontinuous and, as such, not recognised during the drawing of section B. These beds are 5cm thick, consist of slightly loamy, fine sand, are slightly bleached and homogeneous. GS2 dips to the north in the northern part of section B. In the central part of section B, GS2 is truncated by deflation during the drift-sand phase (Fig. 4B). GS2 and GS3 resemble the slightly bleached initial soil (GS1) at the base of the YCII unit; however, they lack artefacts related to the Ahrensburg Culture.
Podzol soil
In the top of the YCII unit, a well-developed humic (iron) podzol soil (Ah–E–Bhs–Bs–BC) has been found in section A (Fig. 4a). Locally, a thin (10cm) sand layer occurred on the podzol in which a second podzol has developed (Figs 5 (log A7) and 6E). In section B the podzol soil is absent and drift sand erosively overlies YCII with some fine gravel at the erosional contact (Figs 4B, 6D and 7C, D and E). Since humic illuviation fibres, characteristic of the podzol-BC horizon, are also absent, more than 50cm has been deflated (i.e. the thickness of the podzol in section A) prior to deposition of drift sand in section B. The elevation of the (former) podzol surface and thickness variation of the YCII unit point to the existence of low-relief dunes of c. 2m at the end of YCII deposition (Fig. 4).
Drift sand
The surface of the drift sand in the profiles and surrounding the excavation shows characteristic aeolian relief of several metres over short distances (Figs 2 and 4). In the described sections, soil development in the drift sand is in an initial stage (O–Ah–C soil profile), but to the north up to five phases of well-developed overblown podzolic soils have been observed in the drift sand. The upper part of the profile in both sections consists of drift sand, maximally 1.7m thick. The drift-sand lower boundary is undulating due to deflation. In section B, drift sand locally overlies the Usselo Soil and the YCII unit has been deflated completely (Fig. 4B). The sand is fine- to medium-grained (150–300µm), slightly humic with a brownish grey colour (Figs 5, 6D and E and 7C, D and E). Laminae with fine gravel and reworked humic material have been observed locally. The bedding is dominated by parallel and wavy horizontal bedding and low-angle cross bedding (Fig. 5). A faint humic soil horizon has been observed in the unit, pointing to a temporary halt in sedimentation (Figs 4B (bed 4), 5 (log B11) and 6D). Imprints of cartwheels forming NE–SW-oriented cart tracks have been found in the top of the Holocene podzol soil and below the drift-sand deposits throughout the study area (Figs 4A and B and 6E) (Tump et al., Reference Tump, Vroomans, Tebbens and Kasse2014: 61, 75, 140–142). The cart tracks are probably part of a post route that connected Eindhoven with Hamont in Belgium (Coenen, Reference Coenen1985; Deeben, Reference Deeben1994: 15).
Geochronology (luminescence and radiocarbon dating) of the section
From each OSL sample, a sufficient amount of pure quartz grains could be extracted. As commonly observed for this type of aeolian material (see e.g. Vandenberghe et al., Reference Vandenberghe, Kasse, Hossain, De Corte, Van den haute, Fuchs and Murray2004, Reference Vandenberghe, Derese, Kasse and Van den haute2013; Kasse et al., Reference Kasse, Vandenberghe, De Corte and van den Haute2007) the quartz extracts showed satisfactory luminescence characteristics in terms of brightness (clearly distinguishable from background), OSL decay (dominated by the fast component), recycling ratios (consistent with unity) and recuperation (generally less than 1% of the sensitivity-corrected natural OSL signal); the overall average recovered to given dose ratios (±1 standard error) was 1.015±0.001 (n=30) and 1.01±0.02 (n=12) for the coversand and drift-sand samples, respectively. These characteristics suggest that the samples are well suited for optical dating; age determination was based on the average De of 18 replicate measurements (±1 standard error) using the SAR protocol and parameters outlined above.
Table 2 summarises the analytical results and shows the calculated optical ages. Uncertainties on the luminescence ages were calculated following the error assessment system proposed by Aitken & Alldred (Reference Aitken and Alldred1972) and Aitken (Reference Aitken1976). All sources of systematic uncertainly were as quantified in our previous studies on comparable deposits in this region (see e.g. Vandenberghe et al., Reference Vandenberghe, Kasse, Hossain, De Corte, Van den haute, Fuchs and Murray2004).
Radionuclide concentrations used for dose rate evaluation, estimates of past water content (w.c.), total dose rates, equivalent doses (De), optical ages, and random (σr), systematic (σsys) and total uncertainties (σtot). The dose rate includes the contributions from internal radioactivity and cosmic rays. The uncertainties mentioned with the dosimetry and De data are random; all uncertainties represent 1σ. For location see Figures 4 and 5.

The optical ages range between 14.6±1.2ka and 0.29±0.02ka (Table 2; Fig. 5) and reveal two age clusters. The older cluster yields dates of the coversand between 14.6±1.2ka and 11.5±0.9ka, indicating a Weichselian Late Glacial age. The younger cluster from the drift sand consists of dates between 0.51±0.06 and 0.29±0.02ka, pointing to a late Holocene age. The major age gap between the clusters covers most of the Holocene, a period characterised by landscape stability and podzol soil formation (cf. Vandenberghe et al., Reference Vandenberghe, Derese, Kasse and Van den haute2013).
The oldest group of dates shows a general age increase with depth. However, the spread indicates the limitations of the OSL method for dating sedimentary units deposited in a geologically short period (Derese, Reference Derese2011: 173). For the lowermost unit (YCI) in both log A20 (samples GLL-090723 and -24) and log B6 (samples GLL-090714 and -15), this spread is somewhat larger than expected from random (i.e. ‘measurement’) uncertainties only (~2–3%, 1 sigma). This may indicate that not all sources of systematic uncertainty are shared between the samples. If the uncertainty associated with the evaluation of the moisture content is taken as an additional source of random uncertainty, for instance, the dates cannot be regarded as statistically different. It is therefore concluded that, in general, the ages within each profile are consistent with the stratigraphic position of the samples and that, as a whole, the dataset is internally consistent.
The radiocarbon age results of the large charcoal pieces related to the Ahrensburg occupation level are shown in Table 3. The three radiocarbon dates of 10,905±35 BP (12,848–12,785 cal BP), 10,955±35 BP (12,884–12,799 cal BP) and 10,885±35 BP (12,832–12,774 cal BP) are internally consistent and centre around 10,915±35 BP (12,854–12,789 cal BP). Furthermore, the radiocarbon dates are in general agreement with the OSL-age results. They are older than the optical dates of the overlying coarser-grained sand of the YCII unit. However, they are also slightly older than the optical dates and radiocarbon dates of mm-size charcoal from the underlying fine-grained part of YCII (Van Hoesel et al., Reference Van Hoesel, Hoek, Braadbaart, Van der Plicht, Pennock and Drury2012). As large charcoal pieces were dated, an old-wood effect may have affected the dating results (see discussion).

Interpretation and discussion
The surface morphology (Fig. 2), the dominant grain size of the sediments (150–210µm), the lateral and vertical homogeneity of the lithostratigraphic units and the dominant sedimentary bedding types all indicate an aeolian origin of the exposed sediment units (Fig. 4). Parallel horizontal bedding and low-angle cross bedding are generally interpreted as formed by aeolian deposition on dry surfaces of sand sheets and low dunes (Fig. 5) (Ahlbrandt & Fryberger, Reference Ahlbrandt, Fryberger, Scholle and Spearing1982; Ruegg, Reference Ruegg, Brookfield and Ahlbrandt1983; Schwan, Reference Schwan1988; Kasse, Reference Kasse2002). Wavy bedding and alternating bedding of sand and silty fine sand are commonly associated with deposition on a (temporarily) moist surface. Massive bedding is the result of homogenisation by bioturbation and soil formation (Fig. 5). A conceptual model of the landscape development with aeolian depositional phases, soil formation and human occupation is presented in Figure 9.
Conceptual landscape reconstruction and Ahrensburg occupation during the Late Glacial and Holocene. The archeological site is located beneath the Younger Dryas dune.

Younger Coversand I
The limited exposure depth of the profiles (Fig. 4) hampers the lithostratigraphic interpretation of the base. The possible presence of the Lower Loamy Bed (135–165cm below the base of the profile; 21.75–21.45m OD) indicates that the basal part of the profile probably belongs to the YCI unit (Van der Hammen & Wijmstra, Reference Van der Hammen and Wijmstra1971) (Fig. 1). The Beuningen Gravel Bed at 250cm (20.6m OD) separates the OCI from the OCII and is generally dated to the Late Pleniglacial (c. 19–16ka BP) (Kasse et al., Reference Kasse, Vandenberghe, De Corte and van den Haute2007; Vandenberghe et al., Reference Vandenberghe, Derese, Kasse and Van den haute2013).
In many coversand exposures in the Netherlands and Belgium the OCII and the YCI units often cannot be distinguished since the Lower Loamy Bed of Bølling age that separates the two is not encountered (Kasse, Reference Kasse2002; Derese et al., Reference Derese, Vandenberghe, Van Gils, Mees, Paulissen and Van den haute2012). In these locations the OCII and YCI form one coversand unit, implying that coversand deposition (OCII–YCI) continued over the Late Pleniglacial – Late Glacial climatic transition (14.7ka cal BP), despite rapid climate warming and wetting. Aeolian activity ceased and the landscape was stabilised by forest vegetation only at the start of the Allerød (Hoek, Reference Hoek1997, Reference Hoek2001). This delayed aeolian response to climate change has been attributed to gradual migration of vegetation and soil formation, stabilising the coversand surface (Van Geel et al., Reference Van Geel, Coope and Van der Hammen1989). During this transitional phase, widespread sand-sheet deposition gradually changed to more local deposition in low dunes and ridges (Kasse, Reference Kasse2002). Site Geldrop-A2 demonstrates that at the end of the YCI deposition, low dunes with a relief of c. 1m had developed (Figs 4B and 9A). The continuation of aeolian deposition during the Bølling and Older Dryas may explain the scarcity of human presence (Magdalenian, Hamburgian or Creswellian Culture) in the coversand areas of the Netherlands and Belgium (Crombé et al., Reference Crombé, De Smedt, Davies, Gelorini, Zwertvaegher, Langohr, Van Damme, Demiddele, Van Strydonck, Antrop, Bourgeois, De Maeyer, De Reu, Finke, Van Meirvenne and Verniers2013: 172). In addition, climate changes and availability of resources (herd animals versus solitary species) may explain the occupation density and patterns.
The luminescence dates of the Younger Coversand I unit revealed ages of 12.1±1.0 and 14.4±1.2ka in log B6 and 13.3±1.1 and 14.6±1.2 ka in log A20 (Figs. 5, 7A and B) and a weighted age average of 13.6±1.1ka (n=4). The lithostratigraphic position of the sand unit in log A20 has been based on the loamy sand facies and the absence of the Usselo Soil that is overprinted by Holocene podzol formation. The ages show overlap within age errors and indicate an early Late Glacial age. The YCI unit has formerly been assigned to the Older Dryas stadial (c. 14.1–14.0ka cal BP; Van der Hammen & Wijmstra, Reference Van der Hammen and Wijmstra1971) but given the standard errors of the dates a decisive correlation with the Older Dryas period cannot be made.
The luminescence ages between 14.6±1.2 and 12.1±1.0ka of the YCI unit at Geldrop-A2 are in good agreement with previous age estimates obtained from the OCII–YCI unit in the Netherlands and Belgium (Table 4).
Luminescence ages of the OCII–YCI unit at different sites in the Netherlands and Belgium.

Usselo Soil
The top of the Usselo Soil shows elevation differences of c. 1m (22–23m OD, Tump et al., Reference Tump, Vroomans, Tebbens and Kasse2014: 67–69), indicating that the top of the YCI unit, in which the Usselo Soil formed, had a weakly developed coversand ridge relief (Fig. 4B). The Usselo Soil is well preserved in the central part of the profile where later YCII was deposited. To the north the Usselo Soil shows a dip and probably grades into a gleyic soil (Deeben, Reference Deeben1994, and observation in April 1985). To the south the Usselo Soil was not observed in the profile, but Ahrensburg artefacts have previously been found in the B and BC horizons of the Holocene podzol (Deeben, Reference Deeben1996: 24). This indicates that the Usselo Soil is incorporated or overprinted in the lower part of the Holocene soil, because the protective YCII unit is thin (c. 30cm) in the most southern part (Fig. 4a).
The Usselo Soil is well-developed in comparison to the overlying incipient Geldrop soils 1,2,3 (GS-1 with Ahrensburg finds) that are intercalated in the YCII unit (Fig. 6A and B). The presence of a differentiated soil profile, with Ah, E and Bs/Bw soil horizons, reflects a phase of soil formation and an incipient stage of podzolisation on the higher, well-drained coversand ridge. In low-lying areas the Usselo Soil commonly shows gleyic features and grades into a thin peat bed in formerly waterlogged conditions (Kasse, Reference Kasse2002; Kaiser et al., Reference Kaiser, Hilgers, Schlaak, Jankowski, Kühn, Bussemer and Przegiętka2009; Vandenberghe et al., Reference Vandenberghe, Derese, Kasse and Van den haute2013). The concentration of mm-size charcoal in the top of the soil can be explained by natural forest fires of boreal woodland in combination with climate and vegetation change at the Allerød – Younger Dryas transition (Van der Hammen & Van Geel, Reference Van der Hammen and Van Geel2008; Van Hoesel et al., Reference Van Hoesel, Hoek, Braadbaart, Van der Plicht, Pennock and Drury2012).
The Usselo Soil in the Netherlands and Belgium and equivalent Finow Soil in Germany is generally attributed to the late Allerød and/or early Younger Dryas (Kaiser et al., Reference Kaiser, Hilgers, Schlaak, Jankowski, Kühn, Bussemer and Przegiętka2009). A dataset of 23 radiocarbon dates on charcoal from the top of the Usselo Soil at different sites in the Netherlands has revealed a mean age of 13.1ka cal BP (Hoek, Reference Hoek1997).
The optical age of the Usselo Soil in Geldrop-A2 can be bracketed between the weighted age average of YCI (13.6±1.1ka) and the weighted age average of the fine-grained basal part of YCII (12.1±1.0ka) (Figs 5 and 7B). The optical age of 14.4±1.2ka (log B6) from the Usselo Soil matches the age of the underlying YCI and is older than the Allerød period. The date thus reflects the depositional age of the sediment in which the Usselo Soil formed. The ages obtained for the YCII (see below) overlying the soil can be considered as more reliable minimum ages of the end of soil formation (cf. Kaiser et al., Reference Kaiser, Hilgers, Schlaak, Jankowski, Kühn, Bussemer and Przegiętka2009). The dates imply that the Usselo Soil in Geldrop-A2 was formed during the late Allerød interstadial (14.0–12.9ka cal BP) and onset of the Younger Dryas stadial (12.9–11.7ka cal BP). The optical ages agree with 12 radiocarbon dates from mm-size charcoal in the Usselo Soil at site Geldrop-A2 with a mean age of 10,870±15 BP (12,809–12,774 cal BP; Van Hoesel et al., Reference Van Hoesel, Hoek, Braadbaart, Van der Plicht, Pennock and Drury2012) (Table 1). The obtained optical and radiocarbon ages are in good agreement with an older date on charcoal from the Usselo Soil at the nearby site Geldrop 1 (11,020±230 BP (GrN-603); 13,146–12,774 cal BP) (Lanting & Van der Plicht, 1995/Reference Lanting and Van der Plicht1996: 114; Deeben et al., Reference Deeben, Dijkstra and Van Gisbergen2000: 96). Similar results and discussions related to soil dating have been obtained for the Usselo Soil in the Campine region in Belgium (Derese et al., Reference Derese, Vandenberghe, Van Gils, Mees, Paulissen and Van den haute2012: site Arendonk 15.2±1.3ka; site Lommel 12.4±0.9 and 10.6±0.7ka).
Younger Coversand II and Ahrensburg Culture
The YCII unit has a fine-grained lower and coarser-grained upper part (Fig. 4B). The fine-grained loamy, massive sand at the base of the YCII unit can be explained by slow aeolian accumulation, possibly on a vegetated surface (Fig. 5). It represents the onset of a new phase of aeolian deposition. The fine sands were probably deposited in a pro-dune or inter-dune area with lower wind velocity due to a more sheltered position in front of advancing dunes (Ahlbrandt & Fryberger, Reference Ahlbrandt, Fryberger, Scholle and Spearing1982). Figure 9B does not seem to suggest such a sheltered position during deposition of the fine-grained basal part of YCII. However, accumulation of YCII at the site occurred simultaneously with nearby erosion and therefore the morphology of the site has changed since deposition of the fine-grained basal part of YCII.
The upper part of the fine-grained interval has a bleached, light-grey colour that can be interpreted as a tundra gley soil with initial soil formation (GS1, Fig. 6B). The faint bleaching and gleyic phenomena of the soil are the result of temporary water-saturation and reduction and redistribution of iron during snow melt of the seasonally deeply frozen soil (Tedrow, Reference Tedrow1968; Antoine et al., Reference Antoine, Rousseau, Moine, Kunesch, Hatté, Lang, Tissoux and Zöller2009). The southern and northern dip of the fine sand and incipient soil GS-1 (Fig. 4B) indicates that they were deposited and formed conformably over the Usselo Soil and low-dune relief of the underlying YCI unit (Fig. 9B).
Numerous artefacts have been retrieved from (the top of) the GS-1 soil. Based on the technological characteristics and artefact typology, the site is attributed to hunter-gatherers of the Ahrensburg culture (Fig. 8) (Tump et al., Reference Tump, Vroomans, Tebbens and Kasse2014). The absence of tanged points has previously been attributed to the late Ahrensburg culture (Taute, Reference Taute1968; Lanting & Van der Plicht, 1995/Reference Lanting and Van der Plicht1996; Deeben et al., Reference Deeben, Dijkstra and Van Gisbergen2000: 107). However, at site Geldrop 1, excavated in the 1950s, which probably forms one site with Geldrop-A2, tanged points have been found. Neighbouring sites Geldrop Mie Peels and Geldrop 3-1 (Table 1) have revealed that the abundance of tanged points is not only a chronological development, but probably also relates to the role of the site in the settlement system and its specific function (Deeben et al., Reference Deeben, Dijkstra and Van Gisbergen2000; Deeben & Schreurs, Reference Deeben, Schreurs, Niekus, Barton, Street and Terberger2012). The Ahrensburg site in the top of soil GS-1 has been preserved in situ as there is no evidence for deflation following the occupation. The Usselo Soil and fine-grained lower part of YCII are present below the site. Deflation horizons at the base of the coarser-grained upper part of YCII that covers the site have not been found (Fig. 5). Small and large flint artefacts occur together in combination with red sand and charcoal concentrations, suggesting an in situ preservation (Figs 6C and 8). The red colour might be related to red ochre (pulverised hematite), as was previously found at the Ahrensburg site Geldrop Mie Peels (Deeben & Schreurs, Reference Deeben, Schreurs, Niekus, Barton, Street and Terberger2012: 312). However, the low iron content established by X-ray fluorescence (XRF) analysis and micromorphogical analysis has revealed that the locally red colour of the sand is related to iron-oxide (hematite) coatings around the sand grains (H. Huisman, pers. comm., 2014). The red spots may be caused by local heating of the soil in fireplaces of the Ahrensburg occupation (Crombé et al., Reference Crombé, Sergant, Verbrugge, De Graeve, Cherrette, Mikkelsen, Cnudde, De Kock, Huisman, Van Os, Van Strydonck and Boudin2014b).
There are some indications for periglacial activity (polygonal frost-crack pattern) during formation of the fine-grained lower part of the YCII unit and Ahrensburg find layer. However, significant vertical movements of artefacts did not occur in the investigated sections, in contrast to findings in nearby areas (Deeben et al., Reference Deeben, Hiddink, Huisman, Müller, Schokker and Wallinga2010). The cracks were probably formed during the early Younger Dryas based on the OSL dates of the units. The absence of large-scale deformations is related to the timing of the unit that dates from the Late Glacial. After the Last Glacial Maximum, continuous permafrost and associated large-scale periglacial deformations did not occur in the landscape. Strongly cryoturbated sequences are characteristic for units below the Beuningen Gravel Bed of Late Pleniglacial age (Kasse, Reference Kasse2002). Periglacial deformations above the Beuningen Gravel Bed are rare, but some deformations related to the Younger Dryas stadial have been reported in the Netherlands, especially in poorly drained conditions (Kasse et al., Reference Kasse, Vandenberghe and Bohncke1995). The studied sections at Geldrop-A2 are from well-drained positions as indicated by the Usselo Soil formation and absence of peat layers. The cold Younger Dryas conditions resulted in frost cracking of the surface at the site, but ice-rich permafrost and associated deformations did not develop.
The luminescence ages of the fine-grained lower part of the YCII unit are 12.3±1.0 and 12.0±1.0ka for GS1, with a weighted average of 12.1±1.0ka (Figs 5 (log B6) and 7B). These dates most likely indicate a Younger Dryas age (12.9–11.7ka cal BP) for the onset of YCII deposition and for the Ahrensburg findlayer. However, given the age uncertainties the optical dates do not serve to indicate an early or late Younger Dryas age. The luminescence ages of both the fine-grained lower part (12.1±1.0ka) and the coarser-grained upper part (average 11.9±0.9ka) of the YCII unit show an age overlap, indicating rapid deposition during the Younger Dryas.
The radiocarbon dates of large, cm-size charcoal (Fig. 6C), carefully selected from the Ahrensburg findlayer and GS1 (average 10,915±35 BP; 12,854–12,789 cal BP, Table 3), indicate a late Allerød to early Younger Dryas age (Hoek, Reference Hoek1997). The radiocarbon dates from the Ahrensburg findlayer overlap in age with those of small charcoal particles obtained from the underlying Usselo Soil at this site (Van Hoesel et al., Reference Van Hoesel, Hoek, Braadbaart, Van der Plicht, Pennock and Drury2012; Table 1). Since GS1 and the Usselo Soil are separated by 5–30cm of sediment only, it could be argued that the charcoal in the Ahrensburg findlayer was reworked by wind from the Usselo Soil (Deeben, Reference Deeben1994: 31; Deeben et al., Reference Deeben, Dijkstra and Van Gisbergen2000: 96). In addition, bioturbation related to Geldrop Soil 1 might have resulted in vertical displacement of charcoal from the Usselo Soil upwards into GS1. However, as (1) the charcoal was found in context with red sand and artefact concentrations, (2) in one case the charcoal came from a hearth-like feature, (3) the charcoal was of cm size while the Usselo Soil charcoal was fragmented to mm size and (4) bioturbation by dung beetles was not observed in GS1 (Fig. 6C), reworking can be excluded (Tump et al., Reference Tump, Vroomans, Tebbens and Kasse2014). Despite the in situ nature of the charcoal from the Ahrensburg findlayer, the dates are considered to be maximum ages, because they are derived from large charcoal pieces from Pinus trunk wood. As the pine trees may have reached a considerable age, a possible old-wood effect of up to 200 years must be accounted for (Van Hoesel et al., Reference Van Hoesel, Hoek, Braadbaart, Van der Plicht, Pennock and Drury2012). At the site, the Usselo Soil underlies the Ahrensburg findlayer and is separated from it by c. 15cm of fine-grained deposits only. Ahrensburg people may have collected fossil tree trunks from the Usselo Soil where these were still exposed at the surface. Therefore, the best age estimate for the Ahrensburg occupation at site Geldrop-A2 is c. 10,750 BP (12,750 cal BP) taking into consideration an old-wood effect of up to 200 years and the radiocarbon dates of 10,735±45 BP (12,775–12,716 cal BP) and 10,765±50 BP (12,785–12,732 cal BP) from the underlying fine-grained YCII interval presented by Van Hoesel et al. (Reference Van Hoesel, Hoek, Braadbaart, Van der Plicht, Pennock and Drury2012) (Table 1).
The lithostratigraphic position and age control of the Geldrop A2 site suggest an early Ahrensburg occupation during the early Younger Dryas, comparable to the previously excavated equivalent site Geldrop 1 (10,960±95 BP: 12,988–12,790 cal BP and 10,500±70 BP: 12,635–12,441 cal BP on burnt bone) and the nearby site Mie Peels (Deeben & Schreurs, Reference Deeben, Schreurs, Niekus, Barton, Street and Terberger2012). The age of the Ahrensburg occupation at Geldrop-A2 is in close agreement with the Ahrensburg site Zonhoven in the Belgian Campine region (10,760±70 BP: 12,790–12,709 cal BP) (De Bie & Vermeersch, Reference De Bie and Vermeersch1998; Vermeersch, Reference Vermeersch2011). The Ahrensburg occupation at Geldrop-A2 is older than at type site Stellmoor, dating to the late Younger Dryas and Preboreal (Fischer & Tauber, Reference Fischer and Tauber1986; Weber et al., Reference Weber, Grimm and Baales2011), and as old as or slightly younger than Ahrensburg sites in northern Germany such as Klappholz (Schleswig-Holstein) dating back to the early Younger Dryas: 10,810±80 BP (12,829–12,728 cal BP, AAR-2245-1) and 10,770±60 BP (12,791–12,726 cal BP, AAR-2245-2) (Clausen, Reference Clausen1995, Reference Clausen, Terberger and Eriksen2004). The radiocarbon ages indicate that the origin of the Ahrensburg culture is not necessarily situated, as Vermeersch (Reference Vermeersch, Fagnart, Thevenin, Ducrocq, Souffi and Coudret2008) suggested, in the coversand area of Belgium (Crombé et al., Reference Crombé, Deeben, Van Strydonck, Jaubert, Fourment and Depaepe2014a).
The fine-grained initial soil GS-1 (with Ahrensburg artefacts) probably reflects a short-lived phase of decreased aeolian activity and initial soil formation at the onset of YCII deposition during the early Younger Dryas. It is unclear whether the initial soil formation and related human occupation have a local, system-intrinsic or regional, climatic significance. Decreased aeolian deposition can be an intrinsic geomorphic signal related to dune migration and dune-slack formation. On the other hand, decreased aeolian activity and tundra soil formation might reflect decadal to centennial climate oscillations within the Younger Dryas period, as has been established from lake records (Brauer et al., Reference Brauer, Haug, Dulski, Sigman and Negendank2008; Bakke et al., Reference Bakke, Lie, Heegaard, Dokken, Haug, Birks, Dulski and Nilsen2009). Similar tundra gley horizons in Upper Pleniglacial loess sequences have been attributed to reflect reduced aeolian sedimentation related to short periods of climate amelioration (Antoine et al., Reference Antoine, Rousseau, Moine, Kunesch, Hatté, Lang, Tissoux and Zöller2009).
The radiocarbon and optical ages of Geldrop-A2 suggest that the initial soil GS-1 represents a decadal to centennial period of decreased aeolian deposition and soil formation favouring Ahrensburg occupation of the dune area. The limited depth and degree of soil formation in GS-1 (and GS-2/3) shows some resemblance with the present-day soil that has developed since the stabilisation of the drift sands in the 19th century. Site Geldrop-A2 and the previously excavated site Geldrop-1 are located on a coversand ridge complex near low-lying, wet areas (Figs 2 and 9B). The presence of geomorphic, hydrologic and vegetation gradients and higher well-drained locations in close proximity to lakes provided a favourable niche for human occupation in the Late Glacial (Arts, Reference Arts and Otte1988; Deeben, Reference Deeben and Otte1988; De Bie & Vermeersch, Reference De Bie and Vermeersch1998; Crombé et al., Reference Crombé, Sergeant, Robinson and De Reu2011, Reference Crombé, De Smedt, Davies, Gelorini, Zwertvaegher, Langohr, Van Damme, Demiddele, Van Strydonck, Antrop, Bourgeois, De Maeyer, De Reu, Finke, Van Meirvenne and Verniers2013; Vermeersch, Reference Vermeersch2011; Derese et al., Reference Derese, Vandenberghe, Van Gils, Mees, Paulissen and Van den haute2012; Bos et al., Reference Bos, Verbruggen, Engels and Crombé2013; Van Beek et al., Reference Van Beek, Gouw-Bouman and Bos2015; Van den Biggelaar & Kluiving, Reference Van den Biggelaar and Kluiving2015).
The coarser-grained upper part of the YCII unit is characterised by low-angle cross bedding and undulating relief as indicated by the overlying Holocene podzol soil (Figs 4, 5 and 6D). The YCII unit thins to the south and north and therefore the Holocene podzol and the Usselo Soil laterally merge, indicating that the YCII sand was deposited locally as a dune (Fig. 9C).
The coarser-grained upper part of the YCII unit has been dated to 12.6±1.0 (soil GS2), 12.1±1.0, 11.6±0.9 (Fig. 5, log B33) and 11.5±0.9ka (Fig. 5, log B6; Fig. 7B and C). The weighted average of the four optical dates is 11.9±0.9ka. The four dates show age overlap, indicating that the YCII unit was formed in a short time period. The dates most likely indicate deposition during the Younger Dryas stadial (12.9–11.7ka cal BP), possibly during the second part of the stadial. However, the uncertainties associated with the dates exclude a definitive correlation with the second part of the Younger Dryas. The luminescence results seem to indicate that the YCII deposition at the site ceased at the Younger Dryas to Holocene transition (11.7ka cal BP). However, previous investigations at neighbouring sites (Geldrop 3-1; Geldrop 3-2/oost) have shown that younger Ahrensburg sites are present in the upper part of the YCII unit and in the Bs and BC-horizons of the Holocene podzol. This demonstrates that Ahrensburg occupation reappeared in the final stage of YCII deposition. The radiocarbon dates (Geldrop 3-1: 10,190±60 BP (12,061–11,824 cal BP) (GrA-15181); Geldrop 3-2/1: 9770±60 BP (11,304–11,223 cal BP)) show that YCII deposition extended, at this site, into the Preboreal (Deeben Reference Deeben1995, Reference Deeben1996) (Table 1). A delayed aeolian response to the climate warming, as established for the Late Pleniglacial to Late Glacial transition, was apparently much shorter at the Younger Dryas to Holocene transition (Kasse, Reference Kasse2002). The presence of vegetation, albeit declining during the Younger Dryas, and rapid vegetation colonisation stabilised the sandy surface during the early Holocene (Hoek, Reference Hoek1997, Reference Hoek2001).
The fine-grained initial soils GS-2 and GS-3 probably reflect short periods of decreased aeolian activity and initial soil formation in the YCII dune environment. The sediment in which GS-2 has formed has been dated at 12.6±1.0ka, indicating a Younger Dryas age (Figs 5 and 7C). As for GS-1, it is unknown whether these thin soils have a local or regional climatic significance. Given the age constraints of the YCII unit (12.6±1.0 to 11.5±0.9ka) the initial soils GS-2 and GS-3 probably represent decadal to centennial periods. Such short-lived phases of landscape stability may have favoured human occupation of the dune field area; however, archaeological remains have not been found.
YCII deposition has previously been ascribed to the second, drier part of the Younger Dryas stadial, based on radiocarbon dating of underlying organic material (Bohncke et al., Reference Bohncke, Vandenberghe and Huijzer1993; Kasse, Reference Kasse, Troelstra, Van Hinte and Ganssen1995). The luminescence age of the YCII unit at Geldrop-A2 with a weighted average of 11.9±0.9ka is in good agreement with previous age estimates obtained in the Netherlands and Belgium (Table 5; Derese, Reference Derese2011).
Luminescence ages of the YCII unit at different sites in the Netherlands and Belgium.

Aeolian deposition of the YCII unit during the Younger Dryas stadial and concomitant occupation and exploitation of the landscape in the Netherlands by Ahrensburg hunter-fisher-gatherers may seem puzzling, as landscape instability (aeolian deflation and deposition) and human presence requiring shelter and means of subsistence (food, plants, animals) seem to be conflicting. Derese et al. (Reference Derese, Vandenberghe, Van Gils, Mees, Paulissen and Van den haute2012) stated that the Younger Dryas cooling and increased aeolian activity may have caused the people of the Federmesser Culture to leave the area. However, Ahrensburg sites have been reported as far north as northern Germany. In addition, people possibly adapted to the cold and windy climatic conditions by using wind shields (site Geldrop Mie Peels: Deeben & Schreurs, Reference Deeben, Schreurs, Niekus, Barton, Street and Terberger2012), tents made of animal skins and wind-sheltered locations on the southern slopes of coversand ridge complexes (Bos et al., Reference Bos, Verbruggen, Engels and Crombé2013). Furthermore, sand was only deposited during seasonal storm events and it has been argued that aeolian deposition during the Younger Dryas was not a large-scale, regional phenomenon. YCII deposits are generally encountered in two subregions (Kasse, Reference Kasse2002). First, aeolian deposition occurred east of river valleys as source-bordering dunes, in response to deflation of river braid plains by southwesterly winds (Kasse, Reference Kasse, Troelstra, Van Hinte and Ganssen1995; Kasse et al., Reference Kasse, Vandenberghe and Bohncke1995; Isarin et al., Reference Isarin, Renssen and Koster1997; Vandenberghe et al., Reference Vandenberghe, Kasse, Hossain, De Corte, Van den haute, Fuchs and Murray2004). Secondly, deflation and deposition of YCII occurred on well-drained interfluves and higher coversand ridges with thick coversand deposits (OCII–YCI), where the effect of the Younger Dryas cooling and drying was felt the most (Derese et al., Reference Derese, Vandenberghe, Paulissen and Van den haute2009, Reference Derese, Vandenberghe, Van Gils, Mees, Paulissen and Van den haute2012; Vandenberghe et al., Reference Vandenberghe, Derese, Kasse and Van den haute2013). The opening of the vegetation cover and low groundwater level in the ridges probably resulted in locally bare and dry surfaces that were prone to deflation and redeposition of coversands. The environmental conditions of site Geldrop-A2, situated on a coversand ridge, resemble this situation (Figs 2 and 9C). Outside these two regions of landscape instability, vegetation persisted, although the species composition had changed (Hoek, Reference Hoek1997). Therefore, despite major environmental changes in climate, geomorphology and vegetation, the coversand landscape offered good opportunities for Ahrensburg occupation and landscape exploitation during the Younger Dryas. The archaeological remains at site Geldrop-A2 indicate that humans temporarily occupied areas of YCII deposition, possibly during phases of decreased aeolian deposition.
Podzol
The well-developed humic (iron) podzol soil in the top of the YCII unit indicates a long period of landscape stability following the Younger Dryas coversand deposition (Figs 5 and 6E). To the south the podzol profile dips and the Usselo Soil and GS-1 soil (Ahrensburg findlayer) are partly incorporated in the basal part of the Holocene podzol because of the limited thickness of the YCII deposit (Fig. 9D). To the north, the Usselo Soil dips and is only recognised as a gleyic horizon.
The period of soil formation can be bracketed between 11.5±0.9ka (youngest optical date of YCII) and 0.51±0.06ka (oldest drift-sand date), encompassing most of the Holocene period (cf. Vandenberghe et al., Reference Vandenberghe, Derese, Kasse and Van den haute2013; Beerten et al., Reference Beerten, Vandersmissen, Deforce and Vandenberghe2014). However, locally, a thin (10cm) drift-sand layer overlies the podzol, and a second podzol was formed on top of the older podzol (Tump et al., Reference Tump, Vroomans, Tebbens and Kasse2014: 55) (Fig. 6C). This first phase of local drift-sand formation has not been dated, but could correspond to older, localised, drift-sand phases reported in the southern and central Netherlands (Van Mourik et al., Reference Van Mourik, Nierop and Vandenberghe2010; Sevink et al., Reference Sevink, Koster, Van Geel and Wallinga2013), northern Belgium (Derese et al., Reference Derese, Vandenberghe, Eggermont, Bastiaens, Annaert and Van den haute2010a, site Pulle) and central Europe (Tolksdorf & Kaiser, Reference Tolksdorf and Kaiser2012).
Drift sands
The luminescence dates of the drift sands (0.51±0.06, 0.42±0.04, 0.36±0.03, 0.29±0.02ka; weighted average 0.38±0.03ka) indicate a late Holocene age (Figs 5 and 7D and E). Deposition started after the Middle Ages (16th century) and continued until the 18th century. Deposition spans a period of a few hundred years, and the faint Ah-soil horizons within the drift sands must have formed in short (decadal) time periods.
The presence of NE–SW-oriented cart tracks in the top of the Holocene podzol and below the drift-sand deposits indicates human exploitation of the landscape and (local) destruction of the vegetation cover (Figs 4 and 6E). Pottery finds in the tracks enabled their dating to the 13th century (Tump et al., Reference Tump, Vroomans, Tebbens and Kasse2014: 141), showing that, despite human impact on the landscape, drift-sand deposition only started several centuries later. It may indicate that a threshold of vegetation decline and opening of the landscape had to be reached before deflation and drift-sand accumulation started (Fig. 9E). The start of drift-sand accumulation has previously often been placed in the Middle Ages since the 11th century AD (Castel et al., Reference Castel, Koster and Slotboom1989; Koster, Reference Koster2009). However, this date should be regarded as a maximum age, as it was based on indirect radiocarbon dating of underlying soils or peat. A hiatus may be present between the top of a soil and the start of overlying drift-sand accumulation as indicated, for example, at type locality Lutterzand where the top of the Holocene soil was dated at 1550 ± 43 BP (1580–1515 (43.2%), 1502–1489 (7.3%) and 1483–1454 (17.7%) cal BP), while the drift sands were dated between 0.40±0.04 and 0.20±0.02ka (Vandenberghe et al., Reference Vandenberghe, Derese, Kasse and Van den haute2013). Spek (Reference Spek2004) demonstrated that plaggen soil formation started from the 15th century onwards and it can be argued that the related vegetation decline and drift-sand formation is younger than previously assumed. The young dates of drift-sand deposition at Geldrop-A2 are in agreement with optical dating results from the Netherlands (Van Mourik et al., Reference Van Mourik, Nierop and Vandenberghe2010, Defensiedijk) and Belgium (Beerten et al., Reference Beerten, Vandersmissen, Deforce and Vandenberghe2014).
Conclusions
The multidisciplinary sedimentological, archaeological and dating approach of Late Palaeolithic site Geldrop-A2 has revealed new insights into late Weichselian aeolian deposition and human occupation of the coversand landscape of the southern Netherlands. Site Geldrop-A2 reveals a complete sequence of Late Glacial and Late Holocene aeolian deposits and intercalated soils during periods with stable landscapes (YCI, Usselo Soil, two lithofacies of YCII, Podzol, drift sand). An early-Ahrensburg occupation site has been found in the top of the fine-grained basal part of the YCII unit. Optical dating of the aeolian deposits and radiocarbon dating of the soils and the archaeological site has established a firm chronostratigraphic framework of the aeolian depositional phases, landscape stability, soil formation and Ahrensburg occupation.
YCI was deposited at the site in a low-dune environment during the early Late Glacial at c. 13.6±1.1ka BP. Landscape instability and coversand deposition was still important despite the Late Glacial warming.
Aeolian deposition came to a halt in the Allerød period, and landscape stability and soil formation led to the formation of a podzolic soil (Usselo Soil). Extensive radiocarbon dating of mm-size charcoal in the Usselo Soil at Geldrop-A2 (10,870±15 BP: 12,809–12,774 cal BP; Van Hoesel et al., Reference Van Hoesel, Hoek, Braadbaart, Van der Plicht, Pennock and Drury2012) and equivalent site Geldrop 1 (11,020±230 BP: 13,146–12,774 cal BP) indicates formation during the late Allerød and early Younger Dryas.
Renewed landscape instability and aeolian deposition by low dunes resulted in the formation of the YCII unit, optically dated between 12.6±1.0ka and 11.5±0.9ka BP, i.e. coinciding with the climatic cooling of the Younger Dryas stadial.
An Ahrensburg site related to an initial tundra gley soil (GS1) in the fine-grained lower part of the YCII unit was radiocarbon-dated at 10,915±35 BP (12,854–12,789 cal BP). Occupation by hunter-gatherers of the Ahrensburg Culture most likely occurred during the early Younger Dryas, shortly after 10,750 BP (12,750 cal BP), taking underlying dates into account and a possible old-wood effect of up to 200 years. Site Geldrop-A2 probably corresponds to the same Ahrensburg occupation phase as the previously excavated site Geldrop 1, as demonstrated by the radiocarbon dates of 10,960±95 (12,988–12,790 cal BP) and 10,500±70 BP (12,635–12,441 cal BP).
Despite the enhanced environmental dynamics associated with the Younger Dryas cooling, the coversand landscape was exploited by Ahrensburg people because aeolian deposition was regionally restricted. Initial soil formation and Ahrensburg occupation may reflect a decadal or centennial phase of climatic amelioration with decreased aeolian activity during the early Younger Dryas.
Aeolian activity ceased shortly after the Younger Dryas to Holocene transition during the Preboreal as indicated by optical dating results of the YCII unit (youngest date 11.5±0.9ka BP). Landscape stability and podzol soil formation was dominant during the Holocene period.
Cart tracks, disturbing the Holocene podzol soil, and associated archaeological finds from the 13th century show human impact on the landscape in the Middle Ages. Overlying drift sands, however, were dated between 0.51±0.06 and 0.29±0.02ka BP, indicating a phase of landscape instability during the 16th to 18th centuries.
Acknowledgements
This paper is dedicated to the memory of Jos Deeben who passed away so suddenly during the preparation of the manuscript.
Jan Willem de Kort (RCE) is thanked for his remarks on a concept of this text. Financial support of the Special Research Fund of Ghent University (C. Derese) and the Research Foundation – Flanders (FWO-Vlaanderen; D. Vandenberghe and J. De Grave) is gratefully acknowledged. Rijkswaterstaat Zuid-Nederland paid for the archaeological excavation, including a substantial amount of the dating programme. We thank Gilles Velghe for technical assistance and Peter Van den Haute for general support. Hessel Woolderink is thanked for his help with preparing the figures. The two anonymous reviewers are thanked for their constructive comments, which considerably improved the manuscript.


