

1 INTRODUCTION
Radio recombination lines (RRLs) are produced in regions of diffuse partially ionised gas, typically associated with interstellar radiation fields from stars (Sorochenko & Tsivilev Reference Sorochenko and Tsivilev2010). Atoms in high quantum states are important tracers of ionised gas within photon-dominated regions (PDRs), where the far-ultraviolet (FUV) radiation from stars that are embedded within the molecular clouds interact with the neutral hydrogen gas surrounding the H ii regions (Andree-Labsch, Ossenkopf-Okada, & Röllig Reference Andree-Labsch, Ossenkopf-Okada and Röllig2017). In particular, FUV photons originating from high-mass stars embedded within their natal molecular clouds with energies greater than 11.3 eV are able to penetrate their surroundings by greater than parsec scales (Howe et al. Reference Howe, Jaffe, Grossman, Wall, Mangum and Stacey1993) to ionise atomic carbon in regions where hydrogen is mostly neutral (Salgado et al. Reference Salgado, Morabito, Oonk, Salas, Toribio, Röttgering and Tielens2017b).
Seon et al. (Reference Seon, Witt, Kim, Shinn, Edelstein, Min and Han2011) found a strong correlation of FUV radiation field with Hα emission outside the bright H ii regions due to a common radiative transfer mechanism. Cooling of the gas in the PDR is dominated by C i infrared line emission at 158 μm, molecular rotational lines of CO (J = 1→0), and generates a mechanism to create carbon radio recombination lines (CRRLs) detectable in the radio part of the electromagnetic spectrum (Sorochenko & Tsivilev Reference Sorochenko and Tsivilev2010; Andree-Labsch et al. Reference Andree-Labsch, Ossenkopf-Okada and Röllig2017).
The Orion molecular cloud complex is one of the closest regions of active high-mass star formation, making it ideal for the study of PDRs (Gordon & Sorochenko Reference Gordon and Sorochenko2009; O’Dell et al. Reference O’Dell, Ferland, Henney, Peimbert, García-Díaz and Rubin2015). The Orion molecular cloud was first modelled to have multiple layers of ionised gas by Ahmad (Reference Ahmad1976) and Boughton (Reference Boughton1978) further elaborated on the ideas. Boughton (Reference Boughton1978) concluded that within the H i foreground region, carbon must be a significant source of the free electrons. Both studies suggest that the low-frequency RRLs (n < 190) arise in clouds associated with the H i (21 cm) component of the cold interstellar medium with temperatures <100 K and gas densities ≈ 50 cm3.
Since then, a complex filamentary structure around Orion, on both large and small scales, has been widely observed and discussed (Pon et al. Reference Pon, Johnstone, Bally and Heiles2014, Reference Pon, Ochsendorf, Alves, Bally, Basu and Tielens2016; Andree-Labsch et al. Reference Andree-Labsch, Ossenkopf-Okada and Röllig2017). Even early optical studies with high angular resolution (Osterbrock & Flather Reference Osterbrock and Flather1959) suggest that the filamentary structure of the H ii regions is on scales that would not be resolved with most telescopes, and Gordon & Sorochenko (Reference Gordon and Sorochenko2009) suggest that many of the models have not incorporated these inhomogeneities, making interpretation of observational results difficult.
Recent three-dimensional modelling, mixed with observational data by Andree-Labsch et al. (Reference Andree-Labsch, Ossenkopf-Okada and Röllig2017), of the PDRs around Orion show fractal structures that contain layers and explains why a large fraction of molecular material is located near the surface of the cloud. Pon et al. (Reference Pon, Johnstone, Bally and Heiles2014) identified linear H i features extended radially away from the Orion Kleinmann−Low Nebula (Orion KL) with significant increases in regions where the Hα decreases. Pon et al. (Reference Pon, Ochsendorf, Alves, Bally, Basu and Tielens2016) attributed this behaviour to ionising photons breaking out of the Orion-Eridanus superbubble surrounding the Orion region, extending about 180 pc from our Sun.
Observations of Hα (Finkbeiner Reference Finkbeiner2003), C i, C ii, CO (6→5) (Stutzki et al. Reference Stutzki, Graf, Genzel, Harris, Hills, Russell, James and Millar1991; Howe et al. Reference Howe, Jaffe, Grossman, Wall, Mangum and Stacey1993), CO(1→0) (Dame et al. Reference Dame, Hartmann and Thaddeus2001), and CO(7→ 6) (Schmid-Burgk et al. Reference Schmid-Burgk1989; Howe et al. Reference Howe, Jaffe, Grossman, Wall, Mangum and Stacey1993) completed in and around Orion trace the complex regions of PDRs. Howe et al. (Reference Howe, Jaffe, Grossman, Wall, Mangum and Stacey1993) constrained the gas temperature of the Orion KL to greater than 40 K and found the H2 gas to have column densities exceeding 1022 cm−2.
By using the Murchison Widefield Array (MWA), we are able to image and study a large fraction of the Orion molecular cloud complex, including both Orion A and Orion B, within a single field-of-view (FOV). In this paper, we present the lowest frequency detections (around 100 MHz) of alpha and beta CRRLs in the Orion region. This work is done in conjunction with a molecular line survey published by Tremblay et al. (submitted), using a FOV of 400 deg2 centred on the Orion KL Nebula.
2 OBSERVATIONS AND DATA REDUCTION
Using the MWA (Tingay et al. Reference Tingay2013) at a centre frequency of 114.56 MHz, we observed the Orion Nebula (RA(2000) = 05h35m, Dec.(2000) = −05o27') for 3 h on 2015 November 22 (see Table 1 for more details). The observations used snapshot imaging, which involve recording data in 2-min intervals before adjusting the pointing. Pictor A (RA(2000) = 05h19m49.7s, Dec. (2000) = −45o46′44′′, 452 Jy at 160 MHz) was observed for use as a primary calibrator at the start and end of the observation run. Each observation of Pictor A includes 2 min of data, and these data were used to calibrate tile bandpasses and phases.
MWA observing parameters.
The MWA has a contiguous bandwidth of 30.72 MHz and using a two-stage polyphase filterbank the data are channelised into 24×1.28 MHz ‘coarse’ channels and each coarse channel is divided into 128×10 kHz ‘fine’ spectral channels. This allows for simultaneous observations of multiple RRL transitions, including 34 α-lines and 35 β-lines, as identified from the Splatalogue database (Remijan et al. Reference Remijan and Markwick-Kemper2007). Even though the MWA offers 3072×10 kHz frequency spectral channels, only 2 400 (100 fine channels of the 24 coarse channels) were imaged, in an effort to avoid imaging artefacts caused by the aliasing of the polyphase filter bank. Thus, only 78% of the bandpass was imaged, which could potentially detect 12 of the carbon α-lines and 12 β-lines.
2.1. Calibration and imaging
The data calibration and imaging was completed as described in Tremblay et al. (Reference Tremblay, Hurley-Walker, Cunningham, Jones, Hancock, Wayth and Jordan2017) for the molecular line survey of the Galactic Centre. At the observing frequencies used for these data, the MWA has a 900 deg2 full-width at half-maximum (FWHM) FOV in the primary beam, but also has considerably large sidelobes. Bright sources in these sidelobes can corrupt observations by adding additional noise, and therefore need to be handled to correctly represent the desired radio data. To this end, we followed the approach used in the GaLactic and Extragalactic All-sky Murchison Widefield Array (GLEAM) survey (Hurley-Walker et al. Reference Hurley-Walker2017) to ‘peel’ bright sources from the visibilities; in particular, for these data, the Crab Nebula (RA(2000) = 05h34m34.94s, Dec. (2000) = 22o00′37.6′′; 1 256 Jy at 160 MHz).
Each 2-min observation experienced slightly different phase distortions due to the changing ionospheric conditions. This manifested as small (≈20 arcsec) direction-dependent shift to the positions of sources in every observation. A continuum image for each coarse channel of each observation is used to derive a single correction in RA and Dec that is applied to each image cube. After correction, the residual position offset is –1±17 arcsec in RA and 5±17 arcsec in Dec within the integrated image. To calculate the amount of image blurring of the point spread function, likely dominated by the ionosphere, the ratio of integrated flux density to peak flux density was computed and found to have an average value of 1.01±0.07, suggesting that we are robust against ionospheric activity for these observations. The average flux density error, when compared to the GLEAM catalogue, was 0.1%.
The velocity resolution within the 99–129 MHz frequency band ranged from 23 to 30 km s−1. Doppler correction terms are currently not incorporated into the MWA imaging pipeline so the uncertainty of the velocity is 3.4 km s−1, significantly less than the channel width of the MWA.
2.2. Survey details
A full description of the survey strategy and statistical analysis is presented in the Orion molecular line survey by Tremblay et al. (submitted). In this paper, we provide a brief description.
The continuum-subtracted 10 kHz spectral fine channels had a mean RMS of 0.4 Jy beam−1 at the phase centre. Any channel having a RMS of >0.6 Jy beam−1 was flagged to remove channels effected by spurious RFI. This reduced the search volume from the 2 400 imaged channels to 1 240 channels.
The primary beam is the sensitivity pattern the telescope has on the sky. Although 625 deg2 is imaged (see Figure 1), the search is limited to the most sensitive region of the primary beam using mimas (Hancock et al. Reference Hancock, Murphy, Gaensler, Hopkins and Curran2012) to reduce the search volume to ≈400 deg2 (35% reduction).
The upper left image is a continuum image of the Orion survey region across the 30.72 MHz of bandwidth with a central frequency of 114.6 MHz showing the full region blindly searched for molecular signatures and recombination lines. The upper right-hand image is an RMS map showing the sensitivity of the MWA in a typical coarse channel data cube. The C393α and C496β transitions are represented by squares and stars, respectively. The contours in cyan trace the image in the bottom left, which shows dust emission at 100 μm surveyed by Schlegel et al. (Reference Schlegel, Finkbeiner and Davis1998). The blue contours and the image in the bottom right are the optical Hα emission from the Southern H-Alpha Sky Survey Atlas (SHASSA) (Finkbeiner Reference Finkbeiner2003). We note that there is an image artefact in the 100 μm survey data on the bottom, created by combining the data from different fields.

Each continuum-subtracted fine channel is independently searched using aegean (Hancock et al. Reference Hancock, Murphy, Gaensler, Hopkins and Curran2012, Reference Hancock, Trott and Hurley-Walker2018) to find pixels, in absorption and emission, with peak flux densities greater than 5 σ in comparison to an input RMS image. The RMS image (as shown in in the upper right-hand panel of Figure 1) is the spectral RMS at each pixel position for each coarse channel (100 fine channels). The resultant catalogue of potential sources was further reduced by removing signals that had a spectral RMS > 0.5 Jy beam−1 to reduce the chance of a false detection due to uncorrected continuum subtraction or image artefacts.
The remaining sources in the catalogue were further filtered. Any source where the spectral RMS and image RMS were not within 20% of each other, were removed from the catalogue. After this last stage of filtering on the catalogue of sources from aegean, we found eight positions on the sky, with 12 signals, that passed these criteria, of which five potential detections are presented within this work.
Using two-sided Gaussian statistics, we would expect no more than 78 signals with the 95 000 independent synthesised beams and 1 240 channels searched at a 5σ threshold. However, by filtering the data on quality to ensure the spectral RMS is <0.5 Jy beam−1 (85–90% reduction in search volume) and to ensure that the spectral and image RMS were within 20% of each other (74% further reduction in search volume), the expected number of false positives due to thermal noise (in this reduced search volume) is less than one.
We note here that aegean fits Gaussians to the pixel data and applies a correction of the background to calculate the flux density for these potential detections. The background is calculated as the 50th percentile of flux distribution in a zone 30 times the size of the synthesised beam. However, to make the spectrum contained within this paper, the peak flux density in the spectrum is the flux density at the pixel position of potential detection as reported by aegean but not the flux density reported by aegean. Therefore, it is possible that the flux densities shown in our spectra are underestimated, and consequently their significance is also underestimated. Our false positive rate may also be a slight overestimate as a result.
In the frequency range of 99-129 MHz, there are 273 known molecular and recombination line transitions within the 30.72 MHz bandwidth. Therefore, we would expect most of the 2 400 imaged fine channels to be free of lines, as we observed. The separation, in frequency, between the known atomic and molecular transitions is significant enough that incorrect identification of a detected signal is unlikely. However, it may be possible that a recombination line overlaps with an unknown molecular transition and the identification we have made is incorrect.
The chance that a noise signal being identified as an atomic or molecular line, that is within three fine spectral channels (<90 km s−1) of the rest frequency, is 0.4%. The chance of a significant noise peak being confused for a real detection, when multiple transitions are detected in a single location, is <0.1%.
3 RESULTS
3.1. Radio continuum, Hα, and dust emission
A continuum image from these observations centred on the Orion Nebula at 114.56 MHz is shown in the top left image in Figure 1. The angular resolution of the 114 MHz image obtained from the MWA is 73 arcsec × 67 arcsec and the total flux density in the Orion Nebula is 45±4 Jy.
The top right-hand image of Figure 1 shows the Hα emission at 653 nm (Finkbeiner Reference Finkbeiner2003) in blue contours overlaid on a RMS map for the coarse channel data cube at 103 MHz, which is representative of the typical RMS map. The RMS map shows the sensitivity pattern on the sky across the 625 deg2 FOV imaged in this survey.
The Hα emission, shown in the bottom right-hand side of Figure 1 was observed by the Southern H-Alpha Sky Survey Atlas (SHASSA) survey and traces the Bernard’s loop, the Lambda Ori bubble (supernova remnant), and the Orion-Eridanus filaments. Bernard’s loop is a photoionised region that is particularly interesting as theoretical models and observations only agree if the region is enhanced with heavy metals (Odell et al. Reference Odell, Ferland, Porter and Hoof2011). It is suggested that the crescent shape is caused by an old supernova remnant that, as the bubble expanded, has swept up dust and gas as it moved through the high density and pressure gradients associated with the Galactic gas layer (Wilson et al. Reference Wilson, Dame, Masheder and Thaddeus2005; Pon et al. Reference Pon, Ochsendorf, Alves, Bally, Basu and Tielens2016).
Within the continuum image of our survey, on the top left, the faint synchrotron radiation is correlated with the Hα emission surrounding the nebula. The cyan contours on the RMS map and the image in the bottom left, trace the dust emission at 100 μm (Schlegel, Finkbeiner, & Davis Reference Schlegel, Finkbeiner and Davis1998) and the tentative detections are mostly contained in the region of the cloud complex where the dust and Hα emission is decreased and where the H i density is expected to increase (Pon et al. Reference Pon, Johnstone, Bally and Heiles2014).
3.2. Carbon recombination lines
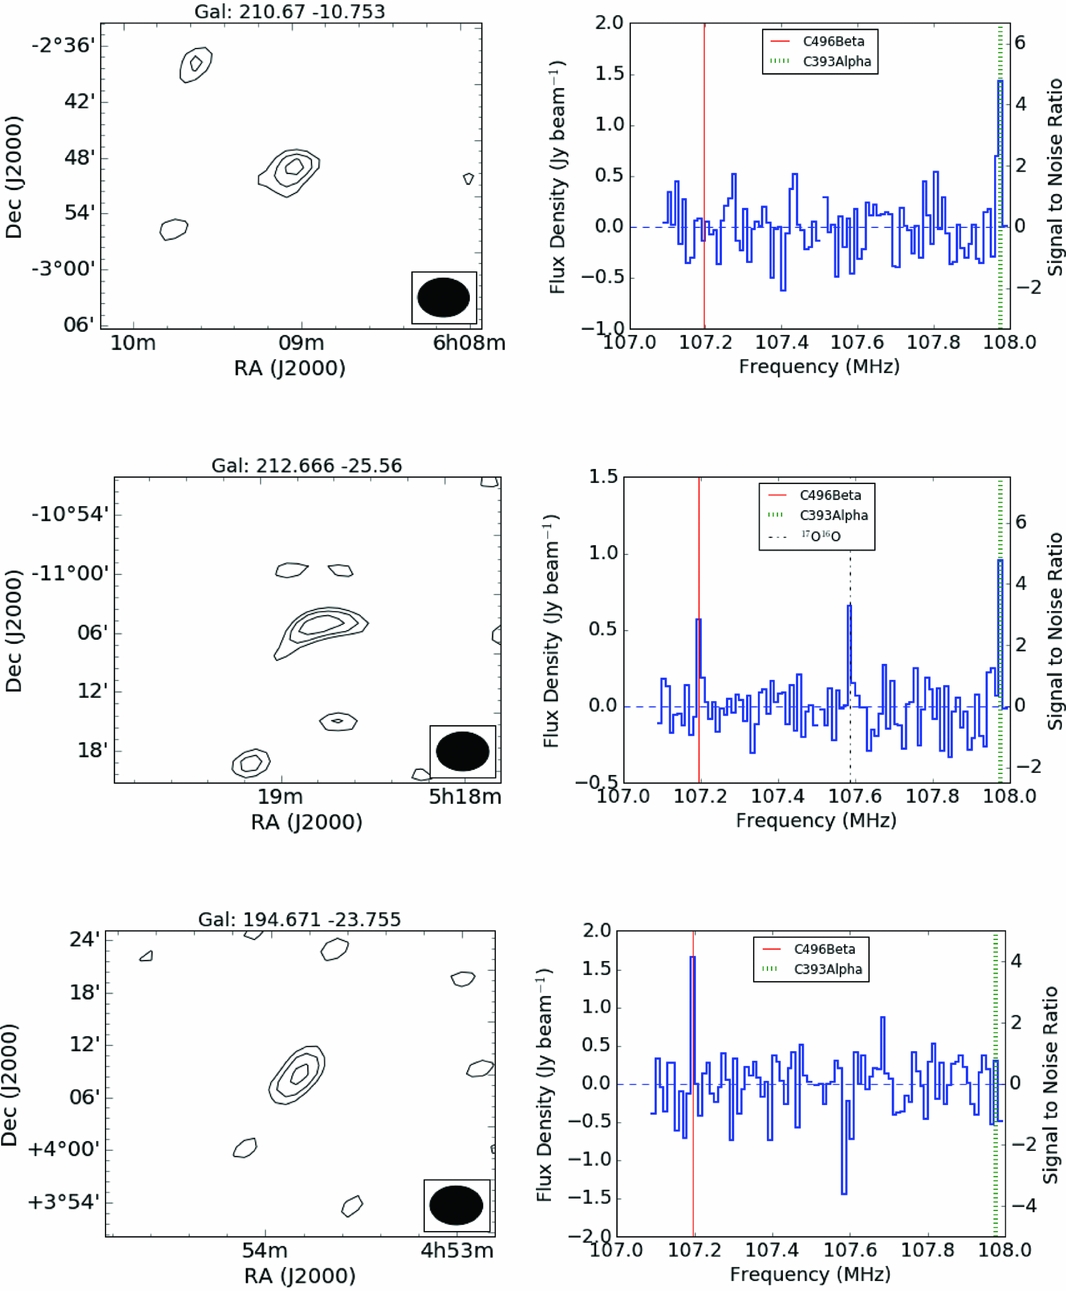
Carbon recombination lines C393α and C496β are tentatively detected within the Orion molecular cloud complex, as shown in the spectra in Figure 2. These detected transitions appear to be co-located with Hα filamentary structure and in regions where the 100 μm dust density is decreased.
A tentative detection of the C393α (107.98 MHz) and C496β (107.19 MHz) at the Galactic coordinates listed on the top of each plot. The contours plot on the left represent the 3, 4, 5, and 6 σ levels of the associated detection. The spectrum on the right is representative of the spectrum of the coarse channel band in which the tentative detection was made with the flagged channels blanked. The spectra at G212.67 −25.56 also shows a possible detection of C496β at 107.18 MHz and molecular oxygen (17O18O) at 107.60 MHz.
The derived parameters for each source are found in Tables 2 and 3. The Rayleigh–Jeans approximation is used to determine the brightness temperature (T B):
 $$\begin{equation}
T_{\mathrm{B}}=\frac{\lambda ^{2}}{2k\Omega }\mathrm{S},
\end{equation}$$
$$\begin{equation}
T_{\mathrm{B}}=\frac{\lambda ^{2}}{2k\Omega }\mathrm{S},
\end{equation}$$
where λ is the wavelength of the recombination line, k is the Boltzmann constant, Ω is the beam solid angle, and S is the flux density in Jy beam−1. Since the signal is not resolved spectrally, the integrated intensity is the brightness temperature integrated over the velocity resolution of the single channel.
 $$\begin{equation}
\int \mathrm{Intensity} = S \times \mathrm{v}
\end{equation}$$
$$\begin{equation}
\int \mathrm{Intensity} = S \times \mathrm{v}
\end{equation}$$
where v is the velocity resolution of the channel of the detected recombination line. The calculated brightness temperature of ≈4 000 K for the sources is not unexpected, as low-frequency transitions have a stimulated emission component by the domination of collisional excitation (Salgado et al. Reference Salgado, Morabito, Oonk, Salas, Toribio, Röttgering and Tielens2017b). The temperature of the background continuum (T c) is largely uniform over the FOV and is calculated as 1 100 K scaled from the Haslam model (Remazeilles et al. Reference Remazeilles, Dickinson, Banday, Bigot-Sazy and Ghosh2015) at 408 MHz using a spectral index of −2.6.
Information about the tentative detections of C393α. The peak-pixel positions of each tentative detection is listed in Galactic coordinates (source), as well as Right Ascension (RA) and Declination (Dec). The flux density, velocity, integrated intensity, and brightness temperature are provided for each location the transition was detection.
Information about the tentative detections of C496β. The peak-pixel positions of each tentative detection is listed in Galactic coordinates (source), as well as Right Ascension (RA) and Declination (Dec). The velocity, integrated intensity, and brightness temperature are provided for each location the transition was detected.
The full spectrum from the position of each of the potential detections is shown in the Appendix. This shows that no other transitions of carbon alpha or beta lines were detected. However, at the position of G212.67 −25.56, the data cube contains a signal around 5 σ associated with the rest frequency of C393α and also contains two emission peaks around 3 σ that are associated with the rest frequency of the C496β line at 107.18 MHz and the rest frequency of molecular oxygen (17O18O) at 107.60 MHz. The upper energy level divided by the Boltzmann constant for the transition of molecular oxygen at 107.60 MHz is 39.81 K and represents the N = 4–4, J = 3–3, F =  $\frac{7}{2}$– $\frac{5}{2}$ transition. The same transition of molecular oxygen is possibly detected at the position of G194.471 −23.755 in absorption (Figure 2) and other locations reported in the molecular survey paper (Tremblay et al., submitted).
4 DISCUSSION
4.1. Turn-over frequency of CRRL sources
Observations of CRRLs have spanned frequencies of 10 to over 5 000 MHz (Payne et al. Reference Payne, Anantharamaiah and Erickson1994; Roshi, Goss, & Jeyakumar Reference Roshi, Goss and Jeyakumar2014; Salas et al. Reference Salas2017). Peters et al. (Reference Peters, Clarke, Lazio and Kassim2010) summarised the information about known Galactic low-frequency CRRLs and, using a modified version of the radiometer equation, calculated the approximate amount of observing time required in order for the new generation of low-frequency telescopes to detect them. The MWA was not on the list, but using the same equation, we could expect to detect them in the averaged spectra in ≈ 2 h if all the observed lines are in either absorption or emission. However, due to the population effects, the exchange from absorption to emission will likely occur between 100 and 150 MHz, making this a difficult experiment.
At large n-bound states, observed at frequencies less than 100 MHz, the relative populations of atomic levels are controlled primarily by collisional processes. This makes the population levels close to the kinetic temperatures of less than 100 K and so the lines are detected in absorption along the line of sight towards strong continuum sources. At lower n-bound states, observed at frequencies greater than 200 MHz, the relative populations are dominated by radiative processes, moving the excitation temperature away from the kinetic temperature towards negative values. The level populations then become inverted and the recombination lines are detection in emission. This happens even if the brightness temperature is higher than the kinetic temperature (Payne, Anantharamaiah, & Erickson Reference Payne, Anantharamaiah and Erickson1989; Salgado et al. Reference Salgado, Morabito, Oonk, Salas, Toribio, Röttgering and Tielens2017a).
The transition between emission and absorption, often defined as the position where the optical depth is between 1 and 1.5 (Gordon & Sorochenko Reference Gordon and Sorochenko2009), was first modelled by Shaver (Reference Shaver1975) and later observed by Payne et al. (Reference Payne, Anantharamaiah and Erickson1989) in Cassiopeia A. The transition between absorption and emission must occur regardless of the details of the population mechanism but the actual turnover frequency and the strength of the emission lines will depend on the density and temperature of the clouds being observed.
Gordon & Sorochenko (Reference Gordon and Sorochenko2009) explain this in terms of the Bohr atom. At low radio frequencies, the size of the atoms is large, making them more likely to interact with the charged particles in the diffuse H ii gas. The wavelength of these turnover frequencies is directly related to the probabilities of these collisions happening, such that, as the gas densities increase, the rate of the collision decreases. So, in dense gas, the turn-over frequency is likely to be at higher observational frequencies than in diffuse gas.
Therefore, the observation of CRRLs in the frequency range of 100−200 MHz is an important probe towards understanding the cold neutral medium around PDRs and H ii regions. The observed emission of the alpha and beta lines reported here at 107–108 MHz, suggest the turnover is at frequencies less than 107 MHz for the ionisation layer and, as expected, the transitions are observed in emission within the regions of diffuse gas.
Payne et al. (Reference Payne, Anantharamaiah and Erickson1989) observations of the turn-over between emission and absorption within Cassiopeia A demonstrated that in between these two states, the spectra are flat and recombination lines are undetectable. That may explain why we are not detecting signals associated with CRRLs below 107 MHz but above 108 MHz, we would expect to detect the other known transitions in emission. Historically, due to various instrumental and population effects, not all expected transitions are observed (e.g. Bell et al. 1997) or the observations were focused on a single transition (e.g. Wyrowski et al. Reference Wyrowski, Schilke, Hofner and Walmsley1997), both of which is not unexpected within the spectral line community (Herbst & van Dishoeck Reference Herbst and van Dishoeck2009). However, we will explain possible reasons for the discrepancy within our data.
4.2. Spectral quality
Each fine (10 kHz) spectral channel is individually imaged for each of the 2-min snapshot observations and then built into an image cube for a single coarse channel. For a single coarse channel, all the observations are integrated together using inverse variance weighting. Therefore, each integrated image cube has unique sensitivities in comparison to any other coarse channel cubes within the observation set. Also, due to the polyphase filterbank that channelises the MWA data, each fine spectral channel has a steep bandpass shape, such that any detected signal that may not be centred within the 30 km s−1 resolution, may be lost.
These tentative detections are of low significance (≈5σ). The low significance, combined with the knowledge of the data processing and characteristics of the MWA described above, each spectral cube for each coarse channel has different noise properties. This suggests that it is not improbable that all the transitions for the same atom are not detected. Therefore, we call these detections tentative as they are unresolved and the subsequent, unflagged, transitions within our band were not detected.
4.3. Origin of CRRLs around Orion
Modelling and observations from Ahmad (Reference Ahmad1976) and Boughton (Reference Boughton1978) introduced the idea that the Orion complex contains multiple layers of ionised gas. Boughton (Reference Boughton1978), and later confirmed by Wyrowski et al. (Reference Wyrowski, Schilke, Hofner and Walmsley1997), determined that the carbon around Orion is ionised in a layer that is between the observer and the nebula and not within the nebula itself. This is consistent with other observations within the region where most emission is identified from a region of ionised gas on the observer’s side of the Orion Molecular cloud and in a PDR beyond the primary ionisation front (O’Dell et al. Reference O’Dell, Ferland, Henney, Peimbert, García-Díaz and Rubin2015).
Theoretical modelling by Pon et al. (Reference Pon, Ochsendorf, Alves, Bally, Basu and Tielens2016) suggests that the Orion-Eridanus super-bubble is a layer of expanding ionised gas with the outer regions about 180 pc from the Sun. They also determined that the total ionising luminosity of the Orion star-forming region is sufficient to produce the Hα emission observed within this super-bubble.
Reported here are the lowest frequency spectral line observations of the Orion region published to date, as far as we are aware. With the resolution of the MWA, it is likely these recombination line detections are within the diffuse filamentary structure of the near-field ionisation layer. However, the frequency resolution of the MWA does not allow for analysis of the collisional and radiation broadening effects on the spectral line. Therefore, no attempt to place upper limits on the electron temperature are made here.
Ahmad (Reference Ahmad1976) discussed the discrepancy of velocities at frequencies greater than 5 GHz versus observations of CRRLs at frequencies less than 5 GHz. He suggested that the low-frequency observations are in cold gas in front of the H ii region, while carbon recombination lines at higher frequencies are detecting warm regions behind the H ii region.
Typical velocities for carbon recombination lines detected in the Orion KL, Orion A, and Orion B portions of the giant molecular cloud complex range from ≈–9 km s−1 (Ahmad Reference Ahmad1974; Wyrowski et al. Reference Wyrowski, Schilke, Hofner and Walmsley1997; Roshi et al. Reference Roshi, Goss and Jeyakumar2014) at frequencies greater than 5 GHz and ≈–6 km s−1 at frequencies down to 600 MHz (Chaisson & Lada Reference Chaisson and Lada1974). However, Anantharamaiah et al. (Reference Anantharamaiah, Goss, Dewdney, Gordon and Sorochenko1990) detected carbon and hydrogen recombinations lines in the southern edge of Orion B with velocities of ≈ 48 km s−1.
Observations of the carbon monoxide J = 1→0 transition around the Orion molecular cloud trace the complex structure of carbon within the ionised frontal layer. Wilson et al. (Reference Wilson, Dame, Masheder and Thaddeus2005) observed velocities ranging from −1 to 18.5 km s−1 with knots of compressed gas in regions of active star formation, suggesting that there is a large gradient of possible velocities for carbon atoms within the Orion ionisation front.
The tentative detections of C393α and C496β lines have velocities of 0±24 and 24±24 km s−1, respectively, which are consistent with previous CRRL observations within the region. However, due to the velocity resolution of the MWA, we cannot discriminate between the previously observed velocities within the different ionisation layers.
5 CONCLUSIONS
We have tentatively detected one alpha transition and one beta transition across three positions within the Orion molecular cloud complex ionisation layer in front of the H ii region, at a level greater than 5 σ. The transition between emission and absorption, at frequencies between 100 and 200 MHz are important to identify and study the cloud dynamics. However, due to the spectral resolution of the MWA, we cannot provide analysis of the collisional and radiative broadening effects. We can conclude that the transition within these regions is less than 107 MHz as the signals detected in emission are at frequencies greater than this and the detected regions correspond to hot-spots of the diffuse hydrogen alpha emission observed with optical telescopes.
ACKNOWLEDGEMENTS
The authors would like to thank the referee for their useful comments and feedback. CDT would like to thank Paul Hancock with help with the coding used in data reduction. The authors would like to acknowledge the contribution of an Australian Government Research Training Program Scholarship in supporting this research. This work was supported by resources provided by the Pawsey Supercomputing Centre with funding from the Australian Government and the Government of Western Australia. This scientific work makes use of the Murchison Radio-astronomy Observatory, operated by CSIRO. We acknowledge the Wajarri Yamatji people as the traditional owners of the Observatory site. Support for the operation of the MWA is provided by the Australian Government (NCRIS), under a contract to Curtin University administered by Astronomy Australia Limited. We gratefully acknowledge the support of NASA and contributors of SkyView surveys.
A FULL SPECTRA
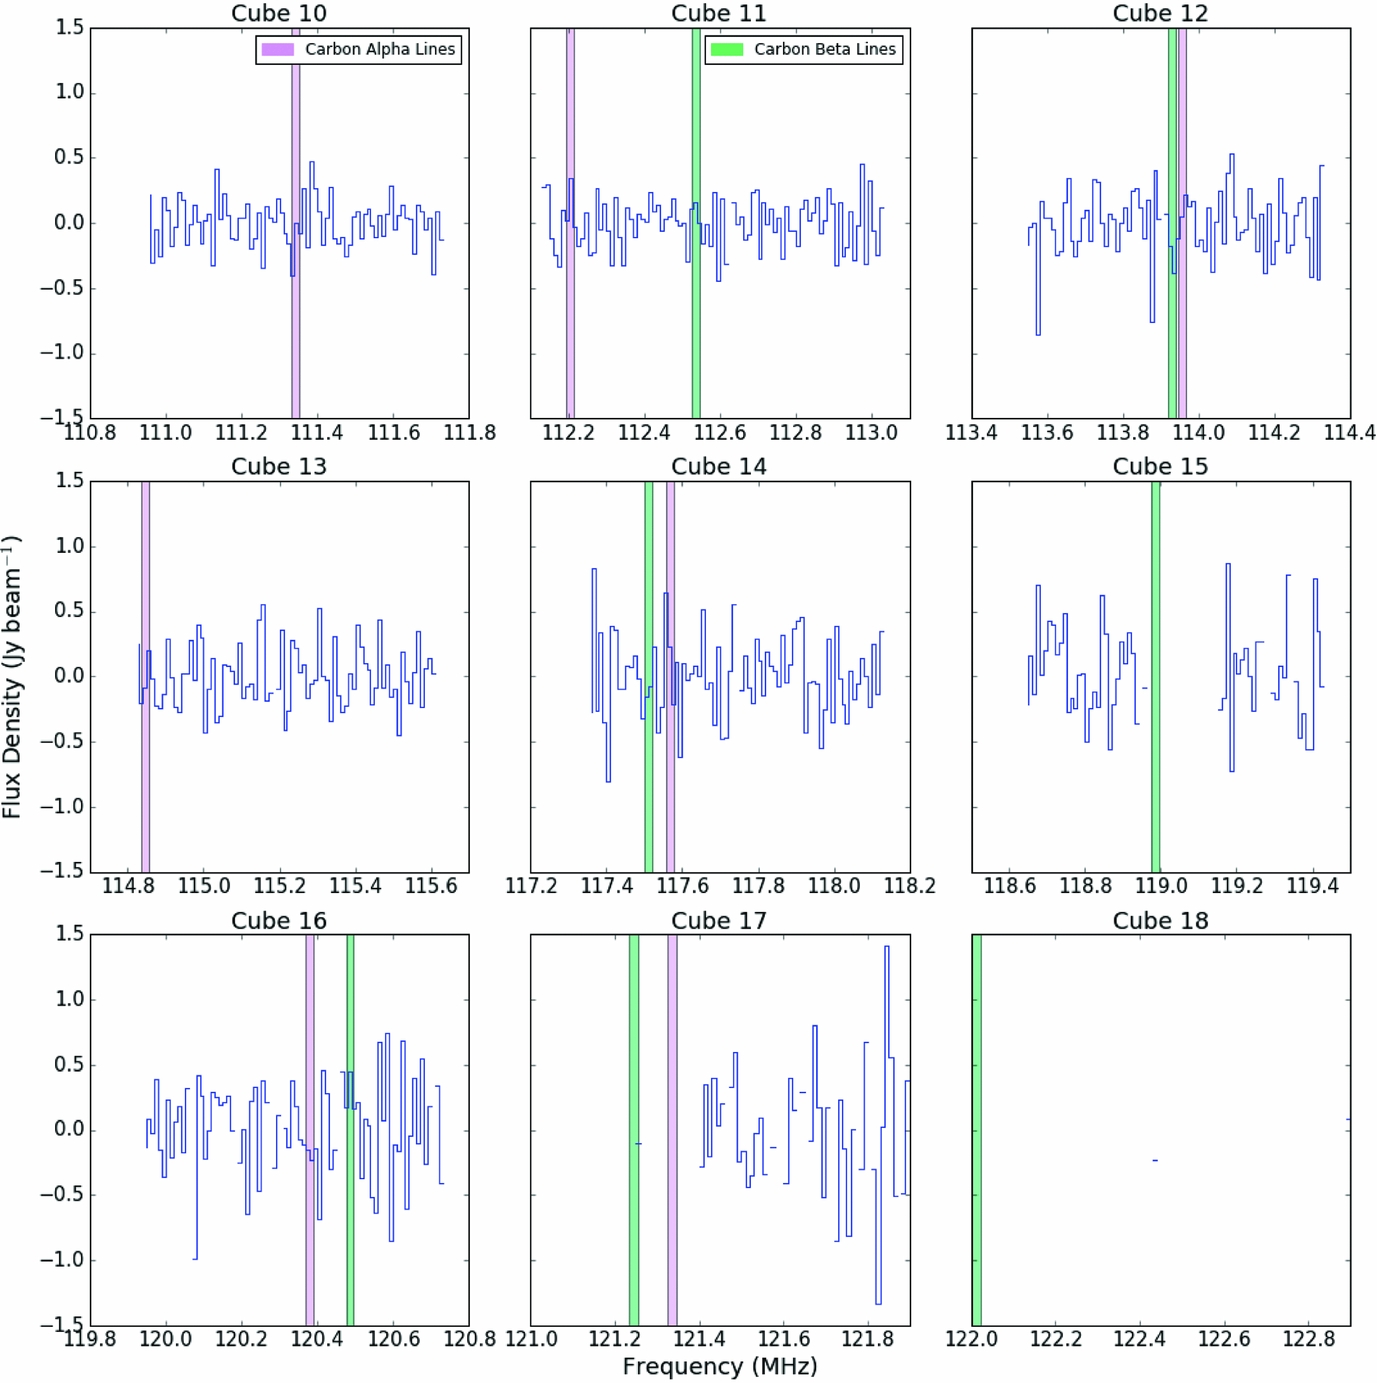
We present the full spectra from the MWA in the band of 99–122 MHz to show the quality of the data. The spectra represents the data in the positions of all three tentative detections.
MWA spectra for a data cube used within this survey at the position of G212.67 −25.56. The alpha recombination rest frequency are marked in plum and the beta rest frequency positions are marked in green. Flagged channels are blanked out in the spectra.
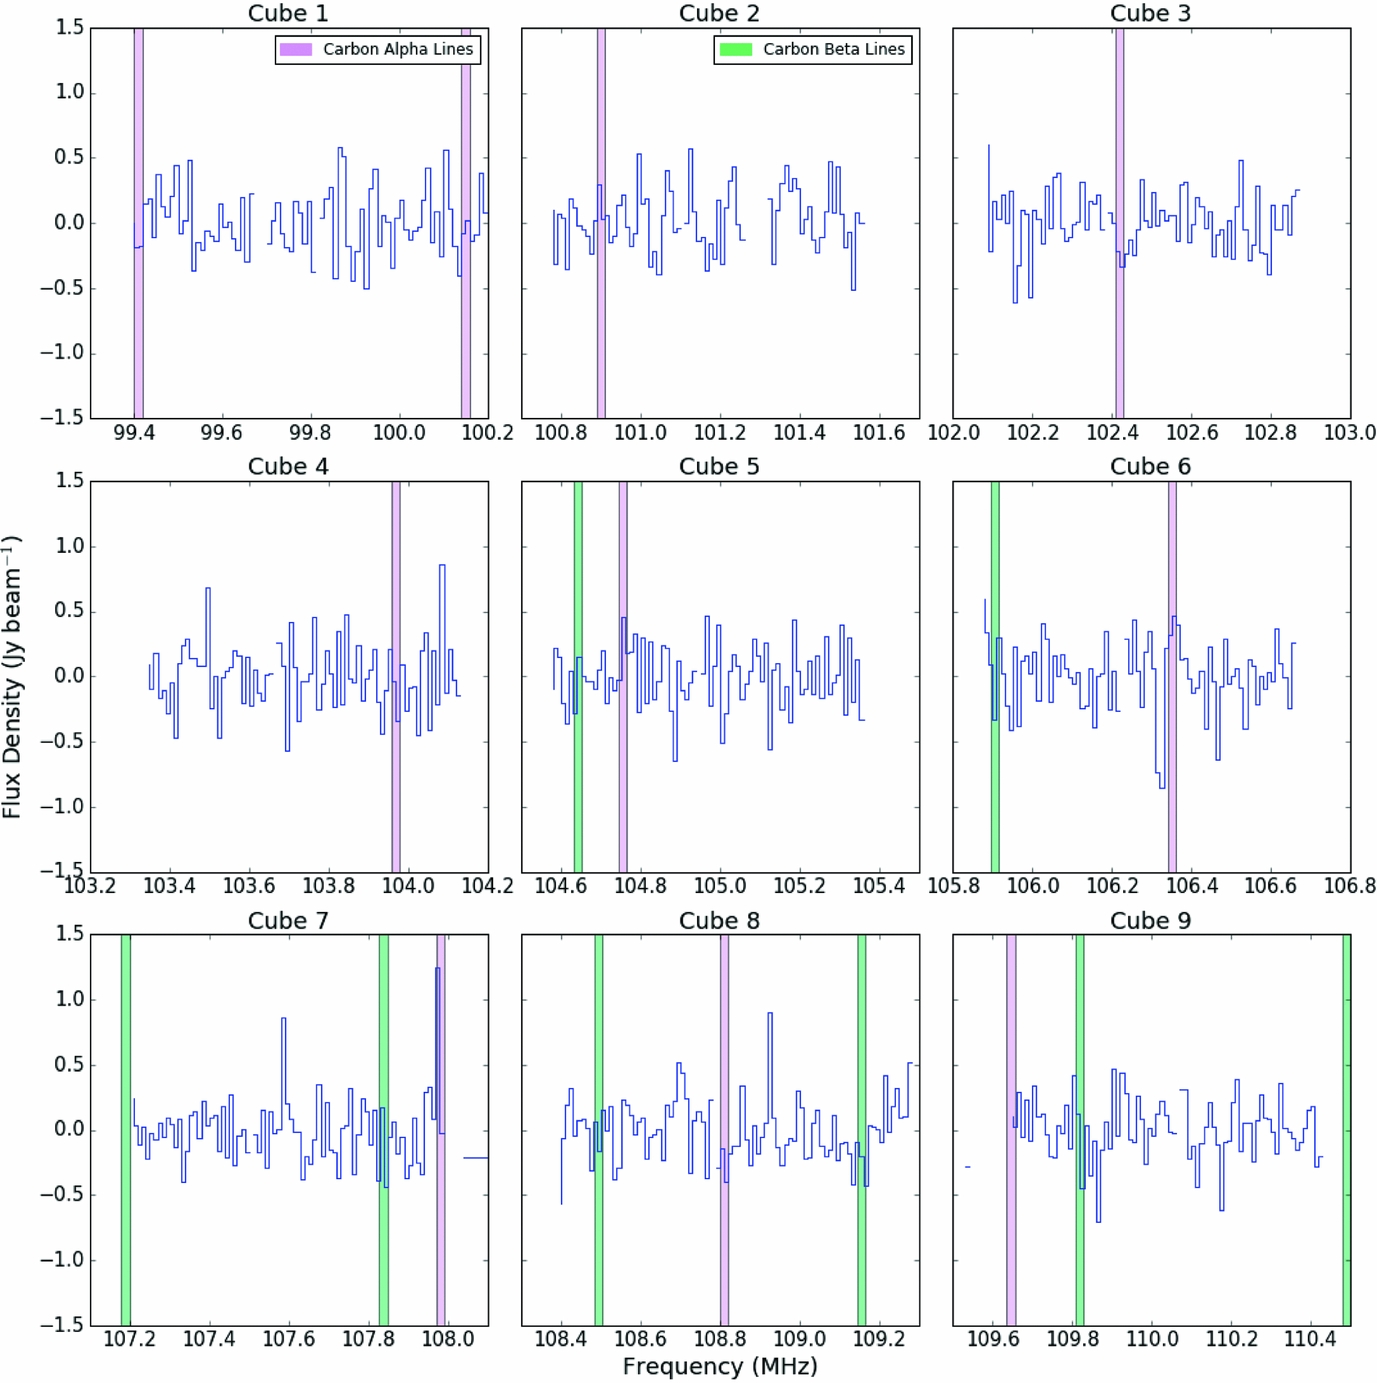
MWA spectra for a data cube used within this survey at the position of G212.67 −25.56. The alpha recombination rest frequency positions are marked in plum and the beta rest frequency positions are marked in green. Flagged channels are blanked out in the spectra.
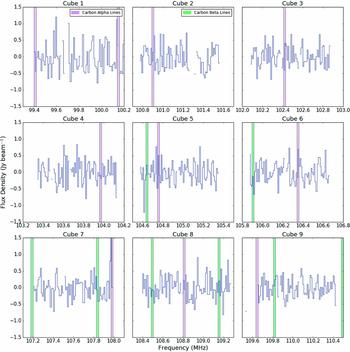
MWA spectra for a data cube used within this survey at the position of G194.67 −23.76. The alpha recombination rest frequency are marked in plum and the beta rest frequency positions are marked in green. Flagged channels are blanked out in the spectra.
MWA spectra for a data cube used within this survey at the position of G210.67 −10.75. The alpha recombination rest frequency positions are marked in plum and the beta rest frequency positions are marked in green. Flagged channels are blanked out in the spectra.
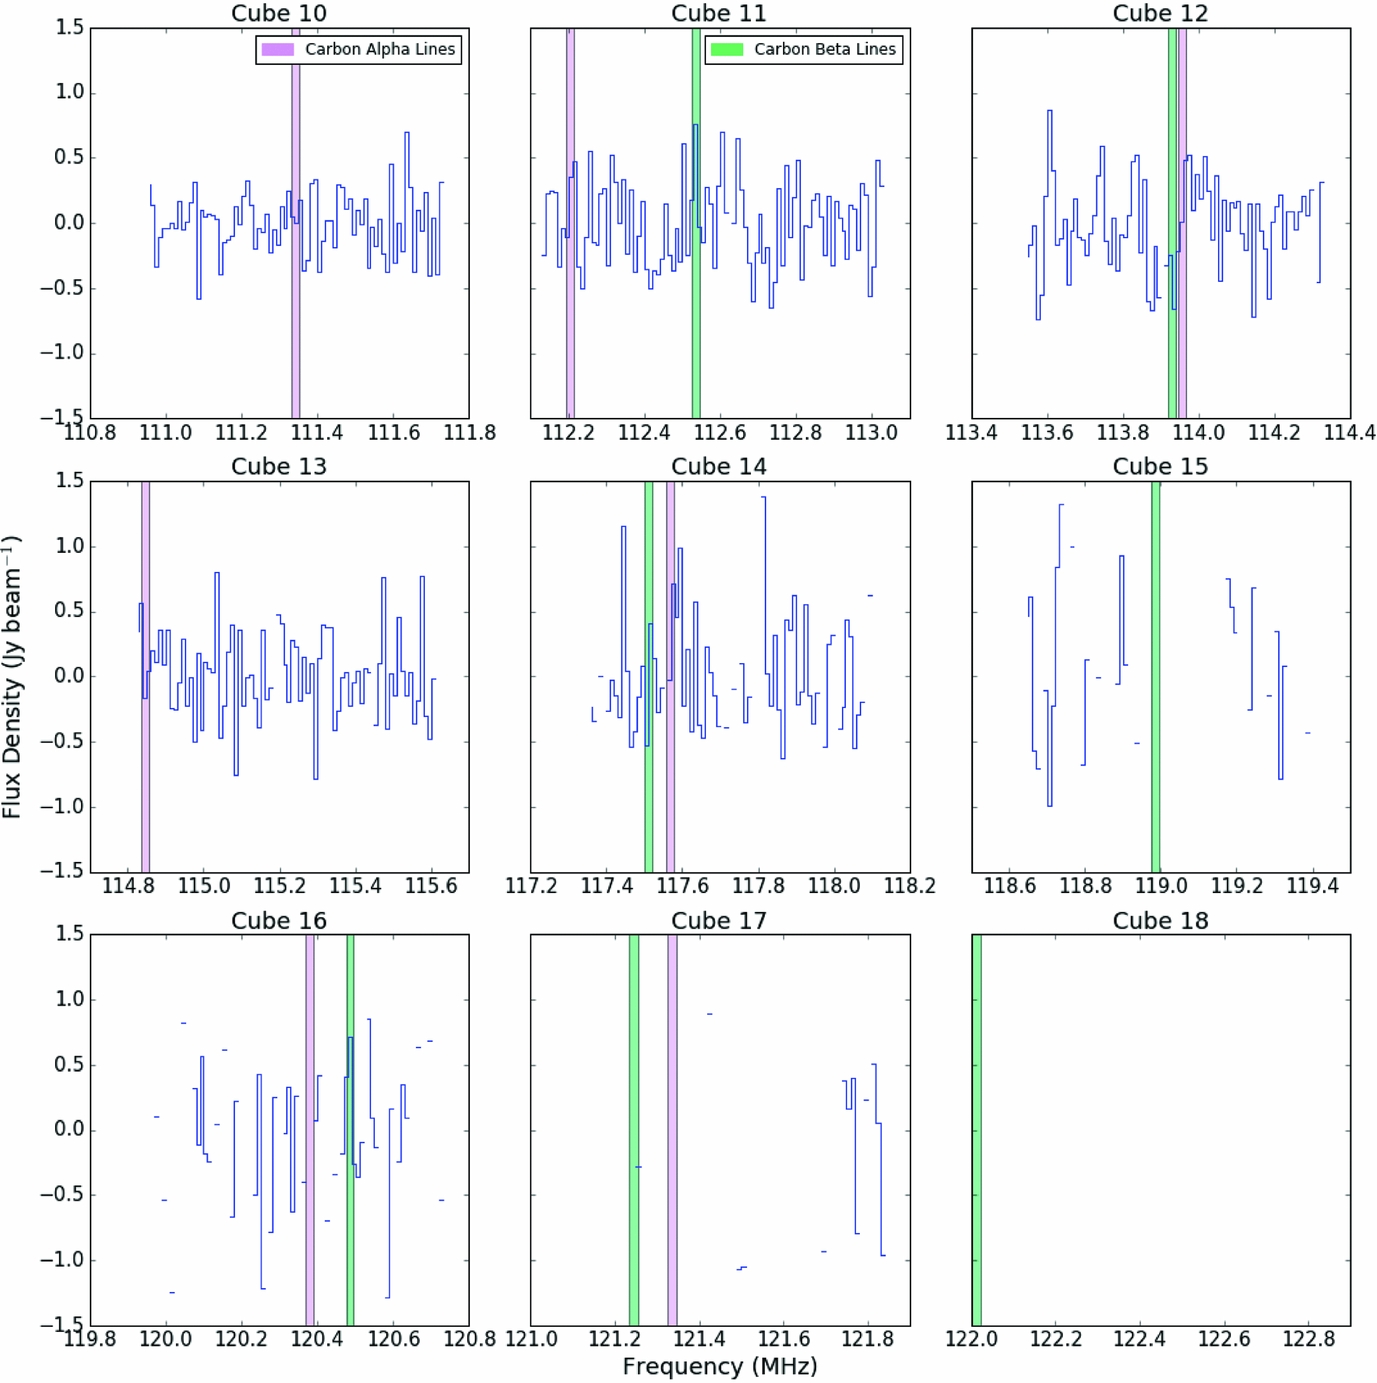
MWA spectra for a data cube used within this survey at the position of G194.67 −23.76. The alpha recombination rest frequency are marked in plum and the beta rest frequency positions are marked in green. Flagged channels are blanked out in the spectra.

MWA spectra for a data cube used within this survey at the position of G194.67 −23.76. The alpha recombination rest frequency positions are marked in plum and the beta rest frequency positions are marked in green. Flagged channels are blanked out in the spectra.


