
Project aims
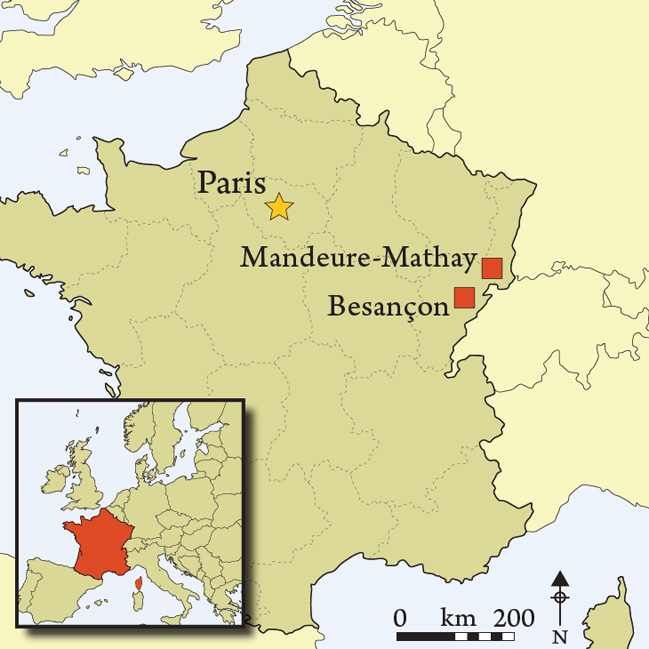
The location of Besançon and Mandeure-Mathay.

The LIEPPEC (Lidar pour l'étude des paysages passés et contemporains) project is designed to investigate long term change in the landscapes around the urban centre of Besançon (Vaxelaire & Barral 2003) and the villages of Mandeure and Mathay (Reference BarralBarral 2007), in the Franche-Comté region of France (Figures 1 & 2). The project uses microtopographic data produced through lidar surveys as a framework, focusing attention on the process of landscape formation and development. Lidar and other non-invasive prospection techniques are combined to study rural and formerly urban areas (for lidar in archaeology see Bewley et al. 2005; Devereux et al. 2005; Crow et al. 2007; Challis et al. 2008; Doneus et al. 2008; Reference Crutchley, Heritage and LargeCrutchley 2009; for a recent multi-tool example see Howard et al. 2008).
Lidar-based prospection
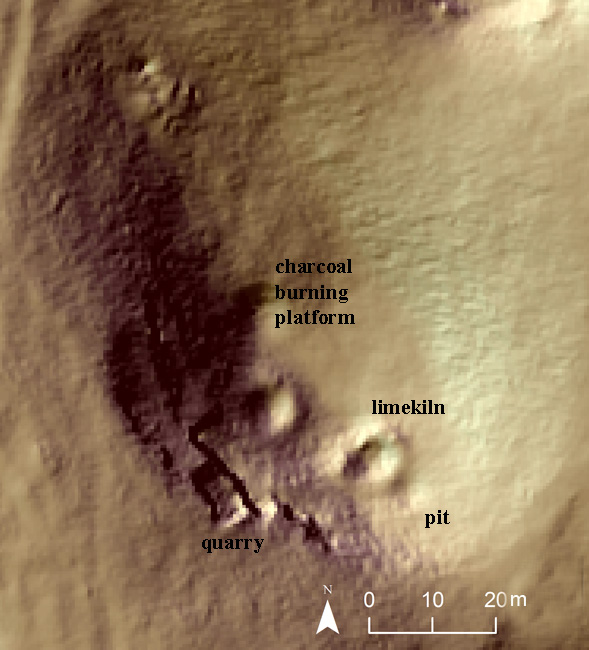
Our lidar survey has located hundreds of previously unknown features, and this has subsequently been complemented by a campaign of surface prospection, using metal detectors and limited test pitting. The combined surveys have identified production and extraction sites such as charcoal burning platforms, lime kilns, stone quarries and claypits (Figure 3). In addition, a smaller number of probable habitation sites were identified, along with the remains of several enclosed field systems within now forested areas.
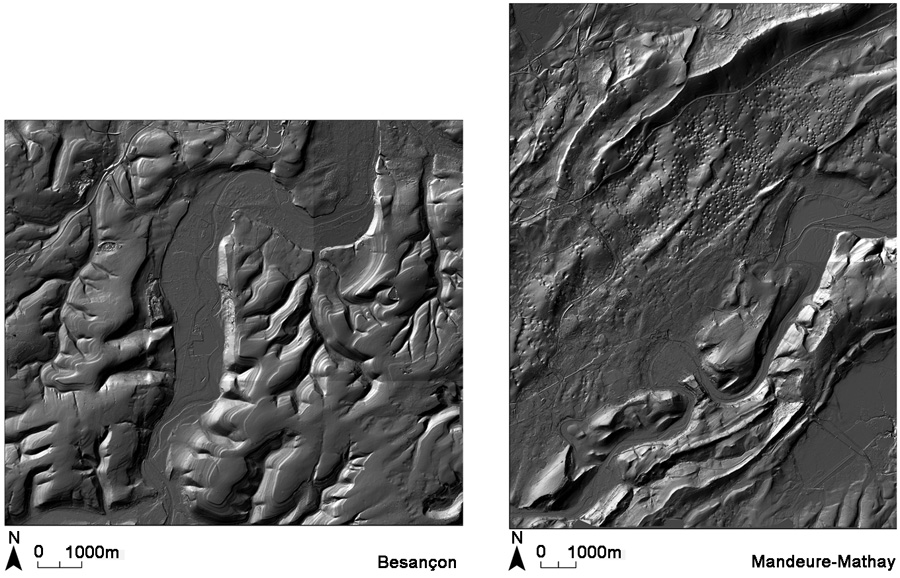
The Besançon and Mandeure-Mathay lidar surveys cover 140km2 and 81km2 respectively. Data was collected at a planimetric resolution of eight points per m2, with four returns per pulse.

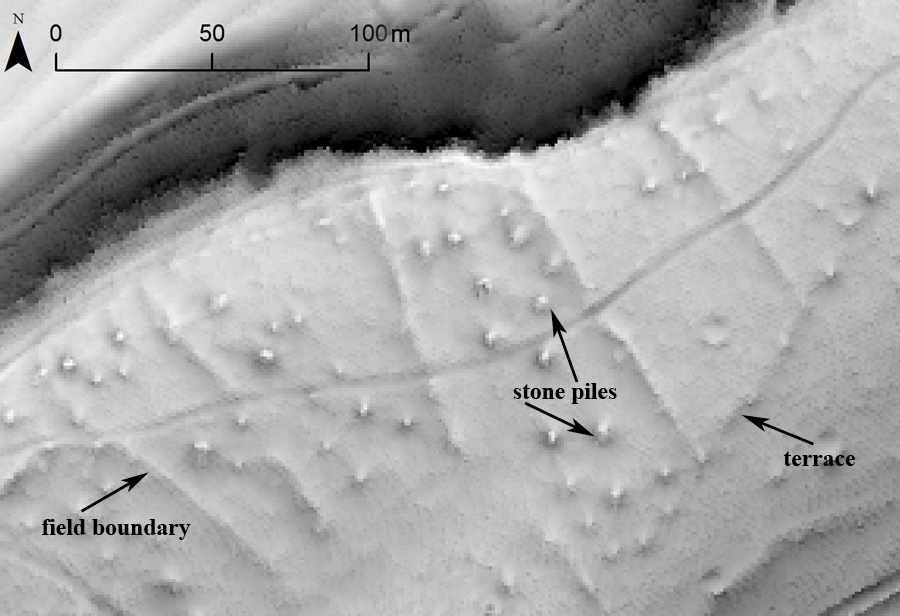
Field systems north of Besançon in the Forêt de Chailluz are characterised by a combination of low linear stone mounds and natural terraces or cuttings forming boundaries and stone piles within fields.

Lime kilns are often found alongside small quarries, pits and charcoal burning platforms.

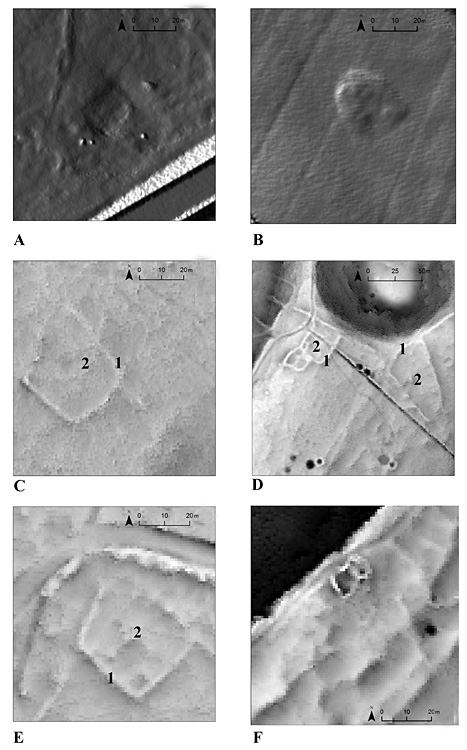
Examples of the remains found by the LIEPPEC project include: A-B) amorphous raised mounds interpreted as habitation sites; C-E the remains of buildings and enclosures, tentatively dated to the Gallo-Roman Period based on metal and ceramic objects found through prospection (1: linear mound forming an enclosure; 2: amorphous flat area probably representing a primary building — NB the number is placed immediately to the right of the flat area); F) ecclesiastical site with good morphological definition of the main building.

The field systems preserved in the Forêt de Chailluz suggest that this area was active, perhaps intermittently, over a relatively long time: in some cases boundaries or parts of boundaries are reused in subsequent field systems (Figure 4). Groups of field clearance cairns are used to chart changing land use, indicating areas cleared for agriculture or improved for pasture as the borders of the forest shifted over time.
To evaluate sites for further field research, traces interpreted as habitation sites are grouped into three categories: morphologically well defined remains, morphologically poorly defined remains (suggesting good preservation of buried features) and poorly defined remains (suggesting poor preservation). The first category includes buildings where traces of multiple walls are visible, e.g. Figure 5F. The second category includes features like those in Figure 5A-B, where a raised mound is present but the form does not provide further information. The third includes poorly defined flattened patches. Based on finds collected during field-walking and their position inside enclosed fields, these have been identified as settlement sites most likely to date to the Gallo-Roman period (Figure 5C-E). Overall, the sites identified suggest that while the physical form of many structures does not appear clearly enough to guess at date or function, it may be possible to infer the probable presence or absence of well preserved remains.
Combining lidar and geophysical survey
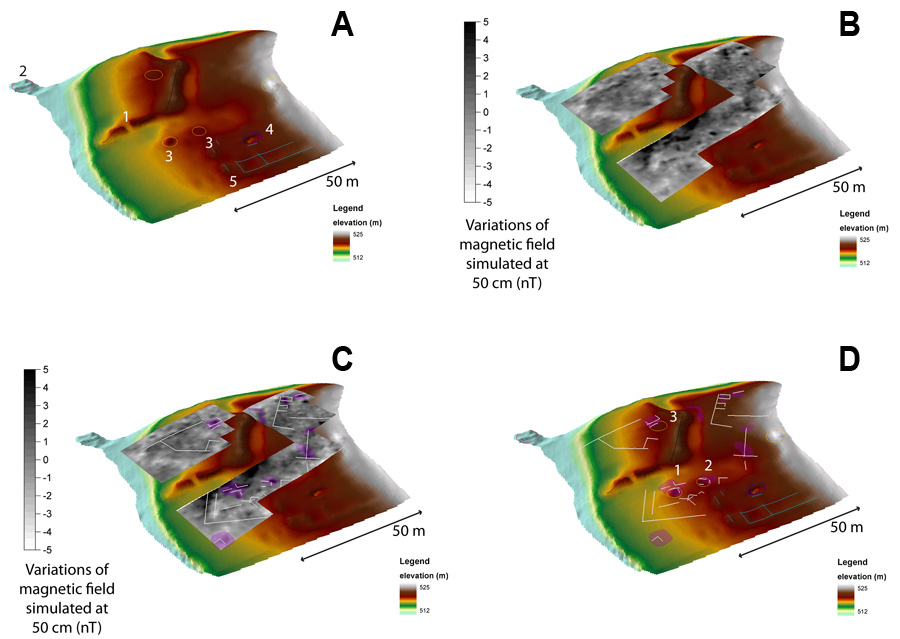
The magnetometry results: A) DTM of the medieval fortified Chamabon site with topographic features marked; B) results of the magnetometry survey draped over the terrain model; C) the principle anomalies visible in the magnetometry survey; D) a synthetic map showing both topographic and magnetic anomalies. Topographic anomalies 1, 2, and 3 correspond to magnetic anomalies.

In the Mandeure-Mathay area the project has combined magnetometry and lidar surveys. This allows the identification of more features within a site — creating a more complete picture — and can provide some additional information on each feature on the basis of its visibility in each dataset e.g. features with a strong magnetic signal but no topographic signal. A case study at the medieval site of Chamabon, near Mandeure, illustrates the value of this combined approach.
At Chamabon the lidar revealed three circular raised areas and a series of elongated raised mounds which appear to form the outline of a small building. Further linear features appear in the magnetometry survey, and two small anomalies are interpreted as buildings (Figure 6). At the circular features, the presence of anomalies in both the lidar and magnetometry suggests the remains of structures may be preserved. By contrast, the linear structures are visible only in the magnetometry survey. The absence of any topographic remains may suggest these features are more likely to be truncated or degraded. Alternatively, the absence of topographic remains and weak magnetometer signals could be interpreted as representing relatively deeply buried features, covered by upper strata that have been flattened or truncated. This combined approach has potential value both for heritage management and excavation strategies.
Future directions
The early results of these surveys illustrate some ways in which lidar survey can be integrated into broader site, microregional or regional studies. Research continues on the results of the lidar survey and, through complementary geophysical and fieldwalking surveys, on incorporating the data collected into analyses of land use and occupation patterns.
Acknowledgements
The LIEPPEC project (directed by L. Nuninger & R. Opitz) is funded by the Regional Council of the Franche-Comté (who financed the Lidar surveys conducted by Aerodata); Ville de Besançon; Communauté d'Agglomérations du Pays de Montbéliard; Université de Franche-Comté; CNRS and ZRC SAZU (Slovenia). Lidar data processing supported by the European Associated Lab ModeLTER 'Modelling of landscapes and territories over the long term' (directed by K. Ostir & L. Nuninger). Geophysical survey supported by the Projet Collectif de Recherche 'Approche pluridisciplinaire d'une agglomération antique: Epomanduodurum (Mandeure-Mathay, Doubs)' (directed by: Ph. Barral) (UFC/UMR 6249 CNRS).