


INTRODUCTION
Peatlands contain 473–621 Pg of carbon (Yu et al. Reference Yu, Loisel, Brosseau, Beilman and Hunt2010; Gorham et al. Reference Gorham, Lehman, Dyke, Clymo and Janssens2012), roughly one-third of carbon stored by the terrestrial biosphere despite covering only about 3% of the Earth’s surface (Holden Reference Holden2005). Almost 90% of this carbon is found in northern peatlands (Yu et al. Reference Yu, Loisel, Brosseau, Beilman and Hunt2010), where cold temperatures and anoxic conditions have limited decomposition (Limpens et al. Reference Limpens, Berendse, Blodau, Canadell, Freeman, Holden, Roulet, Rydin and Schaepman-Strub2008) and favored the accumulation of organic matter over the Holocene. Northern peatlands occur in latitudes already experiencing climate change where future change may be amplified (Collins et al. Reference Collins, Knutti, Arblaster, Dufresne, Fichefet, Friedlingstein, Gao, Gutowski, Johns, Krinner, Shongwe, Tebaldi, Weaver and Wehner2013). Furthermore, slowed decomposition rates in these waterlogged systems are extremely responsive to drying (Sierra et al. Reference Sierra, Trumbore, Davidson, Vicca and Janssens2015) and increasing frequency of drought or drying and re-wetting cycles could result in destabilization of carbon in peat (Fenner and Freeman Reference Fenner and Freeman2011). Thus, peatland response to climate change could contribute substantially to terrestrial feedbacks to climate change (Hilbert et al. Reference Hilbert, Roulet and Moore2000; Bridgham et al. Reference Bridgham, Pastor, Dewey, Weltzin and Updegraff2008).
Despite the importance of northern peatlands to global carbon storage, cycling, and feedbacks to environmental change, there remains considerable uncertainty in carbon storage and accumulation rates in these systems (Yu Reference Yu2012). Many studies of historical peat accumulation are based on a single core with limited 14C dates by depth. Such unreplicated data limit our ability to quantify uncertainty on peat carbon stocks and age and inhibits our understanding of peat and carbon accumulation in these important ecosystems (Korhola et al. Reference Korhola, Tolonen, Turunen and Juncner1995; van Bellen et al. Reference van Bellen, Garneau and Booth2011a). For example, assessments of spatial variability in ombrotrophic bogs in Finland (Korhola et al. Reference Korhola, Tolonen, Turunen and Juncner1995) and Quebec (van Bellen et al. Reference van Bellen, Dallaire, Garneau and Bergeron2011b) have observed low accumulation rates early in bog development coincident with high lateral expansion rates, followed by high accumulation rates as lateral expansion slowed.
Several peat core analyses have shown considerable variation in peat and carbon accumulation rates over time. Major causes for changes in peat and carbon accumulation rates in peatlands over time include (1) vegetation shifts during peatland succession, (2) changes in climate (van Bellen et al. Reference van Bellen, Garneau and Booth2011a; Charman et al. Reference Charman, Beilman, Blaauw, Booth, Brewer, Chambers, Christen, Gallego-Sala, Harrison, Hughes, Jackson, Korhola, Mauquoy, Mitchell, Prentice, van der Linden, De Vleeschouwer, Yu, Alm, Bauer, Corish, Garneau, Hohl, Huang, Karofeld, Le Roux, Loisel, Moschen, Nichols, Nieminen, MacDonald, Phadtare, Rausch, Sillasoo, Swindles, Tuittila, Ukonmaanaho, Valiranta, van Bellen, van Geel, Vitt and Zhao2013) and hydrology (Belyea and Malmer Reference Belyea and Malmer2004), and (3) loss of peat during fire (Pitkänen et al. Reference Pitkänen, Turunen and Tolonen1999). Such factors may be linked in complex ways, making it difficult to pinpoint a single cause or mechanism (Korhola et al. Reference Korhola, Tolonen, Turunen and Juncner1995), and hindering prediction of future peatland carbon accumulation (Belyea and Malmer Reference Belyea and Malmer2004). Regardless of the historical interpretation of peat profiles, carbon accumulation rates in peatlands are likely to shift in the future as the carbon balance of these systems changes in response to a changing climate (Finkelstein and Cowling Reference Finkelstein and Cowling2011).
We are conducting an ecosystem-scale, decade-long warming manipulation experiment to test the potential for accumulated peatland carbon to be returned to the atmosphere, Spruce and Peatland Responses Under Changing Environments (SPRUCE; mnspruce.ornl.gov; Wilson et al. Reference Wilson, Hopple, Tfaily, Sebestyen, Schadt, Pfeifer-Meister, Medvedeff, McFarlane, Kostka, Kolton, Kolka, Kluber, Keller, Guilderson, Griffiths, Chanton, Bridgham and Hanson2016; Griffiths et al. Reference Griffiths, Hanson, Ricciuto, Iversen, Jensen, Malhotra, McFarlane, Norby, Sargsyan, Sebesteyen, Shi, Walker, Ward, Warren and Weston2017; Hanson et al. Reference Hanson, Riggs, Nettles, Phillips, Krassovski, Hook, Gu, Richardson, Aubrecht, Ricciuto, Warren and Barbier2017). In this paper, we describe the horizontal and vertical variation of net carbon accumulation rates across the SPRUCE site, a boreal ombrotrophic peatland in northern Minnesota, S1 Bog, to (1) understand fundamental patterns of natural variation from the elevated bog center to the bog edges (bog morphology) that might influence the interpretation of the experimental warming manipulations, (2) characterize cumulative peat C accumulation over the Holocene for S1, which is at the southern extent of the boreal range, and (3) compare peat accumulation rates for S1 to the nearby S2 Bog and to other southern boreal peatlands in North America. We used a combination of published and new data with new analysis to provide historical information on how S1 Bog has functioned as a sink for atmospheric carbon in the past, assess the representativeness of S1 Bog to regional peatland carbon accumulation patterns, and provide a benchmark for contrasting induced warming effects on peat accumulation rates across other ombrotrophic peatlands. To that end, we interpreted the historical accumulation rates in the context of peatland development, local and global climate, hydrology, and disturbance.
METHODS
Study Site
Our study area is the S1 Bog of the Marcell Experimental Forest (MEF; 47°30.476′N; 93°27.162′N) in north-central Minnesota, USA (Figure 1). Climate at the MEF is continental with warm moist summers and cold dry winters. Mean annual air temperature from 1961 to 2009 AD was 3.4±1.1°C with a corresponding mean annual precipitation of 780±97 mm (Sebestyen et al. Reference Sebestyen, Dorrance, Olson, Verry, Kolka, Elling and Kyllander2011). Late Wisconsin glacial retreat occurred in the area approximately 13,000 calendar BP (Mooers and Lehr Reference Mooers and Lehr1997) and subsurface ice remained until approximately 11,000 calendar BP (Verry and Janssens Reference Verry and Janssens2011). As this ice melted, overlying sediment collapsed, forming ice block depressions that were the precursors to the area bogs.
Location of SPRUCE site (star in inset map of contiguous US). SPRUCE plots (black points and bolded numbers) with peat cores included in this analysis, overlaying a peat depth map (shading) for S1 Bog. Straight black lines indicate Transects 1–3. Thick outline indicates bog lagg. “D” inside black oval indicates the highest elevation of the raised dome. Map courtesy of Stephen Sebestyen. Elevation maps are available at http://mnspruce.ornl.gov/spatial-data.
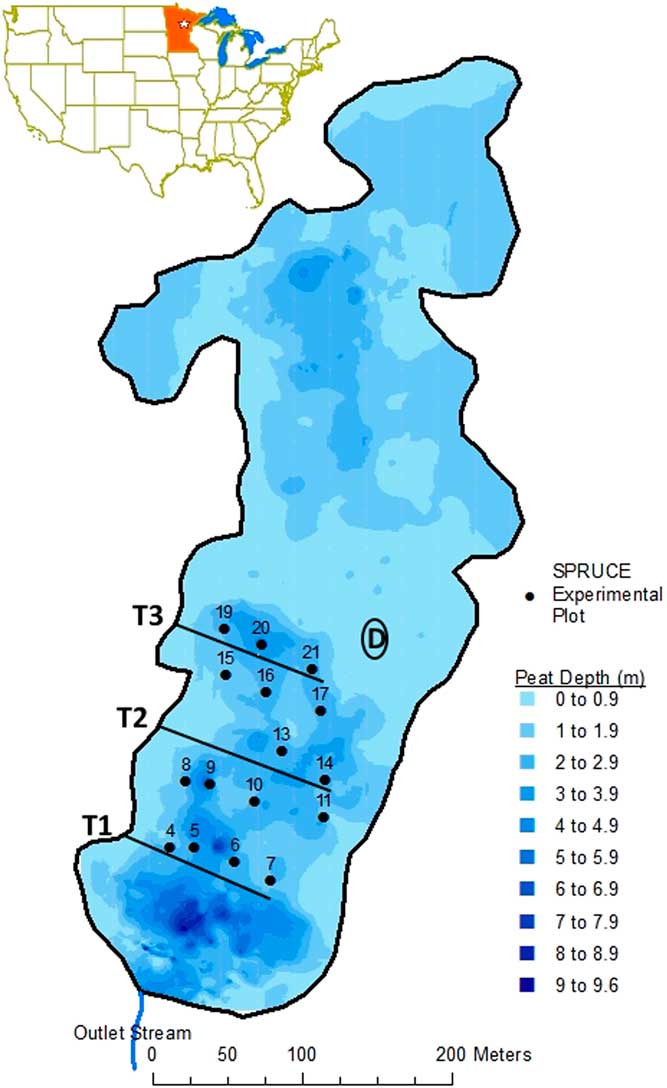
The S1 Bog is a 0.081 km–2 weakly ombrotrophic peatland with a perched water table and little or no regional groundwater influence. Elevation change is minimal across the site (412.7–413.1 m asl). Overstory vegetation is dominated by Picea mariana (Mill.) B.S.P. with Larix laricina (Du Roi) K. Koch also present. The understory is a carpet of mosses in the Sphagnum genus, along with ericaceous shrubs Chamaedaphne calyculata (L.) Moench and Rhododendron groenlandicum (Oeder) Koch. The bog surface is characterized by hummock and hollow microtopography and peat depths range from approximately 2–3 m near the middle of the bog to as much as 11 m near the bog outlet (Parsekian et al. Reference Parsekian, Slater, Ntarlagiannis, Nolan, Sebesteyen, Kolka and Hanson2012). The perched water table, which defines the generally aerobic shallow peat (acrotelm) from the persistently anaerobic deeper peat (catotelm) below, typically ranges from 0 to 30 cm below the hollow surface, but was drawn down to 140 cm below the hollow surface during historical dry periods (Sebestyen et al. Reference Sebestyen, Dorrance, Olson, Verry, Kolka, Elling and Kyllander2011). Previous work on peat characteristics at S1 Bog has supported a lower boundary for the acrotelm at about 30 cm below the hollow surface (Tfaily et al. Reference Tfaily, Cooper, Kostka, Chanton, Schadt, Hanson, Iversen and Chanton2014).
Of particular relevance to our data analyses and interpretations, one 782-cm-long peat core and several shorter cores were sampled from the nearby S2 Bog at MEF between 1983 and 1994 AD (Verry and Janssens Reference Verry and Janssens2011). This site is approximately 1.5 km northwest of the S1 Bog. Details on the methods used and interpretation of measurements made on these peat cores and soil pits can be found in Verry and Janssens (Reference Verry and Janssens2011). These data provide some of the context for interpretation of results reported here, though they may not perfectly reflect the history of the S1 Bog as the two bogs differ in depth to the underlying groundwater aquifer, peat depth, and peat accumulation rates, which are all greater at the S2 Bog. In addition, although both bogs are dominated by a black spruce overstory with sphagnum mosses, the overstory of the S1 Bog was strip-cut in winters 1969–1975 AD (see below) while S2 was not disturbed and some differences in understory shrub and herbaceous communities have persisted since at least 1968 AD (Verry Reference Verry1969).
Two events in the recent past that are specific to the S1 Bog took place during the 20th Century. First, a stand-replacing disturbance, most likely fire or a windstorm, affected the southern end of the bog (where the SPRUCE plots are located) in approximately 1905 AD (Verry Reference Verry1969). This disturbance does not appear to have affected the S2 Bog. Second, the S1 Bog was subject to a strip-cut harvest with initial strip-cutting occurring in 1969 AD and remaining uncut strips harvested in winter 1974–1975 AD (Sebestyen et al. Reference Sebestyen, Dorrance, Olson, Verry, Kolka, Elling and Kyllander2011). Picea and Larix naturally reseeded into each set of strip cuts; the strips harvested in 1969 AD tend to be taller, with a larger basal area, as they were reseeded from mature adjacent strips (1974–1975 AD cuts were reseeded from immature adjacent strips that had been harvested 5 years prior or from a legacy seedbank).
SPRUCE Experiment
The SPRUCE experiment evaluates the response of northern peatland ecosystems to increases in temperature and exposures to elevated atmospheric CO2 concentrations. The experimental work in the S1 Bog includes a climate change manipulation in 10 enclosures that are 12-m diameter by 8-m tall, focusing on the combined responses to multiple levels of warming including +0, +2.25, +4.5, +6.75 and +9°C (Barbier et al. Reference Barbier, Hanson, Todd, Belcher, Jekabson, Thomas and Riggs2012; Hanson et al. Reference Hanson, Riggs, Nettles, Phillips, Krassovski, Hook, Gu, Richardson, Aubrecht, Ricciuto, Warren and Barbier2017). Half of the warming treatments are also conducted at eCO2 (~900 ppm). Treatments began in 2014 AD, and both direct and indirect effects of these experimental perturbations are being analyzed to develop and refine models needed for full Earth system analyses. Prior to the selection of 10 plots for the SPRUCE experimental chambers, 16 plots, approximately 20 m apart were laid out across three transects in southern half of the S1 Bog, and were characterized for peatland C patterns and processes prior to the initiation of experimental treatments.
Core Collection and Processing
Peat cores for this study were collected in 2012 AD from the 16 pre-treatment plot locations, which were located in the southern portion of the S1 Bog (Figure 1). Peat physical and chemical data and the metadata describing sampling, handling, and analyses are available online (Iversen et al. Reference Iversen, Hanson, Brice, Phillips, McFarlane, Hobbie and Kolka2014) and have been partly described elsewhere (Griffiths et al. Reference Griffiths, Hanson, Ricciuto, Iversen, Jensen, Malhotra, McFarlane, Norby, Sargsyan, Sebesteyen, Shi, Walker, Ward, Warren and Weston2017; Hobbie et al. Reference Hobbie, Chen, Hanson, Iversen, McFarlane, Thorp and Hofmockel2017). Briefly, and focusing on samples used for this analysis, the SPRUCE plots are located along 3 transects running parallel and roughly northeast to southwest from the western edge of the bog across the domed center. Transect 1 (including plots 4–7) is the southernmost of the 3 transects and is closest to the bog outlet. Transect 2, includes plots 8–11 and 13–14. Transect 3 is the northernmost and includes plots 15–17 and 19–21. Plots 4, 8, 15, and 19 are closest to the bog lagg, a transition zone along the bog edge where runoff collects and is transported laterally to the bog outlet. In contrast, plots 6, 10, 13, 17, 20, and 21 are farthest from the lagg edge. Elevation increases from south to north and from west to east such that plots 21 and 17 are closest to the bog’s higher elevation, domed center (Figure 1 and Table 1).
Profile locations, peat depths, estimated basal ages, and long-term apparent carbon accumulation rates, and depth to peak radiocarbon content.

1 Profile names followed by NT are cores taken from non-treed locations. All other profiles are from treed locations.
2 Elevation from central wells of SPRUCE plots from Griffiths et al. (Reference Griffiths, Hook and Hanson2016).
3 Position refers to proximity to the bog edge and lagg area. N=near lagg, M=middle of transect, F=far from lagg.
4 Basal ages derived from age-depth profiles that extended to the bottom of the deepest dated depth increment.
Peat cores were from the hollow surface assigned the depth of 0 cm; all depths below the surface of the hollow are assigned negative values throughout the remainder of the text. Cores were taken from locations within 1.5 m of Picea mariana or Larix laricina trees. For plots 4 and 5, additional peat cores from areas with no trees in the immediate vicinity were taken to assess the potential effect of tree cover on peat characteristics (referred to as non-treed). Cores were taken using a 7.6-cm-diameter, 18-cm-long hole saw for surface peat (to –30 cm) and a 5-cm-diameter, 50-cm-long Russian corer for deeper peat (from –30 to –200 or –300 cm). Cores were cut in the field into 10-cm depth increments to –100 cm depth, cut into 25-cm increments from –100 to –200 cm depth, and left in 50-cm increments from –200 to –300 cm depth (or shallower depth if mineral soil was encountered). For each plot, 3 adjacent cores were taken from each sampling location type (treed/non-treed) and peat was bulked and homogenized for each location type, depth increment, and plot. Samples were frozen at –20°C; and shipped to Oak Ridge National Laboratory for further processing.
Each peat depth increment was thawed, oven-dried at 70°C to determine gravimetric water content, and the dried peat was then ground into a fine powder; vascular plant material was not removed prior to these analyses. Carbon concentration was measured on a LECO TruSpec elemental analyzer (LECO Corporation, St. Joseph, MI) at Oak Ridge National Laboratory. Carbon stock was calculated using carbon concentration, depth increment, and bulk density, which was calculated from dried mass and sample volume. Ash content was determined after combustion at 450°C for 6 hr. A subset of 180 peat samples was selected for 14C analysis. This subset included one peat profile from treed locations for each plot and one additional profile from non-treed locations for plots 4 and 5. Cost precluded 14C of all depth increments, so for depths below –50 cm, only alternating depth increments were selected for this analysis. The deepest increments were excluded from further analysis if these samples included high mineral content, identified as samples with ash contents ≥23% as these had higher bulk densities, lower carbon concentrations, and younger 14C ages than the overlying peat layers because we suspect bulk peat included mineral material from the ancient lake bottom below the peat bog (see Table 1 for maximum peat depth by profile).
To provide higher-resolution dates and to test the validity of using large increment bulk peat 14C measurements to construct age-depth profiles and model C accumulation rates, three additional shallow (to –50 or –100 cm) cores were collected from hollow locations in three of the SPRUCE plots in June 2015. These cores were collected using the same methods as those collected in 2012, except that only one core was taken and peat was cut into 1–2 cm depth increments in the field. These samples were stored frozen and a subset thawed for the selection of specimens for 14C analyses from depths of interest. For peat slices above –35 cm, Sphagnum moss tissues were picked for 14C analysis to reduce integration or reservoir effects to the greatest degree possible (i.e., by avoiding fungal and vascular plant tissues including roots). A few deeper peat samples were selected to provide additional dates for specific layers of interest. In August 2015, SPRUCE collaborators found charcoal in 2 additional peat cores collected for other analyses and provided the appropriate peat layers (–55 cm and –68 cm depths) for 14C measurement. For pre-bomb peat layers, plant macrofossils or charcoal were selected, rinsed with DI water, and pretreated with 0.5 N NaOH to remove dissolved organic carbon (DOC), which has been found to be young relative to the bulk peat at the site even at depth (Tfaily et al. Reference Tfaily, Cooper, Kostka, Chanton, Schadt, Hanson, Iversen and Chanton2014).
Radiocarbon Measurements and Statistical Analysis
Radiocarbon (14C) values were measured on the Van de Graaff FN accelerator mass spectrometer (AMS) at the Center for AMS at Lawrence Livermore National Laboratory. Samples were prepared by sealed-tube combustion to CO2 in the presence of CuO and Ag and were then reduced onto Fe powder in the presence of H2 (Vogel et al. Reference Vogel, Southon, Nelson and Brown1984). 14C values are reported here in fraction modern, also referred to as FM or F14C (Reimer et al. Reference Reimer, Brown and Reimer2004), and had an average AMS precision of 0.0026 F14C. 14C values were corrected for mass-dependent fractionation with measured δ13C values (analyses conducted at the Department of Geological Sciences Stable Isotope Laboratory at University of California-Davis using a GVI Optima Stable Isotope Ratio Mass Spectrometer).
Calibrated Ages
Calibrated peat ages were determined using Calib Version 7.1 (http://calib.qub.ac.uk/calib/) with the IntCal13 calibration curve (Reimer et al. Reference Reimer, Bard, Bayliss, Beck, Blackwell, Bronk Ramsey, Buck, Cheng, Edwards, Friedrich, Grootes, Guilderson, Haflidason, Hajdas, Hatté, Heaton, Hoffmann, Hogg, Hughen, Kaiser, Kromer, Manning, Niu, Reimer, Richards, Scott, Southon, Staff, Turney and van der Plicht2013). For modern samples, calibrated ages were determined using CaliBomb (http://calib.qub.ac.uk/CALIBomb/) run with a compilation of calibration datasets that included IntCal13 (Reimer et al. Reference Reimer, Bard, Bayliss, Beck, Blackwell, Bronk Ramsey, Buck, Cheng, Edwards, Friedrich, Grootes, Guilderson, Haflidason, Hajdas, Hatté, Heaton, Hoffmann, Hogg, Hughen, Kaiser, Kromer, Manning, Niu, Reimer, Richards, Scott, Southon, Staff, Turney and van der Plicht2013) for the pre-bomb period and monthly atmospheric 14C for the Northern Hemisphere Zone 1 for 1950–2009 AD (Hua et al. Reference Hua, Barbetti and Rakowski2013). For surface peat, a smoothing factor was used based on linear peat accumulation rates for modern peat (generally 10 years to –20 cm and 20 years for –20 cm to –30 cm). Pre-modern peat was insensitive to smoothing. For very young surface samples, age distributions for the recent side of the bomb curve overlapped the end of the calibration curve (2009 AD). These ages were checked manually using NH Zone 1 annual growing season averages in Table 2a from Hua et al. (Reference Hua, Barbetti and Rakowski2013) and assuming an annual decline of 0.0050 F14C for 2009–2012 AD. For modern peat with 2 distinct calibrated ages, one corresponding to either side of the atmospheric bomb curve, profile 14C values and calculated peat accumulation rates were used to identify the correct calibrated age. Calibrated dates for picked Sphagnum mosses, plant macrofossils, and charcoal from small depth increments were determined using the same approach as described above, except that for modern Sphagnum, a smoothing of 4 months (a single growing season) was used and calibrated ages that corresponded only to winter months were excluded.
Carbon accumulation rates and standard errors in g C m–2 yr–1 for all profiles and time periods during the Holocene. For non-linear regression models, standard errors were propagated from parameter errors. (For model fit and parameters, see Tables S3 and S4.)
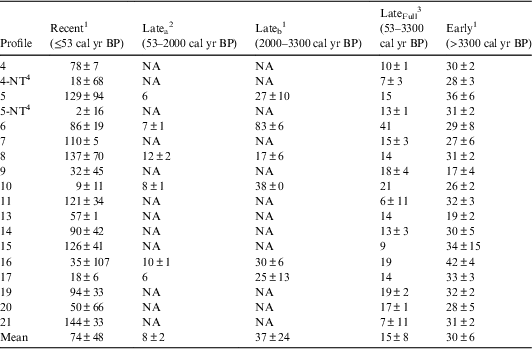
1 Carbon accumulation rates calculated using Equation 1 from modeled I and k with standard errors propagated from model generated standard errors on I and k.
2 Carbon accumulation rates and standard errors determined by linear regression where accumulation rate is equal to the slope of the fitted line. In cases with only 2 data points, no error can be determined.
3 Carbon accumulation rates modeled for entire late Holocene period or calculated from a time-weighted average of sub-periods (if there are data in the Latea and Lateb columns). Rates for profiles 13 and 15 were determined using linear regression over the entire late Holocene period.
4 Unusually low bulk density in one of the peat increments included in the Recent Accumulation model resulted in very low carbon accumulation with a high propogated error.
Age-Depth Models
Age-depth models were determined for each profile separately using Bacon 2.2 (Blaauw and Christen Reference Blaauw and Christen2011) and with IntCal13 and Northern Hemisphere Zone 1 calibration curves. For each age-depth model, the age at the surface (0 cm depth) was set at the year of sampling. The middle depth for peat depth increments was used for constructing the age-depth models and models only extended to the bottom of the deepest depth increment for which 14C was measured. Prior information for accumulation rate was set as a gamma distribution with shape 2 and mean 20. In addition to being the default values used in Bacon and described and demonstrated in Blaauw and Christen (Reference Blaauw and Christen2011), this was a reasonable estimate based on peat accumulation data available for the area (Verry and Janssens Reference Verry and Janssens2011). Prior information for memory (high values correspond to high correlation in accumulation rate between peat layers) was set with mean=0.4 and strength=10, because our core data suggested a weaker correlation between depths than the default value of 0.7 and our preliminary model runs suggested a sharper peak for the distribution of the memory effect than the default value of 4.
Linear Apparent Carbon Accumulation Rates
Apparent long-term rate of carbon accumulation (LORCA) was calculated for each complete profile to provide an indicator of carbon accumulation over the lifespan of the peatland. Because we used relatively thick peat layers and assumed the bulk mean age is the age of the peat in the middle depth of the peat layer, extrapolated median ages for the bottom of the deepest peat layer from the age-depth models served as estimates for basal peat age. Total carbon storage in the profile was divided by estimated basal age to provide LORCA for each profile. To investigate apparent carbon accumulation rates (CAR) over time, we also calculated CAR for each individual peat layer as the carbon stock divided by the difference in median age (derived from the profile age-depth model) of the top and bottom of the peat layer.
Non-Linear Carbon Accumulation Rates
LORCA and CAR are simple linear calculations and do not account for input and decomposition. To provide additional insight into the mechanisms behind changes in CAR over time and to provide estimates of input and decomposition rates for other modeling activities, we modeled carbon accumulation rates over time (Trumbore and Harden Reference Trumbore and Harden1997; Hicks Pries et al. Reference Hicks Pries, Schuur and Crummer2012) based on the model for peat bog carbon accumulation described in Clymo (Reference Clymo1984). The model assumes that the net change in carbon storage (dC/dt) is determined by the balance between annual carbon inputs (I in g C m–2yr–1) and decomposition (kC, where k is the first-order decomposition rate constant in yr–1 and C t is the organic C inventory in year t):
 $$dC/dt{\equals}I-kC$$
Solving this equation yields:
 $$C_{t} {\equals}C_{0} {\times}e^{{-kt}} {\plus}\left( {I/k} \right){\times}\left( {1-e^{{-kt}} } \right)$$
None of the accumulation curves required a positive C0, so the C0 term was dropped and an x-axis intercept, ti, was introduced:
 $$C_{t} {\equals}\left( {I/k} \right){\times}\left( {1-e^{{-k\left( {t-ti} \right)}} } \right)$$
This time shift can be interpreted as a period in time prior to sampling in 2012 that carbon accumulation stopped. Only 3 of the 18 profiles could be fit to a single curve because of a considerable shift in CAR around 3300 cal BP (see Results section, Figure 5b, and Figure S1). Therefore, three separate curves were fitted for recent accumulation rates (in the acrotelm) and two time-periods in the catotelm, before and after 3300 cal BP. Using this non-linear approach, we provide additional insight into the role of changes in input rates versus decay rates in explaining this distinct shift in carbon accumulation.
For each peat profile, Equation 3 was fit to a plot of accumulated carbon inventory (C t ) versus time (t) using the “nls” function in R to obtain estimates of I and k. For depth increments with 14C measurements (most cases, including shallow peat layers), calibrated ages were used for t. Measured ages were used when possible to remove biases in ages from age-depth models for recent peat and because little difference was found between modeled and measured ages for deeper peat (see Results and Figure 3). For depth increments with C inventory data but no 14C measurements, ages for the middle of the increment were taken from the Bacon age-depth model. Accumulation rates were then calculated using model-derived I and k and measured cumulative C inventory using Equation 1, where dC/dt is equal to accumulation rate.
Statistical Analyses
Where appropriate, means are reported ±1 standard deviation. The role of sampling location within the study area on estimated basal ages and LORCA was assessed using transect as an indicator of proximity to bog outlet and proximity to the bog lagg area as assessed from site maps and aerial photos. Relationships between profile location, peat properties, age, and CAR or LORCA were assessed with correlation analysis (reported r values are Pearson correlation coefficients), mixed effects analysis of variance, and multiple linear regression with an alpha value of 0.1. Because CAR was extremely high and variable in the acrotelm compared to the catotelm, an additional set of statistical tests was conducted with only the catotelm portion of the peat profiles, defined as depths below 30 cm. All data analyses were performed in R version 3.1.1 (R Core Team 2014).
RESULTS
Radiocarbon Values
14C values and calibrated ages, with 1 and 2σ age ranges, for all 180 peat samples are available online (Iversen et al. Reference Iversen, Hanson, Brice, Phillips, McFarlane, Hobbie and Kolka2014). As noted in Griffiths et al. (Reference Griffiths, Hanson, Ricciuto, Iversen, Jensen, Malhotra, McFarlane, Norby, Sargsyan, Sebesteyen, Shi, Walker, Ward, Warren and Weston2017), variation among 14C profiles was high, particularly in the surface 50 cm (Figure 2a). The highest observed 14C value for bulk peat was found in the –10 to –20 cm depth increment (F14C=1.3141). This value was less than the atmospheric maximum (F14C=1.9836±0.0215 for the Northern Hemisphere in 1963), in part because of the integration of several years of atmospheric 14C into bulk peat that was sampled in relatively thick 10-cm increments. However, peak 14C values of Sphagnum tissue from thin sections of peat also remained considerably lower than the atmosphere peak value, with the highest F14C at 1.2424, indicating that Sphagnum tissue in the bog may integrate multiple years of growth even when sampled in 1-cm increments. 14C values and calibrated ages of Sphagnum tissue and macrofossils picked from thin sections of peat agreed well with bulk peat measured from the same plot (indistinguishable in a paired t-test, p=0.98, n=22), supporting the validity of our use of bulk peat 14C values in this paper (Figure 2, Figure S1, and Table S1).
(a) 14C values for all bulk peat samples (circles). Depth is mean depth for a given depth increment. Solid line indicates mean F14C for a given depth with arrows indicating ±1 SD. 14C values from Plot 7 (b) and Plot 9 (c) for bulk peat from 10 cm or greater depth increments (circles) and macrofossils (triangles) or Sphagnum mosses (crosses) picked from 1–2 cm thick depth increments.
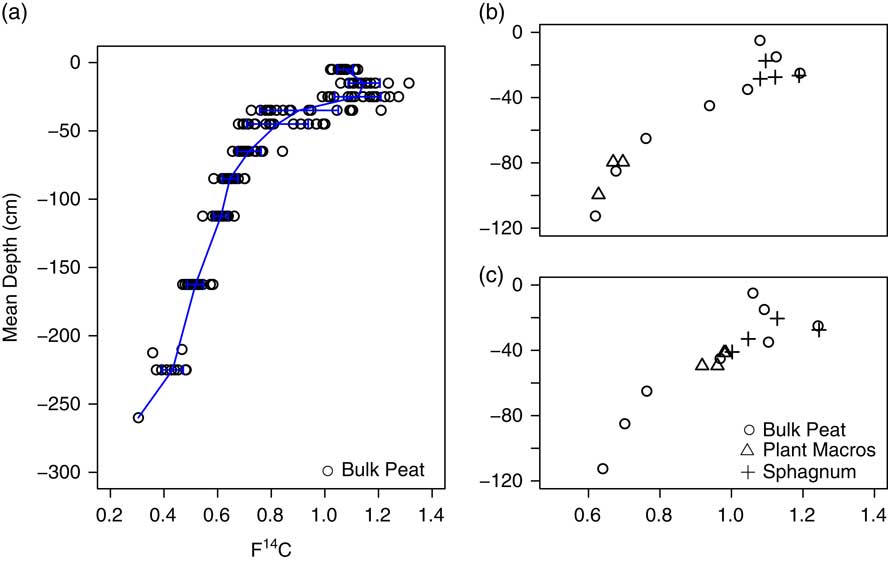
In addition, there was variation in the depth to peak F14C across profiles (Table 1) that may be indicative of spatial variation in Sphagnum growth and accumulation in the bog over the last few decades. Most profiles had peak F14C in the –10 to –20 cm (8 profiles) or –20 to –30 cm (8 profiles) depth increments. Some of this spatial variation was attributed to proximity to the bog outlet (p=0.03) or bog lagg (p=0.04). Profiles on Transect 3, furthest from the bog outlet, had the highest F14C in the –10 to –20 cm depth, while profiles on the other two transects had the highest F14C in the –20 to –30 cm depth. Profiles closest to the bog lagg also tended to have peak 14C in the –10 to –20 cm depth, while profiles further from the bog lagg tended to have peak 14C in the –20 to –30 cm depth. Sphagnum tissue picked from 1 cm increments in surface peat agreed well with bulk peat F14C and indicated that peak F14C for profiles from plots 7 and 9 occurred at –27 to –28 cm depth (Figure 2b and Table S1). It is worth noting that plots 7 and 9 are along Transects 1 and 2 and neither is near the bog lagg (Figure 1).
Age-Depth Models
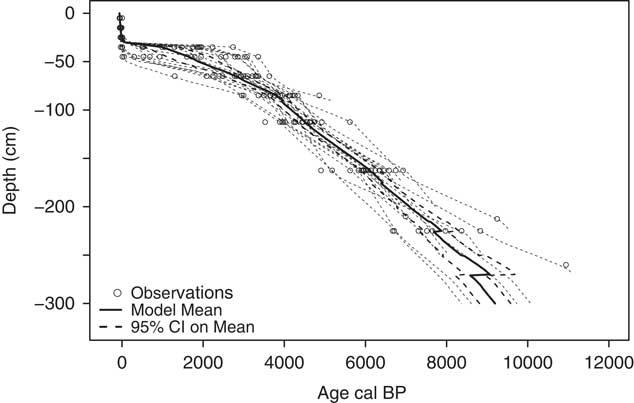
Age-depth models for each peat profile (Figure 3 and Table S2) were used to estimate basal ages for the bottom cm of the deepest peat increment. The oldest estimated basal age (11,100 cal BP) was from profile 13 (Table 1). For reference, this peat increment (–250 to –270 cm) had a measured age of 10,767−11,070 cal BP (1σ) and for this peat profile, mineral soil was encountered below –270 cm. This estimated timing for peatland establishment is consistent with the timing of glacial retreat and peatland establishment for the region (Mooers and Lehr Reference Mooers and Lehr1997; Verry and Janssens Reference Verry and Janssens2011). The youngest measured basal age (5100 cal BP) was in the shallowest (–90 cm) profile, profile 15. Estimated basal age and maximum peat depth were positively correlated (r=0.83, p<0.01). Plots on Transect 3, farthest from the bog outlet, tended to have younger basal ages than those on Transects 1 and 2, closer to the outlet (p=0.04). Plots close to the bog lagg tended to have younger basal ages than plots further from the lagg, which tended to be of slightly higher elevation (p=0.02). From the mean age-depth model, the acrotelm boundary, defined here as –30 cm depth, corresponded to a mean peat age of 67 cal BP (32−101 BP, 95% CI). There was also a large gap in measured ages between 47−60 cal BP (1σ) and 158−309 (1σ) cal BP.
Median age depth profiles from Bacon for each profile (gray dashed lines) with observed calibrated ages (circles) provided for reference. Mean age-depth model for the S1 Bog determined as the average of modeled median age for all profiles (heavy solid black line) with 95% confidence intervals (black dashed lines).
Peat Characteristics and Carbon Stocks
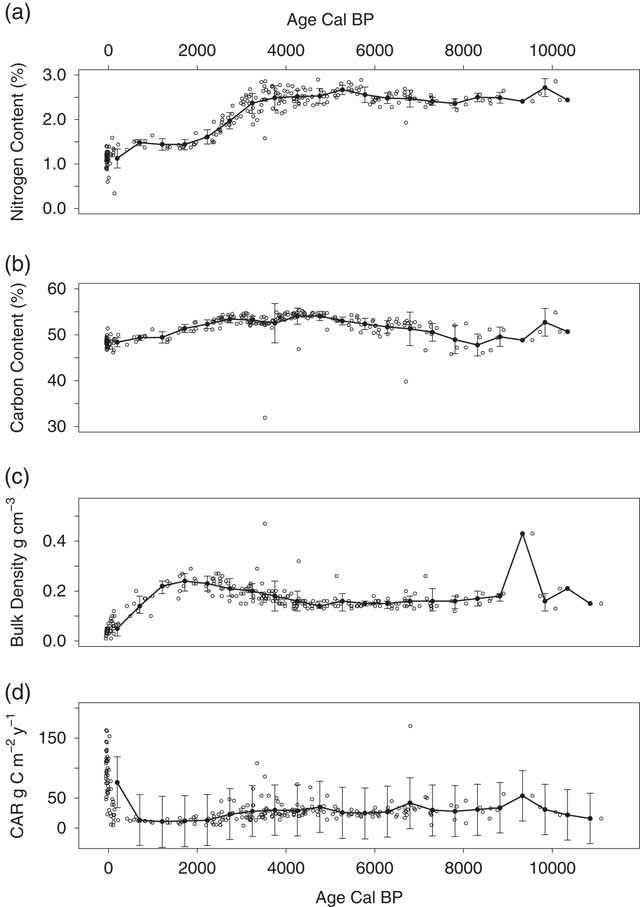
Bulk density, C, and N concentrations, and other peat chemistry for all 180 peat samples are available online (Iversen et al. Reference Iversen, Hanson, Brice, Phillips, McFarlane, Hobbie and Kolka2014) and have been discussed elsewhere (Tfaily et al. Reference Tfaily, Cooper, Kostka, Chanton, Schadt, Hanson, Iversen and Chanton2014; Griffiths et al. Reference Griffiths, Hanson, Ricciuto, Iversen, Jensen, Malhotra, McFarlane, Norby, Sargsyan, Sebesteyen, Shi, Walker, Ward, Warren and Weston2017). Average nitrogen concentration was lower in the acrotelm (1.12±0.22%) than in the catotelm (2.31±0.40%) with a period of substantial increase from 2000 to 4000 calendar BP (–30 to –80 cm depth, Figure 4). Average carbon concentration was 51.6±2.8% for the entire peat profile, with relatively little variation within or across profiles (Figure 4). Average peat bulk density was also lower in the acrotelm (0.04±0.02 g cm–3) than in the catotelm (0.18±0.05 g cm–3), although it increased with depth from the peat surface to –50 cm, or approximately 2000 BP, and then declined slightly to –100 cm, or approximately 4000 BP (Figure 4 in this paper, see also Figure 2 in Griffiths et al. (Reference Griffiths, Hanson, Ricciuto, Iversen, Jensen, Malhotra, McFarlane, Norby, Sargsyan, Sebesteyen, Shi, Walker, Ward, Warren and Weston2017) for plots by peat depth). Peat carbon stock, not including carbon stored in raised hummocks, for the S1 Bog averaged 176±40 kg C m–2 to –225±58 cm depth across depth profiles. This stock value is high relative to the 96±39 kg C m–2 reported previously for peat across MEF, sampled to an average of 200 cm depth (Grigal et al. Reference Grigal, Bates and Kolka2011), but is only 60% of the 290 kg C m–2 estimated for S2 Bog to 720 cm depth (Verry and Janssens Reference Verry and Janssens2011). Profile C stock was positively correlated with maximum peat depth and basal age (p<0.01), but spatial variation in peat carbon stocks at S1 Bog could not be explained by proximity to the bog lagg or outlet.
(a) N concentration, (b) C concentration, (c) bulk density, and (d) CAR, and by calibrated age. Open black circles are measured values for each core layer, solid black circles are 500-year mean values, and error bars indicate ±1 SD on the mean values.
Linear Carbon Accumulation Rates
The long-term apparent rate of carbon accumulation (LORCA) over the entire peat profile ranged from 18−25 g C m–2 yr–1 and averaged 22±2 g C m–2 yr–1. LORCA was correlated with maximum peat depth (r=0.61, p=0.01), but not basal age. Spatial variation in LORCA was not explained by proximity to the lagg or outlet. Incremental apparent carbon accumulation rates (CAR) varied widely in the acrotelm and decreased from 96±5 g C m–2 yr–1 in the most recent peat layers to 76±5 g C m–2 yr–1 at the acrotelm boundary (linear regression, R 2=0.38, p<0.01, Figure 4), although it must be pointed out that these accumulation rates are high relative to catotelm peat in part because decomposition is still occurring and these linear models do not account for ongoing decomposition. Acrotelm CAR were generally negatively correlated with nitrogen concentration (r=–0.3, p=0.04). On average, catotelm CAR increased with increasing age from 24±3 g C m–2 yr–1 to 34±4 g C m–2 yr–1 (linear regression, R 2=0.08, p<0.01), although there was a period with high scatter and some high CAR between approximately 3500 and 4500 BP (Figure 4d and Figure S1). Catotelm CAR were positively correlated with nitrogen concentration (r=0.19, p<0.01) and negatively correlated with carbon concentration (r=–0.13, p<0.01) and C:N ratio (r=–0.28, p<0.01). Proximity to the lagg or outlet did not explain spatial variation in CAR in the entire profile, acrotelm, or catotelm.
Non-Linear Carbon Accumulation Rates
The linear estimates of net carbon accumulation described above do not account for carbon input and decay rates. To address this, we also applied the non-linear Equation 3 to peat profile data, solved for I and k using non-linear regression analysis, and calculated resulting accumulation rates with Equation 1. Figures of cumulative carbon stock (Figure 5) indicated changes in accumulation rates over time, reflecting changes in input rates, decay rates, or both so large shifts in CAR within individual peat profiles were used to identify three distinct periods (Figure 4d and Figure S1). The earliest was a period of high carbon accumulation extended from bog establishment 11,000 to approximately 3300 calendar BP. This was followed by a period of low carbon accumulation 3300–53 calendar BP. Finally, the last 115 years (53 calendar BP to 2012 AD, the year of sampling) was a period of very high carbon accumulation. This recent period includes the acrotelm and acrotelm/catotelm boundary where aerobic decomposition may still occur. Therefore, each profile was fit using 3 models operating on different time scales, early Holocene (> roughly 3300 calendar BP), late Holocene (3300–53 calendar BP), and recent (≤53 calendar BP). Tables of fitted values for I and k are provided in Tables S3 and S4.
(a) Cumulative carbon accumulation over time for all 18 peat profiles (thin lines with circles denoting measured ages). Dashed lines mark time points for shifts in CAR used as cutoffs for non-linear carbon accumulation models. Thick blue lines highlight gaps in measured ages in several profiles during the late Holocene. (b) Cumulative carbon accumulation for profile 4-tree as an example of non-linear accumulation model fitting. Open circles are measured ages and lines indicate best fit solutions for non-linear regressions for the 3 time periods. Inset graph shows carbon accumulation over last 100 years.
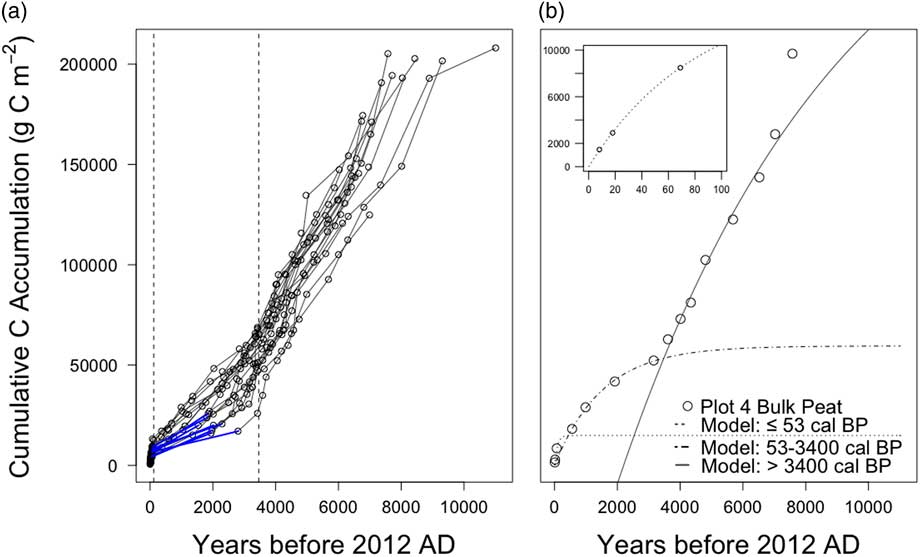
Carbon accumulation rates for the early Holocene (before 3300 calendar BP) averaged 30±6 g C m–2 yr–1 across plots (Table 2) and were lowest for the profiles 9 and 13, both on Transect 2 with neither near the lagg. Carbon accumulation rates for the late Holocene tended to be lower, but fitting the non-linear model over this period (3300–53 calendar BP) proved difficult. Eight of the 18 profiles had one or more large gaps in observed peat ages during the late Holocene with little carbon accumulation occurring across this gap in time (Figure 5a). These gaps affected the modeling of carbon accumulation for the late Holocene period in one of three ways.
For profiles associated with plots 13 and 15, Equation 3 could not be fit to the accumulation curve and a linear model for carbon accumulation had to be used instead. The carbon accumulation rate was then determined as the slope of the line, with no corresponding I or k values. Profiles for plots 5-Treed, 10, and 17 had no data points 3300–53 cal BP. Profiles for plots 6, 8, and 16 each had a single point between 2000–53 cal BP that had to be removed in order to fit the remaining data points to Equation 3. The late Holocene model was fit to the available data points, with the required “outliers” removed, but the resulting I, k, and C accumulation rates are only applicable for the time period 3300–2000 calendar BP. For these 6 profiles, a linear model was fit to this gap period (3300–53 calendar BP) to provide an estimate for carbon accumulation across this time. It is important to note that these linear models do not include decomposition and resulting accumulation rates similar to CAR.
Carbon accumulation rates for the late Holocene (3300–53 calendar BP) differed somewhat for 12 profiles that had this entire period modeled together (12±4 g C m–2 yr–1) compared to the 6 profiles that had the full period split at 2000 calendar BP (Table 2). These 6 profiles had considerably lower carbon accumulation rates 53–2000 calendar BP (8±2 g C m–2 yr–1) than 2000–3300 calendar BP (37±24 g C m–2 yr–1). Time-weighted average carbon accumulation rates over the late Holocene period for these 6 profiles were averaged with late Holocene carbon accumulation rates for the other profiles and resulted in an average carbon accumulation rate for the S1 Bog of 15±8 g Cm2 yr–1 for the late Holocene. Proximity to the lagg or bog outlet did not explain the spatial variation in late Holocene carbon accumulation rates.
Consistent with carbon accumulation curves, carbon accumulation rates were highest for the recent period, ≤53 calendar BP (p<0.01), averaging 74±48 g C m–2 yr–1 (Table 2), similar to the average value for CAR for the last 500 years (76±42 g C m–2 yr–1). The large variation among plot profiles is likely indicative of spatial variation in carbon inputs and decomposition, although it could not be explained by spatial distribution of the plots across the bog. Carbon accumulation rates for this period had large standard errors in part because of the low number of points available (3–4) to fit Equation 3. Carbon accumulation curves for this period also resulted in higher carbon input rates (I) and decomposition rates (indicated by k) than the earlier time periods (Table S3 and S4). High accumulation rates during the recent period likely reflect that peat of this age largely resides in the acrotelm, receiving high carbon inputs from vascular plant root and leaf litter and senesced Sphagnum mosses, and in large degree is still being decomposed and humified prior to entering the catotelm (Clymo Reference Clymo1984). Proximity to the lagg or bog outlet did not explain the spatial variation in recent carbon accumulation rates.
DISCUSSION
Spatial Variation in Net Carbon Accumulation
In this paper, we sampled and evaluated a large number peat profiles in close proximity and found considerable spatial and temporal variation in carbon accumulation within a single bog. Profiles further from the bog outlet and closer to the bog lagg tended to have younger basal ages and a shallower peak 14C value than profiles closer to outlet and further from the lagg. The later trend implies lower carbon accumulation rates in the last few decades, since the atmospheric bomb-peak (Hardie et al. Reference Hardie, Garnett, Fallick, Rowland and Ostle2007), in plots closer to the lagg and further from the outlet, but a lack of temporal resolution in the surface peat increments in our study precludes investigating this further. However, proximity to the lag or outlet did not explain spatial variation in carbon stock or in accumulation rates determined using linear or non-linear approaches.
To address how the local variation observed in this study compared to regional variation, we compared variation within S1 Bog to other boreal bogs in eastern North America. LORCA for 9 boreal bogs in eastern North America below 52°N Latitude from the literature and including S1 and S2 bogs (Verry and Janssens Reference Verry and Janssens2011; Garneau et al. Reference Garneau, van Bellen, Magnan, Beaulieu-Audy, Lamarre and Asnong2014; Loisel et al. Reference Loisel, Yu, Beilman, Camill, Alm, Amesbury, Anderson, Andersson, Bochicchio, Barber, Belyea, Bunbury, Chambers, Charman, De Vleeschouwer, Fialkiewicz-Koziel, Finkelstein, Galka, Garneau, Hammarlund, Hinchcliffe, Holmquist, Hughes, Jones, Klein, Kokfelt, Korhola, Kuhry, Lamarre, Lamentowicz, Large, Lavoie, MacDonald, Magnan, Makila, Mallon, Mathijssen, Mauquoy, McCarroll, Moore, Nichols, O’Reilly, Oksanen, Packalen, Peteet, Richard, Robinson, Ronkainen, Rundgren, Sannel, Tarnocai, Thom, Tuittila, Turetsky, Valiranta, van der Linden, van Geel, van Bellen, Vitt, Zhao and Zhou2014; Charman et al. Reference Charman, Amesbury, Hinchliffe, Hughes, Mallon, Blake, Daley, Gallego-Sala and Mauquoy2015), ranged from 19–61 g C m–2 yr–1, averaged 34±15 g C m–2 yr–1 (mean followed by 1 SD), and had a CV of 0.4. Local spatial variation in LORCA across all 18 profiles within S1 Bog was (range=18–26 g C m–2 yr–1, mean=22±2 g C m–2 yr–1, CV=0.09) was less than variation across the aforementioned 9 southern boreal bogs. In contrast, variation in peat carbon stock at S1 Bog (range=107–240 kg C m–2, mean=176±39 kg C m–2, CV=0.2) was similar to all 9 southern boreal bogs (range=176–373 kg C m–2, mean=270±56 kg C m–2, CV=0.2), although carbon stocks at S1 were the lower than at the other bogs. Expanding this region to include the Hudson/James Bay area with an additional 17 sites for which this data is available (van Bellen et al. Reference van Bellen, Dallaire, Garneau and Bergeron2011b; Loisel et al. Reference Loisel, Yu, Beilman, Camill, Alm, Amesbury, Anderson, Andersson, Bochicchio, Barber, Belyea, Bunbury, Chambers, Charman, De Vleeschouwer, Fialkiewicz-Koziel, Finkelstein, Galka, Garneau, Hammarlund, Hinchcliffe, Holmquist, Hughes, Jones, Klein, Kokfelt, Korhola, Kuhry, Lamarre, Lamentowicz, Large, Lavoie, MacDonald, Magnan, Makila, Mallon, Mathijssen, Mauquoy, McCarroll, Moore, Nichols, O’Reilly, Oksanen, Packalen, Peteet, Richard, Robinson, Ronkainen, Rundgren, Sannel, Tarnocai, Thom, Tuittila, Turetsky, Valiranta, van der Linden, van Geel, van Bellen, Vitt, Zhao and Zhou2014) , resulted in increased regional variation in LORCA (range=12–61 g C m–2 yr–1, mean=25±12 g C m–2 yr–1, CV=0.5) and in peat carbon stocks (range=45–373 kg C m–2, mean=171±86 kg C m–2, CV=0.5). This suggests that while local spatial variation in LORCA is high at S1, consistent with findings from other studies characterizing a single site with multiple cores (Korhola et al. Reference Korhola, Alm, Tolonen, Turunen and Jungner1996; van Bellen et al. Reference van Bellen, Dallaire, Garneau and Bergeron2011b), variation within S1 Bog is smaller than that found for LORCA across the region.
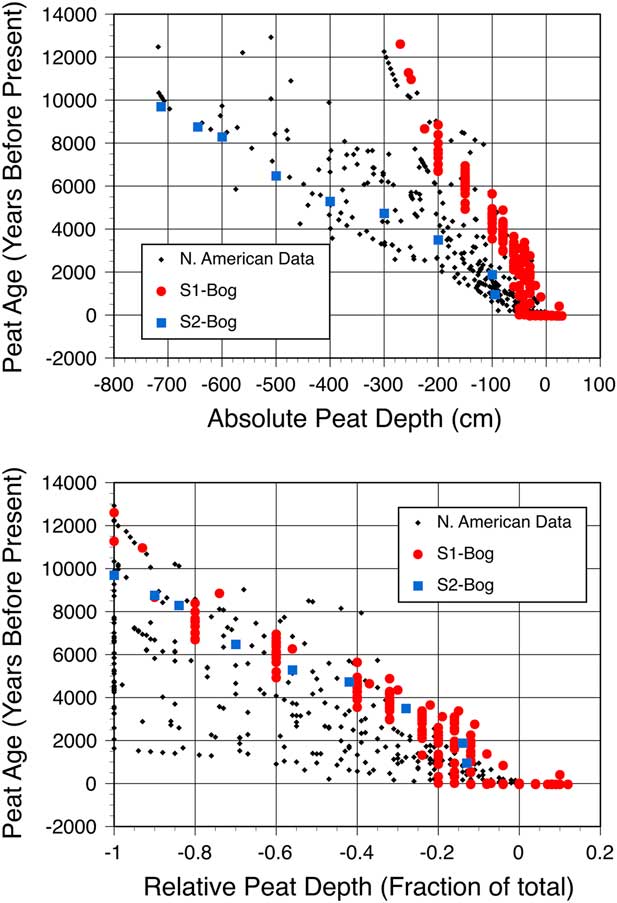
Not all studies in the literature provide peat carbon stocks, so we also compared peat age-depth profiles for the S1 Bog to similar data for other boreal peatlands located in eastern North America (Figure 6). Comparative data are from the database compiled by Loisel et al. (Reference Loisel, Yu, Beilman, Camill, Alm, Amesbury, Anderson, Andersson, Bochicchio, Barber, Belyea, Bunbury, Chambers, Charman, De Vleeschouwer, Fialkiewicz-Koziel, Finkelstein, Galka, Garneau, Hammarlund, Hinchcliffe, Holmquist, Hughes, Jones, Klein, Kokfelt, Korhola, Kuhry, Lamarre, Lamentowicz, Large, Lavoie, MacDonald, Magnan, Makila, Mallon, Mathijssen, Mauquoy, McCarroll, Moore, Nichols, O’Reilly, Oksanen, Packalen, Peteet, Richard, Robinson, Ronkainen, Rundgren, Sannel, Tarnocai, Thom, Tuittila, Turetsky, Valiranta, van der Linden, van Geel, van Bellen, Vitt, Zhao and Zhou2014), Eastern Canada/United States and Hudson and James Bay regions only; the S2 Bog near our study site (Verry and Janssens Reference Verry and Janssens2011); and other peatlands in this region from the literature (Frolking et al. Reference Frolking, Roulet, Moore, Richard, Lavoie and Muller2001; Gorham et al. Reference Gorham, Janssens and Glaser2003). Variation in age-depth profiles at S1 Bog is smaller than variation in age-depth profiles across the region, but most striking is that total linear peat accumulation at the S1 Bog is lower than other peatlands in this compiled data set, including the nearby S2 Bog (Figure 6a). Much of the scatter in Figure 6a can be attributed to variation in peat thickness in different bogs. Through normalization of peat age across total peat thickness at individual sites we can better compare patterns in peat accumulation over time across sites. In so doing, Figure 6b revealed similar patterns in relative peat accumulation over time for the collocated S1 and S2 Bogs (Figure 6b), which had similar post-glacial development within pot-hole depressions of differing depths. Compared to other boreal peatlands in eastern North America, S1 and S2 Bogs were established relatively early, likely because of their southern continental location.
Age-depth profiles for S1 and S2 Bogs and 31 additional southern boreal bogs in North America as a function of absolute (top) and relative (bottom) peat depth. Depths greater than 0 for S1 Bog are from hummocks.
We found a period of relatively high carbon accumulation at the S1 Bog from bog establishment around 11,100–3300 calendar BP, a period of lower carbon accumulation roughly 3300–53 calendar BP, and very high carbon accumulation in the last century. A similar trend of high accumulation rates early in the Holocene followed by a multi-millennial period of low accumulation with an increase during the last several hundred years has been reported for other northern peatlands (van Bellen et al. Reference van Bellen, Garneau and Booth2011a; van Bellen et al. Reference van Bellen, Dallaire, Garneau and Bergeron2011b; Garneau et al. Reference Garneau, van Bellen, Magnan, Beaulieu-Audy, Lamarre and Asnong2014; Loisel et al. Reference Loisel, Yu, Beilman, Camill, Alm, Amesbury, Anderson, Andersson, Bochicchio, Barber, Belyea, Bunbury, Chambers, Charman, De Vleeschouwer, Fialkiewicz-Koziel, Finkelstein, Galka, Garneau, Hammarlund, Hinchcliffe, Holmquist, Hughes, Jones, Klein, Kokfelt, Korhola, Kuhry, Lamarre, Lamentowicz, Large, Lavoie, MacDonald, Magnan, Makila, Mallon, Mathijssen, Mauquoy, McCarroll, Moore, Nichols, O’Reilly, Oksanen, Packalen, Peteet, Richard, Robinson, Ronkainen, Rundgren, Sannel, Tarnocai, Thom, Tuittila, Turetsky, Valiranta, van der Linden, van Geel, van Bellen, Vitt, Zhao and Zhou2014) with considerable differences among individual bogs (Charman et al. Reference Charman, Amesbury, Hinchliffe, Hughes, Mallon, Blake, Daley, Gallego-Sala and Mauquoy2015).
Historical Patterns in Carbon Accumulation
The mean carbon accumulation rate we report for the early Holocene at S1 Bog (30±6 g C m–2 yr–1) is similar to the 28 g C m–2 yr–1 average for US and eastern Canadian bogs derived from Loisel et al. (Reference Loisel, Yu, Beilman, Camill, Alm, Amesbury, Anderson, Andersson, Bochicchio, Barber, Belyea, Bunbury, Chambers, Charman, De Vleeschouwer, Fialkiewicz-Koziel, Finkelstein, Galka, Garneau, Hammarlund, Hinchcliffe, Holmquist, Hughes, Jones, Klein, Kokfelt, Korhola, Kuhry, Lamarre, Lamentowicz, Large, Lavoie, MacDonald, Magnan, Makila, Mallon, Mathijssen, Mauquoy, McCarroll, Moore, Nichols, O’Reilly, Oksanen, Packalen, Peteet, Richard, Robinson, Ronkainen, Rundgren, Sannel, Tarnocai, Thom, Tuittila, Turetsky, Valiranta, van der Linden, van Geel, van Bellen, Vitt, Zhao and Zhou2014). Similarly, Loisel et al. (Reference Loisel, Yu, Beilman, Camill, Alm, Amesbury, Anderson, Andersson, Bochicchio, Barber, Belyea, Bunbury, Chambers, Charman, De Vleeschouwer, Fialkiewicz-Koziel, Finkelstein, Galka, Garneau, Hammarlund, Hinchcliffe, Holmquist, Hughes, Jones, Klein, Kokfelt, Korhola, Kuhry, Lamarre, Lamentowicz, Large, Lavoie, MacDonald, Magnan, Makila, Mallon, Mathijssen, Mauquoy, McCarroll, Moore, Nichols, O’Reilly, Oksanen, Packalen, Peteet, Richard, Robinson, Ronkainen, Rundgren, Sannel, Tarnocai, Thom, Tuittila, Turetsky, Valiranta, van der Linden, van Geel, van Bellen, Vitt, Zhao and Zhou2014) reported a period with minimum carbon accumulation 3000–1500 BP of 18–19 g C m–2 y–1 and an increase in carbon accumulation over the last 500 years. In contrast, our observations suggest that carbon accumulation stayed low at S1 Bog until the last 100 years and averaged 15±8 g C m–2 yr–1 over this entire late Holocene period, consistent with findings from 9 bogs in Quebec (van Bellen et al. Reference van Bellen, Dallaire, Garneau and Bergeron2011b; van Bellen et al. Reference van Bellen, Garneau and Booth2011a; Garneau et al. Reference Garneau, van Bellen, Magnan, Beaulieu-Audy, Lamarre and Asnong2014; Loisel et al. Reference Loisel, Yu, Beilman, Camill, Alm, Amesbury, Anderson, Andersson, Bochicchio, Barber, Belyea, Bunbury, Chambers, Charman, De Vleeschouwer, Fialkiewicz-Koziel, Finkelstein, Galka, Garneau, Hammarlund, Hinchcliffe, Holmquist, Hughes, Jones, Klein, Kokfelt, Korhola, Kuhry, Lamarre, Lamentowicz, Large, Lavoie, MacDonald, Magnan, Makila, Mallon, Mathijssen, Mauquoy, McCarroll, Moore, Nichols, O’Reilly, Oksanen, Packalen, Peteet, Richard, Robinson, Ronkainen, Rundgren, Sannel, Tarnocai, Thom, Tuittila, Turetsky, Valiranta, van der Linden, van Geel, van Bellen, Vitt, Zhao and Zhou2014) and one in New Foundland (Charman et al. Reference Charman, Beilman, Blaauw, Booth, Brewer, Chambers, Christen, Gallego-Sala, Harrison, Hughes, Jackson, Korhola, Mauquoy, Mitchell, Prentice, van der Linden, De Vleeschouwer, Yu, Alm, Bauer, Corish, Garneau, Hohl, Huang, Karofeld, Le Roux, Loisel, Moschen, Nichols, Nieminen, MacDonald, Phadtare, Rausch, Sillasoo, Swindles, Tuittila, Ukonmaanaho, Valiranta, van Bellen, van Geel, Vitt and Zhao2013). Our carbon accumulation rates for the last century (74±57 g C m–2 yr–1) are similar to those reported for 23 eastern Canadian bogs (73±17 g C m–2 yr–1) for the last 150 years (Turunen et al. Reference Turunen, Roulet, Moore and Richard2004), but high relative to others (van Bellen et al. Reference van Bellen, Dallaire, Garneau and Bergeron2011b; Loisel et al. Reference Loisel, Yu, Beilman, Camill, Alm, Amesbury, Anderson, Andersson, Bochicchio, Barber, Belyea, Bunbury, Chambers, Charman, De Vleeschouwer, Fialkiewicz-Koziel, Finkelstein, Galka, Garneau, Hammarlund, Hinchcliffe, Holmquist, Hughes, Jones, Klein, Kokfelt, Korhola, Kuhry, Lamarre, Lamentowicz, Large, Lavoie, MacDonald, Magnan, Makila, Mallon, Mathijssen, Mauquoy, McCarroll, Moore, Nichols, O’Reilly, Oksanen, Packalen, Peteet, Richard, Robinson, Ronkainen, Rundgren, Sannel, Tarnocai, Thom, Tuittila, Turetsky, Valiranta, van der Linden, van Geel, van Bellen, Vitt, Zhao and Zhou2014). In the paragraphs that follow, we will address what we consider the most important contributors to the patterns in carbon accumulation observed at the S1 Bog.
North American Historical Climate
The early Holocene period of high carbon accumulation observed at S1 Bog and other northern peatlands coincides with a warm period 11,000–9500 calendar BP followed by a stable warm period roughly calendar 9500–5000 BP (Marcott et al. Reference Marcott, Shakun, Clark and Mix2013), the Holocene Thermal Maximum (HTM). The HTM was followed by a long-term cooling trend in the Northern Hemisphere to roughly 100 calendar BP (Marcott et al. Reference Marcott, Shakun, Clark and Mix2013). This period corresponds well to the declining trend in carbon accumulation observed by Loisel et al. (Reference Loisel, Yu, Beilman, Camill, Alm, Amesbury, Anderson, Andersson, Bochicchio, Barber, Belyea, Bunbury, Chambers, Charman, De Vleeschouwer, Fialkiewicz-Koziel, Finkelstein, Galka, Garneau, Hammarlund, Hinchcliffe, Holmquist, Hughes, Jones, Klein, Kokfelt, Korhola, Kuhry, Lamarre, Lamentowicz, Large, Lavoie, MacDonald, Magnan, Makila, Mallon, Mathijssen, Mauquoy, McCarroll, Moore, Nichols, O’Reilly, Oksanen, Packalen, Peteet, Richard, Robinson, Ronkainen, Rundgren, Sannel, Tarnocai, Thom, Tuittila, Turetsky, Valiranta, van der Linden, van Geel, van Bellen, Vitt, Zhao and Zhou2014), but the most pronounced decline in carbon accumulation rates occurred after 4000 calendar BP; they attribute this to permafrost development in peatlands of the far north during the cool Neoglacial period. However, declines in peat and carbon accumulation following the HTM also occurred in North American peatlands south of the permafrost zone (Figure 6) and cannot be entirely attributed to local permafrost formation. At bogs in Quebec, declines in carbon accumulation following the HTM were attributed to cooling and localized drying (van Bellen et al. Reference van Bellen, Garneau and Booth2011a; van Bellen et al. Reference van Bellen, Dallaire, Garneau and Bergeron2011b; Lavoie et al. Reference Lavoie, Pellerin and Larocque2013). Charman et al. (Reference Charman, Beilman, Blaauw, Booth, Brewer, Chambers, Christen, Gallego-Sala, Harrison, Hughes, Jackson, Korhola, Mauquoy, Mitchell, Prentice, van der Linden, De Vleeschouwer, Yu, Alm, Bauer, Corish, Garneau, Hohl, Huang, Karofeld, Le Roux, Loisel, Moschen, Nichols, Nieminen, MacDonald, Phadtare, Rausch, Sillasoo, Swindles, Tuittila, Ukonmaanaho, Valiranta, van Bellen, van Geel, Vitt and Zhao2013) found that carbon accumulation rates in northern peatlands over the last millennium were higher with warmer summer temperatures, longer growing season length, and higher photosynthetically active radiation, factors that increase net primary productivity (Charman et al. Reference Charman, Beilman, Blaauw, Booth, Brewer, Chambers, Christen, Gallego-Sala, Harrison, Hughes, Jackson, Korhola, Mauquoy, Mitchell, Prentice, van der Linden, De Vleeschouwer, Yu, Alm, Bauer, Corish, Garneau, Hohl, Huang, Karofeld, Le Roux, Loisel, Moschen, Nichols, Nieminen, MacDonald, Phadtare, Rausch, Sillasoo, Swindles, Tuittila, Ukonmaanaho, Valiranta, van Bellen, van Geel, Vitt and Zhao2013). In contrast, Gorham et al. (Reference Gorham, Janssens and Glaser2003) found a negative correlation between linear peat accumulation rates over the Holocene and mean annual precipitation and no relationship with mean annual temperature in their analysis of 21 peatlands across North America; the highest accumulation rates were from relatively dry southern, mid-continent sites in Minnesota and North Dakota. The later analysis included a larger portion of sites from the southern boreal region, which may provide an explanation for this inconsistency in findings. Both of these analyses used contemporary climate to infer climate controls on peatland carbon accumulation. While the climate may serve as an important controlling factor for peat and carbon accumulation, inconsistencies in the apparent responses of accumulation rates to changes in climate and variability across plots (our study; Gorham et al. Reference Gorham, Janssens and Glaser2003) and sites experiencing similar climate (e.g., Gorham et al. Reference Gorham, Janssens and Glaser2003; Beilman et al. 2009; van Bellen et al. Reference van Bellen, Dallaire, Garneau and Bergeron2011b) indicate that other factors also influence carbon accumulation rates.
Peatland Development and Vegetation Succession
Vegetation changes during peatland development are not entirely independent of climate, but are not necessarily driven only by climate, with microtopography, hydrology, and pH serving as important additional factors (Laiho 2006). Most peatlands undergo shifts in vegetation as the peatland develops, with transitions from herbaceous and graminoid species to dominance by Sphagnum mosses followed by subsequent shifts in Sphagnum species from aquatic alkaline species to those preferring drier, more acidic conditions (e.g., Hughes Reference Hughes2000; Belyea and Malmer Reference Belyea and Malmer2004; Verry and Janssens Reference Verry and Janssens2011).
Little information is available for peatland development at S1 Bog. However, vegetation succession at the nearby S2 Bog has been described based on macrofossils separated from peat cores collected in fine depth increments (Verry and Janssens Reference Verry and Janssens2011). This work found a shift in Sphagnum species in S2 Bog at 2900 cal BP from S. centrale and S. subsecundum to S. magillanicum, S. angustifolium, and S. fuscum, indicating a shift from a transitional fen to an open-poor fen, which coincided with a regional transition to a warmer continental climate, and included a decrease in pH and stronger separation of perched peat from the regional groundwater table (Verry and Janssens Reference Verry and Janssens2011). A similar transition in S1 Bog is suggested by peat stable isotope measurements that indicate a decline in nutrient stocks at about this time (Hobbie et al. Reference Hobbie, Chen, Hanson, Iversen, McFarlane, Thorp and Hofmockel2017), consistent with our observation of declining N concentration and increasing peat bulk density from 4000 to 2000 cal BP. These changes in hydrology and community may have contributed to a decline in carbon accumulation rates by decreasing NPP and carbon inputs during this period.
Fire
Peat is susceptible to burning during dry conditions and fires can obscure carbon accumulation rates if large amounts of peat are consumed (Pitkänen et al. Reference Pitkänen, Turunen and Tolonen1999). Furthermore, charcoal in boreal regions may be particularly vulnerable to loss during subsequent fire (Czimczik and Masiello Reference Czimczik and Masiello2007). Numerous extreme droughts are known to have impacted the Western Great Lakes region between 2100 and 600 cal BP (Booth et al. Reference Booth, Notaro, Jackson and Kutzbach2006). Macroscopic charcoal has not yet been found at S1 Bog, but SPRUCE collaborators collected two cores with peat layers high in small charcoal particles (≤2 mm length) at about –60 cm depth. Small charcoal pieces picked from these layers dated to 2400 and 3500 cal BP, respectively, but the origin of this charcoal is not known. Further decline in moisture availability at a bog in Michigan over the last 1000 years was linked to regional drying and an increase in fires in the region (Booth and Jackson Reference Booth and Jackson2003). A distinct charcoal layer was found at S2 Bog, and analysis indicated that a fire in 1864 AD, a drought year, burned 14 cm of catotelm peat, approximately 239 years of accumulation (Verry and Janssens Reference Verry and Janssens2011). The fire consumed peat around the peatland outlet increasing drainage and allowing for the establishment of the current Picea stand, marking the system’s shift from a poor fen to a forested bog (Verry and Janssens Reference Verry and Janssens2011).
The first known Picea stand at S1 Bog is suspected to have been established shortly thereafter, in about 1895, and it is certainly possible that this stand was also established following a fire. Additional fires may have burned in S1 Bog as recently as 1905 or 1915 AD. A stand-replacing disturbance occurred in the southern portion of the bog (where the SPRUCE plots are located) around 1905 AD (Verry Reference Verry1969). Climate records for MN indicate that 1905 was a relatively wet year, but 1910 was the driest year during the last 120 years statewide and for north-central Minnesota (www.nrdc.noaa.gov/cag/time-series). A patchy fire in the mid-1910s is also thought to have affected upland areas in the vicinity, but the degree to which peat in the S1 Bog may have burned is unknown. We only found 3 peat samples with calibrated ages between 1610 and 1915 AD, the time period corresponding to these suspected fires in the area, and two of these were from 1650 AD. It is important to remember that these dates are for peat sampled in 10 cm increments that likely integrate multiple decades of peat. In addition, peats are particularly susceptible to smoldering fires, which are difficult to detect from peat cores but may have some distinct chemical signatures (Zaccone et al. Reference Zaccone, Rein, D’Orazio, Hadden, Belcher and Miano2014). We have not found any evidence for smoldering fires in the chemistry of peat from the S1 Bog (ash, C, or N concentrations; pH; or C:N ratio). However, peat loss from fire may have contributed to the observed gaps in peat ages during the last several centuries and to decline in net carbon accumulation rates during the last several thousand years at S1 Bog.
Hydrology
Carbon accumulation and peatland development are clearly influenced by hydrology. Carbon accumulation rates may be sensitive to short-term shifts in the water table (van Bellen et al. Reference van Bellen, Dallaire, Garneau and Bergeron2011b), although this has not been well studied. As stated previously, S1 Bog does differ from S2 Bog in terms of hydrology. The S1 Bog has a lower elevation outlet stream and a larger relative upland area, which is a source of water to the peatland that flows via the lagg to the outlet compared to other bog watersheds at the MEF (Verry et al. 2011). This seems to result in greater movement of water, dissolved nutrients, and DOC out of S1 Bog compared with other bog watersheds at the MEF (Elon S. Verry, 2014 and S. Sebestyen, USDA Forest Service, 2015, personal communications). This may contribute to lower NPP at S2 than S1 Bog, although if this were the case we might also expect to see lower carbon accumulation rates in the profiles closer to the S1 Bog lagg (where most water flows along the bog margins via the lagg to the outlet stream). We did not see lower carbon accumulation in profiles closest to the lagg, although these profiles did have a shallower depth to peak peat 14C, suggesting that peat accumulation in the last few decades has been lower closer to the lagg than the interior of the bog.
Perhaps more importantly, water-table fluctuations at S1 Bog are larger than those observedfor the other watersheds at MEF throughout the 55-year MEF record, with water-table drawdown to 140 cm in particularly droughty years (Sebestyen et al. Reference Sebestyen, Dorrance, Olson, Verry, Kolka, Elling and Kyllander2011). This maximum drawdown depth was 50–100% greater than four other bogs at the MEF where identical measurements have been made since the 1960s AD (Sebestyen et al. Reference Sebestyen, Dorrance, Olson, Verry, Kolka, Elling and Kyllander2011). It is possible that greater drawdown of the water table at S1 Bog than the other watersheds in the area makes the site particularly susceptible to loss of peat by fire or enhanced decomposition peat near the acrotelm/catotelm boundary during dry years. While this hypothesis remains to be tested, enhanced decomposition at S1 Bog could contribute to the low carbon accumulation rates during the late Holocene, a time period corresponding to roughly 40–70 cm depth. Across this depth increment, which includes the acrotelm/catotelm boundary, peat at S1 Bog becomes increasingly humified and may be the zone with the most rapid peat decomposition (Tfaily et al. Reference Tfaily, Cooper, Kostka, Chanton, Schadt, Hanson, Iversen and Chanton2014). If true, this could be highly relevant for predictions of peatland response to climate change, including warming, increased evapotranspiration, and a potential drawdown of the water table level.
CONCLUSIONS
We found considerable spatial variation in age-depth profiles, models, and carbon accumulation rates among 18 peat profiles collected from pre-treatment plots prior to the initiation of the SPRUCE experimental treatments in the southern portion of the S1 Bog. Carbon accumulation rates in the bog during the early Holocene (11,000–3300 cal BP) were similar to those reported for other northern peatlands during this time, despite low total carbon accumulation over the lifespan of the bog. Carbon accumulation rates dropped considerably after about 3300 cal BP, to levels below most other southern boreal peatlands, and then rose again to very high rates during the last century. This overall trend in carbon accumulation over time follows trends in global climate, but considering the large variability between cores cannot be explained by climate alone and must result from internal dynamics operating at relatively small spatial scales. Spatially variable loss of peat by burning and/or enhanced decomposition during dry periods may explain this period of very low carbon accumulation, which may be more pronounced at S1 Bog than other peatlands in the region given differences in hydrology. Spatial variability among peat cores, though difficult to explain, illustrates the risks associated with extrapolating single core age interpretations to an entire peatland system.
ACKNOWLEDGMENTS
The authors would like to thank everyone who participated in the 2012 peat coring operation. In addition, the authors are grateful to Paula Zermeno for her help in sample preparation for 14C analysis, Tom Guilderson for his advice in sample preparation of bulk peat and macrofossils, Tom Brown for his help in age calibrations and interpretations, and Susan Zimmerman for her help in age-depth model construction with Bacon. Steve Sebestyen and Sandy Verry provided site knowledge that contributed to interpretation of peat profile and carbon accumulation data. Scott Bridgham and Jason Keller observed charcoal layers during their sampling campaigns. Steve Sebestyen and Jeff Chanton provided friendly reviews of the draft manuscript. This work was supported by the U.S. Department of Energy, Office of Science, Office of Biological and Environmental Research under project ERKP788 and project SWC1447; and Lawrence Livermore National Laboratory, Laboratory Research and Development project 14-ERD-038 under the auspices of the U.S. Department of Energy by Lawrence Livermore National Laboratory under Contract DE-AC52-07NA27344, LLNL-JRNL-686159. Oak Ridge National Laboratory is managed by UT-Battelle, LLC, for the U.S. Department of Energy under contract DE-AC05-00OR22725. The United States Government retains and the publisher, by accepting the article for publication, acknowledges that the United States Government retains a non-exclusive, paid-up, irrevocable, worldwide license to publish or reproduce the published form of this manuscript, or allow others to do so, for United States Government purposes. Data not provided in the supplementary tables associated with this paper are available online: http://dx.doi.org/10.3334/CDIAC/spruce.005.
Supplementary material
To view supplementary material for this article, please visit https://doi.org/10.1017/RDC.2018.37


 Open access

