

1. Introduction
Cold, mid-latitude glaciers represent a natural archive, well suited for studying past environmental and climatic conditions. However, a correct interpretation of ice-core records can only be performed based on a precise dating. For the time period covered by Alpine ice cores ranging from decades to thousands of years, a number of dating methods are available. The choice of the most appropriate dating method is dependent on the time-scale and accuracy requirements. A dating method frequently applied is the use of the decay of radioactive isotopes. As an example, dating with
![]() , a product of the natural 238U decay series, has been successfully applied to Alpine ice cores for time-scales of about 100 years (Reference Gäggeler, von Gunten, Rössler, Oeschger and SchottererGäggeler and others, 1983).
, a product of the natural 238U decay series, has been successfully applied to Alpine ice cores for time-scales of about 100 years (Reference Gäggeler, von Gunten, Rössler, Oeschger and SchottererGäggeler and others, 1983).
A very precise method involves dating by successive annual-layer counting, similar to the age determination of trees by counting the annual rings. In contrast to tree rings, one annual layer in a glacier may reach a thickness of several meters. However, the application of annual-layer counting requires a regular distribution of the precipitation throughout the year, and a pronounced seasonal variation of a tracer species measured in the ice core. One example is the isotopic ratio 18O/16O of the water molecules in precipitation, showing a strong annual variation due to the dependence on the condensation temperature (Reference DansgaardDansgaard, 1964). Another example is the concentration of aerosol-related species in snow (e.g. NH4 +, SO4 2− and NO3 −) which can exhibit clear summer maxima at high-Alpine sites (Reference Schwikowski, Döscher, Gäggeler and SchottererSchwikowski and others, 1999a). The dating by layer counting becomes difficult with increasing depth of the ice core due to the thinning of the annual layers.
Another approach for dating is the use of debris originating from well-known events. These reference horizons are identified by unusual concentrations of given species. The best-suited markers are chemical impurities from Saharan dust falls (Reference Wagenbach, Geis, Leinen and SarntheinWagenbach and Geis, 1989), volcanic eruptions (Reference DöscherDöscher, 1996), forest fires (Reference Savarino and LegrandSavarino and Legrand, 1998) or the radioactive debris from atmospheric nuclear weapons testing in the 1950s and early 1960s, as well as the reactor accident in Chernobyl in 1986.
Due to the uncertainties inherent in each individual dating method mentioned, it is more promising to combine several methods for establishing a precise age–depth relation for ice cores. In this work we describe the dating of an Alpine ice core from upper Grenzgletscher, Monte Rosa massif, Switzerland, by such a multiparametric approach.
A large number of studies were performed at upper Grenzgletscher in the 1970s and early 1980s (see, e.g., Reference Oeschger, Schotterer, Stauffer, Haeberli and RöthlisbergerOeschger and others, 1978; Reference Schotterer, Oeschger, Wagenbach and MünnichSchotterer and others, 1985; Reference Wagenbach, Münnich, Schotterer and OeschgerWagenbach and others, 1988). The Colle Gnifetti saddle (4450 m a.s.l), where the ice cores were drilled, is characterized by low net annual accumulation rates, reaching approximately 30 cm w.e. a−1 for the central saddle (Reference Gäggeler, von Gunten, Rössler, Oeschger and SchottererGäggeler and others, 1983). The investigations demonstrated that parts of the annual precipitation, mainly during winter, are removed by wind erosion. The advantage of the low annual accumulation rates at this site is that a much longer time period can be accessed than at high-accumulation sites. The concentration increase of trace species in snow due to the enhanced anthropogenic emissions of their precursors, between pre-industrial times and the 1970s, has been shown in several studies (see, e.g., Reference Schotterer, Oeschger, Wagenbach and MünnichSchotterer and others, 1985; Reference Wagenbach, Münnich, Schotterer and OeschgerWagenbach and others, 1988; Reference Döscher, Gäggeler, Schotterer and SchwikowskiDöscher and others, 1995b, Reference Döscher, Gäggeler, Schotterer and Schwikowski1996; Reference Lavanchy, Gäggeler, Schotterer, Schwikowski and BaltenspergerLavanchy and others, 1999; Reference Schwikowski, Brütsch, Gäggeler and SchottererSchwikowski and others, 1999b).
Due to their extent the Alps act as a barrier for air-mass flow, and therefore a north–south gradient of the air-pollution impact on the high-Alpine environment is expected. In order to assess the geographical and seasonal trends of the deposition of trace components and to identify the source regions of air pollution, glaciochemical records retrieved from glaciers located in the northern and southern part of the Alps are required. However, a comparison on an annual time-scale, for instance, necessitates well-dated high-resolution deposition records. Since such records are already available from the northern Alpine chain (from Fiescherhorn glacier (3890 m a.s.l. (see Fig. 1); time period 1946–88; Reference Schwikowski, Döscher, Gäggeler and SchottererSchwikowski and others, 1999a)), an equally suitable site was sought in the southern Alpine chain. Thus, the initial aim of a new drilling campaign at Grenzgletscher in 1994 was to recover an ice core from a high-accumulation site in the southern Swiss Alps. The accurate dating of the Grenzgletscher ice core is described here; the investigation of geographical and seasonal trends will be the subject of a future study.
Drilling sites at Grenzgletscher (GG, 1994; 4200 m a.s.l.) and at Colle Gnifetti (CG, 1982; 4450 m a.s.l), Monte Rosa massif. Reproduced with permission of the Swiss Federal Office of Topography (BA4592). International coordinates are included. Inset shows a topographic map of Switzerland where the locations of Grenzgletscher and of the weather station at Col du Grand St Bernard (GSB) in the southern Swiss Alps, and the Fiescherhorn (FH) in the northern Swiss Alps are indicated.

2. Experimental
2.1. Ice-core drilling
In October 1994 an ice core 125 m long was recovered from upper Grenzgletscher (4200 m a.s.l.; 45°55′28′′ N, 7°52′3′′ E, Swiss coordinates 633 250/085 890) at a site presumably located on the flowline of Colle Gnifetti in the Monte Rosa massif (see Fig. 1). This drilling site was selected because wind erosion of the accumulated precipitation is much less than at the Colle Gnifetti saddle. Analyses of shallow firn cores from the area of upper Grenzgletscher (Reference DöscherDöscher, 1996; Reference Gäggeler, Stauffer, Döscher and BlunierGäggeler and others, 1997) indicated an annual accumulation rate of about 2 m w.e. at the drilling site.
During the campaign, ice-core sections (0.5–0.8 m long) with a diameter of 7.8 cm were electromechanically drilled (for details see Reference Gäggeler, Stauffer, Döscher and BlunierGäggeler and others, 1997), packed and sealed in polyethylene tubes in the field and kept frozen in a cold room at −25°C until sample preparation.
2.2. Radar soundings
Measurements of the glacier thickness by radar soundings were performed at the drill site in order to investigate the flow behaviour of the glacier and to predict the source area of the drilled firn and ice (Vonder Mühll and Funk, unpublished). The results of the radar soundings show an increase of the glacier thickness and a slope of the glacier bed down along the flowline of Grenzgletscher from east-northeast (ENE) to west-southwest (WSW) (Figs 2 and 3). The glacier thickness doubles from 100 to 200 m within a horizontal distance of 400 m. We assume that the glacier thickness at the drilling site is approximately 190 m. With a relatively flat glacier geometry (slope of about 10°; Fig. 3), upper Grenzgletscher is well suited to serve as an archive for atmospheric species.
Glacier thickness (in meters) at the drilling site of upper Grenzgletscher interpolated from radar profiles (stars) (after Vonder Mühll and Funk, unpublished), along with the flowline used in Figure 3 (thick line). Swiss and international coordinates are given.

Schematic cross-section of upper Grenzgletscher at the drilling site.

2.3. Measurement of borehole temperatures
For the preservation of ice-core records of water-soluble trace components, the absence of meltwater percolation and temperate firn is essential, since the inflow of meltwater could change the initial composition of firn and ice. Measurements of borehole temperatures at the drilling site were carried out using thermistor chains (personal communication from S. Suter, 1999). The measured continuous negative borehole temperatures (Fig. 4) indicate that Grenzgletscher consists of cold firn and ice down to at least 4000 m a.s.l.. A relatively high temperature of −0.4°C at 2.5 m w.e. depth shows that the upper firn layer was nearly temperate down to this depth: a result of the unusually high temperatures in summer 1994. We conclude that the drilling site belongs to the cold infiltration zone where meltwater may be present in the upper firn layer.
Borehole temperatures along the drilling (personal communication from S. Suter, 1999). The ice-core depth of 104 m w.e. represents the total length of 125 m.

Conspicuous in the temperature profile is the local temperature maximum of about −1°C at 18 m w.e. depth. It has been suggested that this temperature anomaly is due to meltwater inflow at 11–12 m w.e. depth, most probably through a crevasse system in the glacier (Reference Eichler, Schwikowski and GäggelerEichler and others, in press). Additionally, draining of the meltwater at 20–24 m w.e. depth was supposed. Meltwater percolation led to a preferential leaching of various species. Concentrations of some ions (e.g. SO4 2−, Ca2+, Na+) were drastically reduced, whereas species discussed in this work (NH4 +, δ 18O and 210Pb) were preserved (see also Fig. 5). The preferential leaching was attributed to fractionation between different species occurring during snow metamorphic processes (Reference Eichler, Schwikowski and GäggelerEichler and others, in press). Thus, the methods used in this study can be applied for dating glaciers even where partial percolation of meltwater has occurred. The borehole temperature decreased below 18 m w.e. down to −9°C in 80 m w.e. depth, indicating an inflow of colder ice, presumably from the area of Colle Gnifetti.
Record of the 210Pb activity along the ice core.

2.4. Sample preparation
In the cold room of the Paul Scherrer Institute, each core section with a length up to 55 cm was photographed for documentation of stratigraphic characteristics (e.g. ice lenses, dust layers). Sectioning and decontamination of the firn and ice were carried out using a modified band-saw setup (stainless-steel blades; tabletops and saw guides covered with Teflon) which was regularly cleaned with acetone (Merck). The ice-core sections were cut into 5 cm pieces. Outer parts, which might have been chemically contaminated by the drill and the plastic storage bag, were used to analyze the isotopes 210Pb, 3H, 137Cs, 36Cl and the isotopic ratio δ 18O. From the inner parts the concentrations of the main ionic species, pH and conductivity were determined.
Due to the low concentrations of chemical species in ice and firn, materials in contact with the samples had to be very carefully cleaned. Thus, all storage bags, instruments and sample vials used were rinsed several times with ultra-pure water (18 MΩ cm quality).
2.5. Chemical and isotopic analyses
The quantitative analysis of the NH4 + concentrations in the firn and ice samples (sample volume 1 mL) was performed by ion chromatography (IC) with conductivity detection (Reference Döscher, Schwikowski and GäggelerDöscher and others, 1995a; Eichler, unpublished).
The pH was determined using an 8103 Orion Electrode coupled to a Metrohm pH meter 605 (sample volume 1 mL, addition of 10 μL 1 M KC1) (Eichler, unpublished).
The analysis of the isotopic ratio δ 18O (defined as the relative deviation of the 18O/16O ratio of the sample from the Vienna standard mean ocean water) was carried out by equilibration of a 5 mL sample with CO2 gas (0.8 bar) over 8 h (T = 19°C) (Reference Epstein and MayedaEpstein and Mayeda, 1953). The C18O16O/C16O2 ratio of the gas was measured using an isotope-ratio mass spectrometer (delta-S, Finnigan MAT).
The 210Pb activity (sample volume 200 mL) was indirectly determined over the activity of its granddaughter nuclide 210Po electrolytically deposited on Ag plates. The 210Po activity was determined by measuring its α decay at an energy of 5.3 MeV (Reference Gäggeler, von Gunten, Rössler, Oeschger and SchottererGäggeler and others, 1983; Eichler, unpublished).
For the determination of the 137Cs activity, the sample (1 L) was passed through a cation exchange column. Then the exchange resin containing the 137Cs+ was placed in an HPGeγ-borehole detector, and the 137Cs activity was measured via its γ-decay energy of 662 keV.
The 3H content of the samples (sample volume 10–70 mL) was determined by direct β measurement in a liquid-scintillation spectrometer (Reference Schotterer, Schwarz and RajnerSchotterer and others, 1998).
The analysis of the isotope 36Cl was performed by accelerator mass spectrometry (AMS). For this purpose a Cl carrier was added to the sample (about 1 L). The Cl− of the sample was precipitated as AgCl, dried and pressed into a Cu (Ta) target. Afterwards, the ratio 36Cl/Cl was determined by AMS at the Zürich facility (Reference Synal, Beer, Bonani, Lukasczyk and SuterSynal and others, 1994, Reference Synal1997).
3. Results and Discussion
3.1. Dating by radioactive decay of 210Pb
The radioactive isotope 210Pb can be used for dating glacier ice on a century time-scale. Reference Gäggeler, von Gunten, Rössler, Oeschger and SchottererGäggeler and others (1983) and Reference Gäggeler, von Gunten, Rössler, Oeschger and Schotterervon Gunten and others (1983) showed that the 210Pb method can even be used for dating temperate glaciers and glacier sites with an irregular deposition of precipitation, where most of the conventional dating methods cannot be applied.
210Pb with a half-life of 22.3 years is a decay product of
![]() which emanates continuously from the Earth’s crust into the atmosphere. Attached to aerosol particles, 210Pb can reach the glacier surface by dry or wet deposition after a residence time in the atmosphere of a few days to a few weeks. In firn and ice the activity of 210Pb decreases with increasing depth due to its radioactive decay. The exponential decay of the isotope can be used for dating under the following assumptions (Reference Gäggeler, von Gunten, Rössler, Oeschger and SchottererGäggeler and others, 1983):
which emanates continuously from the Earth’s crust into the atmosphere. Attached to aerosol particles, 210Pb can reach the glacier surface by dry or wet deposition after a residence time in the atmosphere of a few days to a few weeks. In firn and ice the activity of 210Pb decreases with increasing depth due to its radioactive decay. The exponential decay of the isotope can be used for dating under the following assumptions (Reference Gäggeler, von Gunten, Rössler, Oeschger and SchottererGäggeler and others, 1983):
-
(a) constant input of 210Pb
-
(b) no transport of the initial deposited 210Pb in firn and ice (e.g. by meltwater running through the glacier).
We used the 210Pb method for a first estimation of the time period covered by the Grenzgletscher core. The record of the 210Pb activities measured along the ice core is shown in Figure 5. We observed a decrease of the 210Pb activity with depth superimposed on strong fluctuations. These fluctuations of the measured 210Pb activities indicate that the input of 210Pb at this high-Alpine site is not constant throughout the year, in contradiction of assumption (a) above. Reference Von Gunten and MoserVon Gunten and Moser (1993) illustrated that 210Pb activities at low altitudes (Fribourg, Switzerland) do not exhibit a pronounced seasonal pattern, indicating that emissions of 210Pb from rocks and soils are independent of the season. On the other hand, strong seasonal variations of the 210Pb activity, with maximum values in August/September, have been observed at the high-Alpine research station Jungfraujoch, Switzerland (3450 m a.s.l.; Reference GäggelerGäggeler, 1995). These were attributed to seasonal variations in the transport of pollutants to the high-elevation sites. A higher frequency of convective weather types in summer yields a stronger vertical transport of aerosol-rich air from the atmospheric boundary layer to the high-Alpine sites. Therefore, higher concentrations of trace species are found in the summer snow, whereas, due to a suppression of the vertical motion by the great stability of the atmosphere, the concentrations in winter are low (Reference LugauerLugauer and others, 1998).
Dating of the Grenzgletscher ice core, based on the radioactive decay of 210Pb, is shown in Figure 6. For this purpose we used mean values of the measured 210Pb activity over sections of about 10 m w.e., thus averaging the described transport fluctuations. It is remarkable that a decrease of 210Pb activity due to decay is not visible in the part from 15 to 55 m w.e. This indicates that the input of 210Pb at the glacier site has not been constant over the last 60 years. We attribute this phenomenon to a stronger input of 210Pb in the 1970s. Concurrent with the high 210Pb activities, concentration records of the species sulphate, nitrate and ammonium showed maximum values at 50–55 m w.e. depth, due to enhanced emissions of SO2, NOx and NH3 from anthropogenic activities. We assume that during this period larger amounts of 210Pb were transported to the high-Alpine sites because of increased concentrations of aerosol particles acting as transport vehicles.
10 m w.e. mean 210Pb activity (triangles, lefthand logarithmic scale) together with a linear trend line (solid line) and a fitted function after Equation (1) (dashed line) vs depth of the ice core and the calculated age (righthand scale).

From the linear regression plot of the logarithmic 210Pb activities against depth (solid line, Fig. 6) we derived an age for the deepest part of the ice core of 55 ± 7 years with respect to the drilling date. The value of the axis intercept (85 ± 10 mBq kg−1) corresponds to the 210Pb activity at the surface of Grenzgletscher. This result agrees well with the 210Pb surface activity obtained from other Alpine sites: Colle Gnifetti (4450 m a.s.l.) 85 ± 27 mBq kg−1 (Füeg, unpubished); Jungfraujoch (3545 m a.s.l.) 78 ± 5 mBq kg−1 (Reference SchottererSchotterer and others, 1977); Vernagtferner (3150 m a.s.l.) 83 ± 17 mBq kg−1 (Reference Gäggeler, von Gunten, Rössler, Oeschger and Schotterervon Gunten and others, 1983).
From the slope of the regression line, we derived a mean annual accumulation rate of 1.9 m w.e.. This value does not include a thinning of the annual-layer thickness with depth (see section 3.4). The estimated age–depth relation (Fig. 6, solid line, righthand scale) has uncertainties of ±7 years.
3.2. Dating by seasonally varying signals
NH4 +
As already pointed out in previous work on Alpine glaciers (e.g. Reference Maupetit, Wagenbach, Weddeking and DelmasMaupetit and others, 1995; Reference Schwikowski, Döscher, Gäggeler and SchottererSchwikowski and others, 1999a), NH4 + concentrations in high-altitude glacier ice show the most pronounced seasonal pattern of any deposited major ion. This strong seasonal behaviour, with concentrations about one order of magnitude higher in summer precipitation than in winter precipitation, is due to two synergistic effects. First, the gaseous precursor NH3 is mainly emitted into the atmosphere in the warmer months (Reference AsmanAsman, 1992) because a high proportion of it (up to 90%) originates from agricultural emissions of livestock excreta and of fertilizers. Second, a strong vertical transport of pollutants from the planetary boundary layer to high-Alpine sites occurs mainly in the summer months (see section 3.1).
The record of the NH4 + concentration along the 125 m (104 m w.e.) ice core from Grenzgletscher is shown in Figure 7. Because of poor ice quality, the part between 58 and 60 m w.e. could not be analyzed. In order to highlight the seasonality, seven-point moving averages were used. The expected seasonal variations are indicated by up to 20 times higher summer than winter concentrations. Reported values were statistically different from the blank value (0.07 μeq L−1). Dating was performed by annual-layer counting, revealing an age of the deepest part of the core of 57 years with respect to the drilling date. Dating uncertainty is 1–2 years for each 5 year period because of certain difficulties with the identification of annual layers. Such difficulties were encountered for periods with small precipitation amounts (e.g. winter 1980/81), with relatively high concentrations in winter (e.g. 1982/83) or with low concentrations in summer (e.g. 1980). High concentrations in winter can be related to cyclonic weather types, whereas summer minima are due to the advection of fresh maritime air from the Atlantic (Reference LugauerLugauer and others, 1998). A cumulative dating uncertainty of 12–24 years is finally observed from counting annual NH4 + layers.
Records of NH4 + (seven-point moving average, solid line) and δ18O (dotted line) vs depth of the ice core in m w.e., together with 5 year segments (dashed lines) and six reference horizons (Saharan dust events 1990, 1977, 1947: arrows; Chernobyl accident 1986: star; nuclear weapon tests 1963, 1959: triangles).

δ 18O
Temperature- and vapour-pressure-dependent fractionation of the main isotopic components of water H2 16O and H2 18O during evaporation and condensation processes in the hydrological cycle causes lower δ 18O values in winter and higher values in summer precipitation (Reference Dansgaard, Johnsen, Clausen and GundestrupDansgaard and others, 1973). The correlation between monthly mean δ 18O values of precipitation and the atmospheric temperatures at high-Alpine sites was described by Reference SchottererSchotterer and others (1997), for instance. The δ 18O record of the ice core from Grenzgletscher is shown in Figure 7 against depth (dotted line). Strong seasonal patterns with maximum values of up to −10‰ and minimum values of −25‰ corresponding to deposited summer and winter precipitation, respectively, are observed. These are typical values for Alpine precipitation at these altitudes (Reference SchottererSchotterer and others, 1997). The dating performed by the annual-layer counting using the varying δ 18O signal has an uncertainty of ±1 year in the upper part of the ice core (<58 m w.e.). Due to the thinning of the annual layers and the smoothing of the signal with depth by diffusion processes (Reference JohnsenJohnsen, 1977), the dating error is about 1 year for each 5 year period between 60 and 90 m w.e. Thus, cumulative dating uncertainty is about 6 years for the upper 90 m w.e. Dating is hardly possible for the deepest part (>90 m w.e.).
However, a combined evaluation of the NH4 + and δ 18O profiles improved the dating precision significantly. Generally, in time periods poorly resolved by NH4 +, δ 18O seasonal layers were well produced and vice versa (see, e.g., time periods 84–80 and 44–40). The resulting uncertainty is ±1 year for the period 1970–94 and ±3 years for the period 1937–69.
The strong seasonal variation of NH4 + concentrations together with the δ 18O values indicate that precipitation at the drilling site is regularly distributed throughout the year. In order to examine if the measured amount of precipitation at Grenzgletscher is representative for this part of the Alps, we compared the net annual accumulation rate deduced from the ice core with annual precipitation data of the 50 km distant weather station at Col du Grand St Bernard (2469 m a.s.l.; see Fig. 1). This is the closest high-mountain weather station, with the longest precipitation series in the higher European Alps (Reference Wanner, Rickli, Salvisberg, Schmutz and SchüeppWanner and others, 1997). Reasonable agreement was found in the trend for the period 1977–93 (r = 0.7; Fig. 8). This time period was selected because the thinning of annual layers in this part of the glacier is negligible. A mean precipitation rate of 2.4 ± 0.3 m w.e. was registered at the Col du Grand St Bernard station, and 2.7 ±0.4 m w.e. at Grenzgletscher, suggesting that the accumulated precipitation at Grenzgletscher corresponds roughly to the actually fallen precipitation at this site. Thus, wind erosion or drift seems to be of much less importance than at more exposed saddle sites, such as Colle Gnifetti. Precipitation data from the weather station during the period 1935–94 show that precipitation in this area is nearly uniformly distributed throughout the year. Exceptions (e.g. seasons with extremely small or large amounts of precipitation) can sometimes be clearly identified from the measured δ 18O record. For instance, the pronounced δ 18O minimum of −27% at 86 m w.e. depth (see Fig. 7) is due to the well-known heavy snowfall in January and February 1951 causing a large number of avalanches (Reference PfisterPfister, 1999).
Comparison of the annual accumulation rate calculated from ice-core data (columns) with the annual precipitation measured at the weather station Col du Grand St Bernard (line) 1977–93.

3.3. Dating by stratigraphic markers
Saharan dust falls
Mineral dust originating from the Sahara can be transported over a distance of several thousand kilometers towards the Alps. As already known from studies at high-Alpine sites (e.g. at Colle Gnifetti (Reference Wagenbach, Geis, Leinen and SarntheinWagenbach and Geis, 1989) and Mont Blanc, French Alps (Reference De Angelis and Gaudichetde Angelis and Gaudichet, 1991)), the portion of Saharan dust amounts to approximately two-thirds of the overall mineral dust content. Mineralogical composition of Saharan dust can vary with the source region in Africa. A pronounced abundance of carbonates (as calcite) (Reference Schütz and SebertSchütz and Sebert, 1987), as well as high contents of the minerals quartz, gypsum, muscovite, anorthite and montmorillonite (Reference Schwikowski, Seibert, Baltensperger and GäggelerSchwikowski and others, 1995), were detected. Because of the high amount of basic minerals in Saharan dust aerosols, Saharan dust-bearing snow layers are marked not only by the often occurring yellow-orange colouring, but also chemically by a high Ca2+ content and increased pH values. Ca2+/H+ concentration ratios along the ice core from Grenzgletscher are presented in Figure 9. Three maxima of the Ca2+/H+ concentration ratio are attributed to intense Saharan dust-fall events described in the literature: March 1990 (Reference Schwikowski, Seibert, Baltensperger and GäggelerSchwikowski and others, 1995), May 1977 (Reference Prodi and FeaProdi and Fea, 1978; Reference Wagenbach, Geis, Leinen and SarntheinWagenbach and Geis, 1989) and 1947 (Reference Wagenbach, Geis, Leinen and SarntheinWagenbach and Geis, 1989). No additional dust peak was observed in the deepest part of the core, which would have corresponded to the well-known Saharan dust fall in 1936/37 (Reference Wagenbach, Geis, Leinen and SarntheinWagenbach and Geis, 1989; Reference DöscherDöscher, 1996). Thus, the deepest part is not older than 58 years with respect to the drilling date.
Identification of strong Saharan dust falls by high Ca2+/H+ concentration ratios.

3H and137Cs
Tritium
![]() is naturally produced in the atmosphere by the 14N(n, 3H) 12C reaction of cosmic-ray-induced neutrons with atmospheric nitrogen. 3H is directly incorporated into the water molecule by its reaction with stratospheric oxygen. Natural background tritium levels in precipitation before 1951 are very low, approximately 0.1–1 Bq L−1. With the detonation of the world’s first thermonuclear explosion by the U.S.A. in May 1951, a period of anthropogenic 3H production began, increasing stratospheric 3H concentrations by several orders of magnitude. The amount of tritium released into the atmosphere during the period 1951–62 was estimated to be about 2.4 × 10¹⁴ Bq (Reference Clark and FritzClark and Fritz, 1997). Until the Soviet–U.S. Test Ban Treaty in 1963, a stratospheric reservoir of 3H was built up, influencing the precipitation composition up to the present.
is naturally produced in the atmosphere by the 14N(n, 3H) 12C reaction of cosmic-ray-induced neutrons with atmospheric nitrogen. 3H is directly incorporated into the water molecule by its reaction with stratospheric oxygen. Natural background tritium levels in precipitation before 1951 are very low, approximately 0.1–1 Bq L−1. With the detonation of the world’s first thermonuclear explosion by the U.S.A. in May 1951, a period of anthropogenic 3H production began, increasing stratospheric 3H concentrations by several orders of magnitude. The amount of tritium released into the atmosphere during the period 1951–62 was estimated to be about 2.4 × 10¹⁴ Bq (Reference Clark and FritzClark and Fritz, 1997). Until the Soviet–U.S. Test Ban Treaty in 1963, a stratospheric reservoir of 3H was built up, influencing the precipitation composition up to the present.
The radioactive isotope
![]() is, along with
is, along with
![]() , one of the longer-lived nuclear fission products. During the atmospheric nuclear weapon tests in the 1950s and early 1960s (see above), large amounts of 137Cs were ejected into the stratosphere with debris. The main portion of 137Cs reaches the Earth’s surface adsorbed onto aerosol particles with a time delay of a few months to a few years because of the long stratospheric residence time (Reference Emeleus and SharpeEmeleus and Sharpe, 1961). Another event increasing the 137Cs activity in the atmosphere was the nuclear reactor accident at Chernobyl on 26 April 1986. Huge amounts of radioactive material were spread over a large area of the Northern Hemisphere, being either transported as gaseous species (e.g. Kr and Xe) or adsorbed onto aerosol particles (e.g. 137Cs). As a result, increased activity of 137Cs was detected even in Alpine glaciers (Reference Haeberli, Gäggeler, Baltensperger, Jost and SchottererHaeberli and others, 1988).
, one of the longer-lived nuclear fission products. During the atmospheric nuclear weapon tests in the 1950s and early 1960s (see above), large amounts of 137Cs were ejected into the stratosphere with debris. The main portion of 137Cs reaches the Earth’s surface adsorbed onto aerosol particles with a time delay of a few months to a few years because of the long stratospheric residence time (Reference Emeleus and SharpeEmeleus and Sharpe, 1961). Another event increasing the 137Cs activity in the atmosphere was the nuclear reactor accident at Chernobyl on 26 April 1986. Huge amounts of radioactive material were spread over a large area of the Northern Hemisphere, being either transported as gaseous species (e.g. Kr and Xe) or adsorbed onto aerosol particles (e.g. 137Cs). As a result, increased activity of 137Cs was detected even in Alpine glaciers (Reference Haeberli, Gäggeler, Baltensperger, Jost and SchottererHaeberli and others, 1988).
The activities of the isotopes 137Cs and 3H measured along the Grenzgletscher ice core are presented in Figure 10a and b. Both records reflect the atmospheric weapon tests in the 1950s and 1960s in a broad activity peak at 55–85 m w.e. depth. The maxima at approximately 76 and 69 m w.e. depth are related to the test maxima of the years 1958 and 1962. They appear in the ice core with a time delay of approximately 1 year because of the above-mentioned slow stratosphere–troposphere transfer (see, e.g., Reference Emeleus and SharpeEmeleus and Sharpe, 1961). For the same reason, activities appear in a broad peak. The maximum of the 137Cs activity at 20 m w.e. depth can be attributed to the radioactive fallout from the nuclear reactor accident at Chernobyl. The tropospheric transport of the aerosol-bound fission products, and their fast removal by wet deposition in the first week of May 1986, yielded a sharp signal in the 137Cs activity record.
Records of the 137Cs (a) and 3H (b) activities and 36Cl concentration (c) vs depth of the ice core; the activities were calculated back to the date of drilling in October 1994.
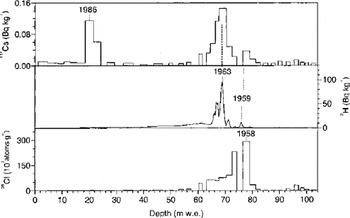
The integrated 137Cs activity from nuclear weapons fallout (3500 ± 800 Bq m−2) agrees well with estimated values (e.g. 5040 Bq m−2 between 40° and 50° N (Reference KieferKiefer, 1986), or approximately 4500 Bq m−2 at Jungfraujoch, Switzerland (von Gunten and Rössler, unpublished)). The calculated 137Cs fallout from the Chernobyl accident (800 ± 200 Bq m−2) is at the lower limit of the values determined at Alpine sites (400–15 000 Bq m−2; Reference Haeberli, Gäggeler, Baltensperger, Jost and SchottererHaeberli and others, 1988). These differences in the deposited activities reflect the known regional heterogeneity of the Chernobyl fallout, which was strongly dependent on the precipitation pattern in the first days of May 1986.
36Cl
36Cl (t 1/2 = 301 000 a) is produced in the atmosphere mainly by the interaction of atmospheric argon with high-energy cosmic radiation in the reaction 40Ar(p,nα) 36Cl. After its formation, the isotope is assumed to be attached to aerosol particles and has a residence time of 1–2 years in the stratosphere (Reference Synal, Beer, Bonani, Suter and WölfliSynal and others, 1990). Once in the troposphere, it is removed by dry or wet deposition. Besides 3H and 137Cs (see above), 36Cl was also produced anthropogenically during the thermonuclear bomb tests in the 1950s. Since anthropogenic 36Cl is formed by the neutron activation of 35Cl of sea water, the highest 36Cl activity was released into the atmosphere during tests taking place on ships or to a smaller extent on islands. Most tests on ships were performed in 1954, 1956 and 1958, releasing an overall amount of about 78 kg 36Cl (Reference Synal, Beer, Bonani, Suter and WölfliSynal and others, 1990).
The ice-core 36Cl record from Grenzgletscher is presented in Figure 10c. The broad activity peak at 60–82 m w.e. depth reflects the production by atmospheric weapon tests in the 1950s. 36Cl concentrations show a strong increase between 82 and 78 m w.e., reaching concentrations about two orders of magnitude higher at the maximum in 1958 compared to the natural pre-bomb level. After 1958 a rapid decline can be observed, indicating that the main atmospheric tests over land from 1962, which led to the maxima in the 3H and 137Cs activities, did not strongly influence the 36Cl concentration in the atmosphere. The surprisingly high 36Cl concentrations at 92–100 m w.e. depth can currently not be explained.
In order to determine the overall input of bomb-produced 36Cl, we integrated the measured inventory between 60 and 82 m w.e. with an assumed annual average precipitation rate of 2.7 m w.e. a−1 and derived a value of (4.5 ± 0.8) × 1012 atoms m−2. The fallout of bomb-produced 36Cl was estimated, using a box model for the atmospheric transport of radionuclides (Reference Sachsenhauser, Zerle, Beer, Masarik and NolteSachsenhauser and others, 1997). The maximum of approximately 4.6 × 10¹² atoms m−2 of the 36Cl inventory was obtained in the mid-latitudes, between 40 and 50° N, whereas the minima for the Northern Hemisphere were reached at the Equator and at the North Pole with about 1 × 10¹² atoms m−2. The 36Cl inventory determined at Grenzgletscher (about 45° N) fits well with the model results.
All stratigraphic markers depicted in Figures 9 and 10 agree well with the already established age–depth relationship (see Fig. 7). By combining all methods used, the accuracy of dating was improved, resulting in an uncertainty of <1 year for the period 1970–94 and ±2 years for the period 1937–69.
3.4. Determination of the thinning effect
Figure 11 shows the age–depth relationship resulting from a combination of all methods described above (triangles). The included linear trend line (dashed line), which represents a constant annual-layer thickness λ of 2.7 m w.e., describes the data only in the upper 50 m w.e. With increasing depth the data differ more from this line and show a steeper slope. This means that the annual layer thickness (1/slope) decreases as a function of depth, due to an increasing vertical strain of the glacier ice with depth. The thinning in the deepest core parts amounts to about 60%, corresponding to an annual layer thickness λE of 1 m w.e. in comparison to the initial value λ0 of 2.7 m w.e.
Age–depth relationship established in this work (triangles), together with a line representing a constant annual-layer thickness of λ = 2.7 m w.e. (dashed line). In addition, the age–depth relationship after Nye’s model is given (solid line) with λ 0 = 2.7 m w.e. and H = 170 m w.e., describing the thinning of the annual layers with depth from λ 0 to λE = 1 m w.e.
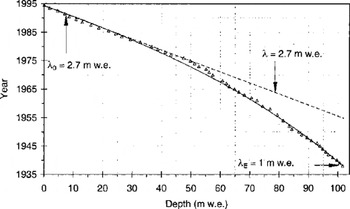
For the description of the observed thinning effect, a simple kinematic ice-flow model developed by Nye (Reference HaefeliHaefeli 1961; Reference NyeNye, 1963; Reference Dansgaard and JohnsenDansgaard and Johnsen, 1969) was used. This model implies a uniform vertical strain rate and therefore a constant horizontal velocity along any vertical line in an ice cap. Melting at the bottom is assumed to be negligible. The age t of a layer y below the surface can be calculated from the absolute ice thickness H and from the initial annual layer thickness λ 0:

This one-dimensional pure kinematic flow model does not take into account any dynamical ice-flow law. Nevertheless, Nye’s model was successfully applied to the estimation of time-scales covered by Greenland ice cores down to depths of about 2/3H (Reference Hammer, Clausen, Dansgaard, Gundestrup, Johnsen and ReehHammer and others, 1978). The calculated age–depth relationship for the Grenzgletscher core with λ0 = 2.7 m w.e. and H = 170 m w.e. (see section 2.2) is shown in Figure 11 (solid line). The agreement with the established dating based on chemical records is remarkably good. Possible reasons for the applicability of Nye’s model are that the investigated ice core represents only about two-thirds of the total glacier thickness and that Grenzgletscher has a relatively simple topography with a proportionally large extent and a small slope in the drilling area.
In order to take into account the annual-layer thinning with depth, the 210Pb data were re-analyzed. The simple linear regression of the logarithmic activities vs depth (see section 3.1; Fig. 6, solid line) yields an inaccurate average annual-layer thickness of 1.9 m w.e. In order to include thinning, the age–depth relationship derived from Equation (1) and shown in Figure 11 was added in Figure 6 (dashed line). This curve fits the experimental data better (χ 2 = 1) than the linear regression (χ 2 = 1.5).
4. Summary and Conclusions
Different techniques were used to date an Alpine ice core derived from a glacier site with high annual net accumulation rates. We obtained a time period covered by the ice core of 1937–94. Dating by the radioactive decay of 210Pb gave a first approximation of the chronology with an uncertainty of about 7 years. This uncertainty was caused by variations in the 210Pb input and by thinning of annual layers with depth. Equally high uncertainties resulted from the annual-layer counting using individual seasonal tracers. Cumulative dating errors of 12–24 years and of about 6 years were obtained from counting NH4 + and δ 18O layers, respectively. By a combined analysis of both seasonal tracers the dating accuracy was improved significantly to ±1 year for the period 1970–94 and ±3 years for the period 1937–69. With the additional use of reference horizons from Saharan dust falls (1947, 1977 and 1989), the atmospheric nuclear weapon tests in the 1950s and early 1960s and the reactor accident at Chernobyl (1986), the uncertainty was further reduced to <1 year for the period 1970–94 and ±2 years for the period 1937–69. The thinning of the annual layers was well described by a simple kinematic glacier flow model. The accurately dated glaciochemical records from Grenzgletscher will now make it possible to investigate north–south gradients of the deposition of air pollutants in the Alps.
These results imply that an accurate dating even of small-scale Alpine glaciers is possible whenever precipitation is seasonally distributed and preserved. In this case the multi-parametric approach using seasonal tracers and stratigraphic markers is a very reliable dating method. Even at glacier sites where seasonal precipitation is missing or disturbed by wind drift and erosion, a chronology can be established with the 210Pb method, although it is less accurate. A good approximation of the time-scale for the upper two-thirds of such an ice core can also be obtained by simple glacier flow modelling. Both dating with 210Pb and flow modelling might be improved by identifying temporal horizons of particular events.
Acknowledgements
We thank T. Blunier, T. Döring, A. Döscher,V. Lavanchy, H. Rufli and J. Schwander for their engagement in the field and D. Vonder Mühll, A. Kääb, M. Laternser, S. Suter and B. Suter for the glaciological investigations. The assistance of R. Siegwolf, K. Bleidissl and E. Rössler with the δ 18O analyses is gratefully acknowledged. We thank C. Stengel and S. Brütsch for their help with sample preparation for the 36Cl analyses, A. Lück for the 137Cs measurements, and U. Schotterer and H. Bürki for tritium analyses. The generous support of the Aargauische Zentralmolkerei, Suhr, in storing the ice cores is much appreciated. We thank L. Tobler and N. Streit for useful comments, and S. Nyeki for carefully reading the manuscript. This work was partly supported by the Swiss National Science Foundation (project NFP-31). The comments of the two anonymous reviewers improved the clarity of the paper, and we are grateful for their suggestions.


