
Introduction
On 9 March 2016, the United States of America and the People's Republic of China ratified the Paris Agreement on climate change, committing to limiting greenhouse gas emission. The news was covered with enthusiasm by most media, but a large part still received it with scepticism or even open opposition: the reduction of oil and coal consumption imposes high costs in the short run, and the long-term benefits are not universally accepted. In Western countries, the arguments against the limitation of gas emissions range from concern about immediate costs to denying the very existence of a global warming process. The arena of public opinion clearly plays a major role, since different stances on climate-improving policies are usually prominent subjects in election programmes, in one way or another. In short, the ability to foresee a catastrophe and to deploy technical solutions is not enough to prompt action: the transformation of production strategies bears high short-term costs, and the conflicting interests of heterogeneous socio-economic groups lead to contrasting interpretations of the catastrophe itself and of its possible solutions, hence fuelling socio-political conflict.
Whether the catastrophe is imminent or not is not the point here; taking one's cue from contemporary, contingent problems, however, can sometimes raise questions that can be addressed in the archaeological field. What this article is concerned with is the transformative process that links crisis and recovery, how it unfolds, and what kind of socio-political tensions are expected to emerge, once the contingency of the catastrophe is universally acknowledged. In particular, it seeks to analyse a specific context, in order to understand the costs of recovery, in terms of the large-scale transformation of production strategies, settling modes, and social organization.
Crisis is a frequent topic in archaeological research; several cases exist, where human systems disappear, or become severely diminished within a few years (e.g. Renfrew & Cooke, Reference Renfrew and Cooke1979; Tainter, Reference Tainter1988; Yofee & Cowgill, Reference Yoffee and Cowgill1988; Diamond, Reference Diamond2005; Cardarelli et al., Reference Cardarelli, Cazzella, Frangipane and Peroni2009). These often leave behind quite intelligible material records, providing solid ground for understanding how and why human systems collapse. Recovery is the opposite end of the process: superimposed evidence provides information on how systems were reformed, or entirely rebuilt from scratch. But what happened in between? In material terms, we observe both crisis and recovery as immobile remains, the dynamic process linking the two leaving barely observable traces in the archaeological record and requiring a great deal of indirect and negative evidence to be understood (e.g. Renfrew, Reference Renfrew, Renfrew and Cooke1979; Liverani, Reference Liverani2009).
In this article, the crisis and recovery of late nuragic Sardinia will be discussed, in order to seek patterns hidden behind the material evidence, linking together the two ends of the process. Nuragic Sardinia is characterized by the widespread construction of ‘nuraghi’―distinctive stone-built towers, the more complex of which consist of several towers, courtyards, and curtain walls, as well as surrounding houses. On the basis of geostatistical analyses and demographic figures, it is proposed that unsustainable expansion strategies led the former nuragic system to a stalemate, causing the system's crisis. Recovery was then achieved through a radical renegotiation of social and political relationships, ultimately allowing for the definition of new strategies of sustainable development. By addressing nuragic society as a whole, thus passing over local variations, it will be shown that catastrophe does not mechanically ensue from the system's carrying capacity; crisis, on the contrary, consists of the challenge of transforming unsustainable growth into successful development, hence providing the context for socio-political change (Renfrew, Reference Renfrew, Renfrew and Cooke1979). The cost of recovery is described in terms of the dissolution of traditional kinship ties in favour of the emergence of stable forms of social inequality, following a period of socio-political tensions.
The Nuragic Setting
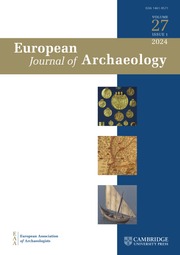
The spread of nuraghi in Sardinia can be modelled as a sequence of four, partly overlapping, phases (Vanzetti et al., Reference Vanzetti, Castangia, Depalmas, Ialongo, Leonelli, Perra and Usai2013) (Figure 1): 1) early colonization, through fission, of limited inland regions, with the construction of ‘archaic’ nuraghi (i.e. without the typical tholos tower; all sub-types diversely referred to as ‘archaic’, ‘pseudo’, ‘proto’, and ‘corridor-nuraghi’ are included) (c. 1650–1500 bc); 2) spread of tholos nuraghi, saturation of early settled areas and colonization of new territories (c. 1500–1100 bc); 3) progressive, selective abandonment of nuraghi, concentration of population around the main nuraghi and enlargement of villages, formation of territorial compounds (1350–950 bc); 4) definition of borders and ‘buffer zones’, rise of public sanctuaries, and formation of ‘confederate’ unities (c. 950 bc onwards).
Schematic model of the development of nuragic settlements. A: archaic nuraghi, early colonization (c. 1650–1500 bc); B: towered nuraghi, saturation, first villages (c. 1500–1100 bc); C: expansion stalemate, selective abandonment, enlargement of villages, formation of territorial compounds (c. 1350–950 bc); D: rise of ‘confederate’ sanctuaries, formation of borders and ‘buffer zones’ (c. 950 bc onwards).
The expansion phase took place over roughly 500 years, producing a highly dense dispersion of some 8000 nuraghi, and was accompanied by the construction of monumental collective burials (Blake, Reference Blake2001). The alleged nuragic crisis started around 1100 bc, when the construction of new nuraghi ceased or severely diminished (Perra, Reference Perra1997; Depalmas, Reference Depalmas2003; Usai, Reference Usai2006; Lo Schiavo et al., Reference Lo Schiavo, Perra, Usai, Campus, Leonelli and Bernardini2009b; Campus et al., Reference Campus, Leonelli and Lo Schiavo2010; Depalmas & Melis, Reference Depalmas, Melis, Martini and Chesworth2010; Webster, Reference Webster2015: 143–44). The trend towards expansion produced a dense distribution of settlements, at a regional scale, between c. 1350 and 1100 bc; a stalemate then ensued. Recent reassessments of the chronological framework for the nuragic Early Iron Age set the context for a complete recovery and a renewed flourishing in the early centuries of the first millennium bc, starting around 950 bc (Bernardini, Reference Bernardini2007; Usai, Reference Usai2007, Reference Usai2015; Ialongo, Reference Ialongo2010, Reference Ialongo2013a). The Early Iron Age framework pivots around the rise of monumental sanctuaries: the beginning of the crisis represents a terminus post quem for the construction of sanctuaries, whose debated chronology oscillates between the advanced Final Bronze Age (c. 1100 bc) and the Early Iron Age (c. 950 bc) (Fadda & Lo Schiavo, Reference Fadda and Lo Schiavo1992; Lo Schiavo & Usai, Reference Lo Schiavo, Usai and Santoni1995; Usai, Reference Usai2007; Ialongo, Reference Ialongo2011, Reference Ialongo2013a; Depalmas, Reference Depalmas and Catacchio2014). This is not the place to debate the question of the construction of sanctuaries, which is, after all, a marginal issue for our subject. Instead, the now commonly accepted evidence that sanctuaries experience a period of great flourishing in the early centuries of the first millennium bc is highly relevant. The abundance and variety of offerings in sanctuaries (Usai, Reference Usai2007; Ialongo, Reference Ialongo2013a) reflect the huge increase in Mediterranean relations (Gras, Reference Gras1985; Lo Schiavo & Ridgway, Reference Lo Schiavo, Ridgway, Lilliu, Ugas and Lai1987; Bartoloni, Reference Bartoloni, Bartoloni and Campanella2002; Fundoni, Reference Fundoni2009; Ialongo, Reference Ialongo2010; Milletti, Reference Milletti2012), and indicate a renewed prosperity in the Early Iron Age (Ialongo, Reference Ialongo2013a; Webster Reference Webster2015). With regard to settlement patterns, villages also tend to reach their maximum extent during the early centuries of the first millennium bc (Webster, Reference Webster1996: 158–64; Perra, Reference Perra1997; Usai, Reference Usai2006). Finally, in the Early Iron Age, individual burials become the norm (Bernardini, Reference Bernardini2007; Usai, Reference Usai2015). A few studies downplay the increasing complexity of nuragic society (Burgess, Reference Burgess, Metz and Butler2001; Araque, Reference Araque Gonzalez2014), but also tend to almost entirely disregard the numerous efforts made over the past thirty years to resolve the problematic chronological framework of late nuragic Sardinia. Thus, by conflating the wealth of the evidence available, they run the risk of mistaking for cultural variability what is, in fact, a diachronic variability of monumental structures and socio-political correlates.
To sum up, there is an arc of roughly 150 years between the end of the expansion phase and the rise of sanctuaries (c. 1100–950 bc; Final Bronze Age 2–3), during which the crisis emerged, unfolded, and was eventually resolved. Unfortunately, this period corresponds to a phase of scarce visibility of the archaeological evidence. Since nuragic archaeology is highly reliant on monumental evidence, the relatively prolonged hiatus between the end of nuragic expansion and the rise of sanctuaries can create ambiguity in the interpretation of the evidence available. Nonetheless, some significant trends can be recognized: in this period, for example, metal hoards are first attested, and relations with the Eastern Mediterranean are highlighted by the widespread presence of oxhide ingots (Gale & Stos-Gale, Reference Gale, Stos-Gale and Balmuth1987; Begemann et al., Reference Begemann, Schmitt-Trecker, Pernicka and Lo Schiavo2001; Lo Schiavo et al., Reference Lo Schiavo, Muhly, Maddin and Giumlia Mair2009a; Ialongo, Reference Ialongo2010). More importantly, this phase is characterized by the apparently concurrent processes of selective abandonment of settlements and enlargement of pre-existing villages (Webster, Reference Webster1996, Reference Webster2015; Perra, Reference Perra1997; Depalmas, Reference Depalmas2003; Usai, Reference Usai2006; Lo Schiavo et al., Reference Lo Schiavo, Perra, Usai, Campus, Leonelli and Bernardini2009b; Campus et al., Reference Campus, Leonelli and Lo Schiavo2010). Key to the comprehension of the crisis is achieving a balance between the simultaneous processes of contraction and enlargement: this is a central point of the present study, and will be discussed later.
Theoretical Framework
The notion of crisis is addressed here as a process, rather than as a moment in time. As outlined above, the nuragic sequence provides rather different documentary frameworks for the periods up to c. 1100 bc and later, from c. 950 bc. Such a difference is mirrored by interpretive narratives: the proliferation of thousands of settlements during the expansion phase would be determined by a lineage-based structure of nuragic society, encouraging cadet branches to leave the core village and found new ones (Webster, Reference Webster1996, Reference Webster2015), according to the classic ‘segmentary’ model (Sahlins, Reference Sahlins1961); on the other hand, the abandonment of earlier settlements and the increase of a resident population in larger villages would have altered the relations of production, causing the emergence of patron-client relations at the expense of kinship ties, as the huge increase in the production, circulation, and ritual deposition of prestige goods would suggest (Webster, Reference Webster1990, Reference Webster1996; Ialongo, Reference Ialongo2013a). The context of the crisis, then, provides the opportunity to observe the transformation linking the two ends of the process.
Interpretations of the nuragic crisis generally converge on adopting catastrophic models: expansion strategies seem to work well for meeting the needs of growing, simple societies; but when the same strategies cease to produce enough output to meet the community's demand (either due to diminishing returns, excessive demographic pressure, or both), the refusal to give them up causes a real risk of collapse. This general approach echoes the modern formulation of Malthusian theories, in the form of the widely influential ‘tragedy of the commons’ economic theory (Hardin, Reference Hardin1968): from an ecologist's point of view, Hardin provided several examples of how and why, in his opinion, a society whose sustenance is based on shared resources is bound to face catastrophe if population pressure is overlooked. In a later publication, his statements were reformulated with the introduction of the modifying adjective ‘unmanaged’:
‘A “managed commons” describes either socialism or the privatism of free enterprise. Either one may work; either one may fail: “The devil is in the details.” But with an unmanaged commons, you can forget about the devil: as overuse of resources reduces carrying capacity, ruin is inevitable.’ (Hardin, Reference Hardin1998: 683)
By moving slightly away from mechanistic ‘Malthusian’ positions, Hardin acknowledged that catastrophe can be effectively avoided by adapting management strategies to the contingent situation. Thus, the constraints to carrying capacity of a growing community can be removed (or moved forward) through the optimization of exploitation strategies. For nuragic Sardinia, and prehistoric societies in general, the best approximation available to management strategies is represented by the structure and organization of societies: in other words, the adaptive relationship between demographic growth and sustainable development is deeply intertwined with the transformation of social structure (Renfrew, Reference Renfrew, Renfrew and Cooke1979; Pauketat, Reference Pauketat, Dobres and Robb2000; Liverani, Reference Liverani2009).
In a broader perspective, the nuragic case is one of several instances of crises at a regional scale that occurred in Late Bronze Age Europe.
The case of the terramare sites in northern Italy represents the straightest application of the catastrophic model. The terramare society is usually described as formally cohesive, without great differentiation (Peroni, Reference Peroni1996; Cardarelli, Reference Cardarelli, Bernabò Brea, Cardarelli and Cremaschi1997; Vanzetti, Reference Vanzetti, Meller and Bertemes2010), its social structure being based on small nuclear units lacking a strong hierarchical structure (Cardarelli, Reference Cardarelli2014). The trend towards colonizing the Po Plain was apparently successful, at least until there was enough productive land to sustain the development of hundreds of settlements, over roughly 300 years (c. 1600–1300/1250 bc). After the end of this period, probably coinciding with a prolonged drought (Cremaschi & Pizzi, Reference Cremaschi and Pizzi2006), the region became almost completely depopulated by the mid-twelfth century bc, and remained so until the beginning of the first millennium bc. In this case, the archaeological evidence appears quite clear: the saturation of arable land, coupled with extensive deforestation (Cremaschi, Reference Cardarelli2009), was shortly followed by a fast, total, and durable depopulation (Di Renzoni, Reference Di Renzoni2006; Cardarelli, Reference Cardarelli2009). However, there is general agreement that environmental circumstances were not sufficient in themselves to justify the catastrophic outcome observed (Bernabò Brea et al., Reference Bernabò Brea, Cardarelli, Cremaschi, Brea, Cardarelli and Cremaschi1997; Cremaschi et al., Reference Cremaschi, Pizzi and Valsecchi2006; Cardarelli, Reference Cremaschi, Cardarelli, Cazzella, Frangipane and Peroni2009). Interpretive models identify in the lack of a strong social structure which would have been capable of drastic decision-making, the main cause of the system's incapacity to develop new, sustainable, long-term strategies, and ultimately to regenerate itself and overcome the crisis. In short, ineffective management (or lack of management) was among the causes of the system's failure.
A variant of the classic ‘tragedy of the commons’ model has been proposed for western Scandinavia (Holst et al., Reference Holst, Rasmussen and Kristiansen2013). Here, the subsistence economy is replaced by a ‘ritual’ economy (Kristiansen, Reference Kristiansen, Kienlin and Zimmermann2012) in the delicate balance between demographic pressure and scarcity of resources. Unsustainable ritual practice appears to heavily affect the environment: over roughly 450 years (c. 1500–1150 bc), the unregulated construction of tens of thousands of monumental barrows and longhouses determines heavy deforestation, and substantial impoverishment of productive soils. Consequently, relatively large areas are abandoned, but no total catastrophe ensues: large monuments eventually cease to be built, social organization is transformed, and the system's sustainability is slowly restored. Demographic collapse is avoided, but not without cost. Since the ritual economy was critical for sustaining the power structure of lineage-based societies, its demise must be correlated with the dissolution of traditional ties and to a radical transformation of the social structure itself. Demographic loss was prevented, but this came at the cost of social conflict; but the timely change of management strategies ultimately made it possible to avoid the catastrophe.
The interpretations of both cases converge on one fundamental point: it is not the scarcity of resources that is the most immediate constraint to sustainable development, but how resources are actually managed. Thus, catastrophe does not unavoidably ensue from population pressure, as classic Malthusian models would predict: it remains a possible worst-case scenario (as the evidence would suggest for the terramare system), but it can be avoided by improving management strategies or, in our case, through the transformation of social structure.
Materials and Methods
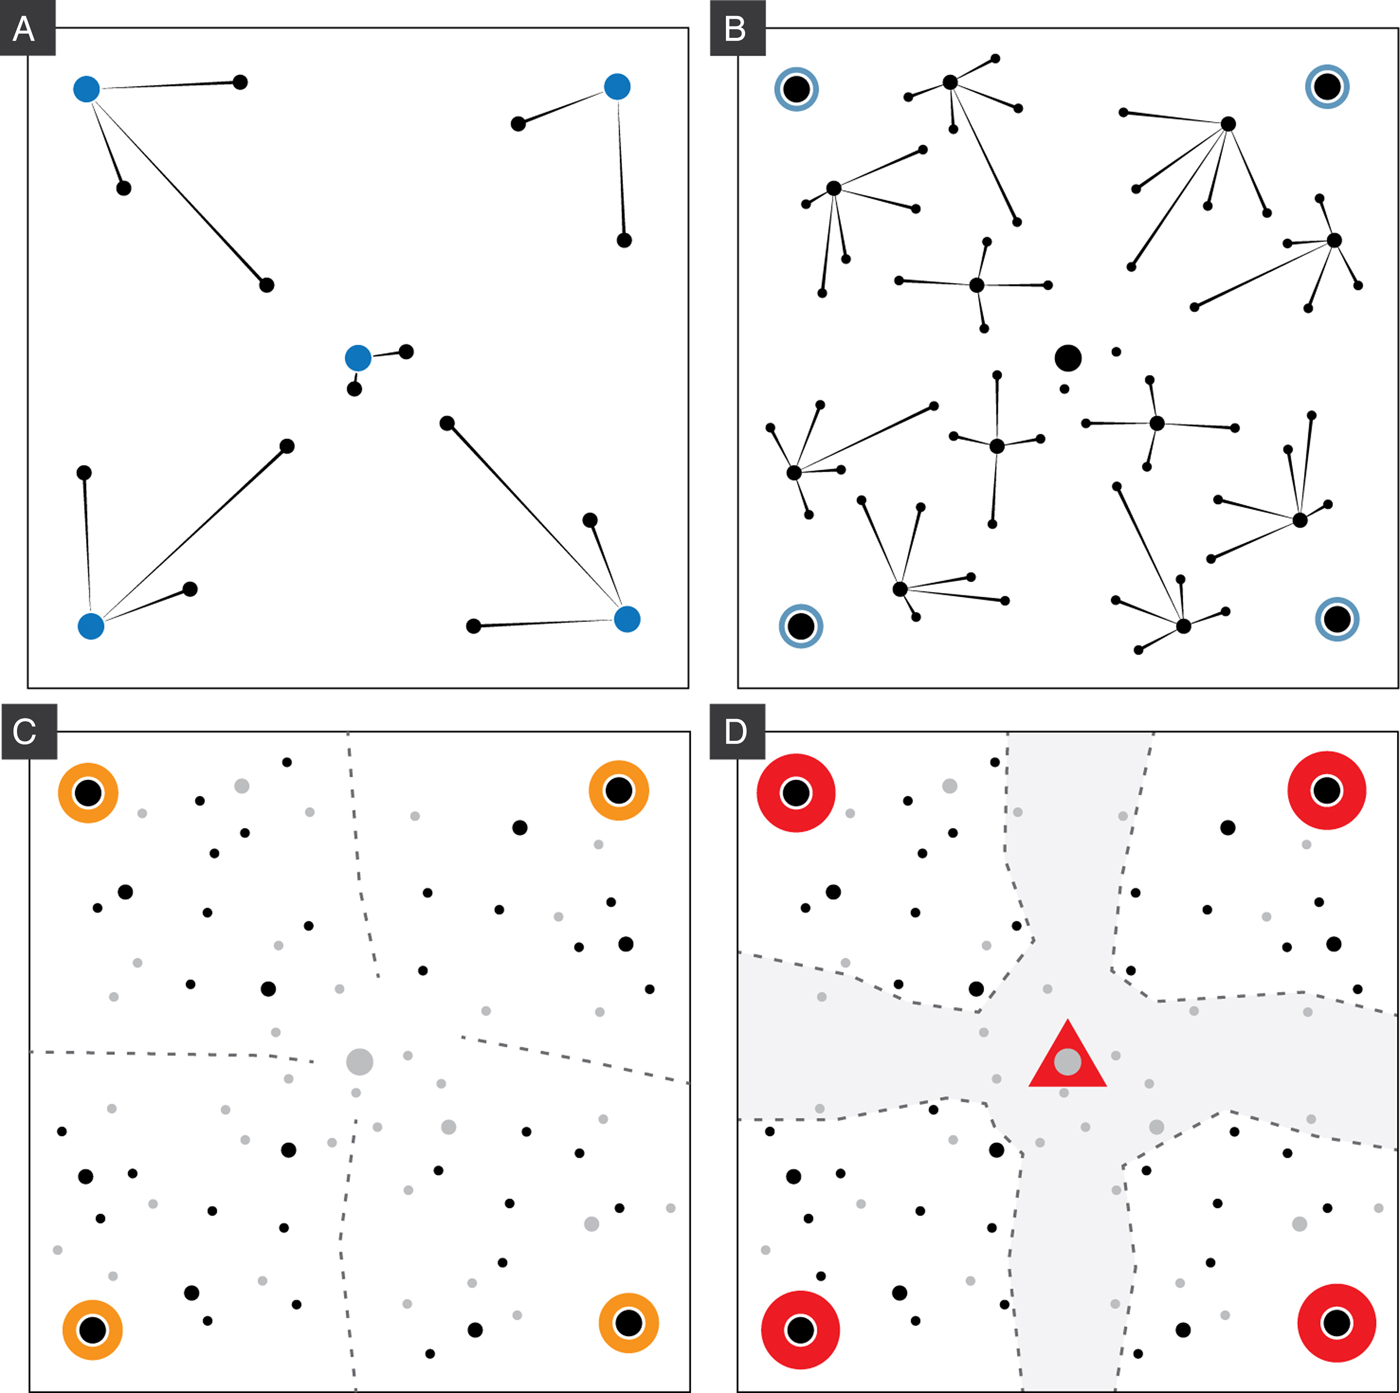
The Sardinian setting provides a large sample of Bronze Age settlements. An accepted figure of 8000 nuraghi was recently refined by the creation of a geodatabase (Figure 2) (Vanzetti et al., Reference Vanzetti, Castangia, Depalmas, Ialongo, Leonelli, Perra and Usai2013; based on Map of Nuraghi), currently including 3938 entries (c. 50 per cent of the estimated total). A limited sample (1303 nuraghi) was classified, based on the number of towers, or the lack thereof. The number of towers was chosen as a parameter of the size/rank of the settlement. A sample of 16 sanctuaries was also included in the analysis. The distribution of classified settlements reflects the overall density of known sites: they are concentrated in central areas, but are also located in marginal zones (Figure 2). The concentration of classified nuraghi in central areas might skew the general picture, but we must remember that it is exactly in the central areas that the largest number of nuraghi occurs; however, there is a notable absence of classified data in the northernmost and southernmost sectors. While this might lead to downplay the peculiarities of peripheral areas (e.g. Ledda, Reference Ledda1986; Puggioni, Reference Puggioni2009), the sample still accounts for a very large portion of the total variability. The sampling strategy has repercussions for the interpretive framework: the proposed interpretation is not intended to provide a detailed account of local differences, but to make sense of the largest possible amount of evidence through a unitary model, in a regional perspective. The location of areas well-suited for agriculture is based on contemporary vector maps (see Sardegna Geoportale); the analysis is limited to the database field identifying ‘non-irrigated crops’ as the best possible approximation to the Bronze Age setting; this is simply based on the fact that modern modifications to other kinds of agricultural surfaces (for example, through irrigation) may have altered a soil that was non-productive in ancient times, or at least not suitable for Bronze Age agriculture. The actual distribution of non-irrigated crops is likely to provide a biased datum, probably underestimated with respect to the Bronze Age landscape; urbanized areas, streets, and other non-agricultural uses must be taken into account, since they may have diminished our perception of potential agricultural land.
Distribution of nuraghi (n = 3938) and sanctuaries (n = 16) considered in the analyses; the small map shows the location of nuraghi classified according to structural typology (n = 1303). Location of non-irrigated crops and of the Campidano Plain. 1: Serra Niedda; 2: Monte S. Antonio; 3: Sos Nurattolos; 4: Romanzesu; 5: Su Tempiesu: 6: Sa Sedda ‘e sos Carros; 7: S. Cristina; 8: Su Monte; 9: Abini; 10: Gremanu; 11: S'Arcu ‘e Is Forros; 12: Sa Carcaredda; 13: S. Anastasia; 14: S. Vittoria; 15: Funtana Coberta; 16: Matzanni.
Environmental researches on sub-regional contexts suggest a relatively small-scale, diversified agriculture, largely dependent on local geological, geomorphological, and pedological conditions (e.g. Ruiz-Gálvez Priego et al., Reference Ruiz-Gálvez Priego, Lòpez Garcìa, Gutiérrez Puebla, Torres Ortiz, Lòpez Jiménez, Basildo, Gonzàlez Ruibal and Dìaz Santana2005; Depalmas & Melis, Reference Depalmas, Melis, Martini and Chesworth2010). Based on the available literature, however, it is impossible to systematically verify the relation between current land use and the ancient landscapes. Therefore, the results of the spatial analysis must be taken as extreme generalizations, and cannot be used to make punctual considerations of individual cases.
A final note about chronology is apposite. There is substantial agreement on the nuragic sequence for the phases between the Middle Bronze Age and the Recent Bronze Age (c. 1650–1200 bc). For the Final Bronze Age (c. 1200–950 bc), and especially the Early Iron Age (c. 950–730 bc), the relative sequence is debated; while distant positions are slowly getting closer, the question is still of some importance, since different chronologies substantially affect the interpretive framework of the final phases of nuragic Sardinia, both in relation to internal developments and to the Phoenician presence in the island. The present study follows the chronology defined in previous works (Ialongo, Reference Ialongo2010, Reference Ialongo2011, Reference Ialongo2013a, Reference Ialongo, Van Dommelen and Roppa2013b), recently followed by Webster (Reference Webster2015) in his second synthesis on nuragic Sardinia. In any case, the use of too clear-cut phases will be avoided, if possible, in an attempt to embrace a convergence between different schemes.
Spatial Analysis: Assessing the Relation between Nuraghi and Productive Soil
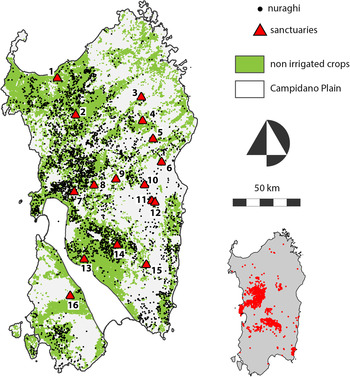
The distribution map highlights a good spatial correlation between nuraghi and non-irrigated crops (Figure 2), with only one major exception: the Campidano Plain, in the south-western sector of the island. The absence of nuragic settlements in the Campidano Plain is a well-known fact; recent discoveries suggest that this area was characterized, at least in part, by specialized settlements with perishable structures (Usai et al., Reference Usai, Sebis, Depalmas, Melis, Zedda, Carenti, Caruso, Castangia, Chergia, Pau, Sanna, Sechi, Serreli, Soro, Vidili and Zupancich2012). The spatial relation between the nuraghi and agricultural soil can be clarified through quantification. A round buffer with a radius of 1 km (314.16 ha) was computed for both nuraghi and sanctuaries, and the portion of the agricultural surface included in the buffer was calculated. The total surface of non-irrigated crops recorded in Sardinia amounts to 456,911 ha, 67 per cent of which (305,602 ha) is settled by nuraghi, while the remaining part is almost completely covered by the Campidano Plain (26 per cent; 120,000 ha) (Figure 3). The Campidano Plain was probably not an option for nuragic sites, whatever the reason. This means, in turn, that nuragic settlements apparently used up all the land suitable for agriculture.
Quantitative breakdown of the spatial relations between nuraghi and non-irrigated crops in present times.
The analysis is then restricted to classified settlements: four distinct series of area values (ha) are obtained, pertaining to archaic nuraghi (160 items), single-tower nuraghi (790), multi-tower nuraghi (354), and sanctuaries (16). The compared quartile distributions and average values provide a first pattern (Figure 4): multi-tower nuraghi show a clear trend in settling the largest productive areas (average: 92 ha); archaic and single-tower nuraghi generally settle substantially smaller areas, with average values of 38 ha (41 per cent of the multi-tower average) and 67 ha (73 per cent) respectively; finally, sanctuaries register the smallest values (average: 22 ha, 24 per cent of the multi-tower average).
Quartile distribution (boxplot) of the potential agricultural soil available to different site categories, within a round buffer of 314.16 ha (r = 1km).

A closer look at the distributions provides further information, basically supporting the initial figures. Data are square root transformed in order to approximate linearity, and plotted in frequency distributions; the best fitting normal curve is then computed for the highest peak in each distribution (Figure 5). The fitting curves show that, while the samples are not entirely normally distributed, a large part of their variation can be explained by normal distributions, thus suggesting that the observed differences between the different settlement types are not the result of chance. Finally, sanctuaries clearly show a non-normal, declining trend. In general, it appears that a fair correlation exists between the size of the nuraghi and the amount of agricultural area settled; this trend is in line with the common opinion, based on archaeological data, that larger (i.e. more complex) nuraghi tend to acquire prominent roles in settlement systems, often expanding through the construction of villages (Webster, Reference Webster1996, Reference Webster2015; Perra, Reference Perra1997; Usai, Reference Usai2006; Lo Schiavo et al., Reference Lo Schiavo, Perra, Usai, Campus, Leonelli and Bernardini2009b; Campus et al., Reference Campus, Leonelli and Lo Schiavo2010).
Frequency distribution of square root transformed data, relative to the availability of potential agricultural soil within a round buffer of 314.16 ha (r = 1km) of different site categories. Curves: best fitting normal distributions for the highest peaks. A: archaic nuraghi; B: single-tower nuraghi; C: multi-tower nuraghi; D: sanctuaries.
The Premise to the Crisis: Expansion and Landscape Saturation
The typological sequence of nuragic structures (archaic, single-tower, and multi-tower) also has an indicative chronological value that only works for large samples at a regional level and in a long-term perspective. In fact, the nuragic landscape is a palimpsest of thousands of superimposed presences; the nuragic monuments, due to their exceptional state of preservation, persisted through millennia while undergoing several changes of destination (Blake, Reference Blake1998). To attain a sound knowledge of thousands of monuments through excavations alone is clearly unthinkable, and therefore the long-term process of use and re-use cannot be addressed without relying on simplified models. The typology of nuragic structures provides such a model, at least for part of the sequence. Finally, there is substantial agreement in considering the overall dispersal of nuraghi as representing a fairly accurate picture of the period of maximum expansion of the nuragic system, between the late Recent Bronze Age and the early phases of the Final Bronze Age (c. 1300–1100 bc) (Webster, Reference Webster1996, Reference Webster2015; Lo Schiavo et al., Reference Lo Schiavo, Perra, Usai, Campus, Leonelli and Bernardini2009b; Campus et al., Reference Campus, Leonelli and Lo Schiavo2010; Vanzetti et al., Reference Vanzetti, Castangia, Depalmas, Ialongo, Leonelli, Perra and Usai2013).
Webster (Reference Webster1996: 129), following Lilliu (Reference Lilliu1999), calculates that, from the onset of the nuragic era until its peak, the Sardinian population had grown by around 700/800 per cent, with an annual rate of c. 2 per cent. These figures are supported by the geodatabase: archaic nuraghi represent roughly one eighth of the total number of categorized monuments (1303/160 = 8.14). The spatial analysis suggests even higher figures: the total agricultural surface available to archaic nuraghi is only 6091 ha, against a total amount of 90,787 ha, with a theoretical increment of 1490 per cent. From this perspective, the low average amount of agricultural surface available to archaic nuraghi (Figure 4) may indicate that they were intended to support small groups, a strategy that would soon be adjusted to achieve a greater carrying capacity.
The mechanism of ‘fission’ would represent the social correlate of the exponential spread of the nuraghi. The fission strategy is often employed by tribal patrilineal/patrilocal lineage-based societies (Sahlins, Reference Sahlins1961), dealing with demographic pressure by encouraging cadet branches to leave the core village and found new settlements (e.g. Forde, Reference Forde1938; Titiev, Reference Titiev1943; Schneider, Reference Schneider, Schneider and Gough1961; Ember & Ember, Reference Ember and Ember1971). Webster (Reference Webster1996: 125–29) examines the nuragic fission model by comparison with ethnographic cases in African tribal societies: the fission process is acknowledged for the whole expansion phase (Figure 1.A-B), eventually producing the packed distribution that can be observed in the overall map (Figure 2). The fission strategy is inextricably intertwined with the social organization of nuragic groups: settlements were small and meant to remain so; cadet segments would be encouraged to leave the core village and found new ones, thus replicating the original social structure. This would eventually create the basis for an articulated kinship organization that tied together relatively large territories, through a mechanism of real or perceived descent, akin to the conical clan model (e.g. Kirchoff, Reference Kirchhoff1949: 293; Jenkins, Reference Jenkins2001). Expansion through colonization, rather than concentration through enlargement, apparently embodied the development strategies of nuragic settlements in the early phases; such a strategy, however, had to face the limitations of productive soil, and was thus bound to end. The expansion process determines, at some point between 1350–1100 bc, a saturation of all the available agricultural surface (Figure 3), and a process of contraction and concentration ensues.
The Time of the Crisis: Negotiating Collapse and Growth
The peak of nuragic expansion is followed by a stalemate, probably caused by the saturation of productive soil. The preconditions for a Malthusian catastrophe are met: the system has reached its carrying capacity, and there is apparently no chance to pursue old expansion strategies anymore; thus, catastrophe is inevitable, unless open conflict erupts or a new form of organization is adopted. The documented abandonment of several nuraghi between 1350 and 950 bc is often taken as a sign of impending collapse. Further evidence, however, suggests that the contraction process was not the only force at work during the crisis. Several pre-existing villages are in fact enlarged and new ones founded. Working out a plausible ratio between the concurrent processes of abandonment and enlargement is clearly the key to understanding the demographic trend of nuragic society at the time of the crisis: which process is dominant? Is demographic collapse to be expected, or balance, or even growth?
The solution to this problem is complicated by the elusive character of the material evidence for this period: while we can rely on structural characteristics to roughly date the construction of a given nuraghe, we cannot rely on anything other than stratigraphy to assess its phases of occupation, and the number of (published) excavations is currently no match for the amount of potential information. In other words, when addressing the nuragic crisis, one must deal with the scarce visibility of the archaeological evidence. Therefore, the discussion must rely on relatively small samples, on negative evidence, and, once again, on a high degree of generalization at the expense of local accuracy.
The period under scrutiny is set between 1350 bc (the beginning of the Recent Bronze Age) and 950 bc (the end of the Final Bronze Age/beginning of the Early Iron Age). Based on typological corpora, chronological syntheses, and extensive survey projects tested by excavation (Campus & Leonelli, Reference Campus and Leonelli2000; Gonzàlez Ruibal et al., Reference Gonzàlez Ruibal, Ruiz-Gàlvez Priego, Lòpez Jiménez and Torrez Ortiz2005; Depalmas, Reference Depalmas2009; Ialongo, Reference Ialongo2011), a sample of 105 nuraghi possessing some accurate definition of occupation phases was collected. All nuraghi are considered occupied at the beginning of the Recent Bronze Age, since clear signs of abandonment are never identified before that time. Of the original 105 nuraghi, seventy-two survive until the early phases of the Final Bronze Age (31 per cent loss) and fifty-four are still occupied in the Early Iron Age (49 per cent loss, 25 per cent against the previous phase). A substantial contraction of settlements seems indeed plausible, with almost one out of two nuraghi ‘lost’ between the Recent Bronze Age and the Early Iron Age.
The enlargement of villages is the second factor to be considered. Several villages are known to grow larger through the late Recent Bronze Age–Final Bronze Age, reaching their full extension in the Early Iron Age. The villages of Sant'Imbenia, Palmavera, Losa, Su Nuraxi, and Genna Maria are a few notable examples (Webster, Reference Webster1996); all these villages develop around multi-towered nuraghi that appear to occupy large productive areas (Figures 4–5), allowing them to support growing populations.
By relying on some extreme generalization, it is also possible to propose figures for the magnitude of the enlargement trend of villages in the course of the Late Bronze Age. The village of Su Nuraxi-Barumini (Lilliu, Reference Lilliu1955) is the only settlement for which such quantification is possible. The village plan was digitized, and the internal surface of the dwellings calculated (Figure 6). The village was built between 1350 and 1100 bc, around the pre-existing nuraghe (Figure 6A), increasing the dwelling surface by 451 per cent (Figure 6B), and was later enlarged, between 1100 and 950 bc, which amounts to an increase of 1047 per cent from the initial value (232 per cent from the previous phase) (Figure 6C). If the growth ratios of the village of Su Nuraxi are assumed to be a general indication of the whole picture of surviving settlements, it is possible to estimate roughly the degree of fluctuation of the overall dwelling area simply by multiplying the increase ratio of the inhabitable area by the decrease ratio of the number of nuraghi. The result, plotted against the duration of each archaeological phase, ideally approximates the degree of demographic fluctuation (Figure 7): the combined figures of contraction and enlargement support the notion of a slow but steady demographic increase, with a perfect exponential trend (Pearson's r = 1.00) and a rate of + 0.42 per cent per year. Despite all the conditions of a Malthusian catastrophe being apparently met, the available evidence does not show a substantial loss of population. On the contrary, it cannot be excluded that population growth continued to follow a normal exponential trend, although at a diminished rate.
Su Nuraxi (Barumini). Diachronic development of the village. The dwelling area is highlighted in white. A: Middle Bronze Age (c. 1500–1350 bc); B: Recent Bronze Age–early Final Bronze Age (c. 1350–1100 bc); C: late Final Bronze Age–Early Iron Age (c. 1100–950 bc) (redrawn after Lilliu Reference Lilliu1955).

Estimation of the growth of the dwelling area in Sardinia between 1350 and 950 bc. Figures obtained by multiplying the phase-by-phase increase ratio of the dwelling area of the village of Su Nuraxi by the phase-by-phase decrease ratio of the number of nuraghi. Pearson's r = 1.00. Data provided in the text.

The Aftermath: Recovery and Rise of Sanctuaries
By 950 bc the abandonment process came to an end, and villages apparently reached their maximum expansion. It is generally acknowledged that the contraction process leads to the formation of cohesive territorial compounds, more or less hierarchically organized (Vanzetti et al., Reference Vanzetti, Castangia, Depalmas, Ialongo, Leonelli, Perra and Usai2013), separated from each other by ‘buffer zones’. Sanctuaries would be preferentially located inside such buffer zones, and would serve as both ceremonial and political centres for ‘confederate’ compounds on their borders (Webster, Reference Webster1996, Reference Webster2015; Usai, Reference Usai2006; Ialongo, Reference Ialongo2013a). The spatial analysis provides support for the buffer zone model: by comparing the location of sanctuaries with the density of nuraghi per km2, it emerges that 15 sanctuaries out of 16 are located in extremely low-density areas (Figure 8). Sanctuaries then seem to escape the average logic of nuragic settlements: sanctuaries are built in scarcely populated, unproductive territories, probably inside those buffer zones or ‘no man's land’ (Webster, Reference Webster1996: 98) which formed as a consequence of the contraction process during the crisis. The map in Figure 9 represents the area of the ‘confederate’ sanctuary of Santa Vittoria, which is particularly fortunate in terms of the quantity and quality of the available documentation. The picture renders with some precision the ideal situation of bordering compounds at the onset of the first millennium bc (Figure 1D). Six major nuraghi are visible, in densely populated compounds, each with a surrounding village inhabited well into the Early Iron Age. In the compounds of Su Nuraxi (Figure 9.12) and Arrubiu (Figure 9.8), respectively, two and five nuraghi are abandoned before the Early Iron Age. Finally, the sanctuary of Santa Vittoria is located approximately in the middle of bordering compounds, in a low-density area. Interestingly, the sanctuary is built over a pre-existing village with an archaic nuraghe (Puddu, Reference Puddu1992). The construction of sanctuaries on top of pre-existing settlements is rather frequent. Outstanding cases are represented by Santa Vittoria, Monte S. Antonio (Ialongo, Reference Ialongo2011), Nurdòle (Fadda, Reference Fadda1991), and Sa Sedda ‘e sos Carros (Salis, Reference Salis2006) (Figure 10). In all these examples, the architectures of the sanctuary obliterate or incorporate pre-existing buildings, even nuraghi, that belong to villages that do not apparently have a specific cultic character. The investigation of the remains of pre-existing villages may provide clues about the contraction process that took place during the crisis, when ‘border villages’ located on poor soils and on the margin of cohesive compounds may have been abandoned, thus contributing to the demographic concentration in large villages and favouring the creation of buffer zones.
Frequency distribution of the occurrence of sanctuaries in areas with increasing densities of nuraghi.
GIS map of the territory of the sanctuary of S. Vittoria (Serri). Coloured symbols identify datable sites. The shapes used to illustrate the main nuraghi (2–3, 8, 10–12) are a schematization of the actual plans. In the background, the shaded area represents the density of nuraghi, obtained through kernel-density estimation. 1: S. Vittoria; 2: Is Paras; 3: Adoni; 4: Sutta ‘e Corongiu; 5: Sardajara; 6: Martingiana; 7: Gasoru; 8: Arrubiu; 9: Perda Utzei; 10: Piscu; 11: Su Mulinu; 12: Su Nuraxi; 13: Brunku Madugui.

Sanctuaries built on top of pre-existing villages. A: S. Vittoria; B: Monte S. Antonio; C: Sa Sedda ‘e sos Carros.

The Cost of Sustainable Development: Dissolution and Transformation of Social Ties
The analytical framework illustrated here offers a new perspective for understanding the crisis. The saturation of agricultural surface is likely to have represented an insurmountable limit to the former expansion model, based on the fission of small settlements; the refusal to give up traditional strategies would have probably led to open conflict over control of the resources, but the evidence available does not support this hypothesis (Depalmas, Reference Depalmas2006; Campus et al., Reference Campus, Leonelli and Lo Schiavo2010). Some kind of conflict, however, may well have occurred, at least in the form of political and social tensions: political, in that the stalemate of expansion strategies must have implied the negotiation of bordering territories; social, to the extent that the concentration of growing populations within enlarging villages must have involved the dissolution of former kinship rules that obliged cadet branches to leave the core settlement and found new communities. The stalemate ensuing from reaching the system's carrying capacity was twofold: on the one hand, the growing demographic trend could not be sustained anymore; on the other, the power structure of nuragic society could not reproduce itself. The abandonment of the fission strategy must have ultimately affected the social organization of communities, transforming its kinship structure and, consequently, its power relations.
The concentration of population in growing villages, in particular, must have been a determining factor in the transformation of the relations of production. During the expansion phase, settlements were apparently meant to remain relatively small. For the early stages, the evidence available supports the view of small, self-sufficient communities: until then, the limit imposed by the carrying capacity was easily avoided through the fission strategy. It is only after 1100 bc that the incipient hoarding phenomenon begins to highlight the development of a local metallurgy, which would, however, not assume the traits of a flourishing industry until the onset of the first millennium bc (Ialongo, Reference Ialongo2013a). The development of a nuragic metallurgy is not limited to craft production, but entails the increasing exploitation of Sardinian ores (Gale & Stos-Gale, Reference Gale, Stos-Gale and Balmuth1987; Begemann et al., Reference Begemann, Schmitt-Trecker, Pernicka and Lo Schiavo2001; Ling et al., Reference Ling, Stos-Gale, Grandin, Billström, Hjärthner-Holdar and Persson2014) and the growing investments in overseas trade (Gras, Reference Gras1985; Lo Schiavo & Ridgway, Reference Lo Schiavo, Ridgway, Lilliu, Ugas and Lai1987; Fundoni, Reference Fundoni2009; Milletti, Reference Milletti2012). Specialized activities are not limited to metallurgy: the rise of sanctuaries documents a huge improvement in architectural and engineering technology, unmatched in prehistoric Europe, with the construction, for example, of dry-stone interlocking pitched roofs and hydraulic facilities (Contu, Reference Contu1999).
The flourishing of Sardinian metallurgy and architecture is likely to be but the most visible correlate of a process of differentiation of the nuragic economy: miners, metallurgists, traders, and architects were not, to some extent at least, primarily engaged in staple production that had to be guaranteed; instead they operated within a rational distribution of labour among the whole community. Sustaining a relatively large number of labourers that were not self-sufficient would have been nearly impossible, and perhaps of little utility, in small segmentary communities; the concentration of the population into fewer but larger villages allowed for the differentiation of economic activities by optimizing the primary production with a strategy that avoided the diminishing returns ensuing from an overcrowded labour input (Webster, Reference Webster1990). This outcome was only possible for those territories with a sufficient carrying capacity—as the greater availability of productive soil for larger settlements would attest—and at the cost of a radical transformation of the traditional social structure.
It is in this altered social framework that the patron-client society hypothesized by Webster (Reference Webster1996) arose: a society in which the dissolution of rigid, vertical kinship ties, typical for lineage societies, would have paved the way for a form of accumulation of power based on the control of the production of prestige goods and specialized labour.
Conclusions
The nuragic crisis was a process of change, during which productive strategies and social structure had to be transformed to avoid a catastrophe. By the end of a 500-year-long growth, the core territories of the nuragic society faced an apparently insurmountable ecologic constraint: the saturation of productive soil. The nuragic case is listed among several human-induced crises that affected European societies between approximately 1200 and 1100 bc, for example in the terramare in northern Italy and in western Scandinavia. Apart from possible, slight changes in local conditions (e.g. Cremaschi et al., Reference Cremaschi, Pizzi and Valsecchi2006), there is no evidence of large-scale climatic change in the same time span that could provide a plausible explanation (e.g. Holzhauser et al., Reference Holzhauser, Magny and Zumbühl2005; Magny et al., Reference Magny, Peyron, Gauthier, Rouèche, Bordon, Chapron, Marguet, Pétrequin and Vannière2009). On the other hand, there is at least one trait shared by all such crises: they occurred at the end of long periods of demographic growth and territorial expansion.
‘For some human societies, stability (in the sense of peace and prosperity) is assured only by continued growth’ (Renfrew, Reference Renfrew, Renfrew and Cooke1979: 489). For nuragic Sardinia, it can be theorized that the population kept growing even during the crisis, though at a diminished rate. Growth is, in fact, the only constant: in terms of actual material production (i.e. of what was built and crafted before and after the crisis), the nuragic Iron Age has nothing in common with the early nuragic era, except for the enduring monuments of an idealized past (Blake, Reference Blake1998; Leonelli, Reference Leonelli2005). But what allowed the system to keep growing? The drawbacks of the crisis affected the whole society: simply put, the overall population lacked sustenance, and dominant groups could not reproduce their power structure. Perhaps this was enough to force the whole population to pursue a common objective; or, instead, socio-political conflict ensued and a new structure was created. Whatever the reason, the socio-economic system took a long time to adapt to the changed situation and, eventually, to recover; ‘peace and prosperity’ were achieved at the cost of a radical transformation of the structure of society.
Acknowledgements
I would like to thank Agnese Vacca and Andrea Cardarelli for stimulating discussions and useful advice, and Andrea Di Renzoni for tips on spatial analyses. Thanks also to the reviewers, whose comments greatly helped refine this article.


