


1. Introduction
US grain markets are impacted by information from a variety of sources. Government reports, such as those produced by the US Department of Agriculture (USDA), serve as one source of information in US grain markets, complementing a variety of private and public data on supply and demand fundamentals. Prior research has established that such reports can influence price movements (Adjemian, Reference Adjemian2012; Fiechter et al., Reference Fiechter, Kuethe, Langemeier and Mintert2025; Garcia et al., Reference Garcia, Irwin, Leuthold and Yang1997; Just, Reference Just1983; Massa et al., Reference Massa, Karali and Irwin2024; Mattos and Silveira, Reference Mattos and Silveira2016; Silveira et al., Reference Silveira, Silva, Mattos, Júnior and Capitani2025; Ying et al., Reference Ying, Chen and Dorfman2019). However, as policy discussions increasingly emphasize reducing government expenditure on data collection, questions have emerged about the ongoing necessity of publicly funded market information (Just, Reference Just1983; Salin et al., Reference Salin, Thurow, Smith and Elmer1998).
Increasing availability of privately produced market data also raises concerns related to data access, quality, and consistency (Salin et al., Reference Salin, Thurow, Smith and Elmer1998). According to Gouel (Reference Gouel2020), private forecasts accounted for two-thirds of the unexpected variation in soybean stock levels between 1973 and 2016, while public USDA reports contributed only $7 million of the $20 million in estimated welfare gains from harvest-related information. While all potential benefits of public information were not included in this calculation, findings such as these raise concerns about the role of public reports in an evolving information landscape. Nevertheless, studies indicate that government reports continue to provide value, in part because market participants perceive them as more neutral, transparent, and dependable than private-sector forecasts (Garcia et al., Reference Garcia, Irwin, Leuthold and Yang1997; Salin et al., Reference Salin, Thurow, Smith and Elmer1998; Ying et al., Reference Ying, Chen and Dorfman2019).
Historical estimates suggest that inadequate data on domestic wheat markets cost the US economy approximately $64 million annually in 1975 dollars, with the magnitude of losses varying by data accuracy and forecasting efficiency (Bradford and Kelejian, Reference Bradford and Kelejian1978). Similarly, Hayami and Peterson (Reference Hayami and Peterson1972) found that the social returns to agricultural data collection significantly exceeded the associated costs, even after accounting for potential errors in estimated supply and demand elasticities. Although the precise value of government reports remains difficult to quantify, recent evidence indicates that they continue to be influential and may be growing in importance (Isengildina-Massa et al., Reference Isengildina-Massa, Cao, Karali, Irwin, Adjemian and Johansson2021; Salin et al., Reference Salin, Thurow, Smith and Elmer1998; Ying et al., Reference Ying, Chen and Dorfman2019)
The World Agricultural Supply and Demand Estimates (WASDE) report is one source of market information and is published monthly by the USDA. Produced by the Interagency Commodity Estimates Committees, this report integrates data from USDA agencies as well as other domestic and international official sources (USDA, 2025). Ending stocks forecasts are included within this report and estimate the quantity of a given commodity that is expected to remain at the end of the year. These forecasts incorporate expectations for production, imports, exports, and domestic use, making it a comprehensive measure of supply and demand information. We focus on two categories of ending stocks reported for each commodity, one for the USA and another for the worldwide total.
At any given time, the market price for each commodity reflects aggregate expectations about fundamental conditions, based upon currently available information. For the period just prior to a WASDE release, a reasonable proxy for these expectations is some combination of private analyst forecasts because they are made available to several days in advance. While individual forecasts vary in accuracy, the average or median forecast is often relied on by market participants (Bradford and Kelejian, Reference Bradford and Kelejian1978). Upon report release, new information is introduced into the market that deviates from prior expectations. These information surprises have been shown to trigger price adjustments (McKenzie and Ke, Reference McKenzie and Ke2022; Silveira et al., Reference Silveira, Silva, Mattos, Júnior and Capitani2025), and increase basis and price risk immediately following the report’s release (McKenzie and Singh, Reference McKenzie and Singh2011). Market response to such surprises can be observed in intraday trading patterns, including heightened volatility and shifts in trading volume (Adjemian and Irwin, Reference Adjemian and Irwin2018; Kaufman, Reference Kaufman2013; Silveira et al., Reference Silveira, Silva, Mattos, Júnior and Capitani2025; Wang et al., Reference Wang, Garcia and Irwin2014). Throughout this study, we will frequently refer to the difference between analyst forecasts and WASDE predictions as an information “surprise” (Colling and Irwin, Reference Colling and Irwin1990; Pearce and Roley, Reference Pearce and Roley1984).
Industry participants such as farmers, grain merchandisers, speculators, and policymakers are impacted by this surprise. They can rely on public and private information sources to aid in the decision-making process. A farmer will look for opportunities to secure prices through hedging practices, while a grain merchandiser will look to lock in a strong basis position. Others that rely on these markets for production inputs, such as feedlots, will attempt to secure lower prices, and a policymaker will be concerned with the efficiency of policies aimed at improved market stability and efficiency. Additionally, speculators will be looking for information and patterns to trade on. Each of these parties’ goals are more likely to be met when price-driving factors, such as unanticipated information, are better understood.
US involvement in international trade suggests that not just unanticipated US ending stocks information but also unanticipated world ending stocks information impacts the US market. Interruptions in trade relationships may shift the relative importance of US and World ending stocks information. An example of this is the 2018 US–China trade war. Prior research suggests that the impact of USDA reports on some soybean futures was weakened during this dispute (Hu and Mallory, Reference Hu and Mallory2025). While previous literature explores the impact of US supply information, we aim to contrast it with the impact of world supply information. This paper tests whether US and world ending stocks data from the WASDE report have statistically different impacts on US corn and soybean futures markets.
Implications of this research include an improved ability for market participants to make informed marketing, trading, and hedging decisions. Hedgers will be able to better protect themselves by understanding the importance of what and when they hedge. Additionally, policymakers can more efficiently allocate resources for data collection programs that impact price discovery. Acknowledging differences in the value of US and World information sources will allow market participants to prioritize information based upon its relevance to their market. Speculators can prioritize this information and make trading decisions based upon it.
2. Data and methods
This study compiles data on US corn and soybean markets from 2013 to 2023 using three primary sources: the WASDE reports, Bloomberg, and the Chicago Mercantile Exchange (CME). From these, we collect monthly median analyst forecasts for ending stocks (Bloomberg), actual WASDE ending stocks estimates (USDA), and nearby futures prices and volumes (CME).
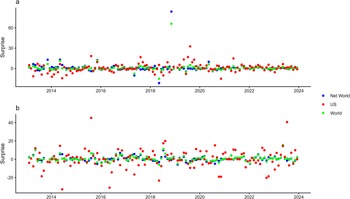
Private analyst forecasts are released to the public several days prior to a WASDE release date. Because these analyst forecasts are widely used across the industry, it is reasonable to assume that they capture market expectations of ending stocks prior to the public release of the WASDE. And in turn, any forecast difference between a WASDE projection and the average analyst forecast may be thought of as unanticipated ending stocks information with potential to move market prices. To mitigate the impact of extreme values within analyst forecasts, we used median analyst predictions rather than the mean. Analyst forecast errors or surprises were calculated as the percentage difference between WASDE estimates and median analyst forecasts, creating two explanatory variables: US Surprise and World Surprise (Figure 1). These represent the magnitude and direction of previously unanticipated information revealed to the market by WASDE reports. For example, a value of 1 in the US Surprise variable indicates that the WASDE forecasted US ending stocks to be 1% higher than the median analyst expectation. It is assumed that no other factors systematically impact these markets on WASDE release dates. This assumes that information is entering the market at release. To validate this assumption, we examined futures price changes from the close of the previous day to noon on the day of the report’s release using our gross model 1 equation. These results, included in the appendix, find no statistically significant relationship between the surprise variables and price changes, confirming that the surprise variables truly reflect new information.
(a) Corn surprise, (b) soy surprise.

Figure 1. Long description
Two scatter plots illustrate surprise values for corn and soy markets over the period from 2014 to 2024. The x-axis represents the years, while the y-axis represents the surprise values. The data points are color-coded: blue for Net World, red for US, and green for World. In both plots, the data points are scattered around the zero line, indicating fluctuations in surprise values over time. The corn surprise plot (a) shows a few outliers with higher surprise values around 2018 and 2020. The soy surprise plot (b) also displays some outliers, particularly around 2018 and 2022. The overall trend in both plots suggests that surprise values generally hover around zero, with occasional significant deviations. All values are approximated.
After constructing the US and World Surprise variables, we look to export dynamics, which may influence how markets respond to world ending stocks information. Specifically, we introduce two measures for US exports: ${\rm US\ Share\ of\ World\ Exports} = {{ US\ Exports} \over { World\ Exports}}$ ${\rm Percent\ of\ US\ Production\ Exported} = {{ US\ Exports} \over { US\ Production}}$
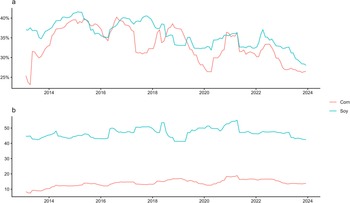
These variables allow us to examine whether the US role in global trade influences how market participants respond to unanticipated world ending stocks information from WASDE reports. The US share of world exports captures the country’s world market influence, while the percentage of US production exported reflects its exposure to international demand. Both metrics help to assess how trade intensity shapes market responses to world ending stocks information. Variations in these two export share measurements are shown in Figure 2.
(a) US share of exports, (b) percent of production exported.
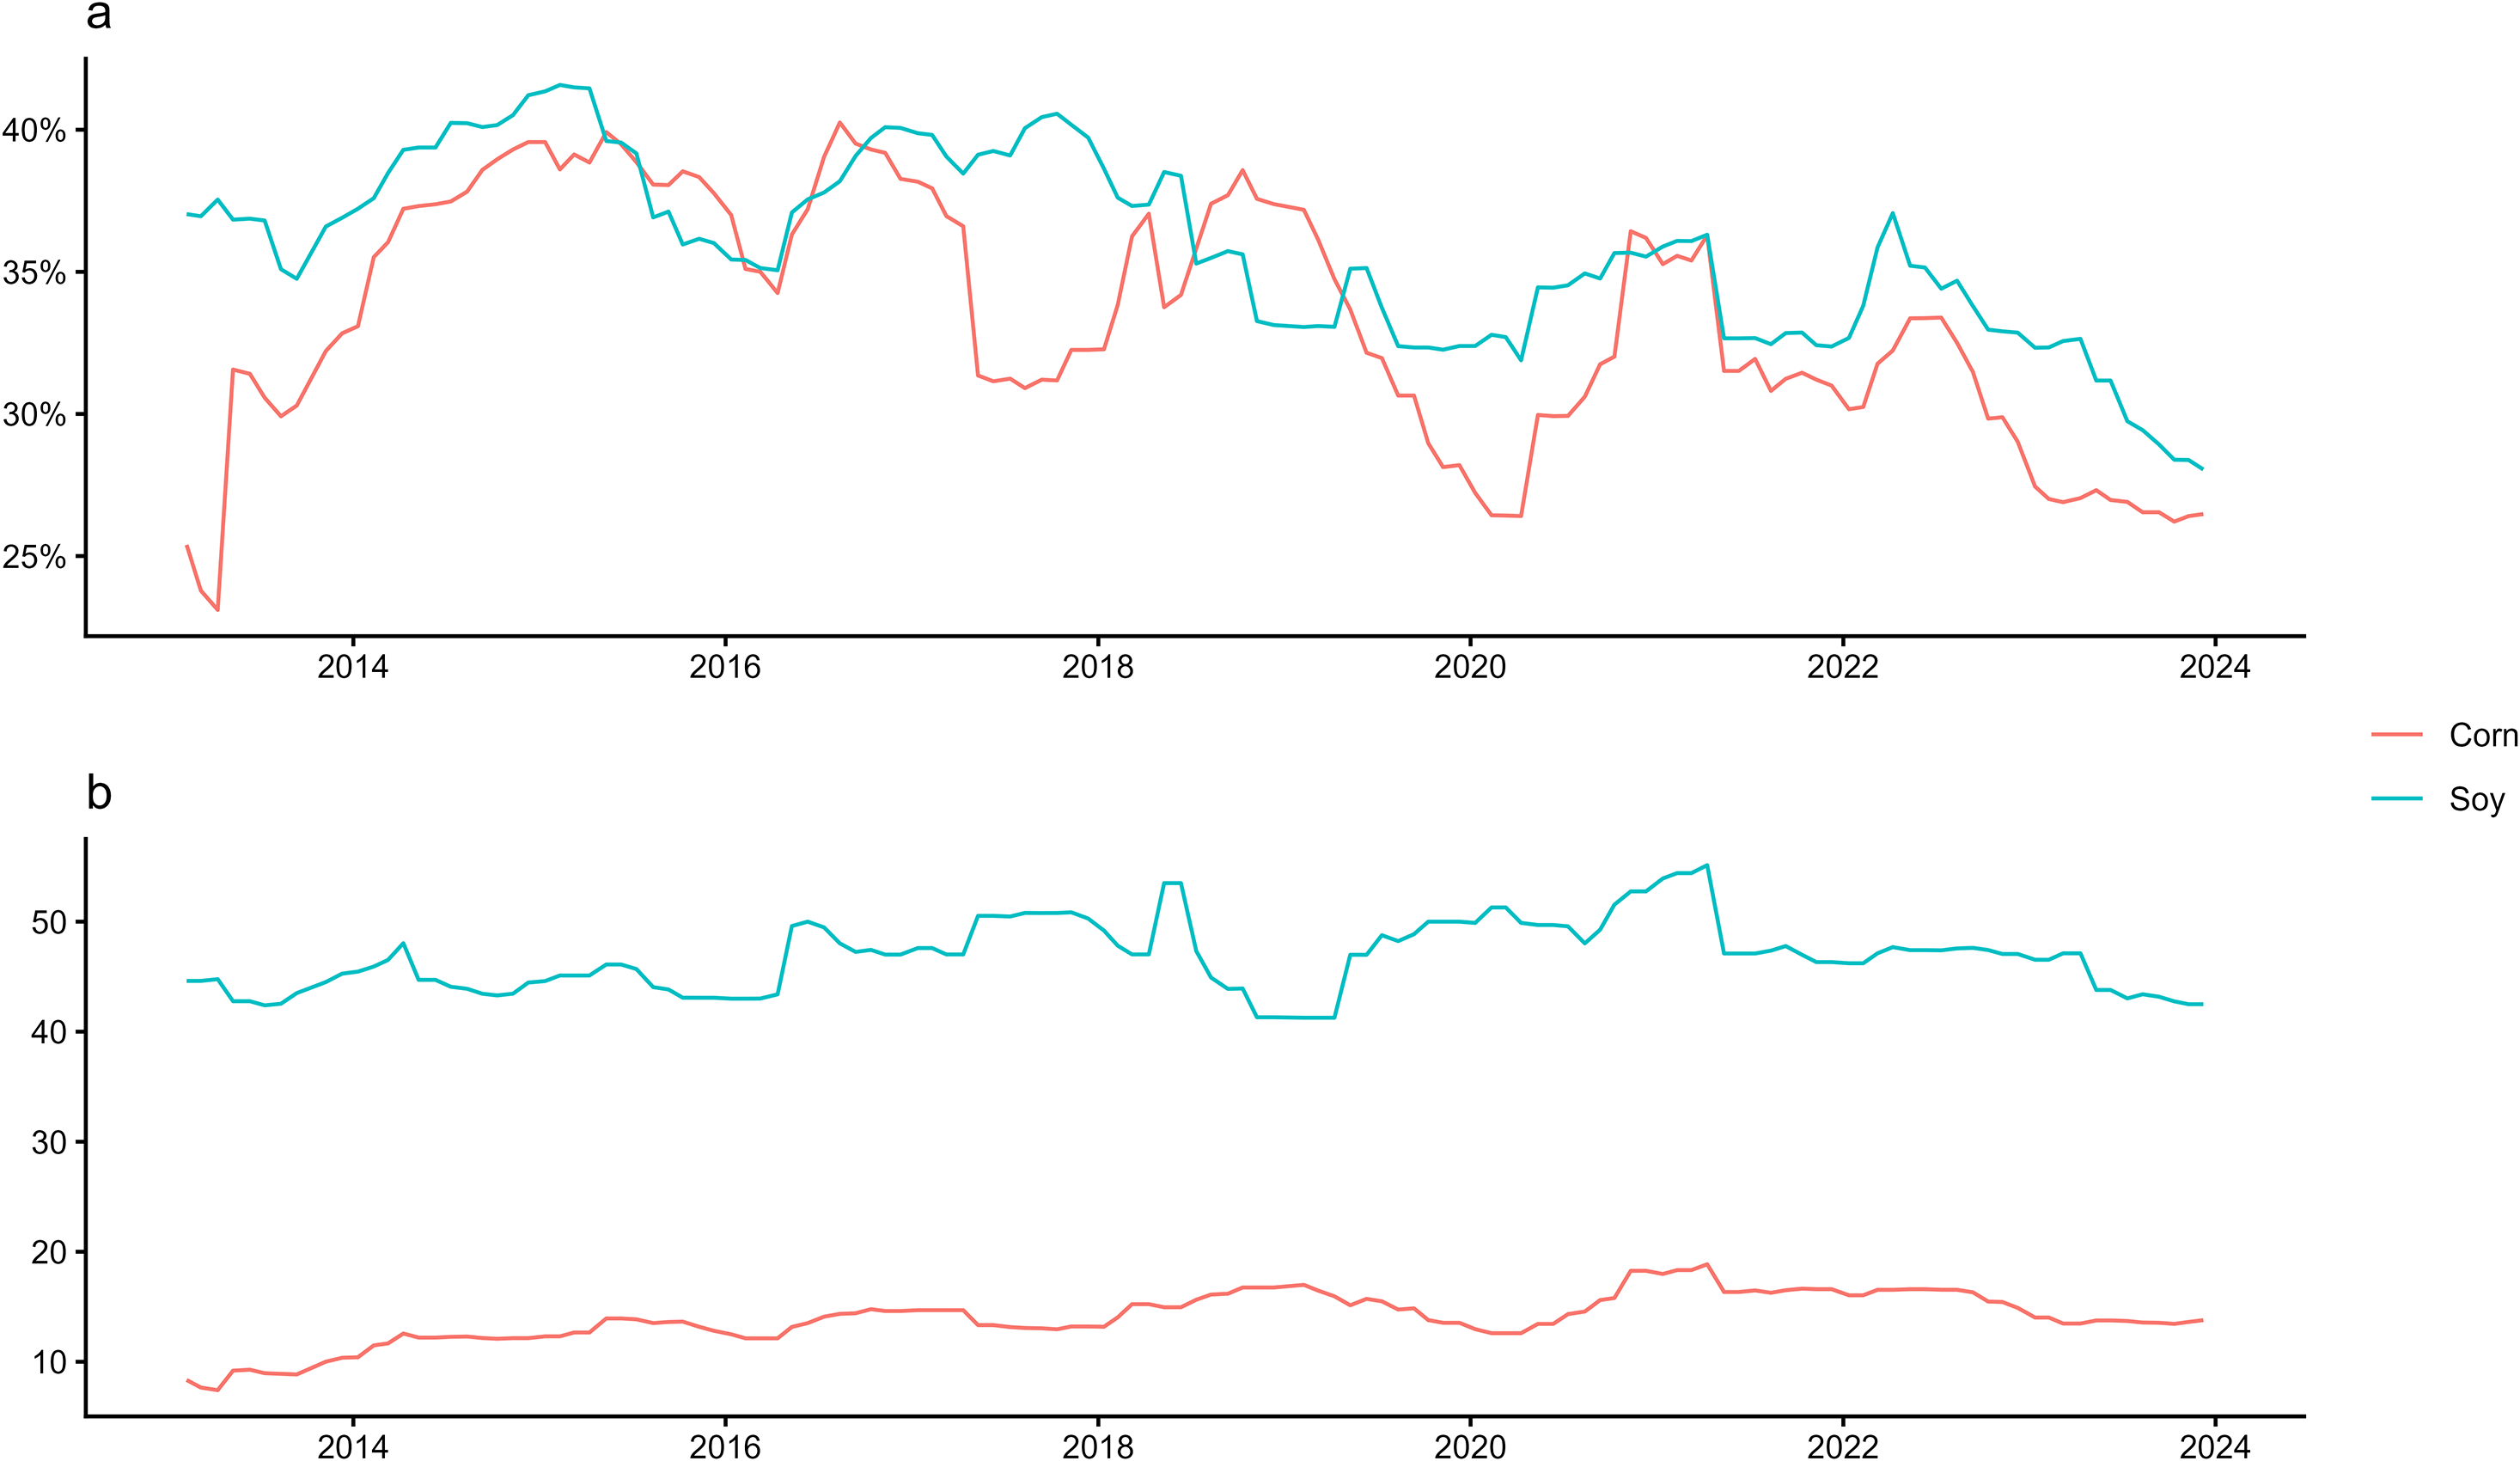
Figure 2. Long description
The image contains two line graphs. The first graph, labeled (a), shows the US share of exports for corn and soy from 2014 to 2024. The x-axis represents the years, while the y-axis represents the percentage share. The red line represents corn, and the blue line represents soy. The second graph, labeled (b), shows the percent of production exported for corn and soy from 2014 to 2024. The x-axis represents the years, while the y-axis represents the percentage of production exported. The blue line represents soy, and the red line represents corn. Both graphs illustrate trends and fluctuations in the US share of exports and the percent of production exported over the specified period.
Given that the WASDE report is released at 11am central time between the 8th and the 12th calendar day of each month, this study treats each release as a separate event. This process yields 129 monthly observations. To capture any immediate reactions to the release, we compute the percentage price change from noon to close for the most actively traded nearby futures contract, which is identified based upon trading volume from the close of the previous day to the close on the day of the WASDE release. We also estimated models based upon a close-to-close price change as a robustness check. These results are included within Appendix 1 as differences in the results were minimal.
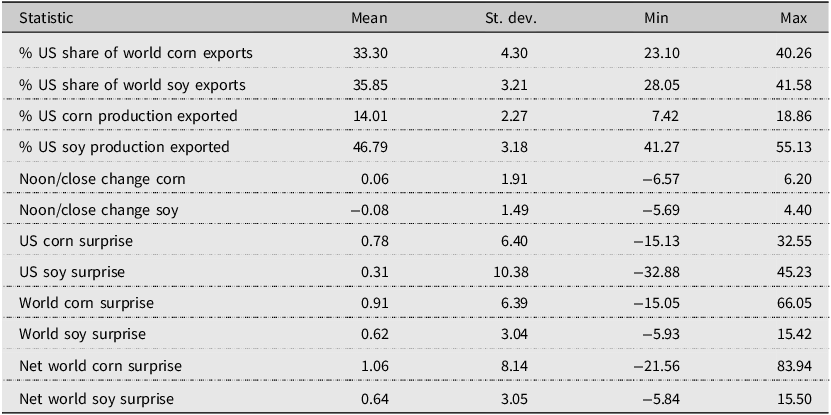
Table 1 provides descriptive statistics for US shares of world exports and exported production, as well as futures price reactions and surprises by commodity. In addition, we show Net World Surprise measures by commodity, which is calculated by excluding the US portion of world ending stocks projections from total world projections.
Summary statistics

Table 1. Long description
The table presents summary statistics on various metrics related to US shares of world exports and production, futures price reactions, and surprises by commodity. It includes data on the percentage US share of world corn and soy exports, the percentage of US corn and soy production that is exported, and the noon/close change for both corn and soy. Additionally, it provides information on US and world surprises for corn and soy, as well as net world surprises for these commodities. The table is structured with columns for the statistic name, mean, standard deviation, minimum, and maximum values. Notable trends include the relatively high percentage of US soy production that is exported compared to corn, and the significant variability in the US and world surprises for both commodities.
Across all surprise variables, mean values are close to zero, ranging from 0.31% to 1.06%. This is consistent with the idea that forecasts are unbiased over time. US Soy Surprise shows the greatest variability with a standard deviation of 10.38, nearly double the 6.4 standard deviation of US Corn Surprise. World Soy and Net World Soy Surprise showed the least variability with standard deviations of 3.04 and 3.05, respectively. The lower variability in World Surprise relative to US Surprise should be cautiously interpreted as world ending stocks represent a substantially larger absolute quantity than US ending stocks. A given percentage difference in a given World Surprise variable reflects a considerably larger discrepancy in terms of bushels than the same difference for US Surprise variables. The wide range within surprise variables highlights potential for large unanticipated information events, specifically within the soybean market where the US Soy Surprise ranges from −32.88% to 45.23%. Given the construction of the two variables, World Surprise and Net World Surprise are highly correlated, with Pearson correlation coefficients of 0.975 for corn and 0.917 for soybeans. Export exposure for the USA averaged 33.3% of world corn exports and 35.85% of world soybean exports over the same period. Notably, the US exports an average of 46.79% of soybeans produced compared to just 14.01% of corn production. This indicates that the US soybean market experiences substantially greater exposure to international demand. Both commodities experience price changes centered near zero on WASDE release days with an average of 0.06% for corn and −0.08% for soybeans. Although price changes are centered near zero, standard deviations of 1.91 for corn and 1.49 for soybeans, along with ranges exceeding 5% confirm that releases can trigger price movements.
Initially, Ordinary Least Squares models, which are included in Appendix 1, were estimated. However, due to expected correlation within the error term, we employ Seemingly Unrelated Regressions (SUR). As corn and soybeans are grown in many of the same areas, we expect that some factors, such as weather, which affect the ending stocks of one commodity, would also impact the other commodity. As the commodities can be grown on the same land, it is also reasonable to say that expectations for one commodity may impact how much land is used in the production of the other. Consequently, we expect that there is some cross price elasticity of supply between these two commodities.
Six SUR models are implemented in a pairwise manner to explain these price changes with the intercept constrained to be zero, which assumes that in the absence of new ending stocks information, average futures price reactions will be zero. In three models, we use the full WASDE world ending stocks forecast (including the US component) as the World Surprise variable, which we refer to as “gross models.” In the remaining three, we substitute the World Surprise variable with the Net World Surprise variable.
Equation 3 illustrates the basic model (model 1) implemented where the ΔPi represents the percent change in the nearby futures contract price on WASDE release day and ϵ i is the error term. Because all variables are expressed in percentage terms, the coefficients β 1 and β 2 can be interpreted as the expected percentage price change resulting from a 1% difference between WASDE estimates and analyst forecasts. While β 1 captures the price response to US ending stocks information, β 2 captures the response to world ending stocks information. $ \Delta P_{i}=\beta _{1}US\,\,\textit{Surprise}_{i}+\beta _{2}\textit{World}\,\,\textit{Surprise}_{i}+\varepsilon _{i}$
To account for the potential influence of US export exposure, we include an interaction term between World Surprise and the export share measure (Equation 4). Models created with this equation include an interaction term coefficient β 3 which captures how US trade impacts the response of the market to new world ending stocks information. It is expected that a higher portion of US exports would result in increased World Surprise importance due to additional exposure to Global Markets. To examine how US trade exposure impacts market responses to world ending stock information, we interact World Surprise with two export share measures defined in Equations (1) and (2), forming the basis for Models 2 and 3 (Figure 2). $\Delta P_i = \beta_1 {\rm US\ Surprise}_i + \beta_2 {World\ \rm Surprise}_i + \beta_3 ({World\ \rm Surprise}_i)({ Export\ \rm Share}_i) + \varepsilon_i$
These models estimate coefficients that quantify the price response to the unanticipated information captured by the US and World Surprise variables. To contextualize the estimated coefficients, we multiply them by the average absolute value of the forecast errors (Surprise) to approximate the typical price response to a WASDE report. This allows us to estimate the average price change experienced after the release of the WASDE report each month. Within this study, focus is placed on absolute price changes as a measure of how market price expectations shift in response to unanticipated information. While implied volatility captures market expectations of futures price variability over the life of an options contract, as explored in recent works, absolute price changes reflect the immediate revision in price following a report’s release. The greater the surprise element of the report the larger the absolute price change and the larger the reductions in implied volatility (Yang and McKenzie, Reference Yang and McKenzie2025).
3. Results
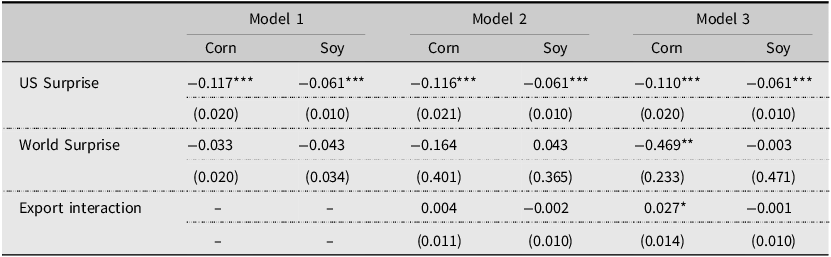
Initial model 1 results reported that β 1 was highly statistically significant for both corn and soybeans with a negative coefficient, indicating that higher ending stocks result in a price decrease. The corn market was found to have a US Surprise coefficient of −0.117 at a 99% confidence interval, which indicates that when the WASDE reports 1% higher ending stocks than predicted by analysts, a 0.117% decrease in corn futures prices would be expected. This change is what we would expect based upon the principles of supply and demand. The soybean market demonstrated a smaller change in price of −0.061%. Unexpectedly, World Surprise, β 2 was proven to not be statistically significant for either commodity while using this model. However, the resulting coefficients did report the negative relationship that we would expect, indicating that news of greater ending stocks will result in a decrease in the given commodity’s price. Though not statistically significant, the coefficients for World Surprise were lower in magnitude than those for US Surprise.
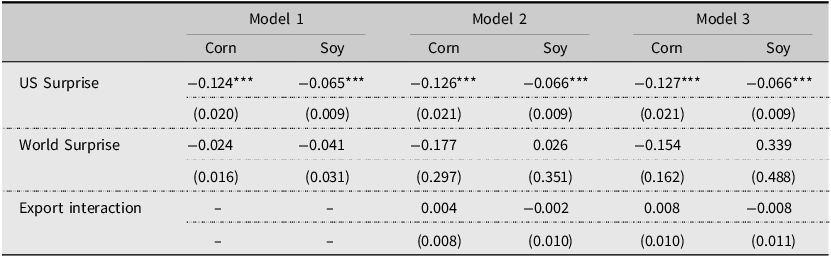
When using the same model and the Net Surprise variables, we find that the impact of US and World Surprise both increase slightly in magnitude from −0.117 to −0.124 for corn and from −0.061 to −0.065 for soybeans. Our US Surprise variable continues to be the only statistically significant variable. We also find that our standard errors decrease overall when utilizing the Net World Surprise measurement in place of World Surprise. Results are shown in Tables 2 and 3.
Gross SUR models
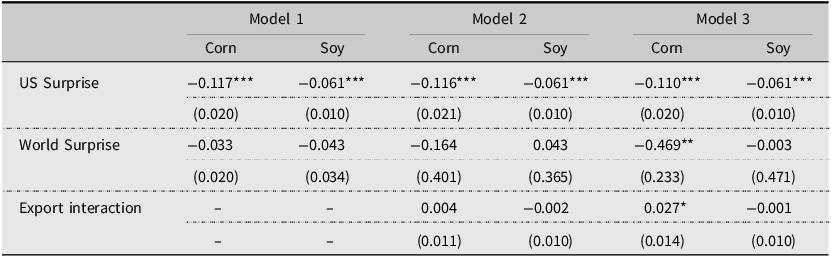
Table 2. Long description
The table presents data on the impact of US and World Surprise on corn and soybeans across three models. It includes three columns for each model, with rows for US Surprise, World Surprise, and Export interaction. The US Surprise values for corn and soybeans are statistically significant across all models, with values ranging from -0.117 to -0.124 for corn and -0.061 to -0.065 for soybeans. World Surprise values vary more significantly, with notable changes in magnitude and statistical significance across the models. The Export interaction values are only present in Models 2 and 3, with minimal impact on both corn and soybeans. The table highlights the consistent significance of the US Surprise variable and the reduction in standard errors when using the Net World Surprise measurement.
*p < 0.1, **p < 0.05, ***p < 0.01.
Net SUR models
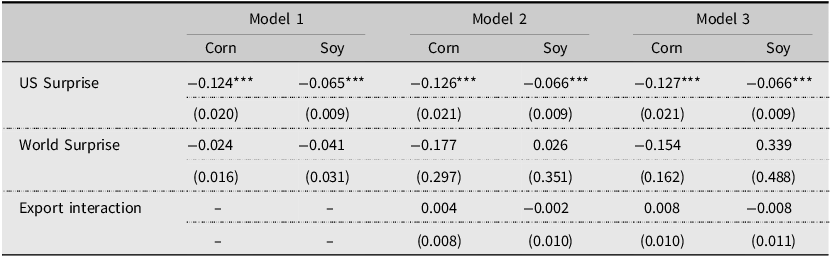
Table 3. Long description
The table presents data on the impact of US and World Surprise on corn and soybean yields across three models. It consists of three rows and six columns. The rows are labeled as US Surprise, World Surprise, and Export interaction. The columns are labeled as Model 1 Corn, Model 1 Soy, Model 2 Corn, Model 2 Soy, Model 3 Corn, and Model 3 Soy. Each cell contains numerical values representing the impact, with standard errors in parentheses. Notable trends include the consistent statistical significance of the US Surprise variable across all models, with values ranging from -0.124 to -0.127 for corn and -0.065 to -0.066 for soybeans. The World Surprise variable shows varying impacts, with some positive and negative values, and is not statistically significant. The Export interaction variable is only present in Models 2 and 3, with values close to zero.
*p < 0.1, **p < 0.05, ***p < 0.01.
Adding in the interaction variable β 3 to address the role of exports using equation (1) provided the model 2 results, which are also shown in Tables 2 and 3. These models continued to show that the US Surprise factor β 1 was highly significant for both commodities and resulted in the negative coefficient we expected. Similar to the previous model, β 2 was found to be insignificant. β 3 was also found to be statistically insignificant. While the insignificant coefficients limit conclusions about directionality, the corn market demonstrated a counterintuitive relationship where additional export share would reduce the importance of unanticipated world ending stocks information when greater export exposure was expected to increase the response to world ending stocks surprises.
As was the case with model 1, the use of Net World Surprise increased the impact of our US Surprise variable. However, the impact of using Net World Surprise vs World Surprise within our model has a mixed effect depending upon the commodity. The US corn market demonstrates an increase in the magnitude of the impact of World Surprises and an unchanged impact of our interaction variable, with less deviation in both cases. Meanwhile, the soybean market demonstrates the opposite impact for World Surprise in model 2 where we see the counterintuitive coefficient of 0.043 decrease to 0.026. Our coefficient is counterintuitive as a positive coefficient implies that higher ending stocks are associated with higher prices, which contradicts supply and demand expectations. This difference in response may be linked to the export share measurement.
Model 3 results are interesting, as within Table 2, we find that both β 2 and β 3 are slightly statistically significant for the US corn market but not within the soybean market. This result’s significance is lost when Net World Surprise is used in place of the basic World Surprise measurement as shown in Table 3.
Across all models, a 1% increase in US ending stocks surprise was associated with a −0.110 to −0.127% change in the corn futures price and a −0.061 to −0.066% change in soybean futures prices. Additionally, each of these models, excluding gross corn model 3, demonstrated that the World Surprise variable is not statistically significant for these commodities. Even in that case, the coefficient was not as statistically significant as that of US Surprise. However, the direction of each of the coefficients was what we would expect, and the US Surprise variable was found to be highly significant. We also found that the marginal impact of US ending stocks information on corn was greater than the marginal impact in the soybean market. Consequently, we would say that those involved in the corn markets should be especially aware of the impact that unanticipated US ending stocks information may have on prices. This difference in the value of US Surprise could be related to the share of exports that originate from the USA in these two markets.
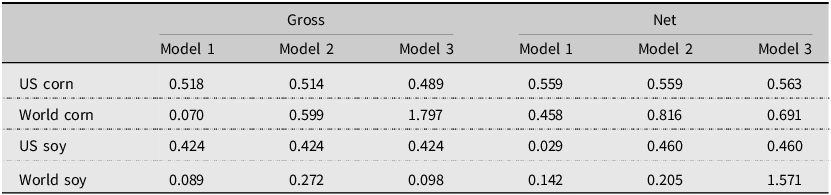
While the marginal effects of world and US ending stocks information are of importance, it is also important to put things in context by looking at the average total effects shown in Table 4. By looking at the average total effect of unanticipated information, we can get an estimate of the price change that will be experienced after the WASDE is released each month. This is important as the total effect is easier to interpret and apply to operations. In the case of model 1, we can see that the US Surprise typically would be associated with an average 0.518% change in the price of corn and 0.424% change in soy prices, while the World Surprise only contributed to a change of 0.07 and 0.089, respectively, based upon our gross World Surprise measurement. Looking at our Net World Surprise model, we find greater total impacts from both variables for the corn market and a mixed impact for soybeans where the magnitude of the total effect decreases for US ending stocks surprises from 0.424 to 0.029 and increases for World ending stocks surprises from 0.089 to 0.142.
Average total effects
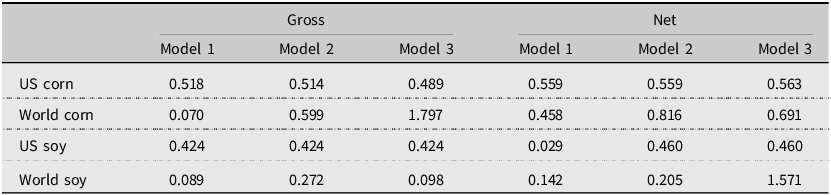
Table 4. Long description
The table presents the average total effects of unanticipated information on corn and soy prices across different models and regions. It includes data for US corn, world corn, US soy, and world soy, with three models for both gross and net effects. The table has four rows and six columns, with headers for Model 1, Model 2, and Model 3 under both Gross and Net categories. Notable trends include the significant impact of US corn surprises on corn prices, with Model 1 showing a 0.518% change, and the mixed impact on soy prices, where US ending stocks surprises decrease from 0.424 to 0.029 in the Net World Surprise model. World corn surprises show a greater total impact in the Net World Surprise model, increasing from 0.07 to 0.458. The data highlights the varying influences of US and world ending stocks information on commodity prices.
Our gross model 2 average total effects, which are reported in Table 4, show that unanticipated US information was associated with an average price change of 0.514% in the corn market and a change of 0.424% in the soybean market. Adding the interaction variable resulted in an increased average total impact of World Surprise under Gross and Net World Surprise measurements.
Several of our model specifications suggest that World Surprise will have a larger impact than US Surprise will on the US futures price based upon the average total effects. However, this is to be interpreted with caution as these effects were not robust across models. The large total effects reflect greater variability in this coefficient rather than a more influential role in price discovery. Future research could identify additional sources of heterogeneity in the impact of world ending stocks information, as some of the substantial variability may not be random. In other words, there may be conditions under which the World Surprise does impact futures prices, while otherwise it does not.
4. Discussion
Our results show that US ending stocks have a statistically significant effect on corn and soybean futures prices, whereas world ending stocks do not. This suggests that the US market is either more responsive to domestic ending stocks information than to world ending stocks information or that the market perceives the WASDE report as a credible source of US information but not as a credible source of world information. Although the coefficient for world ending stocks carries the expected sign most of the time, indicating that higher ending stocks correspond with lower prices, its lack of statistical significance implies limited market sensitivity to this information during the sample period. This aligns with economic theory, which predicts downward price pressure in response to increased supply levels. However, weak statistical support may suggest that world signals are too noisy or lack credibility to drive consistent price responses.
This pattern holds consistently across all models used in the analysis. In each case, increases in US ending stocks were associated with a decline in nearby futures prices, confirming unanticipated US ending stocks information is a driver of market behavior. These findings are consistent with prior literature which explore the impact of government reports (Adjemian and Irwin, Reference Adjemian and Irwin2018; Garcia et al., Reference Garcia, Irwin, Leuthold and Yang1997; Massa et al., Reference Massa, Karali and Irwin2024; McKenzie and Singh, Reference McKenzie and Singh2011). Importantly, the significance of the US Surprise variable reinforces the continued relevance of government-provided information. This result implies that the WASDE release provides new, unanticipated data that moves prices.
Although World Surprise was found to be statistically insignificant, this finding should not be interpreted as evidence that global information is irrelevant. It may instead reflect limitations in the dataset or noise in the World Surprise data. Additionally, WASDE’s world ending stocks projections may contain greater uncertainty as supply and demand forces from various nations are required to construct this estimate (Gouel, Reference Gouel2020). This may make world data more prone to measurement errors that reduce credibility with traders. If market participants don’t fully trust a measurement, they are unlikely to fully incorporate them into prices.
Similar results were reported by Sumner and Mueller (Reference Sumner and Mueller1989), who focused on monthly price responses from 1961–82 for the months July–November. While direct comparisons cannot be made, they found daily price changes of a similar magnitude to our coefficients. They found average daily price changes ranging from −0.11% to 0.13%. Each of our coefficients falls within that range. Since the mean surprise values are less than 1% on average, our findings complement this prior research. Arnade and Hoffman (Reference Arnade and Hoffmann.d.) found that it would take a 100% change in corn production forecasts to shift futures prices by 2–4%. Our results imply that relatively smaller forecast errors in ending stocks can produce comparable or larger market movements.
Implications of this research are noteworthy. First, US corn futures prices are more sensitive to changes in ending stocks forecasts than soybean prices. This suggests that the US corn market will respond more strongly to unanticipated ending stocks information and may result in increased speculative activity within the corn market around WASDE release dates. Farmers and agribusinesses can use this information when developing hedging strategies as well. For example, a corn producer may choose to hedge a larger share of their expected yield prior to the WASDE release due to the higher sensitivity of corn prices to new information.
Similarly, consumers of commodities, such as feedlots and food processors, may benefit from closely monitoring volatility to time purchases more effectively. Grain elevators may also find this information helpful as more volatile futures prices could result in a wider basis. Wider basis movements can affect storage, marketing, and procurement decisions across the supply chain. These insights can also inform decisions by policymakers, who may desire to allocate more resources toward accurate data collection in markets like corn, which are more sensitive to new information. A lack of accurate information will result in greater gains/losses within more responsive markets. A policymaker may desire to put more resources into data collection in corn markets than in soybean markets.
Traders and speculators will also be able to use this information. When world ending stock projections are off a speculator would choose not to take a position in the market due to the lack of statistical power associated with that coefficient. However, when US ending stock information is off a speculator would choose to take a position since the impact of that coefficient is found to be statistically significant.
The presence of a stronger and more consistent market reaction to US ending stocks information reinforces the importance of government-provided information sources. Private firms, particularly those operating on a global scale, may not be incentivized to provide detailed, accurate domestic information (Just, Reference Just1983). If their focus leans toward international trends, it may leave gaps in US specific data. This may be a disadvantage to domestic producers who rely heavily on accurate and timely domestic market data and trust government sources more than private ones (Garcia et al., Reference Garcia, Irwin, Leuthold and Yang1997; Ying et al., Reference Ying, Chen and Dorfman2019). The disproportionate influence of information sources highlights the need for accurate data collection and efficient dissemination practices. Inaccurate information can distort market expectations and may lead to economic inefficiencies which exceed those estimated by Bradford and Kelejian (Reference Bradford and Kelejian1978).
These findings also have implications surrounding the global grain market and the law of one price in the context of international trade theory. Under the law of one price, we would assume that unanticipated changes in world ending stocks forecasts would have a measurable impact on US futures prices, which discover world as well as domestic US prices. This is especially true for commodities with significant international trade exposure. The limited response to world ending stocks surprises observed in this study suggests that price discovery in the USA for corn and soybean futures, at least in the short run, is primarily driven by domestic forecasts. Factors such as trade friction, transportation costs, policy uncertainty, and heterogeneity in production conditions may impact how quickly global supply information is incorporated.
Our findings are subject to limitations. The lack of World Surprise and interaction term significance may reflect insufficient statistical power due to a small number of observations (129). Market noise and shocks to the market could also obscure real effects. Additionally, world ending stocks estimates may be less precise compared to US estimates as information is aggregated from across numerous countries with varying data quality. If market participants perceive world estimates to be unreliable, they may be less likely to react to them which reduces the observed price response.
5. Conclusion
Price discovery processes are important to industry participants such as farmers, grain merchandisers, and policymakers that rely upon both public and private information sources to make informed decisions. This study examines the relative impact of US and world ending stocks information on US corn and soybean futures markets using SUR analysis. US ending stocks information (US Surprise) was found to be statistically significant in each model. However, world ending stocks information (World Surprise) and our interaction variable (Export Share) were both found to be statistically insignificant. We also found that US corn futures prices are more sensitive to changes in ending stocks forecasts than soybean futures prices. These findings suggest either that US information may play a more influential role in price discovery for US markets or that the market does not perceive the USDA to be a very credible source of world ending stocks information. This can help farmers and agribusinesses as they develop hedging strategies. Policymakers may also consider reallocating data collection resources to prioritize more impactful variables.
It is possible that additional research, including more data and observations, would provide better results as our dataset consisted of only 129 observations. As the practice of halting commodity futures trading during scheduled report releases was eliminated in 2012, the price change methodology used in this study is not applicable to pre-2013 data, consequently additional measures must be taken to include observations prior to 2013. Additional benefits could also come through further research related to different commodities and the exploration of the impact of public information provided by the governments of countries that play a dominant role within these markets.
Supplementary material
The supplementary material for this article can be found at https://doi.org/10.1017/aae.2026.10047.
Data availability statement
The data used in this analysis is publicly available and will be freely shared by the authors upon request.
Author contribution
Conceptualization: A.E.A., J.T.B.; Data Curation: J.T.B., A.E.A.; Formal Analysis: J.T.B., A.E.A.; Methodology: A.E.A., J.T.B.; Visualization: J.T.B., A.E.A.; Writing – Original Draft: J.T.B., A.E.A.; Writing – Review & Editing: J.T.B., A.E.A., A.M.M.
Financial support
This research received no specific grant from any funding agency, commercial or not-for-profit sectors.
Competing interests
Author A, author B, and author C declare none.
AI contributions to research
AI was used to assist in minor revisions of the manuscript.


 Open access

