


Minerals and trace elements are essential for the organism and play a central role in various metabolic processes. Optimizing the mineral supply in animals is important to prevent deficiency symptoms and ensure health and productivity (Beede, Reference Beede1991; Kegley et al., Reference Kegley, Ball and Beck2016; Goff, Reference Goff2018; Wagner et al., Reference Wagner, Edwards-Callaway and Engle2023). Mineral metabolism is typically monitored using blood; however, this method has some disadvantages. Collection of blood is an invasive method, and is not only potentially dangerous especially in beef cattle, but also due to various biological factors, such as homeostasis in serum, the concentration of trace elements in the blood often does not reflect the actual supply to the body (Herdt et al., Reference Herdt, Rumbeiha and Braselton2000). Unlike blood, hair has been identified as an easily accessible, non-invasive sample material for mineral analysis (Agradi et al., Reference Agradi, Munga, Barbato, Palme, Tarhan, Bilgiç, Dokuzeylül, Ercan, Or, Brecchia, Curone, Draghi, Vigo, Marongiu, González-Cabrera and Menchetti2023; Draghi et al., Reference Draghi, Fehri, Ateş, Özsobacı, Tarhan, Bilgiç, Dokuzeylül, Yaramış, Ercan, Or, Cagnardi, Brecchia, Curone and Di Cesare2024; Castrica et al., Reference Castrica, Andoni, Quattrone, Koleci, Ozuni, Zalla, Postoli, Menchetti, Bilgiç, Tarhan, Yalcin, Dova, Fehri, Or, Munga, Beqiraj, Curone and Agradi2025), which can also enable retrospective assessments of trace element intake (Draghi et al., Reference Draghi, Fehri, Ateş, Özsobacı, Tarhan, Bilgiç, Dokuzeylül, Yaramış, Ercan, Or, Cagnardi, Brecchia, Curone and Di Cesare2024).
Previous studies on laboratory animals and humans have already shown that the concentrations of various minerals in the hair are associated with the concentrations in other tissues. For instance, the copper concentrations of hair are significantly associated with the copper concentration of liver tissue (Jacob et al., Reference Jacob, Klevay and Logan1978) and zinc concentrations of hair correlate with those of bones reflecting the zinc intake from the diet (Deeming and Weber, Reference Deeming and Weber1977). A correlation between the selenium concentration of hair and the renal cortex has also been observed (Muramatsu and Parr, Reference Muramatsu and Parr1988). The cadmium concentrations of hair also correlate with those of liver and kidney (Oleru, Reference Oleru1975). These studies suggest that hair could be a meaningful material for analysis which, in contrast to blood, could possibly also allow more meaningful long-term conclusions.
This study aimed to assess whether trace element concentrations in hair accurately reflect the mineral status of calves’ internal organs and could serve as a reliable estimation method for veterinary practice.
Three hypotheses were formulated:
• The concentration of minerals and trace elements in hair is associated with the tissue concentration and the concentration in blood plasma.
• The concentrations of minerals and trace elements in calf hair on one farm do not vary according to breed, hair colour, hair location or sex.
Measuring trace element concentrations in hair samples is appropriate for veterinary practice.
Material and methods
Animals
For this study, 100 calves aged between 2 and 5 months (average age 3.2 months) were sampled, including 74 female, 25 male and 1 hermaphrodite calf. The calves belonged to the breeds and crossbreeds shown in Table 1. All animals were housed on the same farm with stainless steel installations to ensure low Fe intakes (Gassner GmbH, 8010 Graz, Rohrbachhöhe 23, Austria), and they were fed on a standardized ration for 2 months before slaughter. The feeding consisted of oral electrolyte solution on the day of arrival and was continued with fibre-reduced muesli and milk replacer (starter milk 45% and calf milk 50%), with ingredients listed in Table 2. All animals were kept in a barn with automatic ventilation and artificial lighting throughout the entire fattening period. This meant that the animals were not exposed to any rain, snow, wind or other weather conditions.
Number of animals per breed

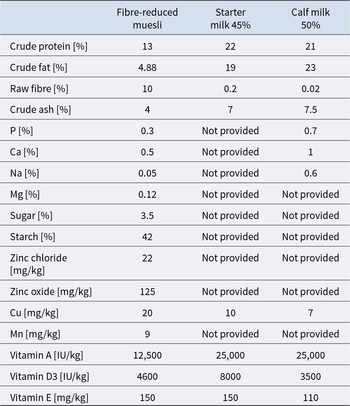
Ingredients of the used feedstuffs, as given by the manufacturer

Sampling
Hair samples were taken after the slaughtering process from the ear and shoulder of each calf, in case of bicoloured calves, one white hair and one coloured hair sample were taken from the shoulder using stainless steel scissors. Samples were considered as paired and unpaired hair samples. Paired samples are taken from the same animal (same colour of different locations, or same location but different colour); unpaired samples are taken from different animals. All samples were stored in paper envelopes.
Blood was collected using a S-Monovette tubes for metal analysis containing Lithium-Heparin (Sarstedt AG & Co. KG, Nümbrecht, Germany) during the slaughtering process – after the animals had been stunned. After centrifugation (2,000 g over 10 minutes) the plasma was collected and frozen at −18°C.
After slaughtering, liver, a thick slice from the kidney, and muscle samples from the diaphragmatic pillar were collected using a knife (stainless steel) and frozen at −18°C.
Sample preparation and analyses
Instrumentation and chemicals
All samples were measured with an Agilent 8900 triple quadrupole ICP-MS (ICP-QQQ) from Agilent Technologies, Inc., California, USA. Depending on the polyatomic interferences for each element, He, O2 or NO gas was used for the collision-/reaction cell mode. Sample digestion was performed using a microwave assisted acid digestion apparatus (Milestone UltraClave®, MWS Mikrowellensysteme-Vertriebs GmbH, Leutkirch, Germany) with quartz vessels. For sample homogenization a ZM 200 Ultra-Centrifugal Mill from Retsch GmbH, Haan, Germany was used. Ultrapure water was generated by a Merck-MiliQ® apparatus (Merck KGaA, Darmstadt, Germany). Centrifugation used a Rotina 420 R from Hettich GmbH, Tuttlingen, Germany. All used chemicals have been of suprapure or higher quality.
Hair
Hair samples were washed in three steps. In the first step, a washing solution of 1 g Brij® 58 (Sigma–Aldrich, St.Louis, Missouri, USA) in 1 l Ultrapure water, in the second step a solution of 1:1 methanol and Ultrapure water, and in the third step only methanol was used. Every washing step took 15 minutes and was performed in an ultrasound bath, followed by 15 minutes of centrifugation at 3,300 g. In case of very dirty hair, the whole procedure was repeated for a second time. Whether a second washing cycle was required was determined by visual assessment of cleanliness of the wastewater from the first washing cycle. After washing, hair samples were dried at 90°C overnight. In the next step, approximately 200 ± 20 mg of each sample was weighed into quartz tubes and 5 ml of 65% HNO3 was added. Microwave assisted acid digestion took place for 1.5 hours at a T max of 250°C, obtaining a colourless and clear solution with no residue whatsoever. For measurement on ICP-MS, the solution was transferred to 50 mL PE-LD centrifugation tubes. After addition of 0.5 ml HCl to the digestion solution, the tubes were filled to 50 ml with Ultrapure water. Samples were measured in triplicate.
Tissue
Liver, muscle and kidney samples were milled with an ultra-centrifugal mill and poured through a 1 mm sieve. In the next step, approximately 200 ± 20 mg of each sample was weighed into quartz tubes and 5 ml of 65% HNO3 was added. Microwave assisted acid-digestion took place for 1.5 hours at a T max of 250°C, obtaining a colourless and clear solution with no residue. For measurement on ICP-MS the solution was transferred to 50 ml PE-LD centrifugation tubes filled to 50 ml with Ultrapure water. Samples were measured in triplicates to correct any measurement inaccuracies.
Plasma
Plasma samples were measured with ICP-MS after direct dilution (1 + 9) in an alkaline solvent consisting of 2.0% 2-propanol, 0.05% EDTA, 0.05% Triton-X-100, and 1.0% NH4OH. Samples were measured in duplicate.
Statistical analyses
For statistical analyses, Microsoft Excel, Version from Microsoft Corporation, Washington was used. Because the data were not normally distributed, either nonparametric tests were used or the data were log-transformed to achieve as near a normal distribution as possible.
Spearman’s rank correlation coefficients (r) were calculated to evaluate the associations between hair and tissue mineral concentrations as well as between hair and blood plasma mineral concentrations. Correlations were considered to be very weak if 0 < r ≤ 0.1, weak if 0.1 < r ≤ 0.3, moderate if 0.3 < r ≤ 0.5, strong if 0.5 < r ≤ 0.7 and very strong if 0.7 < r ≤ 1.
One-way Anova with Bonferroni post hoc test was used to analyse the differences of mineral concentrations of differently coloured hair (white, brown, black) taken from the same location from different animals. To analyse differences between mineral concentrations of paired samples of animals with identically coloured ear and shoulder hair, Wilcoxon signed-rank test was used. Wilcoxon signed-rank test was also used to analyse the differences between mineral concentration of differently coloured shoulder hair of the same animal. To analyse the differences of mineral concentrations of unpaired samples of same coloured ear- and shoulder hair, Mann–Whitney test was used. Paired hair samples consisted either of identically coloured shoulder and ear hair samples from the same animal, or of different coloured shoulder hair samples from the same animal.
For all statistical analyses, a critical p-value of 0.05 was used.
Ethical approval was not required as all samples were taken from animals after slaughter.
Results
Manganese
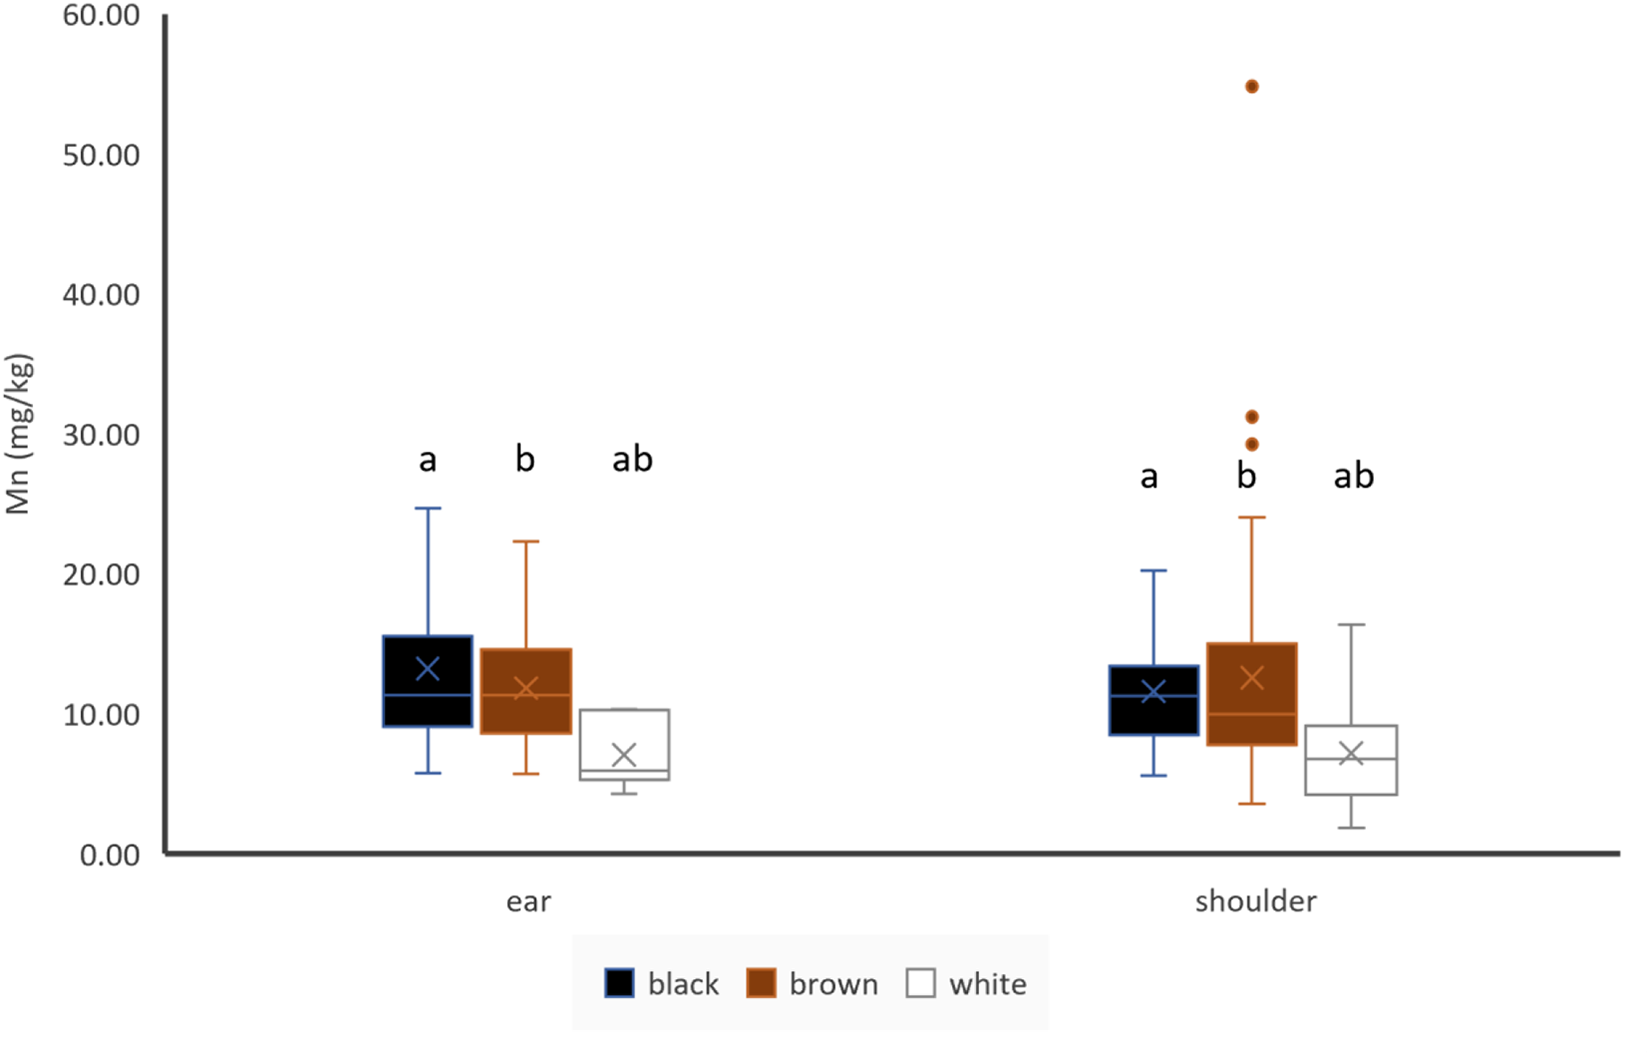
Mn concentrations of pigmented hair were significantly higher than in white hair, but there was no difference between black and brown hair obtained from ear or shoulder (Fig. 1). There were no differences between Mn concentrations in hair of identical colour between the two different locations (Fig. 1). There was a significant (p < 0.05) but weak negative correlation between Mn concentrations of ear hair and Mn concentrations of blood plasma (Table 3). Mn concentrations of ear and shoulder hair are not significantly correlated (Table 4).
Effect of hair colour and hair location on Mn concentrations of hair, ear: black: n = 19, brown: n = 56, white: n = 6; shoulder: black: n = 20, brown: n = 63, white: n = 35; letters indicate significant differences between different colours of the same location, cross indicates the mean value.

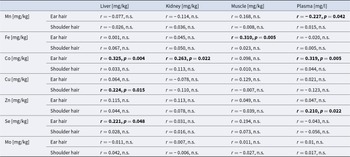
Correlations between trace element concentrations of hair from different locations and tissue or blood plasma (n.s. means not significant, p > 0.05) bold text indicates significant correlations

Correlations between trace element concentrations of same coloured hair from different locations (n.s. means not significant, p > 0.05) bold text indicates significant correlations

Iron
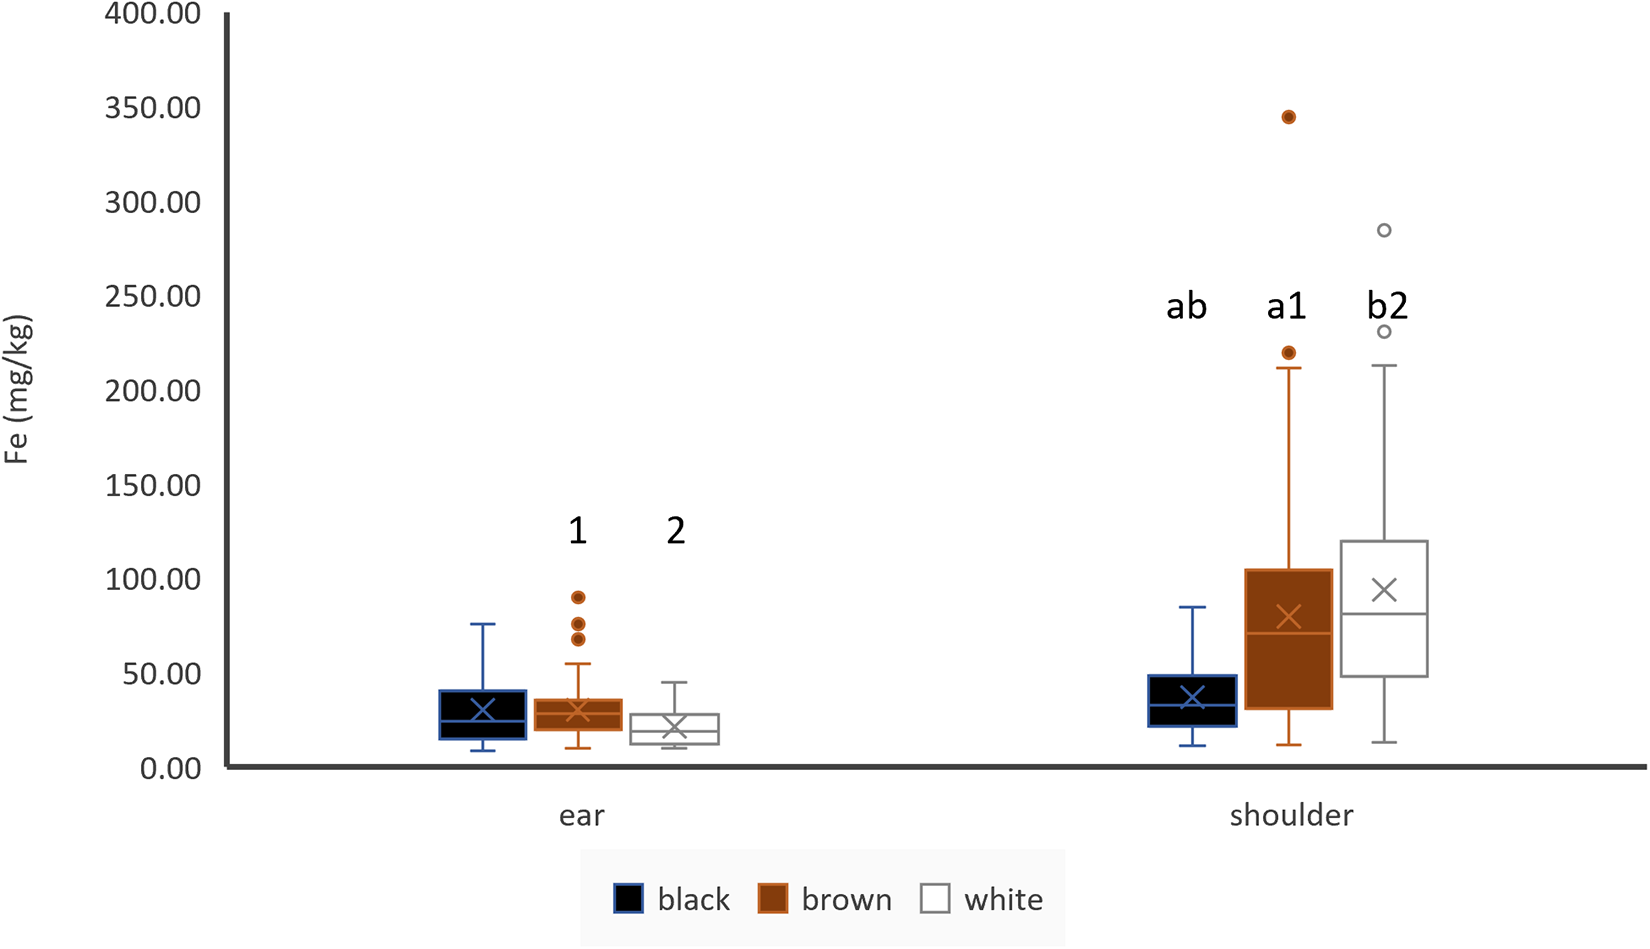
Hair colour did not have any impact on iron concentrations of ear hair, and there also was no significant difference between brown and white hair of the shoulder, but black shoulder hair contained less iron than brown and white shoulder hair (Fig. 2). If paired samples from bi-coloured animals were compared, no difference between black and white shoulder hair was detected (n = 12). Shoulder hair contained more Fe than ear hair in white and brown coloured hair, but there was no difference of black shoulder and black ear hair if unpaired samples were used (Fig. 2). However, when paired samples of animals with identically coloured shoulder and ear hair were compared, shoulder hair contained more Fe than ear hair (n = 71). Fe concentrations of ear hair and muscle showed a moderate (r = 0.31) and significant (p < 0.05) positive correlation (Table 3). Fe concentrations of ear and shoulder hair were not significantly correlated (Table 4).
Effect of hair colour and hair location on Fe concentrations of hair, ear: black: n = 19, brown: n = 56, white: n = 6; shoulder: black: n = 20, brown: n = 63, white: n = 35; letters indicate significant differences between different colours of the same location, numbers indicate significant differences between the same colour of different locations and cross indicates the mean value.

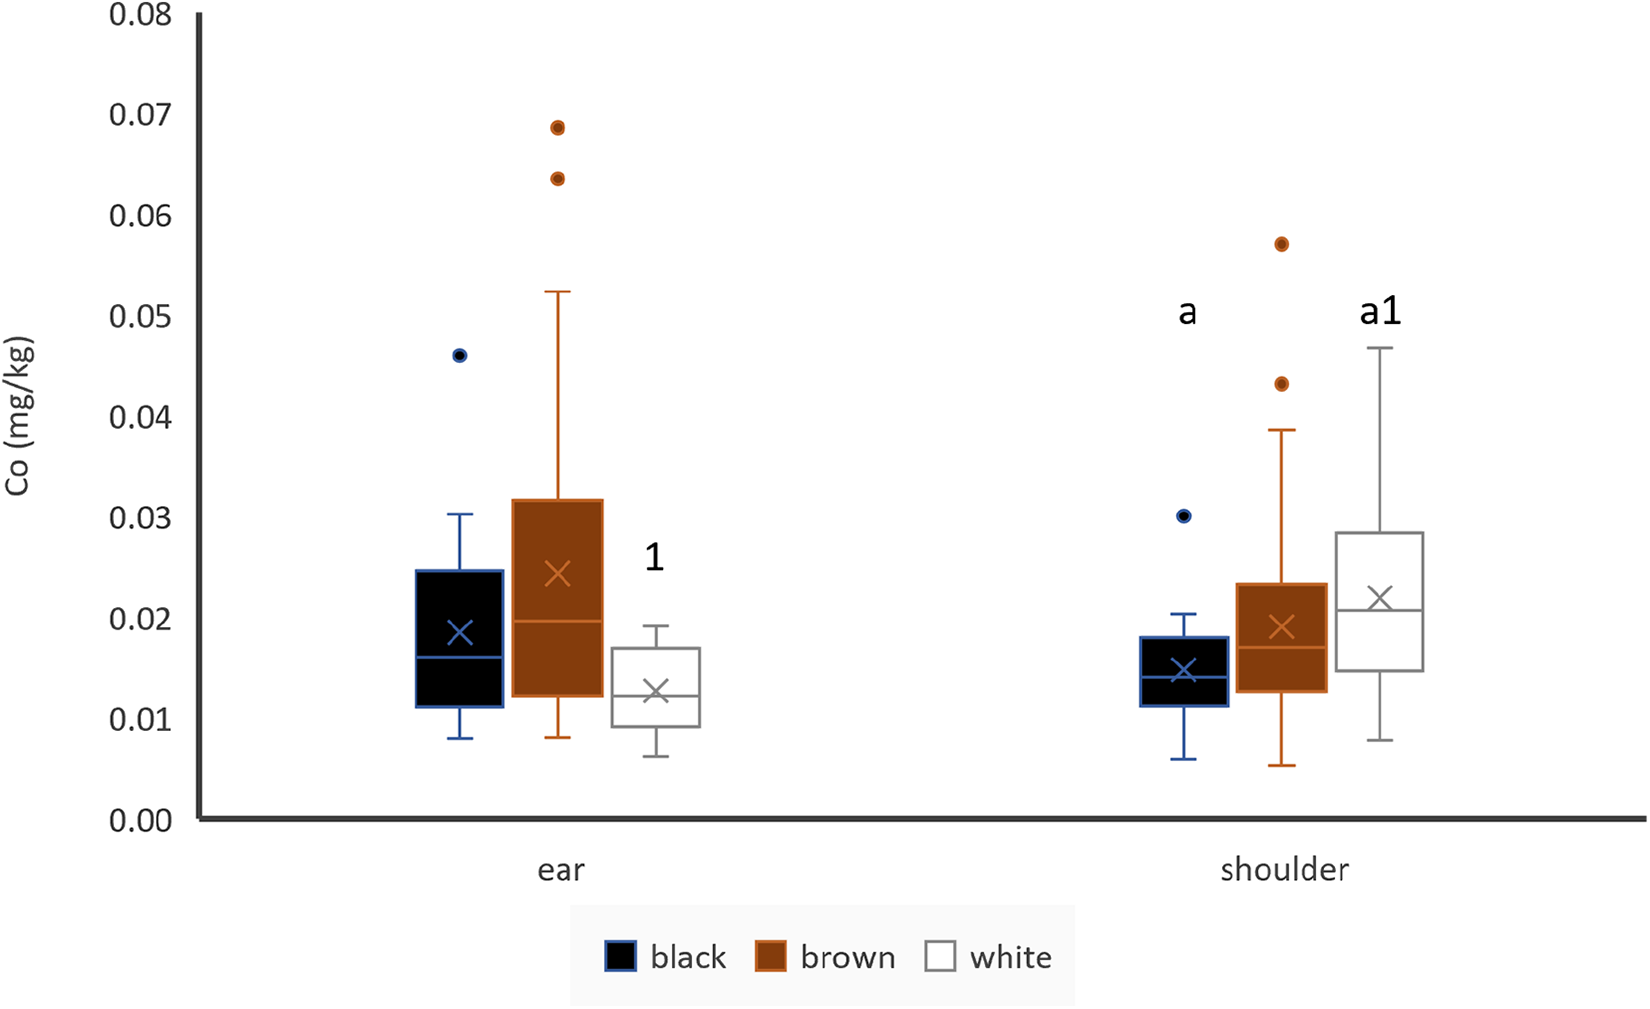
Cobalt
Black shoulder hair contained significantly lower Co concentrations than white shoulder hair. Co concentrations between brown and black or brown and white shoulder hair did not differ significantly and hair colour did not have any impact on Co concentrations of ear hair (Fig. 3). If paired samples of bi-coloured animals were used, there was no difference between black and white (n = 12) or brown and white (n = 6) shoulder hair. Sampling location did not seem to have an impact on Co concentrations in black or brown hair, but white ear hair contained less Co than shoulder hair if unpaired samples are used (Fig. 3). If paired samples of animals with same coloured shoulder and ear hair were used, there was no difference between the locations (n = 66).
Effect of hair colour and hair location on Co concentrations of hair, ear: black: n = 18, brown: n = 52, white: n = 6; shoulder: black: n = 20, brown: n = 62, white: n = 35; letters indicate significant differences between different colours of the same location, numbers indicate significant differences between the same colour of different locations and cross indicates the mean value.

Co concentrations of ear hair were significantly (p < 0.05) and moderately positively correlated with Co concentrations of liver (r = 0.325) and blood plasma (r = 0.319) (Table 3). There was also a significant but weak (r = 0.263) correlation between Co concentration of ear hair and Co concentration of kidney. Co concentrations of ear and shoulder hair were not significantly correlated (Table 4).
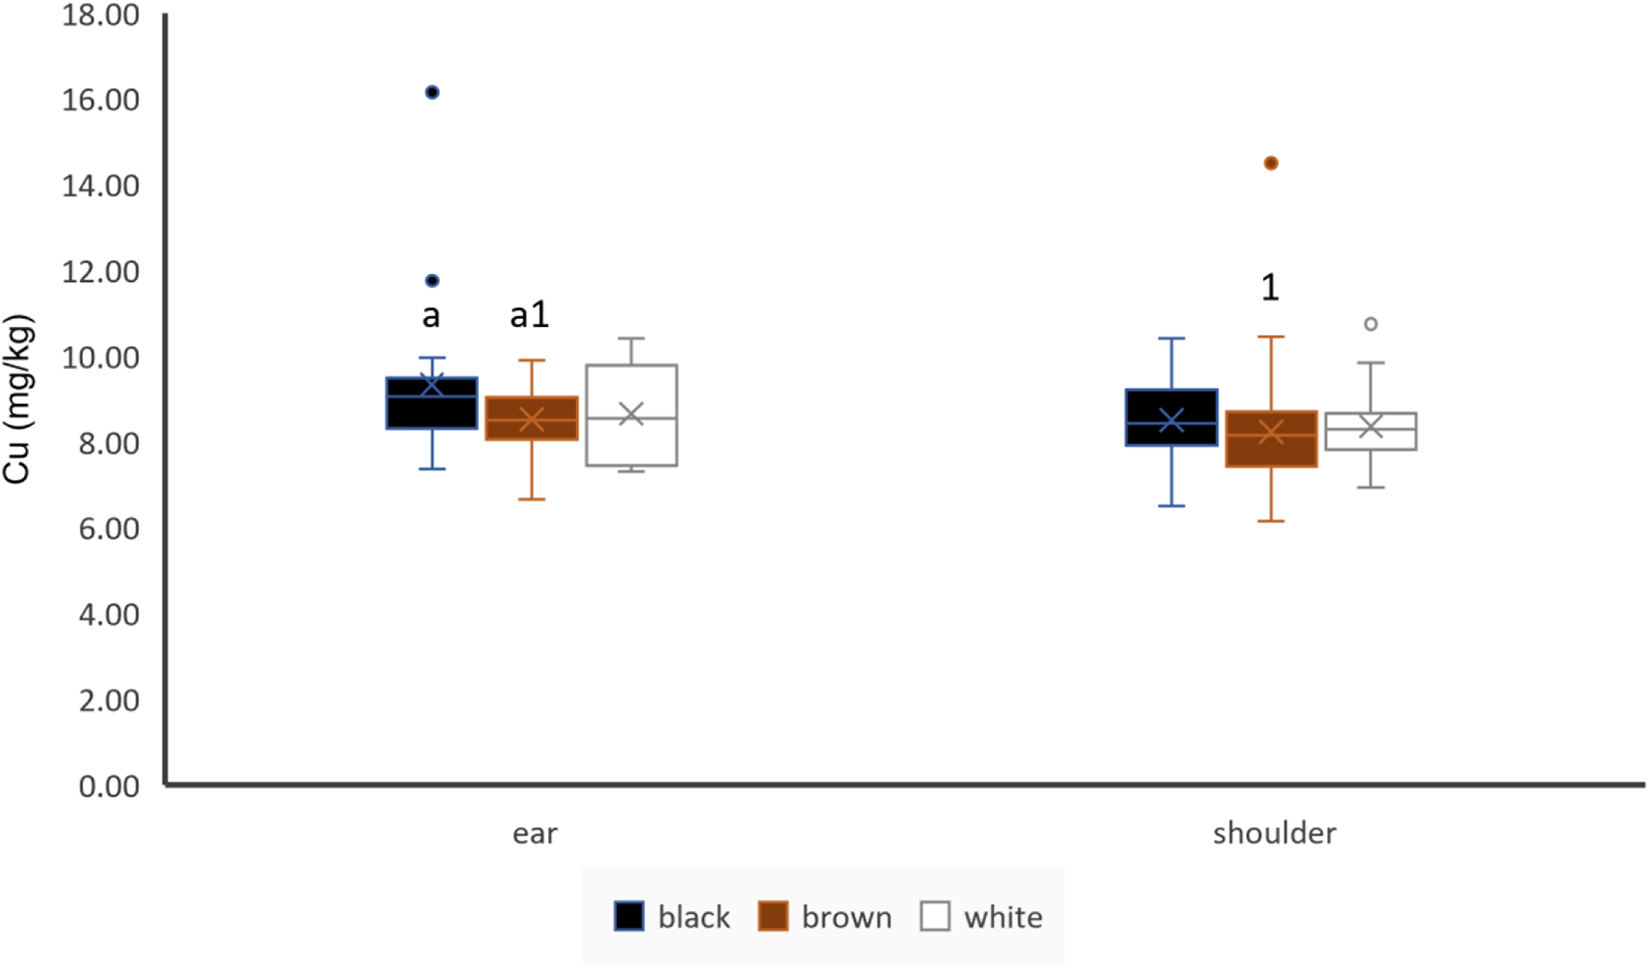
Copper
Cu concentrations did not significantly differ in hair of different colour in shoulder hair, but black coloured ear hair showed significantly higher Cu concentrations than brown coloured ear hair (Fig. 4). Sampling location seemed to have no impact on Cu concentrations of hair in black and white hair of unpaired samples, but brown ear hair showed higher Cu concentrations than brown shoulder hair (Fig. 4). If paired samples of animals with same coloured shoulder and ear hair were used, ear hair showed higher Cu concentrations than shoulder hair (n = 71). Shoulder hair Cu concentrations showed a weak (r = 0.22) but significant positive correlation to liver Cu concentrations (Table 3). Cu concentrations of ear and shoulder hair were significantly moderately positively correlated (Table 4).
Effect of hair colour and hair location on Cu concentrations of hair, ear: black: n = 19, brown: n = 56, white: n = 6; shoulder: black: n = 20, brown: n = 63, white: n = 35; letters indicate significant differences between different colours of the same location and numbers indicate significant differences between the same colour of different locations and cross indicates the mean value.

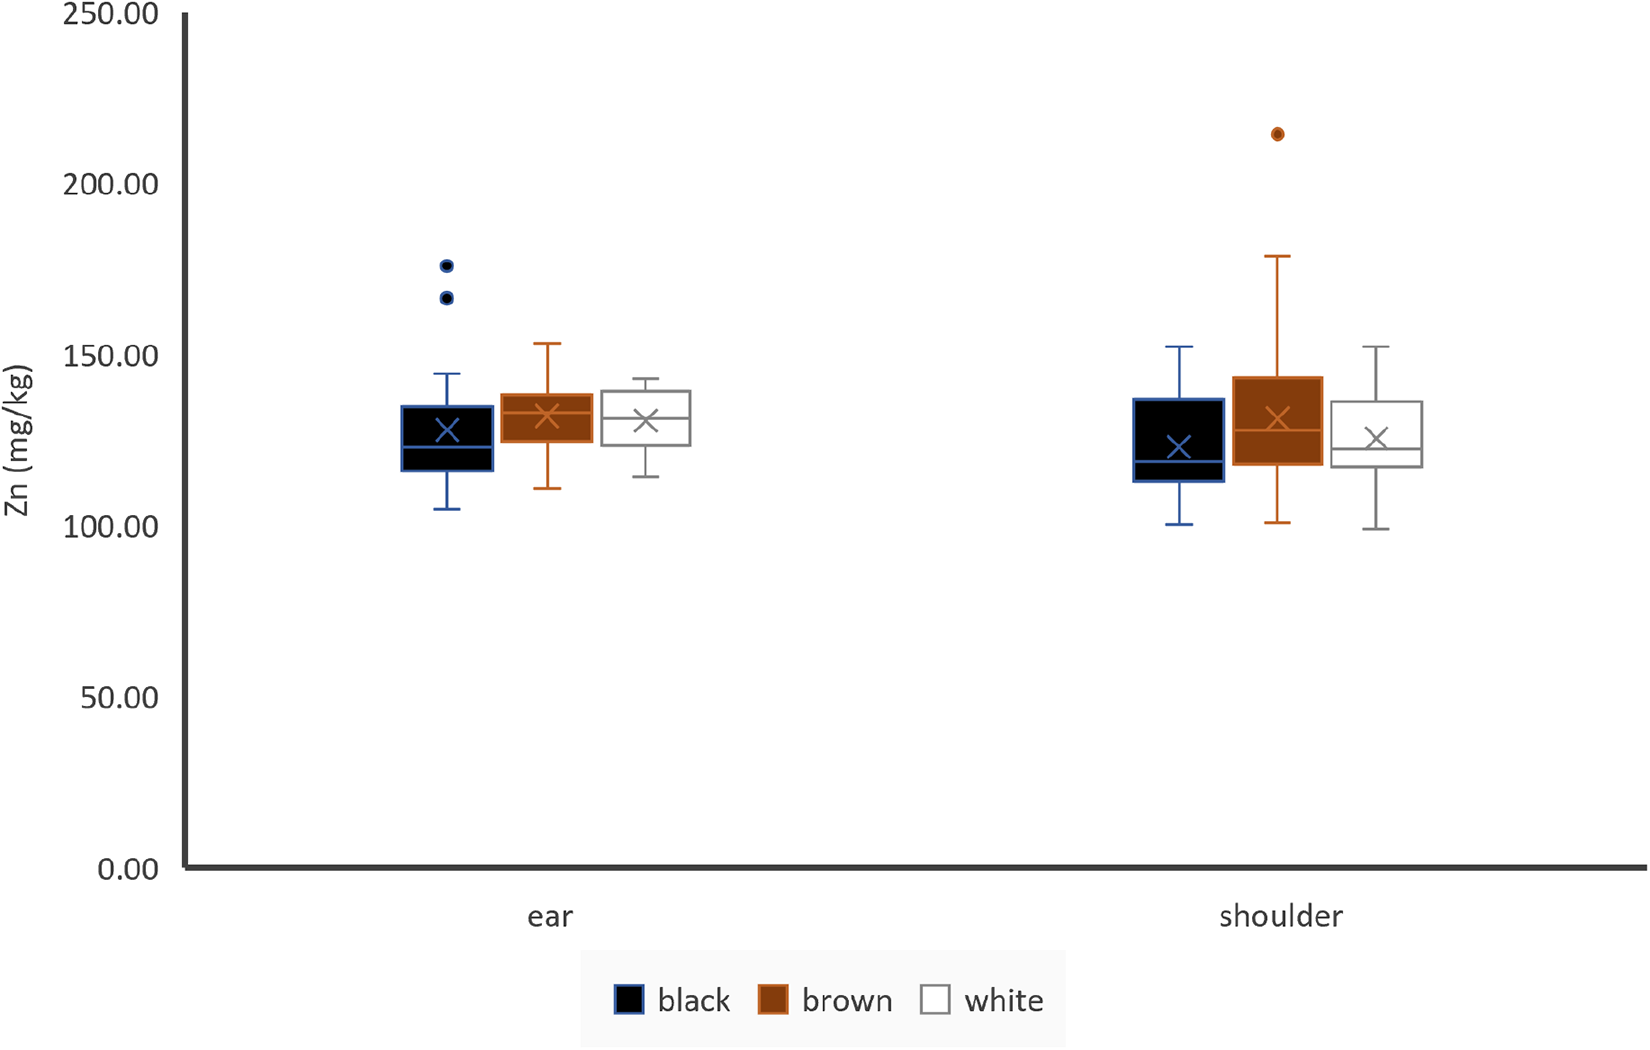
Effect of hair colour and hair location on Zn concentrations of hair, ear: black: n = 19, brown: n = 56, white: n = 6; shoulder: black: n = 20, brown: n = 63, white: n = 35; cross indicates the mean value.

Zinc
Hair colour did not have any effect on Zn concentrations of ear hair or shoulder hair (Fig. 5). Sample location seemed to have no impact on Zn concentrations of hair (Fig. 5), but if paired samples of animals with identically coloured shoulder and ear hair were compared, ear hair showed higher Zn concentrations than shoulder hair (n = 71). Zn concentrations of shoulder hair were significantly but weakly positively correlated to blood plasma (r = 0.21) (Table 3). Zn concentrations of ear and shoulder hair showed a significant weak positive correlation (Table 4).
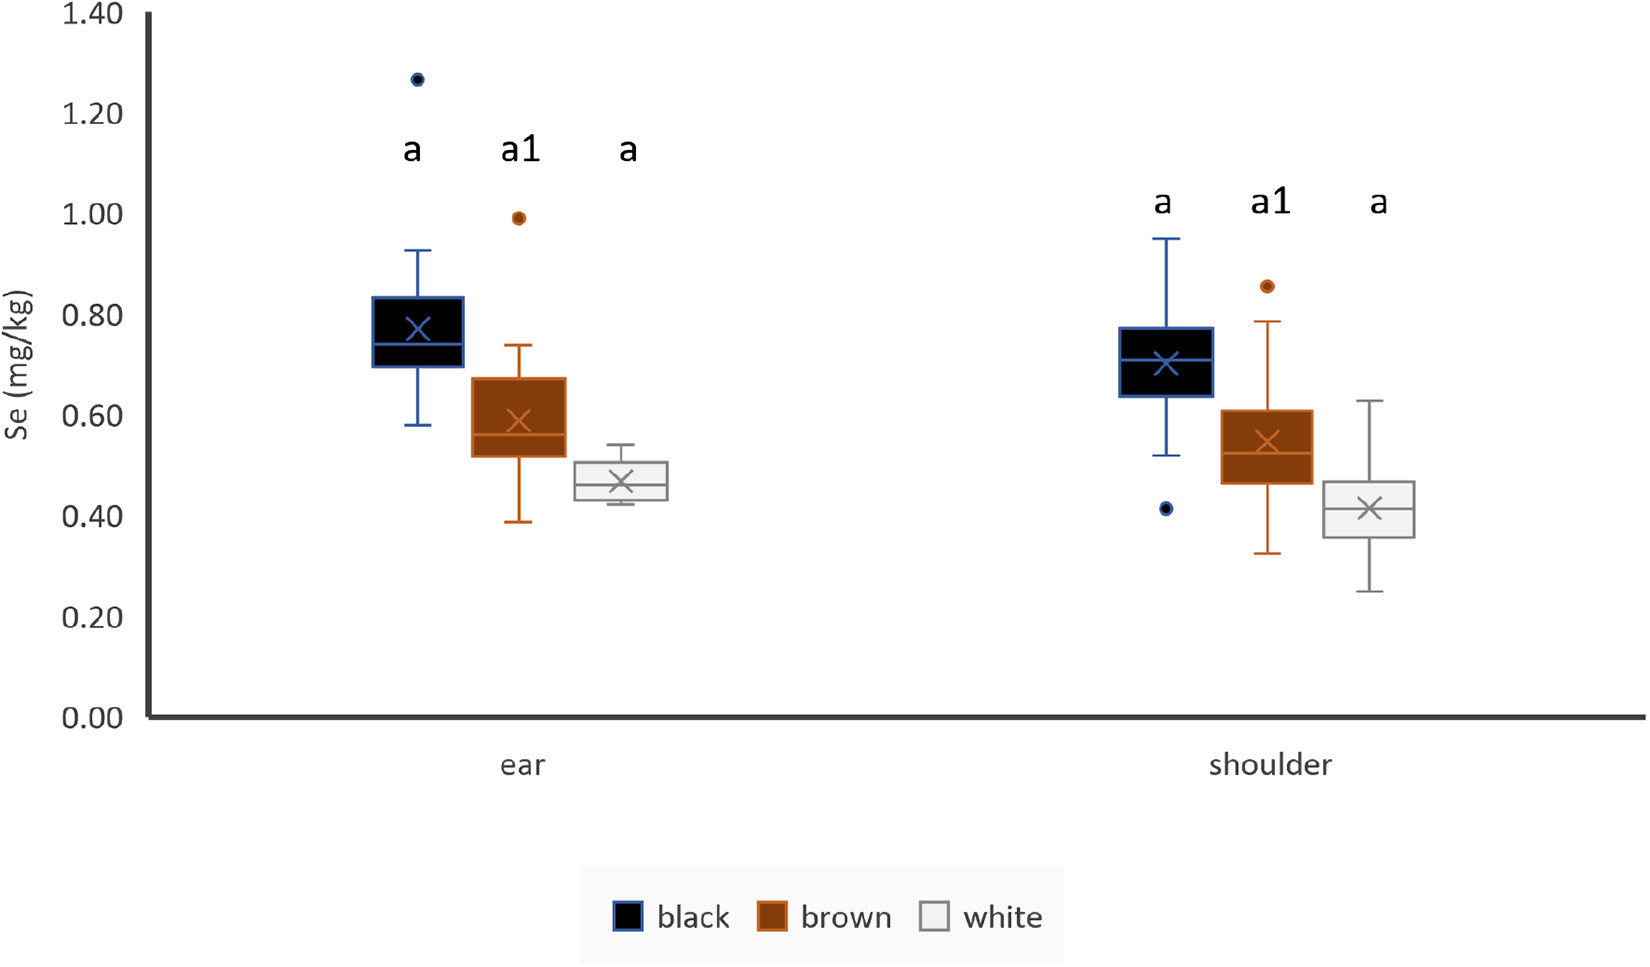
Selenium
There were significantly higher Se concentrations in more pigmented hair (i.e. black > brown > white) in ear and shoulder hair (Fig. 6). If unpaired samples were used, ear hair contained more Se than shoulder hair in brown hair, but there is no effect of location in black or white hair (Fig. 6). If paired samples of animals with identically coloured shoulder and ear hair were used, ear hair contained more Se than shoulder hair (n = 71). There was a significant weak positive correlation between Se concentrations of ear hair and Se concentration of liver (Table 3). Se concentrations of ear hair showed a very highly significant positive correlation to Se concentrations in shoulder hair (Table 4).
Effect of hair colour and hair location on Se concentrations of hair, ear: black: n = 19, brown: n = 56, white: n = 6; shoulder: black: n = 20, brown: n = 63, white: n = 35; letters indicate significant differences between different colours of the same location, numbers indicate significant differences between the same colour of different locations and cross indicates the mean value.

Molybdenum
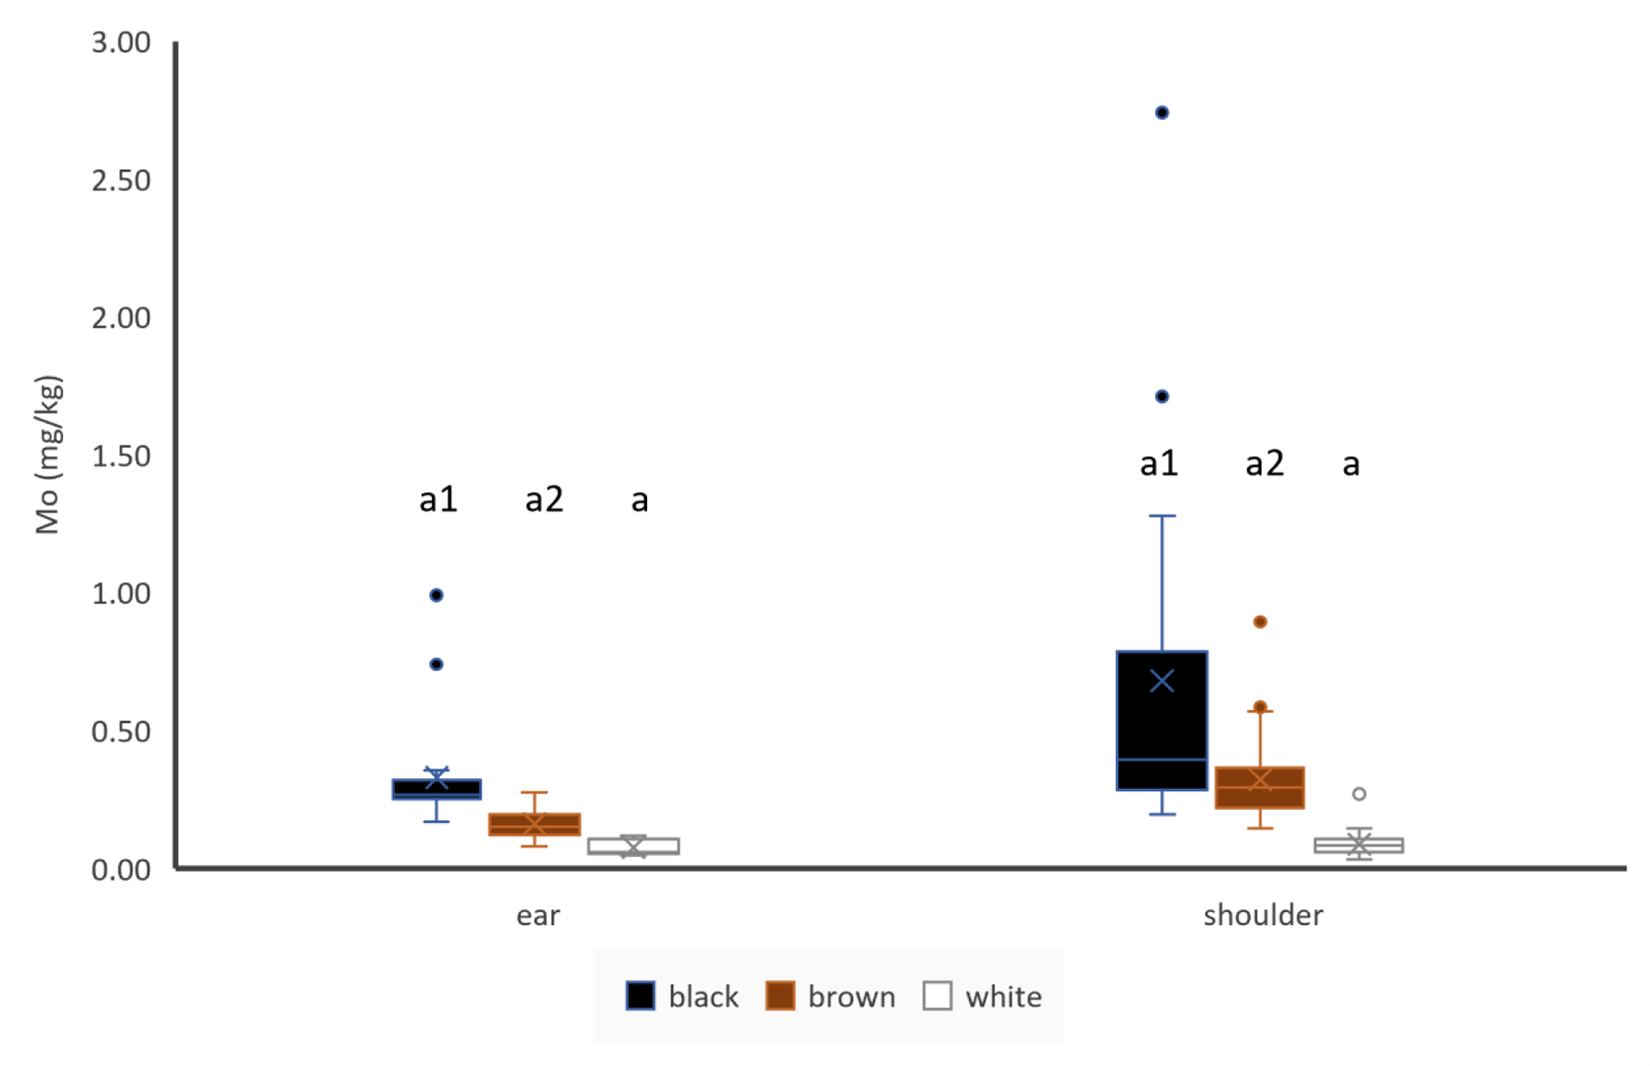
Hair colour influenced Mo concentrations in ear hair and in shoulder hair. Mo concentrations were higher in darker hair (Fig. 7). If paired samples of bi-coloured animals were used, brown shoulder hair showed lower Mo concentrations than white shoulder hair (n = 5), but there was no difference between black and white shoulder hair (n = 12). In unpaired samples, shoulder hair contained more Mo than ear hair in case of black and brown coloured hair, but location seemed not to have any effect of Mo concentrations of white hair (Fig. 7). If paired samples of animals with same coloured shoulder and ear hair were used, shoulder hair contained more Mo than ear hair (n = 67). Mo concentrations of ear hair were moderately significantly positive correlated to Mo concentrations of shoulder hair (Table 4).
Influence of hair colour and hair location on Mo concentrations of hair, ear: black: n = 19, brown: n = 54, white: n = 5; shoulder: black: n = 20, brown: n = 62, white: n = 32; letters indicate significant differences between different colours of the same location, numbers indicate significant differences between the same colour of different locations and cross indicates the mean value.

Discussion
Hair is an easy and non-invasive sample material for the analysis of trace elements (Agradi et al., Reference Agradi, Munga, Barbato, Palme, Tarhan, Bilgiç, Dokuzeylül, Ercan, Or, Brecchia, Curone, Draghi, Vigo, Marongiu, González-Cabrera and Menchetti2023; Draghi et al., Reference Draghi, Fehri, Ateş, Özsobacı, Tarhan, Bilgiç, Dokuzeylül, Yaramış, Ercan, Or, Cagnardi, Brecchia, Curone and Di Cesare2024; Castrica et al., Reference Castrica, Andoni, Quattrone, Koleci, Ozuni, Zalla, Postoli, Menchetti, Bilgiç, Tarhan, Yalcin, Dova, Fehri, Or, Munga, Beqiraj, Curone and Agradi2025). However, there are numerous factors that can influence the mineral concentration in hair (Draghi et al., Reference Draghi, Agradi, Riva, Tarhan, Bilgiç, Dokuzeylül, Ercan, Or, Brecchia, Vigo, Arioli, Di Cesare and Curone2023). As reported, pigmented top hair seems to reflect the Mn supply better than scalp hair of dairy cows (Anke, Reference Anke1965, Reference Anke1967). However, our study could not prove there was any difference between ear and shoulder hair concentrations of Mn. In this study, the finding that hair colour also influences trace element concentrations makes the assessment of the value of a hair sample as an indicator for trace element status problematic. White shoulder hair for example shows significantly higher Co and Fe concentrations than black hair of the same location.
However, in some cases, such as for Fe concentrations of ear hair and muscle, Co concentrations of ear hair and liver and Co concentrations of ear hair and plasma, a moderate correlation between the element concentration of hair and internal organs was observed. But in contrast, some other element concentrations in hair were only weakly or not correlated with those of internal organs. For example, for Se concentrations of ear hair a weak positive correlation to Se concentrations of the liver (Table 3) was observed, but there were no significant correlations with other tissues. This result differs from results reported in humans, where Se concentrations of hair were found to be strongly correlated with Se concentrations of liver, lung and kidney cortex (Cheng et al., Reference Cheng, Zhuang, Tan, Zhi and Zhou1990). Cu concentrations of shoulder hair were only weakly positively correlated to Cu concentrations in liver (Table 3). However, others have shown that in steers if liver Cu concentrations are below 20 µg/g, hair is a suitable indicator of Cu concentrations (Kellaway et al., Reference Kellaway, Sitorus and Leibholz1978).
Fe concentrations of hair were not correlated to Fe concentrations in internal organs in our study. Fe supplementation does not have any effect on Fe concentrations in hair, but it seems to influence concentrations of other trace elements like Zn or Cu in hair (Combs, Reference Combs1987). In our study, the low iron intake of the calves may therefore pose a problem for the interpretation of other mineral concentrations. Zn concentrations of shoulder hair were weakly positively correlated to blood plasma in this study, but earlier studies showed that Zn deficiency is not reflected in Zn concentrations in hair (Miller et al., Reference Miller, Blackmon, Gentry, Powell and Perkins1966).
Our results also differ to some extent depending on whether paired or unpaired samples were used for the calculations. On the one hand, this could be explained by the fact that the sample sizes of paired and unpaired samples differ from each other, and on the other hand, it can also be assumed that separate influences such as age, sex or breed of the animals are distributed differently in both variants. Whether age, gender or breed have an influence on the results can neither be confirmed nor ruled out on the basis of our study, as the test animals were often crossbreeds as well as mainly male animals in the case of dairy-orientated breeds, while females were more often present in the case of dual-purpose breeds.
One of our hypotheses was that the measurement of mineral and trace element concentrations in hair samples is a precise method and appropriate for veterinary practice. This hypothesis cannot be confirmed as, depending on the trace element examined, the concentrations in hair differed depending on the colour or localization in some cases. Therefore, it would be necessary to standardize both the colour and the sampling localization for this procedure. Furthermore, another hypothesis was in doubt, namely that the mineral concentration in the hair also reflects that of various tissues and blood plasma. Insufficient positive correlations were found to suggest this. It should be noted, however, that these results could also be due to momentary fluctuations due to homeostasis, which are not reflected in the hair concentrations. However, this cannot be conclusively clarified on the basis of this study.
Limitations of this study
One limitation of this study is that many breeds and mix-breed calves of both sexes were used. This leads to the problem that it was not possible to identify the effect of breed or sex on trace element status of the hair. Furthermore, it is not certain if the effect of sex could be shown in calves due to low hormone activity, or if older individuals are needed.
Another limitation, but also an advantage, is that all animals were paired samples were compared were approximately the same age and fed the same diet low in Fe. On the one hand, this made it easy to determine the influence of hair colour and localization; on the other hand, this homogeneity of the calves made it difficult to establish correlations between the trace element status of the hair and the internal organs. It is possible that higher correlations could be found in more heterogeneous groups.
To summarize, further studies examining all these variables upon the accuracy of estimating trace element status of hair as a reflection of the trace element status of internal organs would be required. At the very least if hair is used as sample material for trace element analysis in the future, a highly standardized procedure will have to be used for all the parameters mentioned.
Acknowledgements
The authors thank Prof. D. Logue for his support in manuscript preparation.
Competing interests
All authors declare that they have no conflicts of interest.


 Open access