


1.0 Introduction
The energy transition of the 21st century demands urgent advances in sustainable systems, particularly in aviation, where emission reduction remains a major challenge. In response, the 2021 and 2024 Strategic Research and Innovation Agenda (SRIA) of the Clean Aviation Joint Undertaking (CAJU), identified alternative aviation fuels as a key priority for research and development [1]. Among the proposed options, non-drop-in liquid hydrogen (LH2) stands out, due to its zero CO2 and CO emissions during combustion and its high efficiency when used in fuel cells. Furthermore, while current hydrogen production methods are not fully carbon-free, hydrogen has the potential to be generated from renewable sources, paving the way toward a sustainable fuel cycle [Reference Mourouzidis, Singh and Sun2].
Liquid hydrogen has emerged as a leading candidate for clean aviation propulsion due to its exceptionally high energy content per unit mass (approximately 2.8 times greater than that of conventional hydrocarbon fuels), and the fact that its combustion produces only water as a by-product [Reference Kramer3]. However, LH2 suffers from notably low energy content per unit volume, necessitating significantly larger storage capacity compared to traditional fuels. To become a viable option, hydrogen must be stored in its liquid state at cryogenic temperatures below −253 $^{\circ}$
[Reference Rolo, Costa and Brito4]. While this process enables more compact storage, it introduces substantial engineering challenges, such as the need for continuous insulation, strict boil-off control and materials capable of withstanding the extreme thermomechanical loads associated with cryogenic environments [Reference Huete, Nalianda and Pilidis5].
$^{\circ}$
[Reference Rolo, Costa and Brito4]. While this process enables more compact storage, it introduces substantial engineering challenges, such as the need for continuous insulation, strict boil-off control and materials capable of withstanding the extreme thermomechanical loads associated with cryogenic environments [Reference Huete, Nalianda and Pilidis5].
For LH2 to become a viable fuel in commercial aviation, several technical challenges must be addressed, with one of the most critical being its safe and efficient storage in dedicated cryogenic vessels [Reference Spencer6]. Over the years, various types of hydrogen storage vessels have been developed, ranging from all-metal constructions to advanced composite designs, each offering different balance between weight, strength and storage efficiency [Reference Magliano, Perez Carrera, Pappalardo, Guida and Berardi7]. These vessels are typically classified from Type I to Type V, based on their material composition, as illustrated in Fig. 1. While Type I to III tanks rely heavily on metallic components, Type IV and V incorporate fibre-reinforced composites to reduce structural weight without compromising mechanical performance. Given the strict mass constraints in aeronautical applications and the tendency of most metals to become brittle at cryogenic hydrogen environment, composite materials have emerged as a promising solution for LH2 storage in aviation [Reference Zohuri and Zohuri8].
Classification of hydrogen pressure vessels (Type I-V) based on material configuration and structural characteristics.

Advanced fibre-reinforced composite materials offer significant advantages over metals in aviation applications, including superior strength-to-weight ratios and fatigue/corrosion resistance [Reference Van Tooren, Kasapoglou and Bersee9]. These benefits have supported their adoption in hydrogen storage vessels, both as overwrapped designs with internal liners and as linerless configurations, particularly for compressed and cryo-compressed applications [Reference Air, Shamsuddoha and Gangadhara Prusty10]. Building on their proven structural efficiency, fibre-reinforced composite materials are increasingly explored for application in cryogenic LH2 tanks, where extreme thermal and mechanical demands prevail [Reference Sápi and Butler11]. Operating at temperatures near 20K while enduring mechanical loads imposes strict requirements on durability, liquid tightness and thermal stability. These conditions may lead to matrix cracking, delamination and eventually loss of integrity over time.
The failed composite tank of NASA’s X-33 programme, which suffered structural damage during filling and draining, highlights these risks associated with cryogenic operations [Reference Niedermeyer12], and the complexities of designing lightweight cryogenic vessels capable of withstanding coupled thermal and mechanical loading. Since then, it was clear that deep understanding of the complex structural behaviour of composite tanks under cryogenic service conditions requires detailed analysis and advanced numerical modelling. While some efforts have been made in this direction, current knowledge remains fragmented, and important aspects of material behaviour and failure progression under cryogenic environment are still not fully understood. This underscores the need for more systematic investigations to improve the reliability and safety of these systems.
To address these challenges, the present work focuses on the investigation of the structural response of a composite cryogenic LH2 tank, having a design representative of future commercial aviation tanks. Emphasis is placed on understanding the material behaviour and damage mechanisms under thermomechanical conditions, with particular attention to those arising during critical loading conditions, such as the first-filling operation. The analysis is conducted in the framework of the Clean Aviation H2ELIOS project [13], in which a cryogenic hydrogen tank is developed, capable of storing approximately 150 kg of LH2, as a demonstrator for future aviation applications. The work focuses on assessing structural integrity beyond first-ply-failure, through progressive damage modelling (PDM) and finite element (FE) simulations. Key aspects include validating material behaviour through coupon-level tests, assessing the burst pressure of composite pipes and analysing a composite tank in cryogenic conditions. Overall, the study contributes to the ongoing development of safe and efficient composite cryogenic storage solutions for hydrogen-powered aviation.
2.0 Literature review
Research on composite cryogenic pressurised tanks originated in the aerospace industry, driven by the need for lightweight, high-strength materials, capable of withstanding the extreme conditions of space. To meet these requirements, early research focused not only on developing advanced material systems, but also on improving analytical and numerical methods for predicting the structural behaviour of composite pressure vessels. Analytical investigations examined the stress-strain response of laminated cylindrical shells and filament-wound structures under internal pressure [Reference Chandrashekhara and Kumar14–Reference Xia, Takayanagi and Kemmochi16], laying the foundation for understanding load distribution and stiffness behaviour. Subsequent efforts introduced finite element formulations and explored the influence of manufacturing parameters on structural response [Reference Cohen17], contributing to fundamental modelling strategies that continue to support the preliminary design of composite pressure vessels.
To more accurately predict the structural integrity of composite vessels beyond initial failure, researchers adopted progressive damage modelling strategies. These approaches enable the simulation of damage initiation and evolution, including discrete composite damage like matrix cracking and fibre breakage. Early studies demonstrated the potential of PDM to capture nonlinear failure progression in both stiffened and unstiffened composite pressure vessels. Minnetyan et al. [Reference Minnetyan, Gotsis and Chamis18] applied a strain-based criterion to simulate failure propagation, while Chamis et al. [Reference Chamis, Gotsis and Minnetyan19] used multi-scale models to evaluate damage tolerance and burst strength. In parallel, Doh and Hong [Reference Doh and Hong20] and Chang [Reference Chang21] incorporated first-ply-failure and progressive failure criteria in both theoretical and experimental analyses, further advancing the use of stiffness degradation and failure tracking in composite vessel simulations. While these studies laid the foundation for modern PDM frameworks, they were primarily limited to ambient temperature conditions and did not consider the additional complexities introduced by cryogenic environments.
As hydrogen storage gained attention, several studies extended structural analyses to cryogenic environments. A major advancement was the integration of thermal stresses and low-temperature material behaviour into simulation frameworks. Parnas and Katirci [Reference Parnas and Katirci22] proposed analytical models for composite tanks subjected to combined thermal and mechanical loading. Glaessgen et al. [Reference Glaessgen, Reeder, Sleight, Wang, Raju and Harris23] conducted ply-level stress analysis of the X-33 hydrogen tank, identifying how cryogenic temperatures influenced delamination and failure evolution. Similarly, Abumeri et al. [Reference Abumeri, Kosareo and Roche24] performed finite element analysis of an IM7/977-2 composite vessel under −253 $^{\circ}$
and representative launch loads, capturing key cryogenic degradation mechanisms. Building on these insights, subsequent studies extended PDM frameworks to simulate damage initiation and propagation under cryogenic loads. Ju et al. [Reference Ju, Kim, Choi, Lee and Park25] developed a coupled initial and progressive failure model for linerless cryogenic tanks, validating their model with burst tests. Sayman et al. [Reference Sayman, Deniz, Dogan and Yaylagan26] investigated the influence of plastic liners on failure pressure, emphasising the role of material interfaces in damage development. Huang et al. [Reference Huang, Ren, Li, Chang, Cong and Lei27] further enhanced simulation fidelity by introducing a trans-scale modelling framework that captures the coupled thermomechanical and microstructural damage response of composite cryogenic tanks. While these studies provided valuable insight into cryogenic tank behaviour, they primarily focused either on through-the-thickness ply failure progression [Reference Ju, Kim, Choi, Lee and Park25] or on micromechanical trans-scale modelling approaches [Reference Huang, Ren, Li, Chang, Cong and Lei27] without addressing the global structural response of representative aviation full-scale tanks under realistic service loading.
$^{\circ}$
and representative launch loads, capturing key cryogenic degradation mechanisms. Building on these insights, subsequent studies extended PDM frameworks to simulate damage initiation and propagation under cryogenic loads. Ju et al. [Reference Ju, Kim, Choi, Lee and Park25] developed a coupled initial and progressive failure model for linerless cryogenic tanks, validating their model with burst tests. Sayman et al. [Reference Sayman, Deniz, Dogan and Yaylagan26] investigated the influence of plastic liners on failure pressure, emphasising the role of material interfaces in damage development. Huang et al. [Reference Huang, Ren, Li, Chang, Cong and Lei27] further enhanced simulation fidelity by introducing a trans-scale modelling framework that captures the coupled thermomechanical and microstructural damage response of composite cryogenic tanks. While these studies provided valuable insight into cryogenic tank behaviour, they primarily focused either on through-the-thickness ply failure progression [Reference Ju, Kim, Choi, Lee and Park25] or on micromechanical trans-scale modelling approaches [Reference Huang, Ren, Li, Chang, Cong and Lei27] without addressing the global structural response of representative aviation full-scale tanks under realistic service loading.
In parallel, recent advances in the structural analysis of composite pressure vessels have primarily focused on high-pressure storage applications using filament-wound or quasi-isotropic layups combined with polymeric or metallic liners. These studies have demonstrated significant progress in finite element modelling techniques, burst pressure prediction and implementation of progressive failure criteria, often under ambient or elevated temperature conditions and high-pressure gas environments. For instance, Jebeli and Heidari-Rarani [Reference Jebeli and Heidari-Rarani28] implemented a custom Abaqus plugin to simulate filament-wound composite tanks, accounting for dome geometry, ply variation and liner debonding, but under compressed gas conditions rather than cryogenic loading. Similarly, Kothali et al. [Reference Kothali, Bhapkar and Bhat29] applied Tsai-Wu failure criterion to multilayer FRP vessel using ANSYS, yet again focusing on static burst behaviour under pressures up to 17 MPa and room temperature.
Despite these developments, fully linerless cryogenic composite tanks remain largely unexplored, particularly under representative thermomechanical conditions. Many prior studies neglect the complex material interactions occurring at cryogenic temperatures, such as matrix embrittlement, fibre-matrix debonding and temperature-dependent stiffness degradation, which significantly influence damage evolution. Moreover, while significant attention has been given to micro-scale analyses, relatively few works have addressed the global response of aviation-scale cryogenic tanks. Another important limitation of most existing PDM studies is that they typically account for temperature-dependent stiffness, while strength values are often assumed temperature-independent, despite their critical role in predicting failure onset and propagation at cryogenic conditions.
3.0 Modelling framework for the analysis of a composite cryogenic hydrogen tank
To evaluate the structural integrity of composite cryogenic hydrogen tanks, it is essential to model the material’s behaviour under combined thermal and mechanical loading and predict the onset and propagation of damage. This section outlines the modelling strategy adopted in the present study, with particular focus on the intra-laminar failure mechanisms. Section 3.1 provides an overview of key damage processes in laminated composite materials under cryogenic conditions, while Section 3.2 describes the numerical implementation of a progressive damage modelling approach and its staged validation using coupon- and subcomponent-level benchmarks.
3.1 Damage mechanisms in laminated composite materials under cryogenic conditions
Laminated composite materials accumulate damage progressively under both static and fatigue loading before their global failure. In the present study, failure mechanisms are examined at the mesoscale, where the material response is governed by the behaviour of individual plies and their interfaces. At this scale, damage typically initiates with matrix microcracking and fibre-matrix debonding, especially near manufacturing imperfections or geometric discontinuities. As loading continues, these defects grow and interact, leading to severe damages, such as delamination, fibre breakage, stiffness degradation and eventually structural failure. The dominant failure mechanisms of laminated composite materials are typically classified as intra-laminar (within individual plies, e.g., matrix cracking, fibre-breakage and fibre-matrix debonding) and inter-laminar (between adjacent plies, e.g., delamination). Under fatigue loading, composites exhibit a characteristic degradation process. The early stages are dominated by the formation of microcracks and localised stiffness reduction, followed by progressive accumulation of matrix damage and fibre-matrix interface failure. With continued cyclic loading, unstable delamination growth and fibre rupture can ultimately lead to catastrophic failure [Reference Kaminski, Laurin, Maire, Rakotoarisoa and Hémon30].
When laminated composites are exposed to cryogenic conditions, additional challenges due to increased matrix brittleness and thermally induced stresses emerge. A primary concern is the mismatch between the coefficients of thermal expansion (CTE) of the matrix and reinforcing fibres, which promote microcrack formation during cooling [Reference Hohe, Neubrand, Fliegener, Beckmann, Schober, Weiss and Appel31]. These cracks can grow under thermal and pressure cycling, significantly increasing the material’s permeability and raise concerns about hydrogen leakage and tank integrity [Reference Flanagan, Grogan, Goggins, Appel, Doyle, Leen and Ó Brádaigh32]. Moreover, the strain-to-failure of the matrix decreases substantially at low temperatures, intensifying the risk of premature damage initiation [Reference Yuan, Yang, Zhao, Wang, Li, Zhang and Chen33].
In this context, PDM becomes essential for accurately predicting the intra-laminar behaviour of composite cryogenic pressure vessels. PDM enables early detection of microcracking and allows for the simulation of the evolving stiffness and strength of the material under both mechanical and thermal loading. Inter-laminar damage modes, such as delamination, typically captured using cohesive zone models, are not considered in the present study, as it primarily focusses on the matrix cracking failure mode, in order to appropriately size the tank and prevent hydrogen leakage.
3.2 Scope and validation strategy
To ensure the reliability of the progressive damage modelling methodology developed in this study, a structured validation strategy is adopted. This strategy follows a multi-level approach, transitioning from coupon-level simulations to structural subcomponent analysis. By incrementally increasing model complexity and application relevance, the numerical framework is progressively verified and calibrated against experimental benchmarks available in the literature.
The validation process begins with the simulation of open-hole tensile tests on composite coupons, serving to assess the model’s ability to predict intra-laminar failure under mechanical loads. The same modelling strategy is subsequently applied to the simulation of filament-wound composite pipes subjected to internal pressure, representing structural subcomponents of composite tanks. This step is essential for evaluating the capability of the PDM framework to capture failure onset and burst pressure of curved shell structures under mechanical loading.
All finite element simulations are performed using the ANSYS 2024R2 commercial software in the APDL environment, employing failure criteria and stiffness degradation laws. Experimental data from the literature are used as reference points, enabling quantitative comparison and verification of the simulation results.
By validating the PDM methodology in mechanical loading through intermediate steps, confidence is established in its ability to capture the complex damage progression expected in full-scale composite cryogenic hydrogen tanks under thermomechanical loads. This staged approach also serves to evaluate the performance of standard APDL-based implementations, confirming their suitability for advanced composite analysis in cryogenic applications.
4.0 Progressive damage modelling methodology
This section presents the numerical framework developed for the simulation of progressive intra-laminar damage in laminated composite materials. The adopted methodology is based on a ply-level PDM strategy, incorporating failure criteria for damage initiation and stiffness degradation laws for damage evolution. The implementation follows a modular structure within the ANSYS environment and is designed to enable the simulation of composite structures under mechanical and thermomechanical loading conditions.
4.1 Progressive damage modelling framework
As mentioned above, in this study, a ply-level PDM framework is adopted, focusing on the mesoscale. Within this framework, stress and strain distributions are obtained through finite element analysis, and failure is evaluated at each integration point of the composite plies. Damage initiation is predicted using established failure criteria, while the subsequent degradation of material properties is governed by stiffness reduction laws.
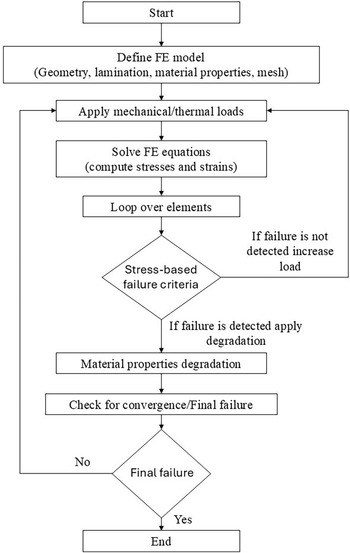
The developed PDM strategy follows the flowchart presented in Fig. 2. It begins with the computation of stresses and strains at each substep. Based on these quantities, failure indices are calculated to assess whether damage initiation criteria are met. If failure is detected, the corresponding material stiffness is reduced according to predefined degradation factors. The updated stiffness matrix is then used in subsequent steps of the finite element analysis, allowing for iterative tracking of progressive damage evolution. The subsequent sections describe the failure criteria and degradation models in detail, followed by the finite element implementation used in this study.
Progressive damage modelling flowchart.

4.2 Failure criteria and stiffness degradation laws
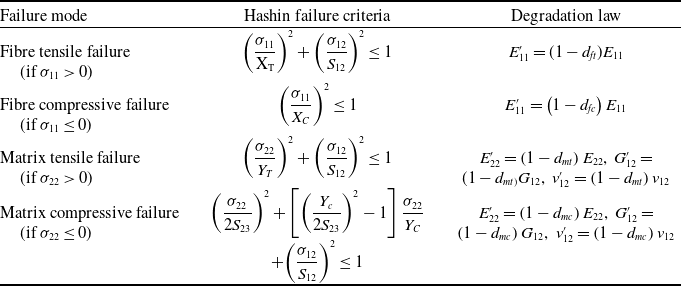
Although a variety of failure criteria have been proposed for composite materials, the Hashin failure criteria were selected in this study due to the favourable balance between simplicity, efficiency and physical interpretability [Reference Hashin34]. These criteria distinguish between distinct failure modes, namely fibre and matrix failures under tensile and compressive loading, while requiring only a limited set of input parameters. These parameters correspond to the material’s tensile, compressive and shear strengths, which can be obtained through standard uniaxial tests performed at cryogenic temperatures. Compared to more complex failure theories involving fracture mechanics or energy dissipation parameters, the Hashin approach is more straightforward to implement in finite element models. Furthermore, its mode-dependent formulation supports the identification and tracking of different damage mechanisms as they evolve, offering valuable insight into the progression of failure. Once a failure mode is detected, the material’s response transitions to a damaged state through stiffness degradation. In the present study, both stiffness and strength values are defined as temperature-dependent, unlike many previous PDM implementations that assume constant strength values. This allows a more realistic prediction of failure onset and progression under cryogenic conditions. The implemented failure criteria and the corresponding degradation rules are summarised in Table 1, based on the original formulation by Hashin [Reference Hashin34] and its finite element adaptation by Tserpes et al. [Reference Tserpes, Labeas, Papanikos and Kermanidis35].
Hashin failure criteria and the corresponding degradation law [Reference Hashin34, Reference Tserpes, Labeas, Papanikos and Kermanidis35]

The components of the stress tensors are denoted as σ ij where i, j = 1, 2. X T, X C, Y T and Y C represent the longitudinal and transverse tensile and compressive strengths, respectively. The degradation coefficients d ft , d fc , d mt , and d mc are applied to the stiffness matrix components E ij , G ij and v ij with ‘f’ and ‘m’ referring to fibre and matrix dominated modes. Once a failure mode is activated, the corresponding material stiffness is instantaneously reduced using these predefined degradation factors.
The degradation coefficients used in PDM represent the fractional reduction of material stiffness in the affected direction after damage initiation. These coefficients take values between 0 and 1, where 0 indicates no stiffness reduction and 1 corresponds to complete stiffness loss in the affected mode. These degradation coefficients are not fixed material properties but rather modelling parameters, influenced by the composite architecture, failure morphology and environmental conditions. In the absence of precise data, the coefficients used in this study are derived from literature-based ranges and adjusted through parametric studies. This approach allows for evaluating the sensitivity of the structural response to different levels of material degradation, and for identifying suitable values that balance physical realism and computational robustness.
4.3 Finite element implementation of PDM in cryogenic composites
In this study, the structures investigated are modelled using four-node shell elements (SHELL181) from the ANSYS element library [36]. This structural element features six degrees of freedom per node (three translations and three rotations) and is based on the first-order shear deformation theory (Mindlin-Reissner), which accounts for transverse shear effects and is suitable for modelling thin to moderately thick composite laminates. To enhance numerical stability and stress accuracy, full integration with incompatible modes is employed, and three through-thickness integration points are assigned to each ply to capture intra-laminar stress variation.
Material stiffness and strength properties are defined as temperature-dependent using multilinear data input derived from experimental characterisation at ambient and cryogenic temperatures. Linear interpolation is then applied to estimate material properties at intermediate temperatures during the simulation. While this approach enables efficient coupling of thermal and mechanical behaviour, it inherently assumes monotonic linear variation of properties with temperature, which may not capture nonlinear degradation. Therefore, experimental characterisation in distinct temperatures is necessary to have more accurate results.
At each solution substep, local stress tensors are checked against the Hashin failure criterion, and once damage is initiated, the elastic constants are modified in-place at the ply integration points. To assess the numerical robustness of the implementation, a sensitivity study is conducted on key parameters such as mesh resolution, number of substeps, and degradation coefficients.
Despite its practical advantages, the adopted modelling approach has inherent limitations. The use of shell elements restricts the accurate representation of inter-laminar stresses and out-of-plane failure mechanisms such as delamination. Moreover, the assumption of instantaneous stiffness degradation, while numerically efficient, does not fully capture the energy dissipation and microcracking processes observed in physical experiments. Finally, the linear interpolation of temperature-dependent properties may overlook complex nonlinearities in cryogenic material behaviour. Nonetheless, the proposed implementation offers a computationally efficient and physically meaningful framework for simulating the progressive intra-laminar failure in composite cryogenic tanks under thermomechanical loading, which is the main focus of the present work. Such focus is justified by the fact that matrix cracking is the initial critical condition (before any delamination induced failure occurs) that drives the design and sizing of liner-less cryogenic composite hydrogen tanks, in order to prevent potential hydrogen leakage.
5.0 Validation of the progressive damage modelling framework
To evaluate the accuracy and predictive capabilities of the proposed progressive damage modelling framework, two validation studies are conducted under mechanical loading conditions. These include an open-hole tension test at the coupon level and a burst pressure test of a composite pipe. The selected configurations allow for the assessment of intra-laminar damage initiation and progression in composite laminates, as captured by the implemented failure criteria and degradation models. Numerical results are compared to experimental data in terms of load-displacement behaviour, strain distribution and failure loads, providing confidence in the model’s ability to simulate realistic failure mechanisms in fibre-reinforced composites. These results serve as a foundation for applying the model to cryogenic applications in the next section.
5.1 Validation at the coupon level: open-hole tension test
The open-hole tension (OHT) test is used to validate the predictive capabilities of the proposed progressive damage modelling framework under mechanical loading in coupon level. The simulation setup is based on the experimental investigation of Yoon et al. [Reference Yoon, Kim, Kim and Doh37], who performed tension and compression tests on carbon fibre-reinforced polymer (CFRP) coupons with a central hole and characterised the mechanical behaviour using digital image correlation (DIC) and load-displacement data.
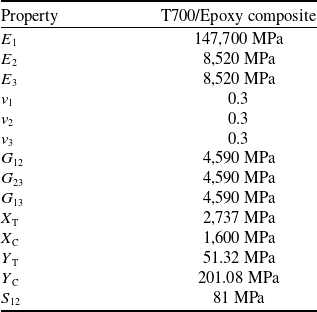
The coupon geometry consists of a rectangular CFRP laminate with a centrally located 6.35 mm circular hole, having overall dimensions of 203.2 mm × 25.4 mm and a total thickness of 1.2 mm. The laminate has a symmetric quasi-isotropic stacking sequence [0/45/−45/90]s, composed of eight plies of equal thickness. The mechanical properties of the T700/Epoxy composite system used in the simulation are listed in Table 2.
Mechanical properties of T700/Epoxy composite material (adapted from Ref. [Reference Yoon, Kim, Kim and Doh37])

To ensure the accuracy of the numerical solution, a mesh convergence study was carried out by varying the number of finite elements from 1,792 to 4,032. Local mesh refinement was applied in the vicinity of the open hole to adequately capture the stress gradients that lead to damage initiation. The stiffness degradation parameters were fixed across all mesh configurations to isolate the effect of element size, with values d ft = 0.93, d fc = 0.86, d mt = 0.80, and d mc = 0.60, according to Tserpes et al. [Reference Tserpes, Labeas, Papanikos and Kermanidis35]. The results show that convergence is achieved for meshes with more than 3,000 elements, as the variation in predicted peak load falls below 0.02%, as can be seen in Fig. 3. Therefore, Mesh 3 (3,072 elements) was selected for all subsequent analyses. The finite element model of the open-hole tension specimen is shown in Fig. 4.
Mesh convergence analysis for the open-hole tension model.

Finite element model of the open-hole tension specimen.

To evaluate the influence of the stiffness degradation coefficients on the predicted structural response, a parametric study was performed focusing on the four key parameters: fibre tension (d ft ), fibre compression (d fc), matrix tension (d mt ) and matrix compression (d mc ). The initial set of values (Case 1) was selected from literature and served as a reference: dft = 0.93, d fc = 0.86, d mt = 0.80 and d mc = 0.60. In Case 2, only the fibre degradation parameters were increased to 0.95, keeping the matrix values fixed. This configuration led to premature failure, significantly underpredicting the peak load compared to experimental results. This finding indicates that excessive fibre stiffness retention adversely affects damage progression realism. Subsequently, the fibre degradation parameters were reduced to d ft = d fc = 0.92 following a sweep in the range 0.95–0.90, which resulted in a more realistic peak load. The focus then shifted to the matrix degradation parameters, where d mt and d mc were systematically varied from 0.80 down to 0.40 (Cases 3–6). It was observed that decreasing the matrix stiffness after damage had a strong effect on the slope of the post-peak response. Figure 5 illustrates the resulting load-displacement curves for the various parameter combinations, highlighting the sensitivity of the response to both fibre and matrix degradation. The best correlation with the experimental data was achieved for d mt = d mc = 0.50, in combination with the calibrated fibre values (d ft = d fc = 0.92).
Effect of degradation parameters on the predicted load-displacement behaviour of the open-hole tension specimen.

The predicted load–displacement response from the PDM simulation was compared to the experimental results reported by Yoon et al. [Reference Yoon, Kim, Kim and Doh37]. As can be seen in Fig. 6, the predicted stiffness in the linear region and the ultimate load are both in close agreement with the experimental curves. The deviation in maximum load is 4.02%. The predicted displacement at failure also corresponds well with the reported values, supporting the ability of the model to capture global mechanical response.
Tensile load-displacement curves for the open-hole tension tests [Reference Yoon, Kim, Kim and Doh37] versus the numerical results.

To evaluate local strain predictions, the longitudinal strain field (ε xx ) obtained from the simulation at the onset of failure was compared with DIC measurements from Yoon et al. [Reference Yoon, Kim, Kim and Doh37]. The simulation captures the concentration of strain around the hole prior to failure. The maximum predicted strain was 0.01859, while the DIC-measured strain was 0.01873, showing excellent agreement, as can be seen in Fig. 7. Also, in Fig. 8, the damage evolution is shown for the open-hole tension simulation until the final failure of the specimen.
Longitudinal strain (εxx) contour at fracture moment obtained from (left) DIC [Reference Yoon, Kim, Kim and Doh37] and (right) the numerical model.

Damage evolution in the open-hole tension simulation up to final failure.

5.2 Validation at the sub-component level: burst failure of composite pipes
To assess the accuracy of the proposed progressive damage modelling framework at the structural subcomponent level, a burst pressure simulation of a composite pipe was conducted and compared against experimental results. The selected configuration is based on the experimental campaign by Onder et al. [Reference Onder, Sayman, Dogan and Tarakcioglu38], who investigated the burst behaviour of filament-wound E-glass/epoxy pipes under monotonic internal pressure.
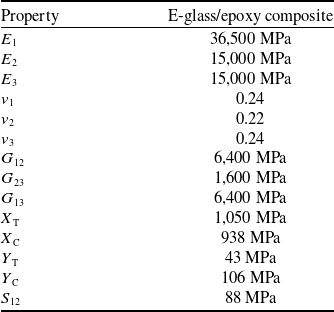
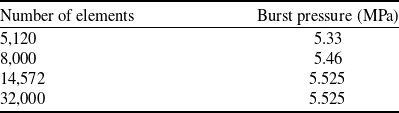
The tested pipes consisted of four layers with a [θ/−θ/−θ/θ] layup and an internal diameter of 100 mm, a total wall thickness of 1.6 mm, and a length of 400 mm. Internal pressure was applied at a rate of 1 MPa/min until final failure. The mechanical properties of the material system are presented in Table 3. Among the different layups evaluated experimentally, the present validation focuses on the [45/–45/–45/45] configuration for consistency with the numerical model. A mesh convergence study was conducted, with the total number of elements ranging from 5,120 to 32,000. The final model used approximately 15,000 elements, selected as a compromise between accuracy and computational efficiency. In the absence of a dedicated convergence graph, the burst pressure values corresponding to each mesh density are summarised in Table 4, demonstrating that mesh refinement had a negligible effect on the predicted burst load.
Mechanical properties of E-glass/Epoxy composite material (adapted from Ref. [Reference Onder, Sayman, Dogan and Tarakcioglu38]

Effect of element density on predicted burst pressure for the [45/−45/−45/45] composite pipe configuration

Boundary conditions were defined to replicate the experimental closed-end configuration. Internal pressure was applied to the inner surface of the pipe and gradually increased until structural collapse. The stiffness degradation coefficients were initially adopted from the previously calibrated OHT test, using values of d ft = d fc = 0.92 and d mt = d mc = 0.50. However, these settings resulted in an underestimation of the burst pressure compared to the experimental measurements. To improve the correlation, a parametric study was conducted by fixing the fibre degradation coefficients and varying the matrix degradation values from 0.60 to 0.30. The best agreement was obtained with d mt = d mc = 0.40, which were subsequently used in the final simulation. The predicted burst pressure was 5.98 MPa, in close agreement with the experimental value of 6.00 MPa, corresponding to a relative error of 0.33%, as shown in Table 5.
Failure pressure for the [45/−45/−45/45] composite pipe Ref. [Reference Onder, Sayman, Dogan and Tarakcioglu38] and the numerical model

The simulation results also captured the progression of intra-laminar failure. Initial matrix damage was observed in the inner surface of the ±45° plies near the tabs, where shear stresses were highest. As loading increased, fibre damage was initiated in the outer plies due to hoop stress buildup. Figure 9 presents the contour plots of damage in the final failure of the composite pipe.
Damage contour at burst pressure of the composite pipe.

The strong agreement between predicted and experimental burst pressures, along with the accurate reproduction of failure progression, confirms the robustness of the proposed PDM implementation for curved pressurised composite structures. The validation at the structural subcomponent level builds confidence in applying the methodology to full-scale cryogenic pressure vessels under internal pressure.
6.0 Composite cryogenic hydrogen tank modelling and simulation
In the previous sections, the developed numerical methodology and the progressive damage modelling framework have been validated through comparison with experimental results from relevant test campaigns. Building on these validations, the methodology was applied to simulate the thermomechanical response of a full-scale composite cryogenic pressure vessel. This transition from coupon- and subcomponent-level tests to operational tank simulations provides a more comprehensive understanding of a cryogenic tank’s behaviour under operational conditions.
The simulated structure represents a vacuum-insulated tank comprising a cylindrical section and two hemispherical domes, constructed from unidirectional carbon/PEEK matrix laminates. Although geometrically simplified, the selected configuration captures the essential characteristics of liner-less composite tanks used in hydrogen demonstrators and research-scale prototypes. Its cylindrical body and hemispherical domes offer a practical compromise between structural efficiency, manufacturability and thermal efficiency. Compared to fully spherical tanks, which minimise surface area but present significant integration challenges, this configuration facilitates fabrication and integration. As such, it serves as a representative benchmark for simulating progressive damage under operational cryogenic conditions.
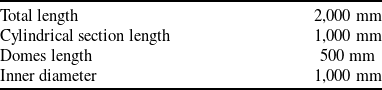
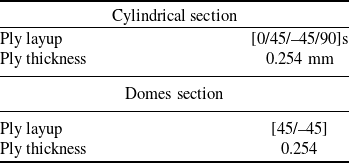
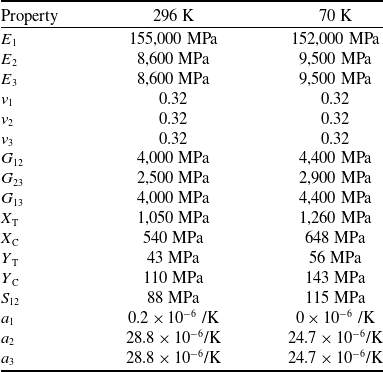
The vessel’s geometric characteristics are listed in Table 6, and the layup sequences for both the cylindrical and dome regions are detailed in Table 7. To account for the distinct loading environments across the tank structure, different stacking sequences are assigned to the cylindrical and dome regions. The cylindrical section is subjected primarily to hoop and axial stresses, which are efficiently carried by 0° and 90° fibre orientations. Accordingly, a quasi-isotropic layup of [0/45/−45/90]s is employed to maximise hoop strength, axial stiffness and damage tolerance under biaxial loading. In contrast, the dome sections experience a more complex multiaxial stress field with significant shear components, especially near the dome – cylinder interface. To better accommodate these stresses, the domes are reinforced with a [±45] layup, which offers superior in-plane shear compliance. The increased wall thickness of domes ensures structural continuity during thermal contraction and mechanical pressurisation. This tailored lamination strategy reflects practices observed in advanced cryogenic composite tanks, where dome regions are often optimised independently to withstand local stress concentrations and manufacturing constraints [Reference Mital, Gyekenyesi, Arnold, Sullivan, Manderscheid and Murthy39, Reference Tzoumakis, Fotopoulos and Lampeas40]. An aerospace-grade IM7/PEEK composite has been adopted in the present study as a representative material for cryogenic applications. This approach enables the analysis of a demo case that captures the essential features of liner-less LH2 tanks, while retaining flexibility for parametric variation. The full set of orthotropic properties is presented in Table 8. To evaluate its structural performance under service-like conditions, the following three loading scenarios are simulated, comprising (a) application of internal pressure, (b) application of cryogenic temperature at the inner surface of the tank and (c) combined internal pressure and cryogenic temperature. These scenarios are used to isolate the individual and combined effects of mechanical and thermal loading on failure initiation and progression. Special emphasis is placed on identifying critical plies, capturing matrix-dominated damage and understanding the influence of thermal contraction on the structural integrity of the liner-less configuration. The primary objective of the present analysis is to address the tolerance of a composite cryogenic pressure vessel after first-ply-failure. The analysis also aims to track the propagation of damage over time following this initial failure, which is crucial for understanding how the vessel’s structural integrity evolves under operational conditions. Additionally, the study seeks to examine and classify the major macroscopic damage mechanisms in composite cryogenic pressure vessels, providing a comprehensive understanding of the different failure modes that could affect the vessel’s overall performance and safety.
Geometry of the investigated composite cryogenic pressure vessel

Lamination details of the investigated composite cryogenic pressure vessel

Mechanical properties of IM7/PEEK composite material (adapted from Ref. [Reference Grogan, Ó Brádaigh, McGarry and Leen41]

The finite element model of the composite cryogenic pressure vessel is developed using shell elements (SHELL181). Due to the relatively large dimensions of the investigated pressure vessel, an effort has been made to keep the element size as low as possible, without sacrificing accuracy. In this regard, a mesh convergence study was carried out by varying the number of finite elements from 2,816 to 70,400. The stiffness degradation parameters were fixed across all mesh configurations to isolate the effect of element size, with values d ft = 0.92, d fc = 0.92, d mt = 0.40, and d mc = 0.40, according to the previous validation studies. To monitor the vessel’s response, the radial displacement at the center of the cylindrical section and the axial displacement at the right dome-end are plotted as a function of internal pressure. The results show that convergence is achieved for element size 10 mm, i.e. 17,600 elements, as the variation in average radial and axial displacement falls below 0.05%, as can be seen in Figs. 10 and 11.
Mesh convergence analysis for the radial displacement of the cryogenic pressure vessel.

Mesh convergence analysis for the axial displacement of the cryogenic pressure vessel.

The finite element model of the composite pressure vessel is presented in Fig. 12. The vessel is modelled as simply supported, where the left-side edge node at the dome end is fully fixed ( ${u_x} = {u_y} = {u_z} = ro{t_x} = ro{t_y} = ro{t_z} = 0$
), while the right-side edge node at the dome end is allowed to move only in the axial direction, allowing free expansion and contraction of the vessel in the radial direction. Internal pressure and temperature are applied to the inner surface of the model.
${u_x} = {u_y} = {u_z} = ro{t_x} = ro{t_y} = ro{t_z} = 0$
), while the right-side edge node at the dome end is allowed to move only in the axial direction, allowing free expansion and contraction of the vessel in the radial direction. Internal pressure and temperature are applied to the inner surface of the model.
Finite element model of the investigated composite cryogenic pressure vessel.

6.1 Application of internal pressure to the tank
In the first loading scenario, the composite cryogenic vessel is subjected to internal pressure under ambient thermal conditions (296 K). The pressure is gradually increased up to a maximum of 15 bar, with a step increment of 0.15 bar per substep, aiming to define the maximum allowable operating pressure. The progressive pressure application allows for fine-grained capture of the vessel’s response and the identification of damage initiation thresholds. The deformation profile of the vessel at the onset of damage is illustrated in Fig. 13, showing the radial expansion field at the first-ply-failure condition.
Radial displacement of the investigated pressure vessel at the first-ply- failure during pressurisation.

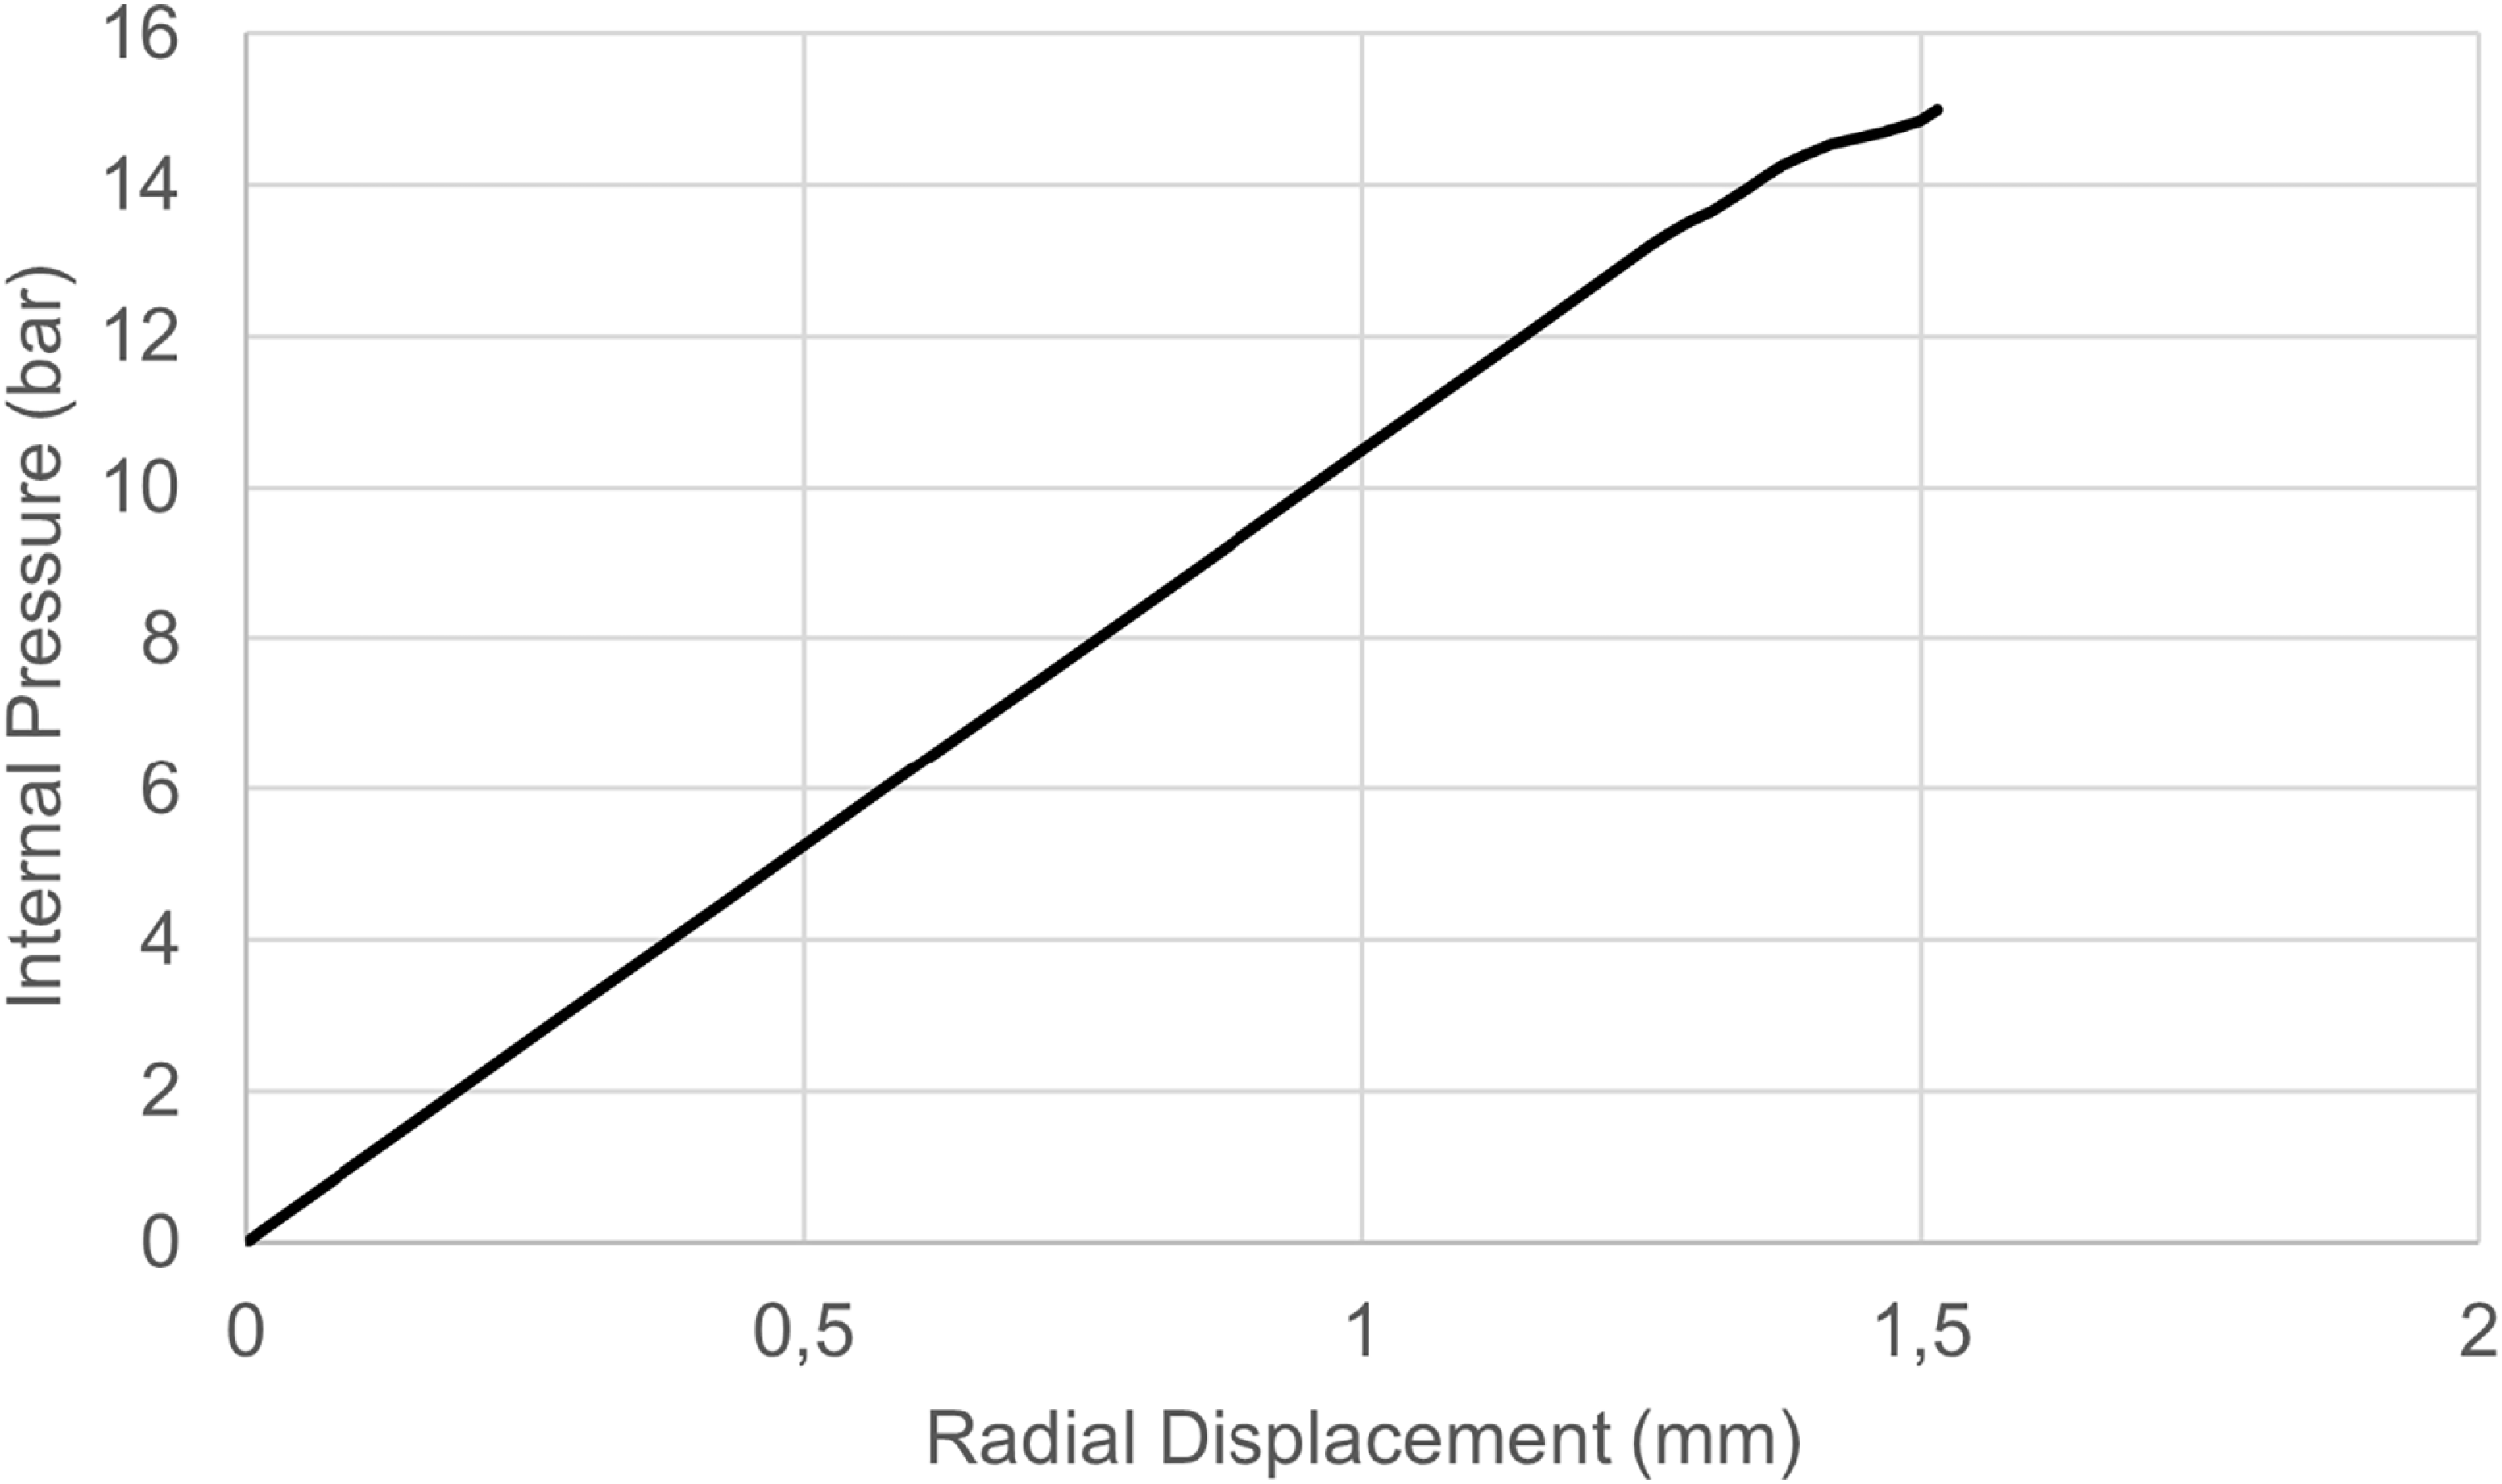
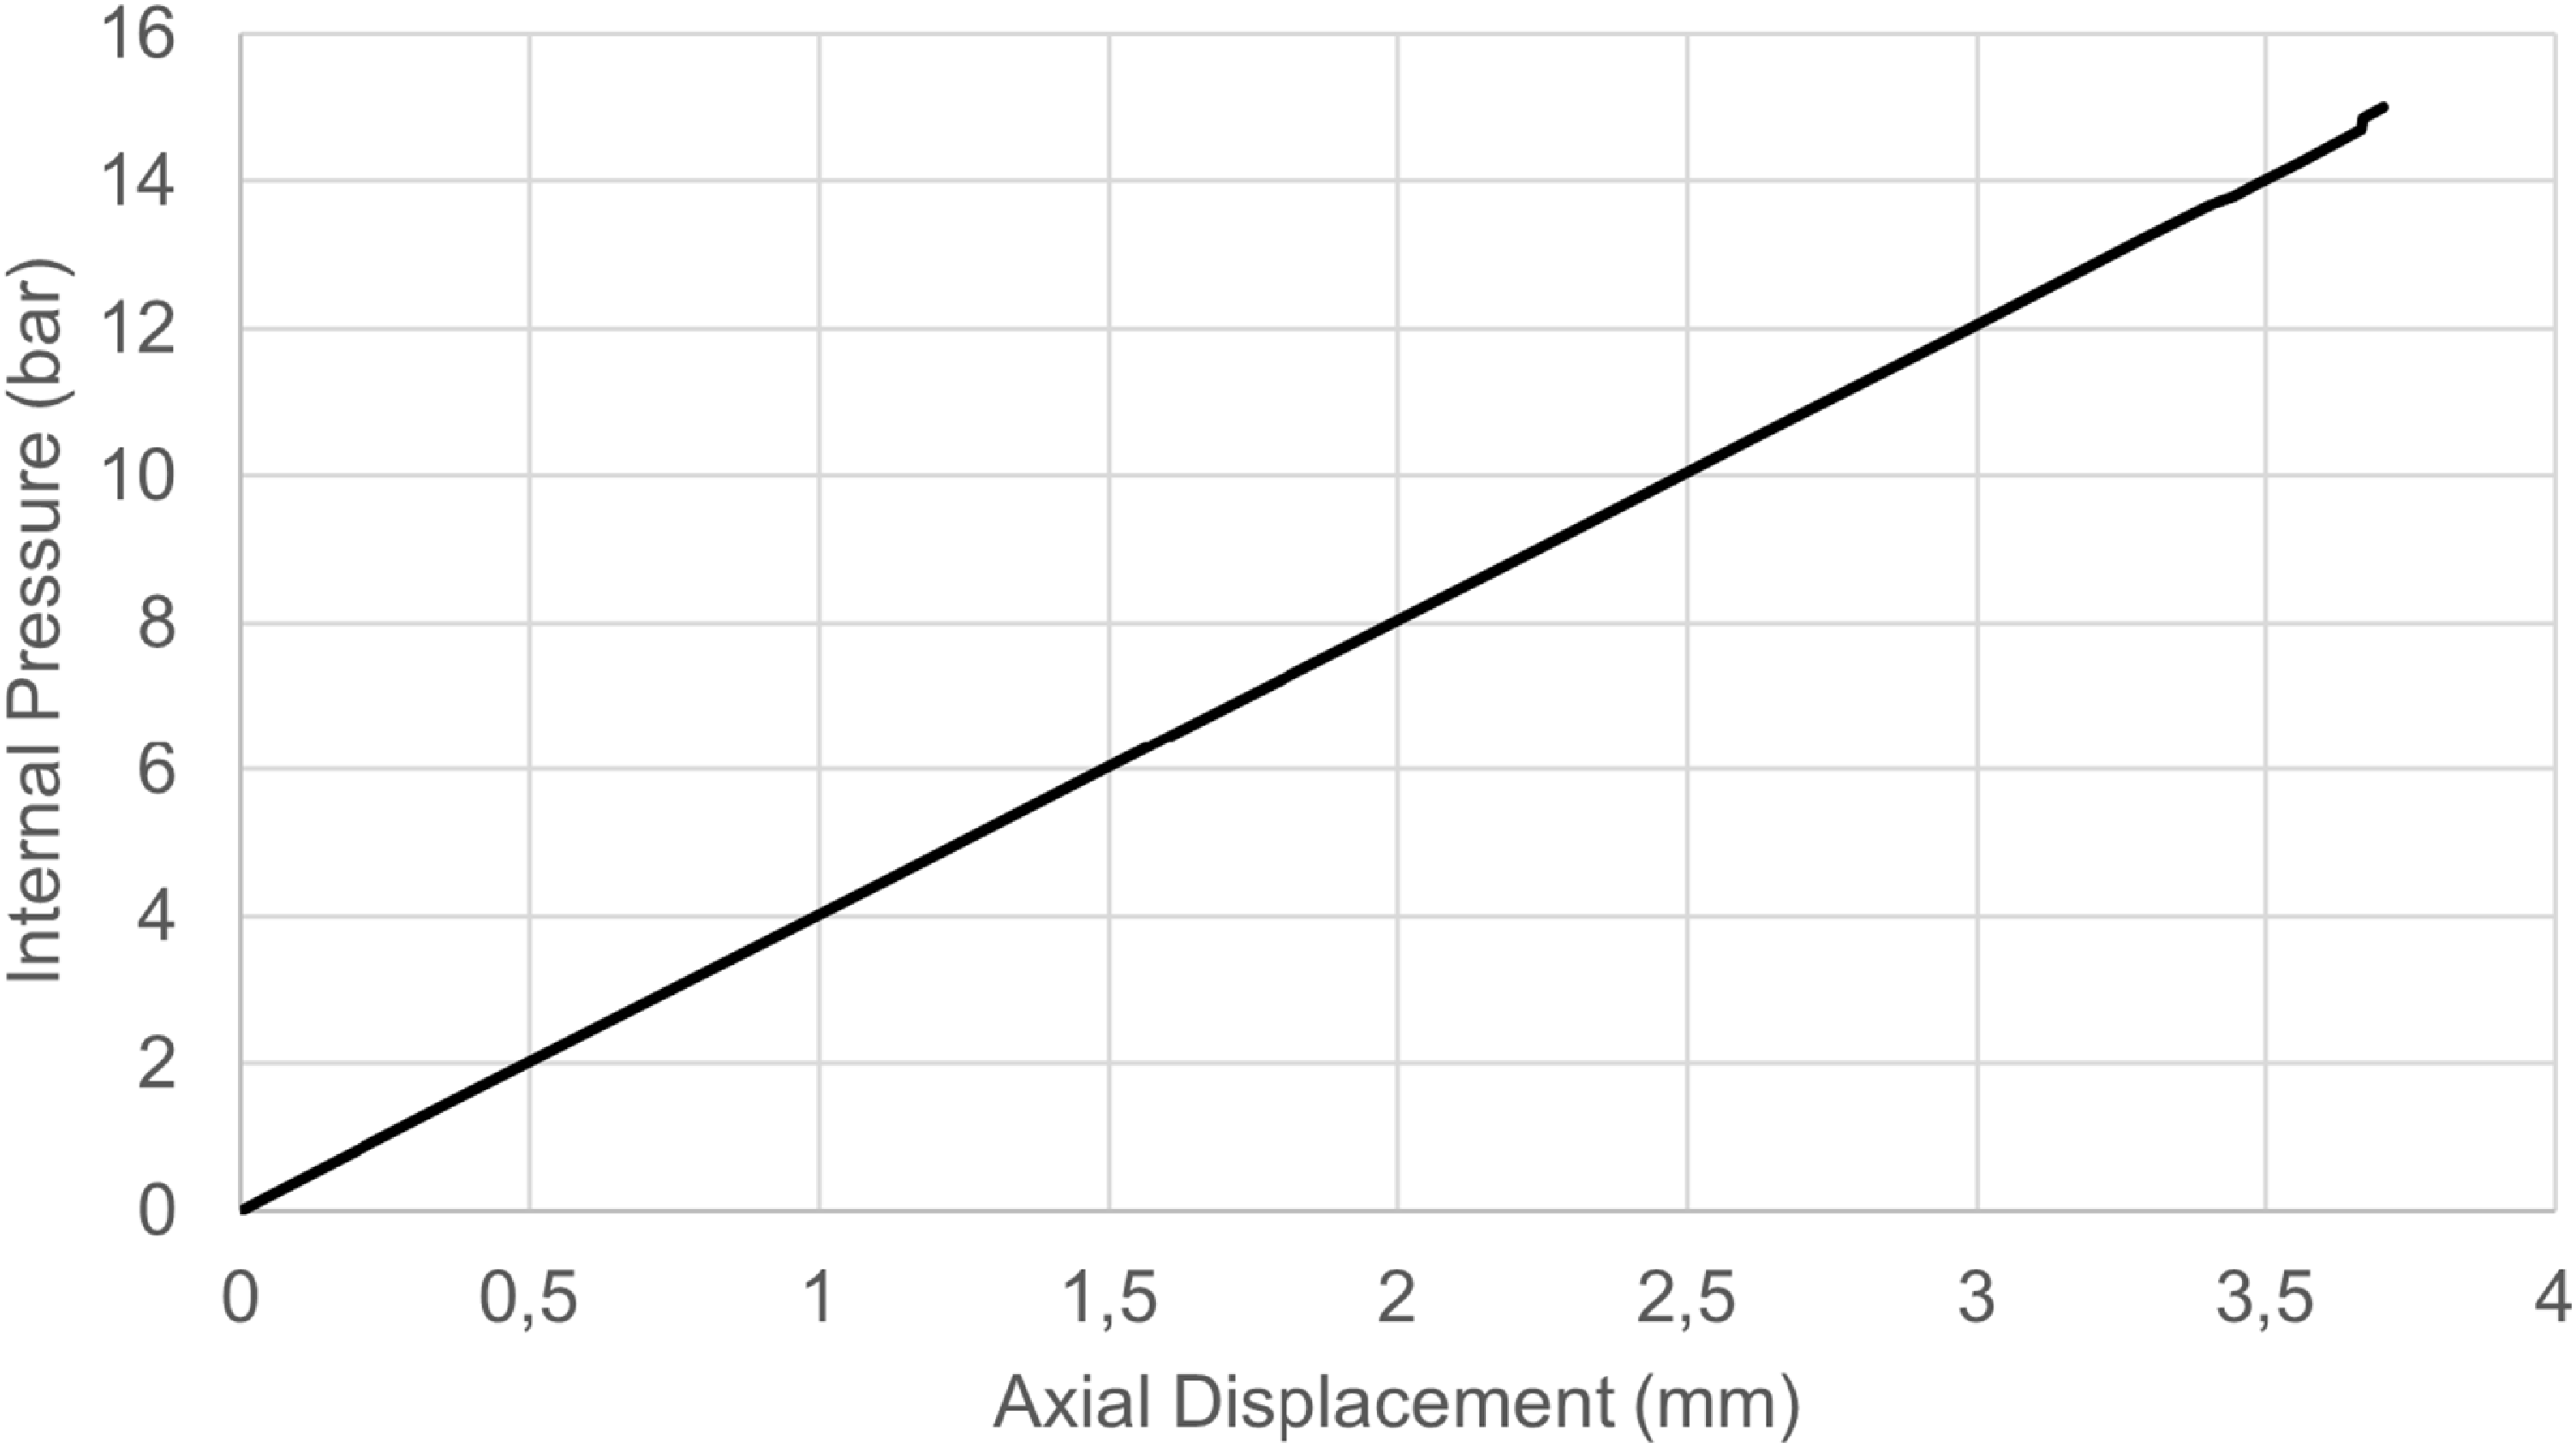
In Fig. 14, the average radial displacement at the center of the cylindrical section, and in Fig. 15, the axial displacement at the right dome end is plotted as a function of internal pressure.
Average radial displacement versus internal pressure graph.

Average axial displacement versus internal pressure graph.

The first-ply failure is observed at 13.35 bar, corresponding to matrix cracking in the outer 0° layer. Damage continues to propagate in neighbouring 0° layers, with additional failures recorded at 13.5 bar. A second major event occurs at 14.25 bar, with matrix failure initiating in the ±45° oriented layers. This is followed by progressive damage in adjacent ±45° plies at 14.4 bar and 14.55 bar. At 14.7 bar, widespread matrix failure is observed across multiple plies, indicating extensive damage accumulation across the laminate. Visual inspection of the failure contours reveals that initial damage is triggered near the geometry transition between the cylindrical section and the dome, as can be seen in Fig. 16. This region experiences stress concentrations due to the curvature change and acts as the critical initiation site for matrix cracking under internal pressure. Despite the extensive propagation of matrix damage, no fibre failure is detected, indicating that the reinforcing fibres retain their structural integrity throughout the applied loading. Importantly, no damage is observed in the dome sections throughout the loading process. This is attributed to the more favourable stress distribution and fibre alignment in these regions. Additionally, the dome’s curvature reduces the magnitude of hoop and axial stresses compared to the cylindrical section, further enhancing its structural capacity under pressure.
First-ply failure: matrix cracking in 0o layer at cylinder-dome interface.

6.2 Application of cryogenic temperature to the tank
In the second loading scenario, the composite tank is subjected to a uniform reduction in internal temperature, from a reference value of 296K. The temperature drop is applied incrementally at 4K per substep, ensuring a quasi-static cooling process. This simplified approach assumes steady-state thermal conditions and uniform temperature distribution, which is consistent with the limitations of the employed simulation framework. Although the modeling framework is capable of incorporating more detailed, spatially varying thermal maps through cooling with transient thermal analyses or CFD-based temperature maps, such extensions are considered as a follow-on investigation. Instead, the current focus is placed on evaluating the vessel’s mesoscale mechanical response to a homogeneous cryogenic environment, which remains a standard approximation in many preliminary design assessments. Future work will aim to integrate experimentally measured or CFD-derived thermal distributions, enabling more realistic introduction of temperature distribution loading.
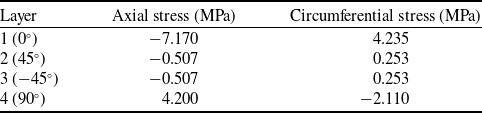
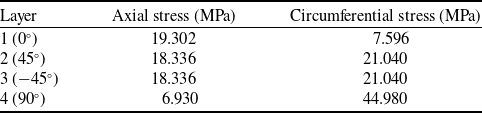
Figure 17 presents the radial contraction field at the onset of first-ply failure, while Table 9 shows the axial and circumferential stresses for the first four layers of the cylindrical section, highlighting the internal stress redistribution at a substep prior to damage initiation.
From Table 9, it is evident that the stress states vary significantly among plies, alternating between tension and compression. This behaviour arises due to the mismatch in CTE between the matrix and fibre directions of the composite. For instance, in Layer 1, oriented at 0°, the axial direction (fibre axis) experiences compressive stress, while tensile stress appears in the circumferential direction. This occurs because the fibre direction has a much lower CTE than the transverse direction, leading to differential contraction and stress buildup during cooling. The adjacent plies, especially those with 90° orientation, provide restraint in specific directions, further intensifying local stress concentrations.
Axial and circumferential stresses for the cylindrical section of the investigated pressure vessel

Radial displacement of the investigated pressure vessel at the first-ply failure during cooling.

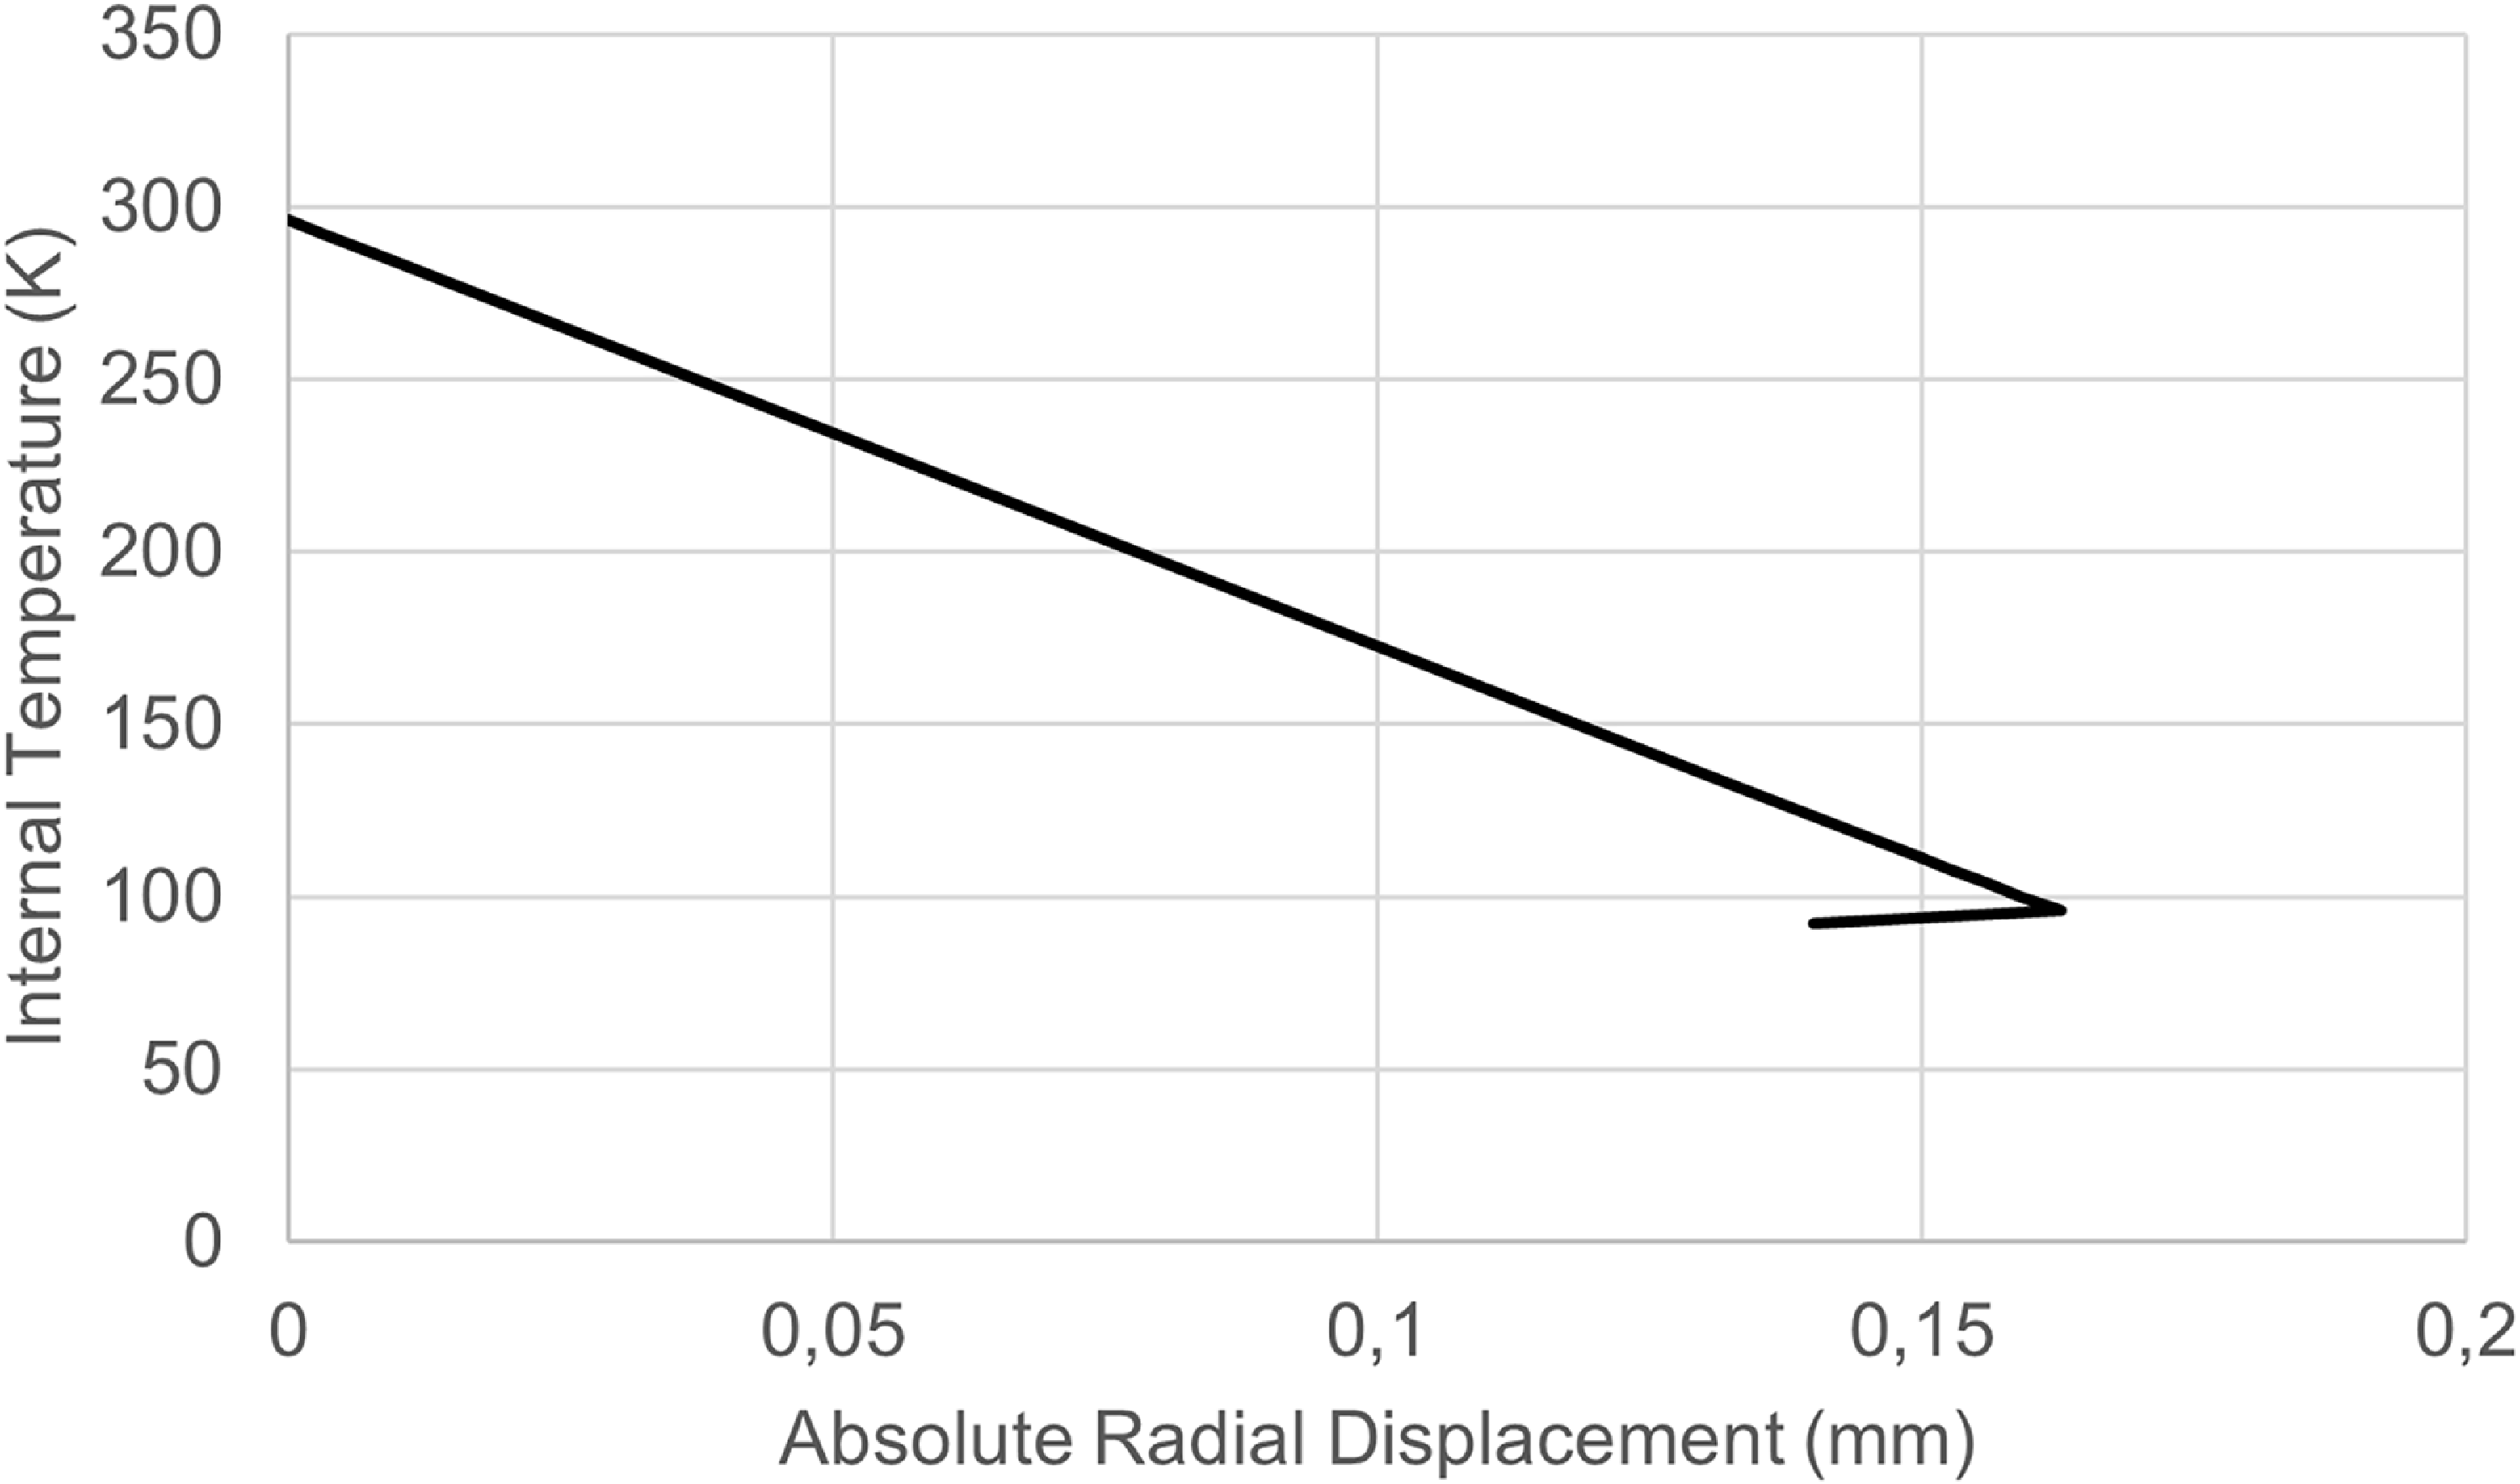
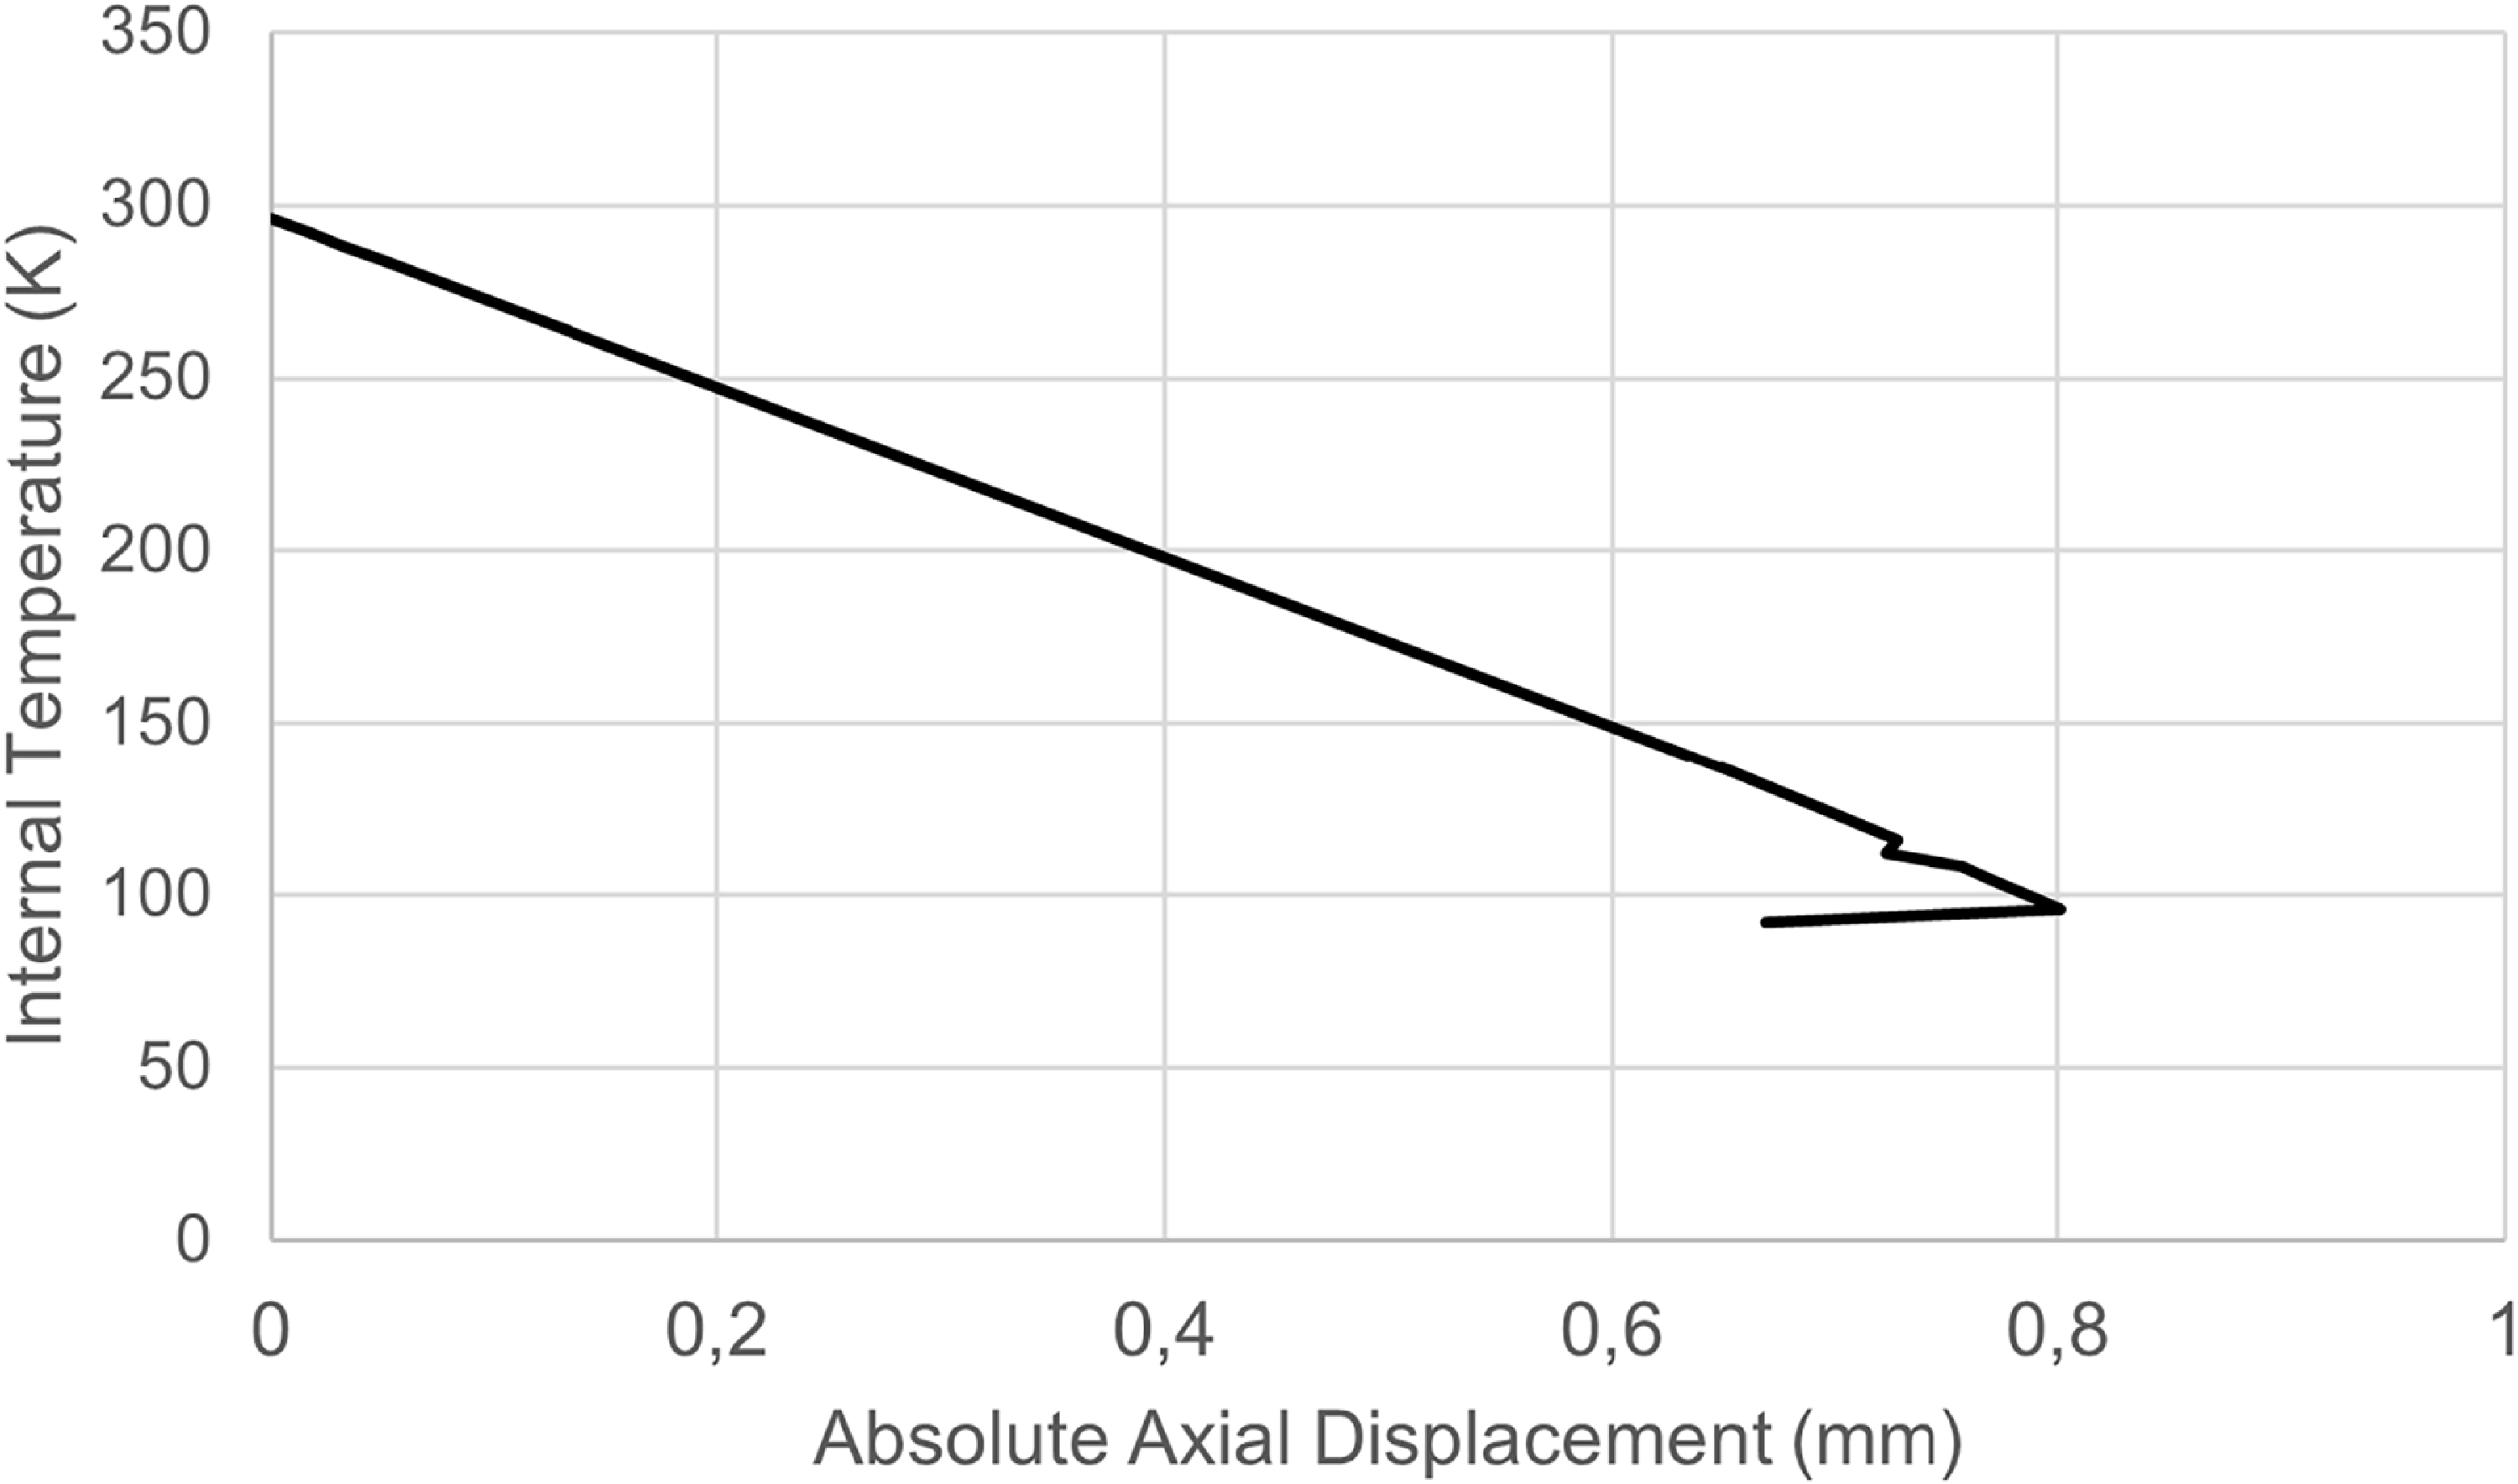
Absolute radial displacement versus internal temperature graph.

Figure 18 shows the vessel’s absolute radial displacement, while Fig. 19 shows the vessel’s absolute axial displacement as a function of internal temperature. Matrix-dominated damage initiation is observed at 96K, where matrix cracking begins in the innermost plies. As the temperature continues to decrease, damage progressively propagates to the outer plies, and by 92K, complete matrix failure is observed across all layers. Despite the widespread matrix degradation, no fibre failure is detected throughout the cooling process, confirming that the load-bearing carbon fibres maintain their structural integrity under thermal loading. Notably, the dome sections remain completely undamaged, further supporting the finding that their favourable curvature and [±45] quasi-isotropic layup enhance resilience against cryogenically induced stress concentrations. This also aligns with the previous observations from the internal pressure case.
Absolute axial displacement versus internal temperature graph.

Although the applied thermal loading assumes a uniform, steady-state temperature distribution, this simplification enables direct insight into the stress redistribution and damage evolution driven by anisotropic thermal contraction. The approach offers a reliable and computationally efficient baseline for analysing progressive damage in composite cryogenic tanks and facilitates subsequent assessment under coupled thermomechanical loading conditions.
6.3 Combined application of internal pressure and cryogenic temperature to the tank
In the third loading scenario, the composite pressure vessel is subjected to both increasing internal pressure and decreasing internal temperature, to simulate a representative thermomechanical loading scenario. The reference temperature is 296K, while the internal pressure ranges from 0 to maximum expected operational pressure (MEOP). The pressure increment per substep is set at 0.05 bar, and the temperature reduction occurs at a rate of 2K per substep. This loading configuration enables the evaluation of stress interactions and damage evolution under realistic operating conditions for cryogenic hydrogen tanks.
As shown in Table 10, the superposition of thermal contraction and internal pressurisation results in a complex stress state within the laminate. For instance, in Layer 1 (0°), both axial and circumferential stresses become tensile as the pressure increases and overcomes the contraction induced by cryogenic temperatures. Layers at ±45° orientation experience elevated shear and biaxial stresses, while the 90° layer exhibits high circumferential tension.
Axial and circumferential stresses for the cylindrical section of the investigated pressure vessel

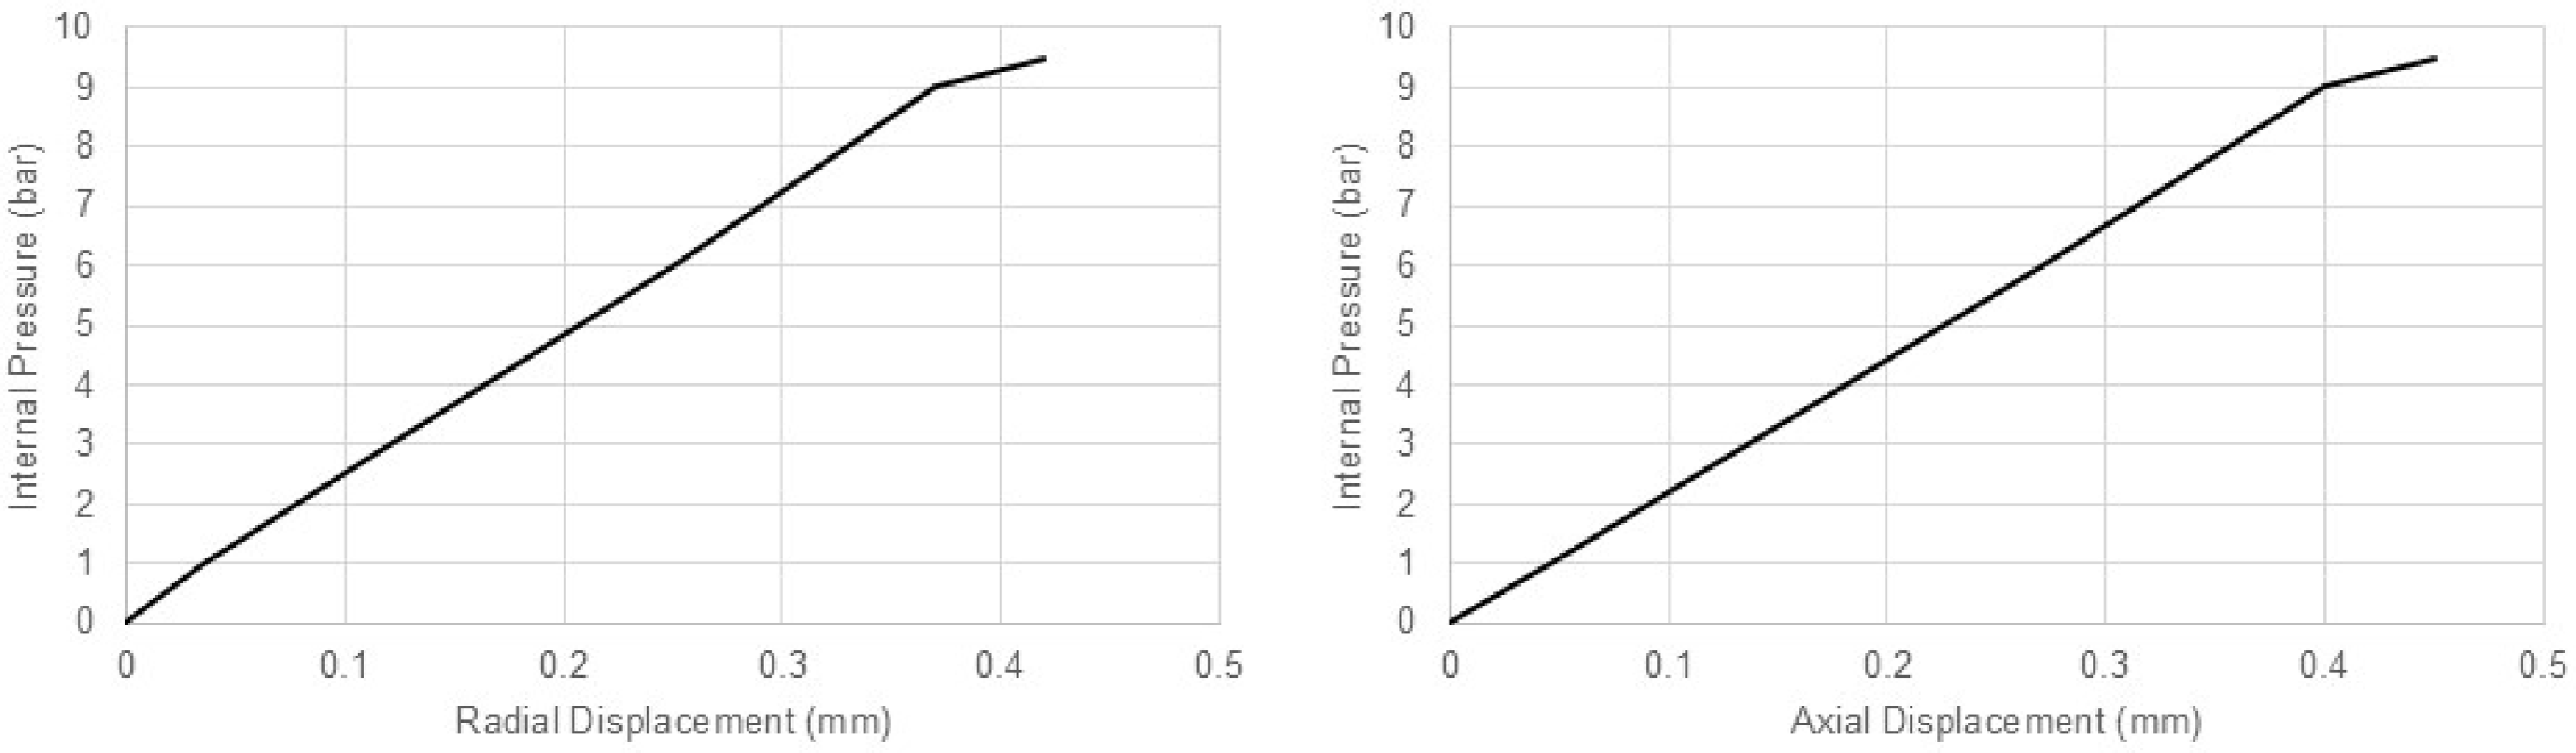
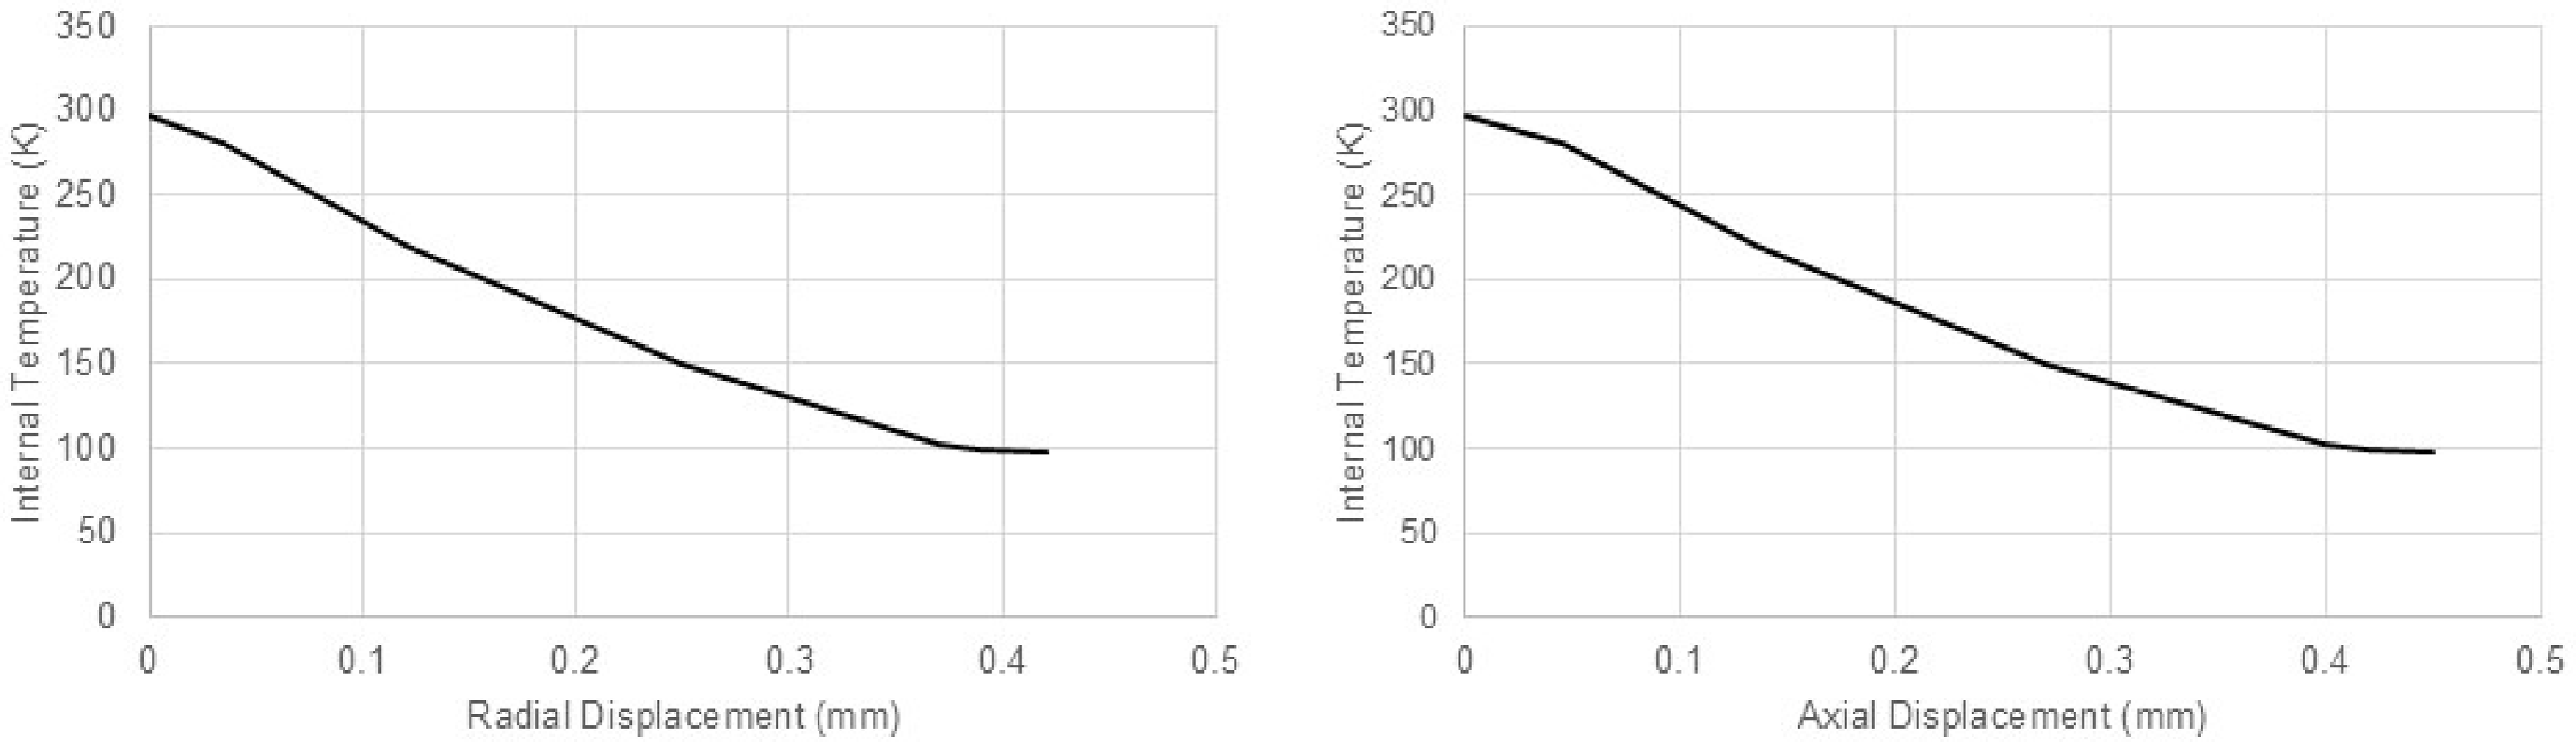
The vessel’s radial and axial displacements are plotted as a function of internal pressure and temperature in Figs. 20 and 21. Matrix-dominated damage initiation occurs at an internal pressure of 9.2 bar and a temperature of 98K, with first-ply failure observed simultaneously in multiple 0° oriented layers. As pressure and temperature continue to evolve, matrix failure rapidly propagates to additional plies. A final stage of matrix damage is observed at 9.5 bar and 96K, involving the $ \pm 45^\circ $
and 90° oriented plies. At this stage, matrix damage has propagated throughout the composite laminate.
$ \pm 45^\circ $
and 90° oriented plies. At this stage, matrix damage has propagated throughout the composite laminate.
Axial displacement (left) and radial displacement (right) versus internal pressure.

Axial displacement (left) and radial displacement (right) versus internal temperature graphs.

Despite this widespread matrix degradation, no fibre failure is detected throughout the combined thermomechanical loading process. The carbon fibres retain their load-carrying capability, as confirmed by the absence of failure indicators. Notably, matrix cracking is observed to initiate near the cylinder-to-dome transition, where curvature-induced stress concentrations act as damage initiation sites, consistent with previous case studies. Additionally, no structural damage is observed in the dome region, confirming the enhanced stress tolerance provided by its quasi-isotropic [±45] layup and geometrical configuration under cryogenic and internal pressure loading. However, such matrix cracking can be considered the ultimate failure condition for such a tank, as it increases the risk of hydrogen permeation and pressure loss, that should be avoided in order to maintain structural integrity. Therefore, the thermomechanical loading level should be limited during operation at lower pressure and temperature values, defined by appropriate safety factors, such that any matrix failure is completely avoided.
7.0 Conclusions – Discussion
In the present study, a numerical methodology for the investigation of the thermomechanical behaviour of composite cryogenic hydrogen tanks was developed and applied to assess the structural response of a full-scale liner-less vessel under representative loading conditions. The proposed approach is based on a finite element framework enhanced with a PDM strategy at the ply level, allowing for detailed simulation of intra-laminar failure mechanisms under both mechanical and thermal loads.
The methodology was first validated against experimental data from two well-established, purely mechanical loading benchmark studies, specifically, an open-hole tension test and a composite pipe burst test. The simulation results showed close agreement with the experimental load – displacement response, failure loads and strain distributions, confirming the accuracy and robustness of the implemented failure criteria and stiffness degradation laws. These validation cases established the credibility of the approach for its application to more complex composite structures.
Following the initial validation, the methodology was applied to simulate a representative cryogenic composite pressure vessel subjected to three distinct loading scenarios, i.e. internal pressure, cryogenic temperature and combined cryogenic-mechanical loading. For each case, detailed insight was gained into the evolution of damage, failure initiation locations and the progression of matrix degradation throughout the laminate.
In all load cases, the dominant failure mode was matrix cracking due to tensile stresses, particularly in the cylindrical section of the vessel. The initial damage consistently initiated at the cylinder-to-dome transition, where curvature-induced stress concentrations were observed. Under cryogenic temperature alone, matrix damage initiated in the innermost plies at approximately 96K and propagated to all layers by 92K. When only internal pressure was applied, first-ply failure occurred at 13.35 bar, with progressive matrix cracking through the laminate, yet no fibre failure was detected. Under combined pressure and temperature loading, matrix failure initiated much earlier: at 9.2 bar and 98K, and propagated rapidly to all layers by 9.5 bar and 96K. Despite the widespread matrix damage observed in all three cases, the carbon fibres remained structurally intact throughout, confirming the vessel’s substantial load-bearing capacity post-matrix failure.
These findings suggest that while the vessel can retain structural integrity even under extensive matrix degradation, the operation limits must be defined by the leakage prevention criterion, particularly under combined loading conditions. This has direct implications for cryogenic hydrogen containment, where sealing performance is as critical as load capacity. The study highlights the key role of thermal expansion mismatch between layers in generating internal stresses during cooldown, and the importance of laminate design in mitigating damage evolution.
Given that matrix failure is the critical failure mode under combined thermomechanical loading, the developed analysis methodology can be iteratively applied to lead to optimised designs and define appropriate selection of alternative stacking sequences that prevent matrix-dominated failure. Furthermore, improvements in resin systems to increase cryogenic fracture toughness may significantly enhance performance.
In conclusion, this study presents a computationally efficient framework for simulating the progressive damage behaviour of composite cryogenic pressure vessels. The methodology has been validated against coupon- and subcomponent-scale experimental data, demonstrating its ability to capture key failure mechanisms such as matrix cracking and damage propagation. However, experimental validation at the full-scale simulation is required to fully establish its predictive capabilities, before its application in real composite tank structures. In this context, the forthcoming full-scale experiments of the H2ELIOS project will provide the reference for extending the validation of the present framework.
Acknowledgements
The project H2ELIOS is supported by the Clean Aviation Joint Undertaking and its members, funded by the European Union. However, the views and opinions expressed are those of the author(s) only and do not necessarily reflect those of the European Union or Clean Aviation Joint Undertaking. Neither the European Union nor the granting authority can be held responsible for them.
Competing interests
The authors have declared no conflict of interest.


 Open access