


Introduction
The agricultural sector is gradually incorporating regenerative and climate-smart practices as a means to mitigate the deleterious effects of a changing climate and to sustain production capacity into the future. Despite prior research showing that regenerative practices such as cover cropping can yield numerous benefits, there is a lack of widespread adoption of such practices among U.S. producers (Clay et al., Reference Clay, Perkins, Motallebi, Plastina and Farmaha2020).Footnote 1 With commodity and livestock production becoming increasingly vulnerable to the effects of climate change, the agricultural industry has a need to promote and implement regenerative practices to guarantee and intensify production for future generations. The massive scope and reliability of agriculture to weather constraints firmly places the sector as one of the most susceptible to the negative impacts of a changing climate (Malhi, Kaur, and Kaushik, Reference Malhi, Kaur and Kaushik2021). This liability has concurrently intensified pressure on agricultural producers and their operations to maintain food security needs and prevent further degradation of natural resources while also facing unstable economic conditions and growing demand (Key et al., Reference Key, Burns and Lyons2019; Piñeiro et al., Reference Piñeiro, Arias, Dürr, Elverdin, Ibáñez, Kinengyere, Opazo, Owoo, Page, Prager and Torero2020; Dohlman et al., Reference Dohlman, Hansen and Chambers2024; Sands et al., Reference Sands, Ronald, Meade, Seale, Robinson and Seeger2023). While the definition of regenerative agriculture is not widely agreed upon among scholars and practitioners, the focus in this article is a combination of the process and outcome dimensions of regenerative agriculture. Specifically, how the implementation of a regenerative process (e.g., cover cropping) may generate beneficial outcomes in the form of ecosystem services for agricultural producers (e.g., additional soil water retention, soil carbon sequestration, reduced erosion, etc.) (Gosnell et al., Reference Gosnell, Gill and Voyer2019; Newton et al., Reference Newton, Civita, Frankel-Goldwater, Bartel and Johns2020).
Using cover crops in place of bare fallow periods can be used to promote numerous benefits for soil health such as erosion protection, increase soil organic matter, reduce soil compaction, and stabilize or increase soil organic carbon (Bergtold et al., Reference Bergtold, Maddy, Ramsey and Williams2019; Lewis et al., Reference Lewis, Burke, Keeling, McCallister, DeLaune and Keeling2018; Snapp et al., Reference Snapp, Swinton, Labarta, Mutch, Black, Leep, Nyiraneza and O’Neil2005). Adoption of cover cropping is influenced by a range of perceived factors by producers. For instance, Wang et al. (Reference Wang, Xu, Kolady, Ulrich-Schad and Clay2020) found that compared to short-term users of cover crops, those who have used the practice for 10 or more years perceived an increase in profitably from adopting cover crops. Short-term users may not perceive an increase in profitability, but producers may continue to adopt cover cropping due to perceived long-term benefits such as improvements in soil health and reduction in erosion (Plastina et al., Reference Plastina, Liu, Miguez and Carlson2020; Wang et al., Reference Wang, Xu, Kolady, Ulrich-Schad and Clay2020). Although cost share programs and incentive payments are designed to ease the financial burden of adopting conservation practices (i.e., cover cropping), Wang et al. (Reference Wang, Xu, Kolady, Ulrich-Schad and Clay2020) found producers who received cost share to offset initial expenses did not indicate a higher perceived profitability compared to self-funded producers. Additionally, producers may be likely to discontinue the use of cover crops when they perceive additional costs and management difficulties to be associated with adoption (Dunn et al., Reference Dunn, Ulrich-Schad, Prokopy, Myers, Watts and Scanlon2016). Despite these challenges, the findings underscore the importance of understanding producers’ varied perceptions of cover cropping to effectively tailor strategies aimed at increasing adoption.
The adoption of certain practices has also shown to be affected by various producer demographic and farm characteristics. Lu et al. (Reference Lu, Ranjan, Floress, Arbuckle, Church, Eanes, Gao, Gramig, Singh and Prokopy2022) found that both higher levels of education and larger farm size were positively associated with adoption of conservation practices. Producer behaviors of prior conservation practice use or current use were also predictors of actual adoption of additional conservation practices. A more thorough understanding of these dynamics is essential for the development of effective incentives and policies that encourage broader adoption of these practices among producers. Producers also consider different factors when making their initial adoption decision compared to the intensity in which the practice is implemented, and creating clear pathways for scaling cover cropping will require addressing these diverse factors, ensuring that tailored incentives are in place to meet the unique needs and circumstances of different producer groups (Thompson et al., Reference Thompson, Reeling, Fleckenstein, Prokopy and Armstrong2021). Additionally, Bergtold et al. (Reference Bergtold, Duffy, Hite and Raper2012) found that producers who rent their land are less likely to adopt cover crops while those who irrigate their crops and perceive more environmental benefits from cover cropping are more likely to adopt the practice. This prior research in adoption of conservation practice suggests that both producer demographic factors and various farm characteristics are crucial in shaping producer decisions regarding adoption of certain practices.
Total acres planted to cover crops in the U.S. increased 50% from 2012 to 2017, and the 2022 Census of Agriculture shows a 17% increase from 2017 to 2022 though much of the increased use of cover crops remains isolated to the Eastern United States (Wallander et al., Reference Wallander, Smith, Bowman and Claassen2021; U.S. Department of Agriculture, 2024a; U.S. Department of Agriculture, 2024b). However, many producers remain hesitant to adopt this practice because of associated costs and uncertainties (Plastina et al., Reference Plastina, Liu, Sawadgo, Miguez, Carlson and Marcillo2018). Direct costs associated with adopting cover crops may include seed, planting, termination, and additional equipment while indirect costs include heterogenous effects on following cash crops and foregone opportunities (Bergtold et al., Reference Bergtold, Maddy, Ramsey and Williams2019). These costs will also vary depending on site-specific farm characteristics, cover crop variety, cost-sharing support programs, and other exogenous impacts such as precipitation and related weather conditions. Conservation programs such as the Environmental Quality Incentive Program (EQIP) and the Conservation Stewardship Program (CSP) along with various state and private programs provide supplemental economic incentives for qualifying producers utilizing cover crops, but economic savings are contingent upon factors such as the variety of cover crop and variable input prices. For example, EQIP funding for producers can cover up to 75% of the total cost of implementing conservation practices and the Natural Resources Conservation Service (NRCS) estimated the cost of implementing a basic (organic and non-organic) cover crop in Texas at $33.74/acre for the 2022 fiscal year (Park et al., Reference Park, Rejesus, Aglasan, Che, Hagen and Salas2022;, Natural Resources Conservation Service, 2022).Footnote 2 Based on separate state guidelines, eligible producers enter a contract and implement the EQIP plan developed by both the NRCS and the producer, and payment rates for conservation practices are evaluated and determined each year within the fiscal cycle for separate states (Park et al., Reference Park, Rejesus, Aglasan, Che, Hagen and Salas2022). Although cost-share funding may influence the financial viability of adopting cover crops, producers may still face additional expenses and risk from adoption coupled with uncertainty regarding their net returns.
While certain benefits may be realized through the adoption of cover cropping, previous research has highlighted the associated risk of the practice and shown mixed outcomes regarding net returns to producers. Net returns with cover cropping are affected by several factors, including: the type of cover crop, timing of planting and termination, employed management practices, and local climate and soil conditions. Studies have shown that even with cost-share programs and feedstock savings for integrated crop-livestock operations, the financial gains from cover cropping are generally insufficient to offset incurred expenses resulting in negative net returns, especially in the initial years of adoption (Plastina et al., Reference Plastina, Acharya, Marcos, Parvej, Licht and Robertson2023: Thompson et al., Reference Thompson, Armstrong, Roth, Ruffatti and Reeling2020).Footnote 3 Moreover, variable yield impacts on subsequent cash crops and added opportunity costs of managing an additional crop in the absence of fallow periods introduce additional risk to producers that may hinder wide-scale adoption of cover cropping (Boyer et al., Reference Boyer, Lambert, Larson and Tyler2018; Plastina et al., Reference Plastina, Liu, Miguez and Carlson2020; Deines et al., Reference Deines, Guan, Lopez, Zhou, White, Wang and Lobell2023). Consequently, while cover cropping may provide potential long-term advantages, the economic challenges to producers in the short-term and concurrent risks may impede more extensive adoption of the practice.
In addition to valuable on-farm and economic benefits for producers, cover crops can also contribute to positive societal benefits through reductions in negative externalities (e.g., water nitrification and biodiversity loss). Established row-cropping and monoculture systems not only contribute to soil erosion and loss of soil nutrients, but also promote negative environmental outcomes such as water pollution from chemical leakage (e.g., nitrogen fertilizer) (Carlson & Stockwell, Reference Carlson and Stockwell2013; Paudel & Crago, Reference Paudel and Crago2021). Previous research has suggested that the use of cover crops on agricultural lands could lead to a reduction of nonpoint-source pollution from agricultural sources by reducing runoff, sediment loss, and nitrate leaching by utilizing residual nitrogen and water inputs (Blanco-Canqui, Reference Blanco-Canqui2018).
Though the advantages of utilizing cover crops are widely known and recognized by soil and water conservation communities, the percentage of cropland planted to cover crops remains limited in the Southern Great Plains Region of the U.S. while the practice remains more prevalent along the eastern coast of the country (U.S. Department of Agriculture, 2024b). For example, Texas experienced the largest absolute increase in acreage planted to cover crops from 2017 to 2022, but higher adoption rates are relatively isolated to regions where irrigation is more prevalent (e.g., the Texas High Plains that sits above the Ogallala Aquifer) (U.S. Department of Agriculture, 2024b).Footnote 4 Adoption of cover cropping remains limited on dryland production systems in the Great Plains because of limited precipitation and the use of fallow periods to conserve soil moisture (Obour et al., Reference Obour, Simon, Holman, Carr, Schipanski, Fonte, Ghimire, Nleya and Blanco‐Canqui2021). While many research efforts have highlighted the positive outcomes associated with cover cropping the barriers to adopting the practice for agricultural producers are far less emphasized. In this context, this study aims to evaluate how various personal demographic and farm characteristics affect cover crop adoption and explore strategies to overcome adoption constraints. Specifically, the objective of this research is to evaluate the minimum payment levels for adoption of cover crops in the Texas and Oklahoma portions of the Southern Great Plains (SGP) using a double-bounded contingent valuation model.
Data
The data for this research was obtained through mail surveys sent to agricultural producers and landowners from the USDA FSA Farm Payment Files narrowed by county within the project region of Texas and Oklahoma. The survey was mailed out in two separate rounds for the data collection process. The first round was mailed to 1,500 people on May 16, 2022, with a 19.2% overall response rate, and the second round was mailed to an additional 1,500 people on December 9, 2022, with a 26% overall response rate. The survey contained six main sections: (1) farm characteristics; (2) cover crop adoption potential; (3) barriers to adoption of cover crops; (4) reasons producers use cover crops; (5) cover crop species and varieties; (5) approaches to overcoming barriers to adoption; and (6) personal demographics. A screening question was presented at the beginning of the survey to ensure participants were willing to complete the survey to guide subsequent research and extension activities. After removing incomplete responses from both rounds of the survey distribution, a total of 193 usable responses were recorded and 84 were utilized for the WTA analysis after removing those responses who failed to complete the double-bounded contingent valuation questions.
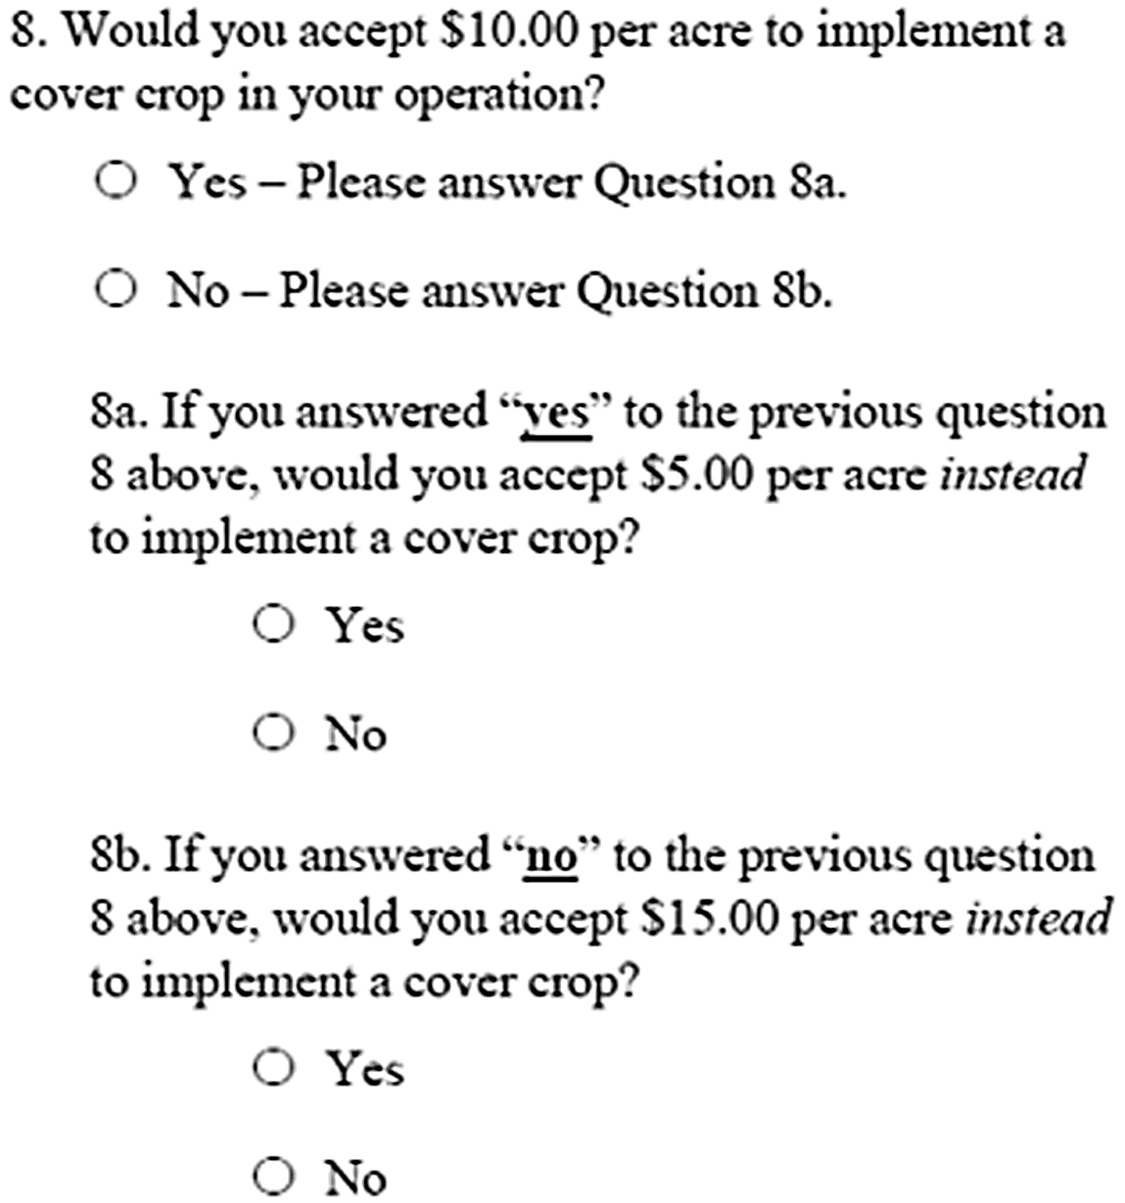
The WTA questions were designed based on the double-bounded contingent valuation method which allows respondents to engage in two rounds bidding to minimize the intervals of their true WTA values. To provide a wider range of offers to participants, three versions of the survey were distributed with each version containing different offers for the WTA questions. Specifically, the initial bid values used in the three versions of the survey were $10/acre, $20/acre, and $30/acre., and an example of the contingent valuation questions is presented in Figure 1. Distributing three versions of the survey, each with different offers, helps account for the variability of cost-sharing support program contracts and estimation of the entire distribution of WTA values more accurately. The initial bid values used in the survey were derived from the EQIP estimated cost of $33.74/acre for implementing a basic cover crop in Texas for the 2022 fiscal year (Natural Resources Conservation Service, 2022). These bid values were then calculated by applying 33%, 66%, and 100% cost-share scenarios, with the resulting amounts rounded for simplicity across the three survey versions.
Example of contingent valuation questions.
Methods
The contingent valuation method is a nonmarket valuation technique and is commonly employed to derive monetary values for non-marketed goods and services. Contingent valuation methods routinely utilize dichotomous choice questions to elicit WTA values (Shrestha & Alavalapati, Reference Shrestha and Alavalapati2003; Geleto, Reference Geleto2011; McGurk et al., Reference McGurk, Hynes and Thorne2020). These questions involve asking respondents to answer a simple yes or no question about accepting a previously determined amount for a specific program, service, or other nonmarket goods. The respondents will state their preference (e.g., if they will adopt a practice if they are offered X amount of dollars) for the presented alternatives. The double-bounded method has been adopted by many researchers because estimates can be improved upon compared to the single-bounded method when respondents engage in two consecutive rounds of bidding (Hanemann et al., Reference Hanemann, Loomis and Kanninen1991; Kanninen, Reference Kanninen1993; Riddel & Loomis, Reference Riddel and Loomis1998). Considerably more statistical evidence is revealed by the follow-up bid, which is based on the response to the first bid, and gives asymptotically more efficient gains compared to the single-bounded method (Hanemann et al., Reference Hanemann, Loomis and Kanninen1991).
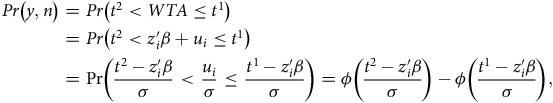
The following econometric framework from López-Feldman (Reference López-Feldman2012) has been adapted for estimating WTA using simple modifications. The model involves dichotomous variables, denoted as y i 1 and y i 2, representing responses to two close-ended questions. For example, y i 1 = 1 and y i 2 = 0 indicate “yes” to the first question and “no” to the subsequent one, and the probability that an individual responds yes to the initial question and no to the following question is expressed as Pr(y i 1=1, y i 2=0|z i ) = Pr(y,n) where y represents “yes” and n represents “no” (the conditional probability on explanatory variables is foregone for generality). Respondent i’s WTA can be written as follows:
 $$WTA_{i}(z_{i},u_{i})=-z^{\prime}_{i}{\beta}+u_{i}\ {\rm{and}}\ u_{i}\sim N(0,\sigma ^{2})$$
Here, z i represents a vector of explanatory variables, β is a vector of parameters, and u i is the error term (López-Feldman, Reference López-Feldman2012). The z i vector contains variables related to personal demographic characteristics and individual farm-level attributes. It is also assumed that an individual will answer “yes” when their WTA is less than a certain bid value (i.e., WTA i < t n ). Using these notions, we have the probability for the respondent answering “yes” to the first question and “no” to the second (one of the four possibilities) given by:
-
1. y i 1 = 1 and y i 2 = 0.
 $$\eqalign{ Pr\left( {y,n} \right) & = Pr\left( {{t^2} \lt WTA \le {t^1}} \right) \cr & = Pr\left( {{t^2} \lt z_i^{\prime}\beta + {u_i} \le {t^1}} \right) \cr & = \Pr \left( {{{{t^2} - z_i^{\prime}\beta } \over \sigma } \lt {{{u_i}} \over \sigma } \le {{{t^1} - z_i^{\prime}\beta } \over \sigma }} \right) = \phi \left( {{{{t^2} - z_i^{\prime}\beta } \over \sigma }} \right) - \phi \left( {{{{t^1} - z_i^{\prime}\beta } \over \sigma }} \right), \cr} $$
where the last expression follows from Pr(a < X < b) = F(b) − F(a). Therefore, using symmetry of the normal distribution we have that:
 $$Pr\left(y,n\right)=\phi \left(z_{i}^{\prime}{\beta \over \sigma }-{t^{2} \over \sigma }\right)-\phi \left(z_{i}^{\prime}{\beta \over \sigma }-{t^{1} \over \sigma }\right).$$
The two response combinations where the respondent answers “yes” or “no” to both dichotomous choice questions do not relate to a preexistent model. Therefore, a likelihood function is constructed to directly estimate β and σ using maximum likelihood estimation (López-Feldman, Reference López-Feldman2012). The following likelihood function should be maximized to estimate the parameters for the model:
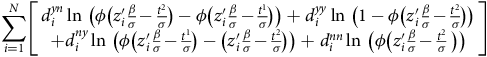 $$\mathop \sum \limits_{i = 1}^{N} \left[ {\matrix{ {d_i^{yn}\ln \ \left( {\phi \left( {z_i^{\prime}{\beta \over \sigma } - {{{t^2}} \over \sigma }} \right) - \phi \left( {z_i^{\prime}{\beta \over \sigma } - {{{t^1}} \over \sigma }} \right)} \right) + d_i^{yy}\ln \ \left( {1 - \phi \left( {z_i^{\prime}{\beta \over \sigma } - {{{t^2}} \over \sigma }} \right)} \right)} \cr { + d_i^{ny}\ln \ \left( {\phi \left( {z_i^{\prime}{\beta \over \sigma } - {{{t^1}} \over \sigma }} \right) - \left( {z_i^{\prime}{\beta \over \sigma } - {{{t^2}} \over \sigma }} \right)} \right) + d_i^{nn}\ln \ \left( {\phi \left( {z_i^{\prime}{\beta \over \sigma } - {{{t^2}} \over \sigma }\;} \right)} \right)} \cr } } \right]$$
Here, d
i
yn
, d
i
yy
, d
i
ny
, d
i
nn
are indicator variables, each taking the value of either one or zero for each individual case, indicating that each individual contributes to the logarithm of the likelihood function in only one of the four parts (López-Feldman, Reference López-Feldman2012). This approach allows for direct estimation of ${\widehat\beta}$
and
${\widehat\beta}$
and ${\widehat\sigma}$
unlike the single-bounded approach. The doubleb command in STATA was used to directly estimate the parameters and accurate WTA estimates with or without control variables can be obtained by incorporating the nlcom command.
${\widehat\sigma}$
unlike the single-bounded approach. The doubleb command in STATA was used to directly estimate the parameters and accurate WTA estimates with or without control variables can be obtained by incorporating the nlcom command.
Results
In this research, we are interested in producer WTA values for adopting cover crops in their operations and the effects of producer demographics and farm characteristics on specific values. The personal demographic summary statistics of the overall sample are shown in Table 1. The average age of the surveyed respondents was 65.5 years old with over half (58%) of respondents being male. Whereas the 2022 Census of Agriculture reports the average age of U.S. producers as 58.1 years old and 36% female, our sample is older with a higher proportion of them being female (U.S. Department of Agriculture, 2024a).Footnote 5 Over 70% of the respondents have an education that extends past a high school degree, and the respondents derived 62.7% of their household income from agricultural production, on average.
Summary statistics of demographic variables

Table 2 shows the summary statistics of the farm characteristics for the respondents. After agreeing to complete the survey, the first question provided to respondents asked them to state whether they own and/or operate land that produces agricultural commodities or whether they own land but lease it for agricultural production. Based on their response, they were then asked to complete the survey from the perspective of an agricultural producer or a non-operating landowner, respectively. The majority of the respondents (>83%) own or operate land that produces agricultural commodities (i.e., agricultural producer) while under 17% owned land but leased it for agricultural production (i.e., non-operating landowner), and the average total years of agricultural production experience among respondents was 52.58. Concerning recent operational decisions, only 34% and 33% of respondents had participated in an incentive program (e.g., EQIP or CSP) or planted cover crops in the previous 5 years, respectively. Respondents were also asked about the use of cover crops by other producers in the area surrounding their operation. On average, the respondents reported that 27.38% of the operations in their proximity had already adopted the use of cover crops. Also, 33% of the respondents did have irrigated acreage on their operation and the average total number of crops grown on each operation was 2.
Summary statistics of farm characteristics

Willingness to accept
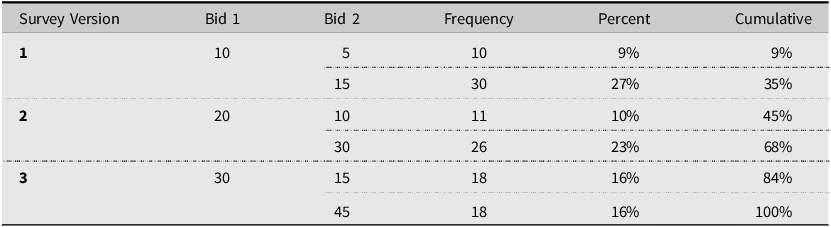
Table 3 illustrates the distribution of bid amounts presented to respondents. The three values of Bid 1, or t 1 from equation 2, represent the first bid value respondents were presented in each of the three survey versions. Bid 2 values, or t 2 from equation 2, were dependent upon responses to the previous bid and were 50% greater and 50% less than Bid 1 when the respondent answered “No” and “Yes,” respectively. In the first version of the survey, for example, respondents were first asked if they would accept $10 per acre to implement a cover crop into their operation. If the respondent answered “No” to a first bid of $10 per acre, their second bid increased by 50%–$15 per acre. If they answered “Yes” to a first bid of $10 per acre, their second bid decreased by 50%–$5 per acre.
Distribution of CV Bid values
The individual responses to the combinations of bid vectors are presented in Table 4. When employing contingent valuation methods, it is important for survey respondents to be receptive to varying bid amounts. In willingness to pay studies, respondents are asked how much money they would give up from their limited budget constraints to purchase a product or service. Therefore, the percentage of “Yes” responses is expected to decrease as the bid values increase. However, the current WTA study asks respondents how much they would have to be compensated (i.e., increase their budget constraint) to adopt a specific practice in their operations. In line with neoclassical economic theory, that suggests individuals seek to maximize their utility or well-being subject to their budget constraints, we expect the percentage of “Yes” responses to increase as bid values increase. This assumption arises from the notion that as producers are compensated with increasing bid amounts, it becomes more favorable to adopt a specific practice in their operations, aligning with the rational decision-making framework central to neoclassical economics.
Responses to each CV bid value
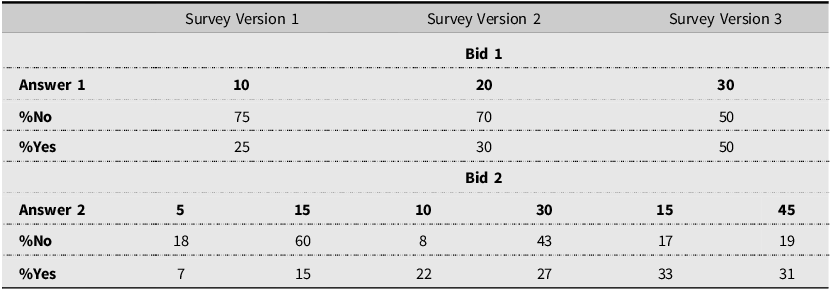
Results from Table 4 show how respondents were willing to engage with varying bid amounts. In Survey Versions 1 and 2 the percentage of “No” responses to the first bid far outweighs the percentage of “Yes” responses which shows the hesitancy among producers of adopting a new practice at lower bid values. The percentage of “No” responses is still greater for those who responded “No” to the first bid and were presented with a 50% higher second bid amount. This reluctance suggests that producers did not observe the compensation as enough to offset the perceived real costs, opportunity costs, or difficulties of adopting the practice. Survey Version 3, which had the highest initial bid value, saw an equal proportion of “Yes” and “No” responses to the first bid value that potentially suggests closer alignment between the offered value and perceived costs and benefits. Also, a higher percentage of “Yes” responses were observed for the second bid values compared to the first and second versions of the survey. These results show useful insights into how responses progressed in relation to increasing or decreasing bid values showing the interaction between compensation and willingness to adopt the specific practice.
The results of the double-bounded WTA model for the entire sample (i.e., both producers and non-operating landowners) are presented in Table 5.Footnote 6 It is important to note that negative coefficients increase WTA while positive values decrease WTA. That is, negative values increase the amount that respondents would have to be paid on a per acre basis to adopt cover crops into their operation. Following Equation 1, mean values of each control variable were used to calculate an overall average WTA value of $26.07/acre with lower and upper bounds of $20.39 and $31.75, respectively. Among the variables expected to influence WTA values, the only negative and statistically significant effects (i.e., values that increase WTA) come from the presence of irrigated acreage and operational status at the 1% and 10% levels, respectively. The largest influence is from the presence of any irrigated acreage where respondents would have to be paid $17.26/acre more to adopt cover crops. Additionally, agricultural producers would require an additional $11.18/acre to adopt cover crops as compared to non-operating landowners. This result is consistent with the fact that non-operating landowners would generally not bear the additional costs of adopting cover crops and, instead, the cost would be the responsibility of those possibly leasing the land.
WTA estimates for cover crop adoption: producers and non-operating landowners
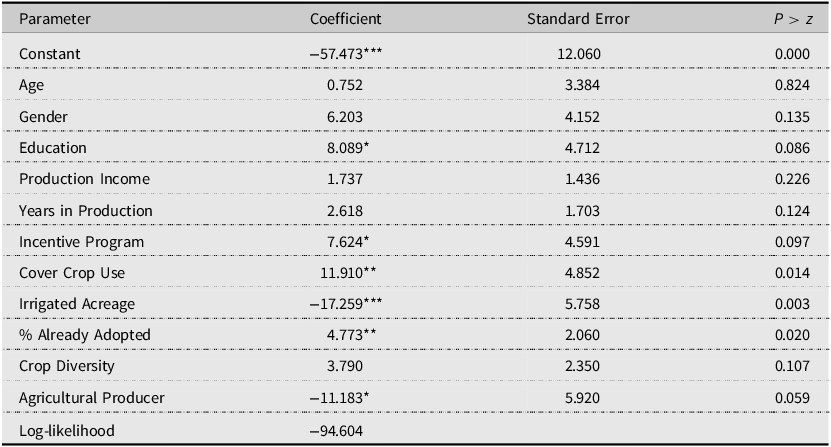
Note: *, **, *** indicate statistical significance at the 10%, 5%, and 1% levels, respectively.
Regarding prior operational decisions, Cover Crop Use and Incentive Program are positive and statistically significant at the 5% and 10% levels, respectively. If respondents had implemented cover crops in their operation or participated in an incentive program in the last five years their WTA decreases by $11.91/acre and $7.62/acre, respectively. Moreover, respondents are also influenced by surrounding operations in their area as % Already Adopted is positive and statistically significant. The higher the percentage of surrounding operations that have already adopted cover crops, the less respondents would be willing to accept to adopt the practice themselves. Also, if respondents have a college education (Education = 1) their WTA decreases by $8.09/acre. While Crop Diversity is not statistically significant, our findings show that willingness to accept decreases with more diversity of crops grown which is consistent with previous literature indicating that more crop diversity is a positive indicator of adoption (Arbuckle & Roesch-McNally, Reference Arbuckle and Roesch-McNally2015; Lu et al., Reference Lu, Ranjan, Floress, Arbuckle, Church, Eanes, Gao, Gramig, Singh and Prokopy2022; Singer et al., Reference Singer, Nusser and Alf2007).
Given our sample in Table 5 includes both active producers and non-operating landowners, the results indicate the overall impact of prior decisions across both of these groups. For active producers, the effect is likely a result of the direct experience of managing land for agricultural production, while for non-operating landowners, the effect could indicate a general awareness of the practices adopted by their tenants. Furthermore, non-operating landowners could possess a general familiarity with the benefits associated with cover crop adoption or have prior experience that influences their willingness to accept values. As Sawadgo et al. (Reference Sawadgo, Zhang and Plastina2021) found that non-operating landowners have different perspectives on cover crop adoption from owner-operators, we test the robustness of our results by eliminating non-operating landowners from the analysis. Table 6 shows the results of the double-bounded WTA model after the removal of non-operating landowners. The overall average WTA for producers only is $26.38/acre which is slightly greater than when non-operating landowners are included in the model. For context, this average value reflects approximately 78% of the estimated cost from the EQIP to implement a basic cover crop in the state of Texas for the 2022 fiscal year. Assuming a 50-75% cost-share payment, the respondents would, on average, still require additional financial incentive to implement cover cropping in their operations.
WTA estimates for cover crop adoption: producers only
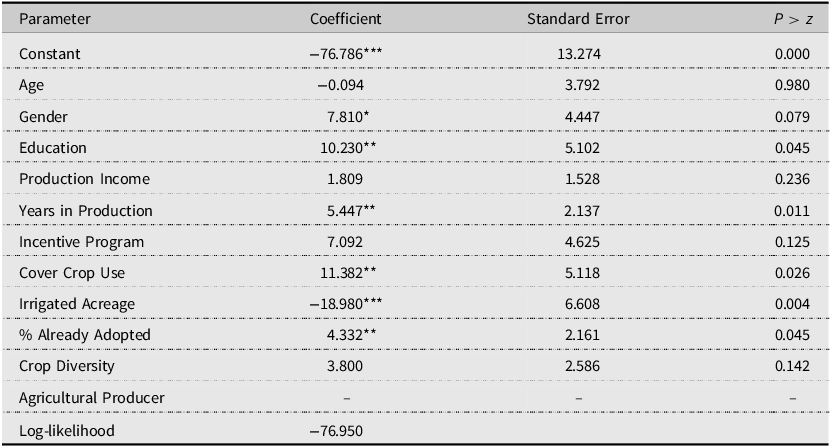
Note: *, **, *** indicate statistical significance at the 10%, 5%, and 1% levels, respectively.
Additionally, Years in Production is statistically significant at the 10% level and shows that producers who have been engaged in agricultural production for a longer period of time would be willing to accept less to adopt cover cropping. This result may reflect the fact that producers with more experience have a greater sense of devotion to their operations and could be inclined to adopt conservation practices out of a sense of responsibility toward land stewardship (Chouinard et al., Reference Chouinard, Wandschneider and Paterson2016). Education, Cover Crop Use, Irrigated Acreage, and % Already Adopted remain both statistically significant and similar in magnitude to the results when non-operating landowners are included in the analysis. However, previous enrollment in an incentive program no longer has a statistically significant impact on WTA and Gender is statistically significant at the 10% level. Male producers would be willing to accept a lower amount per acre to adopt cover crops compared to female producers. This finding is consistent with previous research indicating that while female farmers are generally more conservation-minded, they have less experience with government conservation programs and are less knowledgeable about best management practices compared to their male counterparts (Druschke & Secchi, Reference Druschke and Secchi2014; Wells & Eells, Reference Wells and Eells2011).
Discussion and conclusion
The agricultural sector increasingly recognizes the role of regenerative practices in mitigating the effects of climate change, sustaining production, and preserving natural resources. However, despite attempts to promote such practices and increasing awareness, the widespread adoption of regenerative agricultural practices remains a significant challenge. Using a double-bounded contingent valuation framework, we evaluate WTA values of producers in the SGP to adopt cover cropping into their operations and how various personal demographics and farm characteristics affect WTA.
Our findings indicate an average WTA value of $26.38/acre for producers with many factors having considerable impacts on WTA values. Notably, this average value is greater than 75% of the 2022 EQIP estimated cost of implementing basic cover crops in Texas. This indicates the net private cost to producers could be substantial even after accounting for cost-share support payments, potentially limiting their willingness to adopt the practice. Addressing the gap between what producers indicate they are willing to accept, and the actual costs of implementation may be essential to increasing adoption rates. Several demographic factors and farm characteristic variables were found to have an influence on WTA values. For instance, producers with a college education were willing to accept over $10/acre less to adopt cover crops compared to those without. WTA values also decreased with higher percentages of neighboring properties having adopted the practice and with increasing crop diversity. This finding is in line with Liu et al. (Reference Liu, Bruins and Heberling2018) who found that adoption by neighbor(s) positively impacts the adoption of best management practices by farmers. Though not statistically significant, we also found crop diversity to negatively impact WTA where producers growing a more diverse array of commodities were willing to accept lower incentive payments to adopt cover crops. Because crop diversity can be associated with integrated crop-livestock systems, these producers may have additional paths for revenue to offset costs associated with cover crop adoption, more compatible operations for integration, or observe direct benefits from adopting cover crops (e.g., grazing for livestock) (Arbuckle & Roesch-McNally, Reference Arbuckle and Roesch-McNally2015).
Conversely, the presence of irrigated acreage and ownership status were among the factors having the largest impact on WTA, and the only two that actually increased required incentive payments for producers. That is, producers who have irrigated land require more financial incentive to adopt cover cropping compared to dryland producers and those that lease out their land (i.e., non-operating landowner). This shows how agricultural operations with specific arrangements may require additional compensation to adopt cover crops. From a theoretical perspective, irrigated acreage involves additional input costs (e.g., additional water for cover crops, energy, and labor) and opportunity costs from diverting irrigation resources to cover crops and away from cash crops with higher immediate returns. Moreover, producers may perceive a level of uncertainty regarding the expected benefits of cover crops, especially when additional financial investments may be needed for irrigation. These considerations could necessitate higher incentives for producers with irrigated acreage to offset these risks and ensure the marginal benefit of adoption outweighs the marginal cost, and understanding these economic barriers is crucial for designing effective policy interventions.
We found that incentive payments for producers who have previously utilized cover crops or been enrolled in an incentive program are lower compared to those who have done neither. This is consistent with Canales et al. (Reference Canales, Bergtold and Williams2024) who found lower incentive payments are required for producers who have previously adopted conservation practices. Whereas Canales et al. (Reference Canales, Bergtold and Williams2024) include various regenerative practices in their analysis, our findings show that continuity of utilizing cover crops specifically has a lower cost compared to additionality. While incentivizing current adopters to continue use may be a more cost-effective strategy, the broader goal of increasing adoption rates requires attracting new adopters. Therefore, programs and strategies aimed at targeting new adoption rather than continuity may require more substantial investments as new adopters are less aware of perceived risks, benefits, and costs associated with adoption.
These findings have important implications for both policy and extension efforts aimed at the promotion of regenerative agricultural practices. Specifically, understanding the differential WTA values can inform the design of incentive programs and target producers who require greater financial compensation for adoption. The effectiveness of federal, state, and local programs can be enhanced by tailoring incentives to meet the requirements of specific producer groups. Additionally, our research highlights the importance of knowledge dissemination and practical experience in increasing rates of adoption. Familiarity with incentive programs and cover cropping both lowered WTA values which shows that direct experience and exposure to regenerative practices are significant factors in reducing perceived barriers to adoption. As a result, increased investment in educational and extension programs, field demonstration plots, and peer learning networks can encourage adoption among hesitant producers by increasing involvement and knowledge of both regenerative practices and incentive programs. The findings also show the importance of tailoring conservation program efforts to the specific circumstances and needs of various producer groups.
In addressing the remaining barriers to adoption of regenerative agricultural practices, our study highlights the need for continued research and innovation in the agricultural economy. Although incentive programs may play a significant role in the adoption of regenerative practices, they may fail to capture the diverse range of both costs and benefits associated with the adoption of cover crops. Future research may aim to look at alternative mechanisms such as cost-sharing schemes, insurance premium reduction, novel financial models, etc. to ensure the long-term sustainability of regenerative agriculture and to further incentivize adoption. While our results showed that higher rates of cover crop adoption by neighboring operators decreases WTA, future research should aim to see whether factors beyond direct influence from neighbors’ impact adoption.Footnote 7 Furthermore, we found WTA values to be less for male producers compared to female producers. Female producers want and are willing to learn more about best management practices, and increased adoption of these practices may be attained if government conservation programs tailor educational information and increase outreach to female producers (Druschke & Secchi, Reference Druschke and Secchi2014).
Finally, a few limitations of the study should be noted. First, the study had a limited sample size with only 84 responses being incorporated into the WTA analysis. Though a lower response rate is common with mail surveys compared to online surveys, future research may aim to choose a survey format more accessible to agricultural producers. Also, our sample is contained within a specific, semi-arid geographic region (i.e., Texas and Oklahoma). Similar outcomes may be found in other semi-arid ecosystems, but future work should aim at obtaining a broader sample from various ecosystem types to obtain more generalizable results regarding the adoption of regenerative agricultural practices.
Supplementary material
The supplementary material for this article can be found at https://doi.org/10.1017/aae.2024.30.
Data availability statement
For replication purposes, the data that support the findings of this study are available from the corresponding author, T.D.J, upon reasonable request.
Acknowledgements
None.
Author contributions
Conceptualization, D.M, and T.A.B; methodology, D.M., and T.D.J.; formal analysis, T.D.J. and D.M. data curation, S.D.; writing—original draft, T.D.J.., writing—review and editing, T.D.J., D.M., S.D., T.A.B.; supervision, D.M..; funding acquisition, D.M. and T.A.B.; investigation, T.D.J. and S.D; validation, T.D.J. and D.M; resources, D.M.; visualization, D.M.
Financial support
This work is supported by the Sustainable Agricultural Systems Program grant no. 2021-68012-35897 from the USDA National Institute of Food and Agriculture. Any opinions, findings, conclusions, or recommendations expressed in this publication are those of the author(s) and do not necessarily reflect the view of the U.S. Department of Agriculture. This research was also supported in part by the Ogallala Aquifer Program, a consortium between the USDA-Agricultural Research Service, Kansas State University, Texas A&M AgriLife Research, Texas A&M AgriLife Extension Service, Texas Tech University, and West Texas A&M University.
Competing interests
None.
AI contributions to research
The study does not involve contributions from artificial intelligence.


 Open access