


1. Introduction
Since the end of Little Ice Age around 1850, more than half of the glacier volume in the Swiss Alps has been lost, with increasing rates in the recent decades (Zemp and others, Reference Zemp2015). Projections of future glacier change imply that under high-emission scenarios, the Alps will be largely deglacierized by 2100 (Zekollari and others, Reference Zekollari, Huss and Farinotti2019). This will lead to remarkable changes in the annual regime of river runoff (Braun and others, Reference Braun, Weber and Schulz2000; Milner and others, Reference Milner, Brown and Hannah2009; Huss, Reference Huss2011). Since glaciers act as a water reservoir at diverse timescales (Beniston and others, Reference Beniston2018), they are important, for example for electricity production from hydropower (Beniston, Reference Beniston2012; Finger and others, Reference Finger, Heinrich, Gobiet and Bauder2012; Gaudard and others, Reference Gaudard, Gabbi, Bauder and Romerio2016), which is relevant for Switzerland as hydropower contributes with around 55% to the total annual electricity production (BFE, Reference BFE2019). Glaciers are also of high societal relevance in many other fields, such as agriculture (Fink and others, Reference Fink2004; Beniston, Reference Beniston2012), natural hazards (Huggel and others, Reference Huggel, Haeberli, Kääb, Bieri and Richardson2004; Haeberli, Reference Haeberli2005), tourism (Fischer and others, Reference Fischer, Olefs and Abermann2011; Beniston, Reference Beniston2012), supply of drinking water (Wyer, Reference Wyer2008) or with regard to sea level rise (Zemp and others, Reference Zemp2015). On the contrary, new chances might arise, for example for the electricity production from hydropower, due to new lakes forming in deglacierizing regions (Haeberli and others, Reference Haeberli2016; Farinotti and others, Reference Farinotti, Round, Huss, Compagno and Zekollari2019), where potentially new storage power plants can be installed (Ehrbar and others, Reference Ehrbar, Schmocker, Vetsch and Boes2018).
Accurate knowledge about today's ice volume and the subglacial topography is key to calculate future changes in river runoff regimes (e.g. Gabbi and others, Reference Gabbi, Farinotti, Bauder and Maurer2012; Gaudard, Reference Gaudard2015) or predicting the occurrence of alpine lakes forming after glaciers have retreated (Linsbauer and others, Reference Linsbauer, Paul and Haeberli2012; Haeberli and others, Reference Haeberli2016). At spatial scales beyond those of individual glaciers, this information is typically obtained from ice thickness models or scaling approaches (Bahr and others, Reference Bahr, Pfeffer and Kaser2015; Farinotti and others, Reference Farinotti2017). Various ice thickness models have recently been developed which allow estimating the ice thickness distribution from the glacier surface topography, glacier outlines and sometimes auxiliary data such as mass-balance estimates, ice flow velocities or branch lines. Currently applied models were, for example, presented by Farinotti and others (Reference Farinotti, Huss, Bauder, Funk and Truffer2009b, extended later to the global scale by Huss and Farinotti, Reference Huss and Farinotti2012), Morlighem and others (Reference Morlighem2011), Paul and Linsbauer (Reference Paul and Linsbauer2012), Clarke and others (Reference Clarke2013), Brinkerhoff and others (Reference Brinkerhoff, Aschwanden and Truffer2016) and Rabatel and others (Reference Rabatel, Sanchez, Vincent and Six2018). Based on such models, ice thickness and volume estimates specifically for Switzerland were presented by Farinotti and others (Reference Farinotti, Huss, Bauder and Funk2009a), Linsbauer and others (Reference Linsbauer, Paul and Haeberli2012) and Fischer and others (Reference Fischer, Huss and Hölzle2015), whereas additional independent regional estimates at the scale of the European Alps are available from Haeberli and Hölzle (Reference Haeberli and Hölzle1995) and Farinotti and others (Reference Farinotti, Round, Huss, Compagno and Zekollari2019).
Ice thickness estimates obtained from modeling exhibit substantial uncertainties unless they are calibrated to ground-truth data (Farinotti and others, Reference Farinotti2021). For the Antarctic and Greenlandic ice sheets, measured ice thickness data have been acquired systematically with a comprehensive coverage (e.g. Dowdeswell and Evans, Reference Dowdeswell and Evans2004; Allen and others, Reference Allen, Leuschen, Gogineni, Rodriguez-Morales and Paden2010), enabling to interpolate the ice thickness distribution in these regions more accurately (e.g. Huss and Farinotti, Reference Huss and Farinotti2014; Morlighem and others, Reference Morlighem2020). Andreassen and others (Reference Andreassen, Huss, Melvold, Elvehøy and Winsvold2015) used measured ice thickness for 32% of the glacier area of mainland Norway, and Helfricht and others (Reference Helfricht, Huss, Fischer and Otto2019) relied on direct thickness observations for 46% of Austria's glacierized areas to obtain complete ice thickness maps in combination with calibrated ice thickness models. A similar study has been accomplished by Pelto and others (Reference Pelto, Maussion, Menounos, Radić and Zeuner2020) for the Canadian part of the Columbia River Basin. For other regions, available ice thickness observations are usually too sparse and models of entire mountain ranges are only calibrated for a few glaciers and the calibration factors are then projected to all other glaciers (Farinotti and others, Reference Farinotti, Huss, Bauder and Funk2009a; Linsbauer and others, Reference Linsbauer, Paul and Haeberli2012; Werder and others, Reference Werder, Huss, Paul, Dehecq and Farinotti2020). To improve ice volume estimates and to obtain the subglacial topography with higher accuracy, it is therefore substantial to provide more direct measurements of the glacier thickness as for instance concluded by Farinotti and others (Reference Farinotti2017).
Apart from drilling boreholes to the bedrock, which is only feasible in limited numbers, radar sounding has been established as the most common technique to measure the ice thickness of glaciers (Plewes and Hubbard, Reference Plewes and Hubbard2001; Woodward and Burke, Reference Woodward and Burke2007). This is true for both, environments with non-temperate ice, such as in Antarctica or Greenland (e.g. Bingham and Siegert, Reference Bingham and Siegert2007), as well as in regions with temperate glaciers such as in Alaska, Patagonia, the Himalaya or in the European Alps (e.g. Blindow and others, Reference Blindow, Salat and Casassa2012). For surveying temperate glaciers with radar, a major challenge arises from the substantially higher dampening of electromagnetic waves in comparison with cold ice (Watts and England, Reference Watts and England1976). For this reason, impulse radar systems have been employed, hereafter referred to as ground-penetrating radars (GPR). They are able to transmit ~1 cycle at high voltages and with a relatively low central frequency defined by the antenna length (Plewes and Hubbard, Reference Plewes and Hubbard2001). Typically, their frequencies range from a few megahertz, depending on the maximum manageable antenna length, up to several tens of megahertz, depending on the required maximum penetration depth.
Airborne GPR systems with sufficiently low frequency to penetrate temperate glaciers have been used worldwide since decades (Watts and Wright, Reference Watts and Wright1981; Kennett and others, Reference Kennett, Laumann and Lund1993; Christensen and others, Reference Christensen2000; Conway and others, Reference Conway2009; Blindow and others, Reference Blindow, Salat, Gundelach, Buschmann and Kahnt2011; Rignot and others, Reference Rignot, Mouginot, Larsen, Gim and Kirchner2013; Gacitúa and others, Reference Gacitúa2015; Urbini and others, Reference Urbini2017; Langhammer and others, Reference Langhammer2019b; Pritchard and others, Reference Pritchard2020), carried either by fixed-wing airplanes on wide and flat glaciers and ice caps or by helicopters on glaciers in narrow valleys or high-altitude environments with steep glaciers. Also in the Swiss Alps, several helicopter-borne GPR systems have been employed during the last two decades as summarized by Rutishauser and others (Reference Rutishauser, Maurer and Bauder2016). Together with a number of ground-based surveys (e.g. Bauder and others, Reference Bauder, Funk and Gudmundsson2003; Huss and Fischer, Reference Huss and Fischer2016; Feiger and others, Reference Feiger, Huss, Leinss, Sold and Farinotti2018), they contribute largely to the ice thickness datasets for this region, and are available through the public glacier ice thickness database GlaThiDa (Gärtner-Roer and others, Reference Gärtner-Roer2014; Welty and others, Reference Welty2020). To complement this pre-existing database, we have established the new helicopter-borne GPR platform AIR-ETH (Langhammer and others, Reference Langhammer2019b). It is the first GPR platform with two orthogonal antenna pairs, which significantly improves the bedrock recovery of valley glaciers (Langhammer and others, Reference Langhammer, Rabenstein, Bauder and Maurer2017).
Our study has three objectives: first, we present a large amount of new ice thickness data from Swiss glaciers, acquired using the AIR-ETH system. These data substantially extend the already existing database of ice thickness point measurements. Second, we generate continuous maps of the ice thickness distribution through interpolation by glaciological modeling based on the extended and highly comprehensive set of ice thickness data. For that purpose, we apply two different algorithms, namely the recently developed Glacier Thickness Estimate (GlaTE) algorithm (Langhammer and others, Reference Langhammer, Grab, Bauder and Maurer2019a) and the Ice Thickness and Volume Estimation method Observation-based (ITVEO) that is based on the concepts of Huss and Farinotti (Reference Huss and Farinotti2012). Additionally, we use the ice thickness distributions and the corresponding GPR data to calibrate the models for estimating the ice thickness distribution of the remaining, mostly small glaciers for which still no GPR data exist. This is the first time that at the regional scale, ice thickness distribution and glacier bed topography has been determined based on such a high density of direct ice thickness observations. The third and final aim of our study is to provide a new estimate of the total ice volume in the Swiss Alps.
2. Study region and datasets
A glacier inventory is a prerequisite for a regional assessment of ice thickness distribution and glacier volume. Here, we refer to the Swiss Glacier Inventory 2016 (SGI2016, GLAMOS, Reference GLAMOS2020b; Linsbauer and others, Reference Linsbauersubm.) for the definition of glacierized areas. This inventory comprises 1400 glaciers with a total area of 961 km2 and refers to the years between 2013 and 2018, with a center date in 2016. A number of 160 of these glaciers are larger than 1 km2 and cover a total area of 767 km2, whereas the overwhelming majority of the glaciers are small and, thus, contribute little to the total ice volume (e.g. Fischer and others, Reference Fischer, Huss, Barboux and Hoelzle2014). Most glaciers are located in the Bernese and Valais Alps, where the Alps reach the highest elevation within our study region. Substantial glacierized areas also exist in the central and eastern Swiss Alps. The outlines provided by the SGI2016 define the lateral extent of our glacier maps. Additionally, the SGI2016 provides raster data indicating which parts of the glaciers are covered by supraglacial debris (GLAMOS, Reference GLAMOS2020b).
Our study region is covered by swissALTI3D, a recent, high-quality digital elevation model (DEM) provided by the Federal Office of Topography (Swisstopo, Reference Swisstopo2010). It is accompanied by well-documented meta data. The DEM used for modeling is the 2019-release of the swissALTI3D with 2 m-resolution (Swisstopo, Reference Swisstopo2019), which we down-sampled to a resolution of 10 m. The acquisition year over the extent of all glaciers can be retrieved from the meta data, which is provided within cells of 1 km × 1 km. It provides the mode (most occurring) year, as well as the youngest and oldest recording years of the base data used for producing the DEM (Weidmann and others, Reference Weidmann, Gandor and Artuso2018). On average, the 2019-release of swissALTI3D represents the surface topography of the year 2015, with oldest being from 2007 and youngest from 2017.
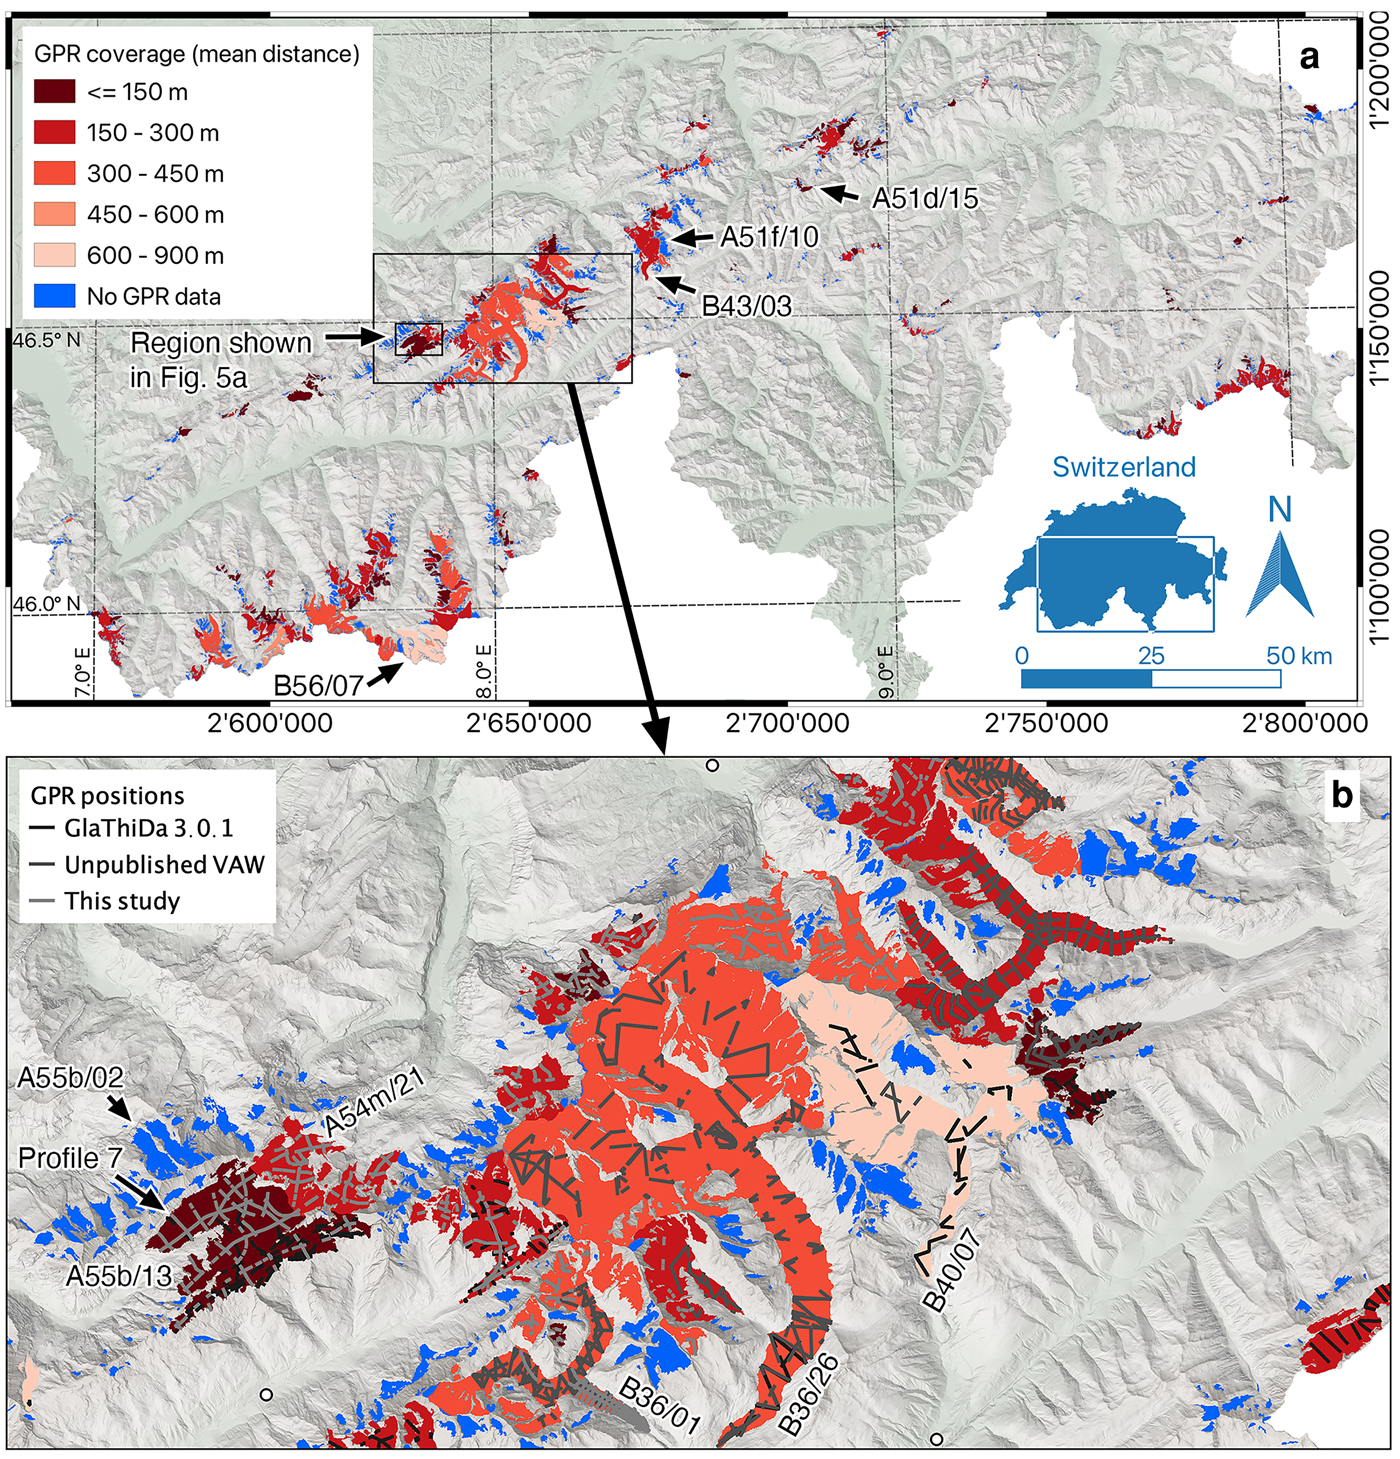
To date, a large amount of ice thickness data for Swiss glaciers has been acquired with GPR by various researchers. Most of them are available through GlaThiDa (GlaThiDa Consortium, Reference GlaThiDa Consortium W2019) operated by the World Glacier Monitoring Service (Gärtner-Roer and others, Reference Gärtner-Roer2014; Welty and others, Reference Welty2020). In addition to these data, we also use the ice thickness data measured with seismic methods by Thyssen and Ahmad (Reference Thyssen and Ahmad1969), covering an area of Konkordiaplatz where the three main branches of Aletschgletscher merge. At this location, the largest ice thickness in the Swiss Alps occur, but to date the glacier bed underneath the deepest ice has not been detected with GPR. The overdeepening detected by Thyssen and Ahmad (Reference Thyssen and Ahmad1969) was later confirmed by drilling boreholes as described in the study of Hock and others (Reference Hock, Iken and Wangler1999). In total, the data published through GlaThiDa comprise around 950 km of GPR profiles, mostly acquired on the larger glaciers in the Bernese and Valais Alps. Additionally, the Glaciology Group at the Laboratory of Hydraulics, Hydrology and Glaciology (VAW, ETH Zurich) archived another ~550 km of GPR profiles, which were measured by various researchers but not published so far. References of the corresponding studies are listed in Table 2. The ice thickness data were complemented with another 950 km of profiles, recorded in the framework of this study as introduced below. They were recorded not only in the Western Swiss Alps, where most of the previous surveys were conducted, but also on the glaciers in the central and eastern Swiss Alps, for which almost no data existed before. An overview of which glaciers have been surveyed to date is shown in Figure 1a. In Figure 1b, the location of GPR sections is shown for the Bernese Alps. For analogous figures for other regions, refer to the Supplementary material.
Overview of GPR coverage: (a) SGI2016 outlines of all glaciers in the Swiss Alps. Glaciers for which no GPR data have been acquired to date are in blue. Glaciers for which GPR data are available are shown in red, with the color-code indicating the density of the data coverage expressed by the mean of the distances of all points on the glacier to the closest GPR-measurement point. (b) Zoom into the Bernese Alps with the location of the GPR-measurement points shown in light gray to black depending on the data source. See the Supplementary material for other parts of the Swiss Alps. Background: hillshade from the swissALTI3D after Swisstopo (Reference Swisstopo2019).
Since ice thicknesses were measured in various years and seasons, ice thicknesses used as input for the ice thickness distribution modeling were standardized by subtracting the measured glacier bed from the DEM. This requires the elevation datum of measured glacier surface- and glacier bed-elevation to be consistent with the datum of the DEM. Therefore, we compared the surface elevation accompanying the GPR datasets with a DEM dating back as close as possible to the time of GPR-data acquisition. In case the two surface elevations differed strongly, which occurred when surface elevations were not measured simultaneously during GPR acquisition, directly the measured ice thickness was used as input for the ice thickness interpolation. This results in increased uncertainties for the interpolated ice thickness, which was taken into account as detailed in Appendixes C and D. This was the case for about a dozen small glaciers surveyed between 2009 and 2015 (see metadata of SwissGlacierThickness-R2020, Grab and others, Reference Grab2020).
3. Methods
3.1. GPR surveying
3.1.1. GPR data acquisition
GPR data were acquired in the winter and spring seasons of the years 2016–20 with the GPR platform AIR-ETH (Langhammer and others, Reference Langhammer2019b). This GPR platform consists of the pulseEkko radar system from Sensors & Software and is carried by a helicopter as a sling-load. For the campaigns presented here, it was equipped with two orthogonal transmitter–receiver antenna pairs of 25 MHz center frequency, in order to record dual-polarization data. Both pairs were mounted in broadside configuration and were recording alternatingly around eight traces per second each. With the target flight speed of 37 km h−1 (20 knots), this resulted in a trace every 0.8 m available for the consequent data processing. From three global navigation satellite system (GNSS) antennas, the pitch, roll and yaw of the platform was obtained, whereas a laser-altimeter constantly logged the distance to the glacier surface. From this information, the glacier surface elevation underneath the platform was deduced. The recording and processing of the differential GNSS and laser altimeter-data, as well as the navigation aid for the pilot, was performed by GEOSAT SA, a Swiss-based surveying company. The target height of the antennas above ground was defined as 30 m, which in field-implementation typically varied by around ±20 m. Larger heights were avoided for data-quality reasons and lower heights for safety reasons.
For typical valley glaciers, one longitudinal (i.e. along the glacier flow direction) and several cross-profiles, around every 250 m (small glaciers) and up to every 750 m (larger glaciers), were recorded. For more complex-shaped glaciers, this configuration was adapted with a similar profile density, seeking roughly orthogonal intersections. This facilitated the discrimination of off-plane reflections and reflections from steep valley walls by comparing orthogonal profiles during data interpretation. Profile locations (interpreted parts) are shown for an example region in Figure 1b. The ultimate goal of our campaigns was to cover as many glaciers as possible with the given finances. Therefore, data acquisition missions were conducted region-wise and it was aimed to cover possibly all glaciers in each region, unless they were geographically very isolated and/or very small.
3.1.2. GPR data processing
A data-processing workflow was established based on the experience of previous studies with helicopter-borne GPR (Merz and others, Reference Merz2015; Rutishauser and others, Reference Rutishauser, Maurer and Bauder2016; Grab and others, Reference Grab2018; Langhammer and others, Reference Langhammer2019b). It mainly consists of standard GPR-processing steps that are also commonly used for processing ground-based data. A crucial adaption, however, is required because data from helicopter-borne GPR are contaminated with severe ringing noise (Fig. 2a) due to the interference of the electromagnetic waves with the helicopter (Rutishauser and others, Reference Rutishauser, Maurer and Bauder2016; Langhammer and others, Reference Langhammer2019b). All processing steps were implemented in our in-house processing package GPRglaz (e.g. Grab and others, Reference Grab2018), which is based on Matlab and uses parts of the CREWES library (e.g. Margrave and Lamoureux, Reference Margrave and Lamoureux2019).
Selected data-processing steps for profile 7 recorded on Kanderfirn (A55b/13 in Fig. 1b) in February 2019: (a) rawdata, (b) data after ringing removal and bandpass filtering and (c) data after focusing and time-to-depth conversion using Kirchhoff migration.

Data from an example GPR-profile are shown in Figure 2 after selected processing steps. It has been recorded in February 2019 and its location is marked as Profile 7 in Figure 1b. The main processing steps are (1) a time zero correction based on the arrival of the direct wave, (2) removal of the ringing noise using an optimized procedure of singular value decomposition filtering as described in detail by Grab and others (Reference Grab2018), (3) bandpass filtering, (4) merging of the dual-polarization data channels as described in detail by Langhammer and others (Reference Langhammer2019b), (5) trace binning for a regular sampling at a spatial sampling rate depending on the flight speed and (6) image focusing and time-to-depth conversion by migrating the data with constant radar wave velocities for ice and air of 0.169 m ns−1 (Glen and Paren, Reference Glen and Paren1975) and 0.299 m ns−1, respectively. For the migration, a Kirchhoff time migration scheme (after Margrave and Lamoureux, Reference Margrave and Lamoureux2019) was used which yielded satisfactory results after relatively short computation times, but for some profiles also a computationally more expensive reverse time migration was considered (Grab and others, Reference Grab2018). The identical processing flow was applied to data from both channels of the dual polarization AIR-ETH system. Additionally, the data of the two channels were merged by summation, and the processing was applied to the resulting trace as well. Therefore, three images were available for the interpretation: one from records with the antennas orthogonal to flight direction (channel 1), one from records with the antennas parallel to flight direction (channel 2) and one for the merged channels.
3.1.3. Interpretation of glacier bed reflections
For many profiles, images from the merged channels show substantial improvements in quality (see Langhammer and others, Reference Langhammer2019b, for more details). In some cases, it turned out to be useful to additionally consider the individual channels during data interpretation. In a number of profiles the glacier bed reflection was only visible in the data of one channel, thereby confirming the usefulness of the dual-polarization AIR-ETH system. Another advantage of the dual-polarization data is that unwanted events in the data, such as reflections from steep valley walls, were often only visible in one channel. An example is shown in Figures 3a, b, where some reflections with a linear move-out and slightly elevated frequency content, typical for reflections from valley walls, only occurs in the image recorded with channel 1. Such events may interfere with the glacier bed reflection and hinder the interpretation.
Glacier bed interpretation of profile 7 from Kanderfirn (A55b/13): migrated reflection image recorded with (a) channel 1 and (b) channel 2, (c) glacier bed interpretation and classes depending on reflection quality and (d) corresponding ice thickness and uncertainty ranges used as input for GlaTE and ITVEO.
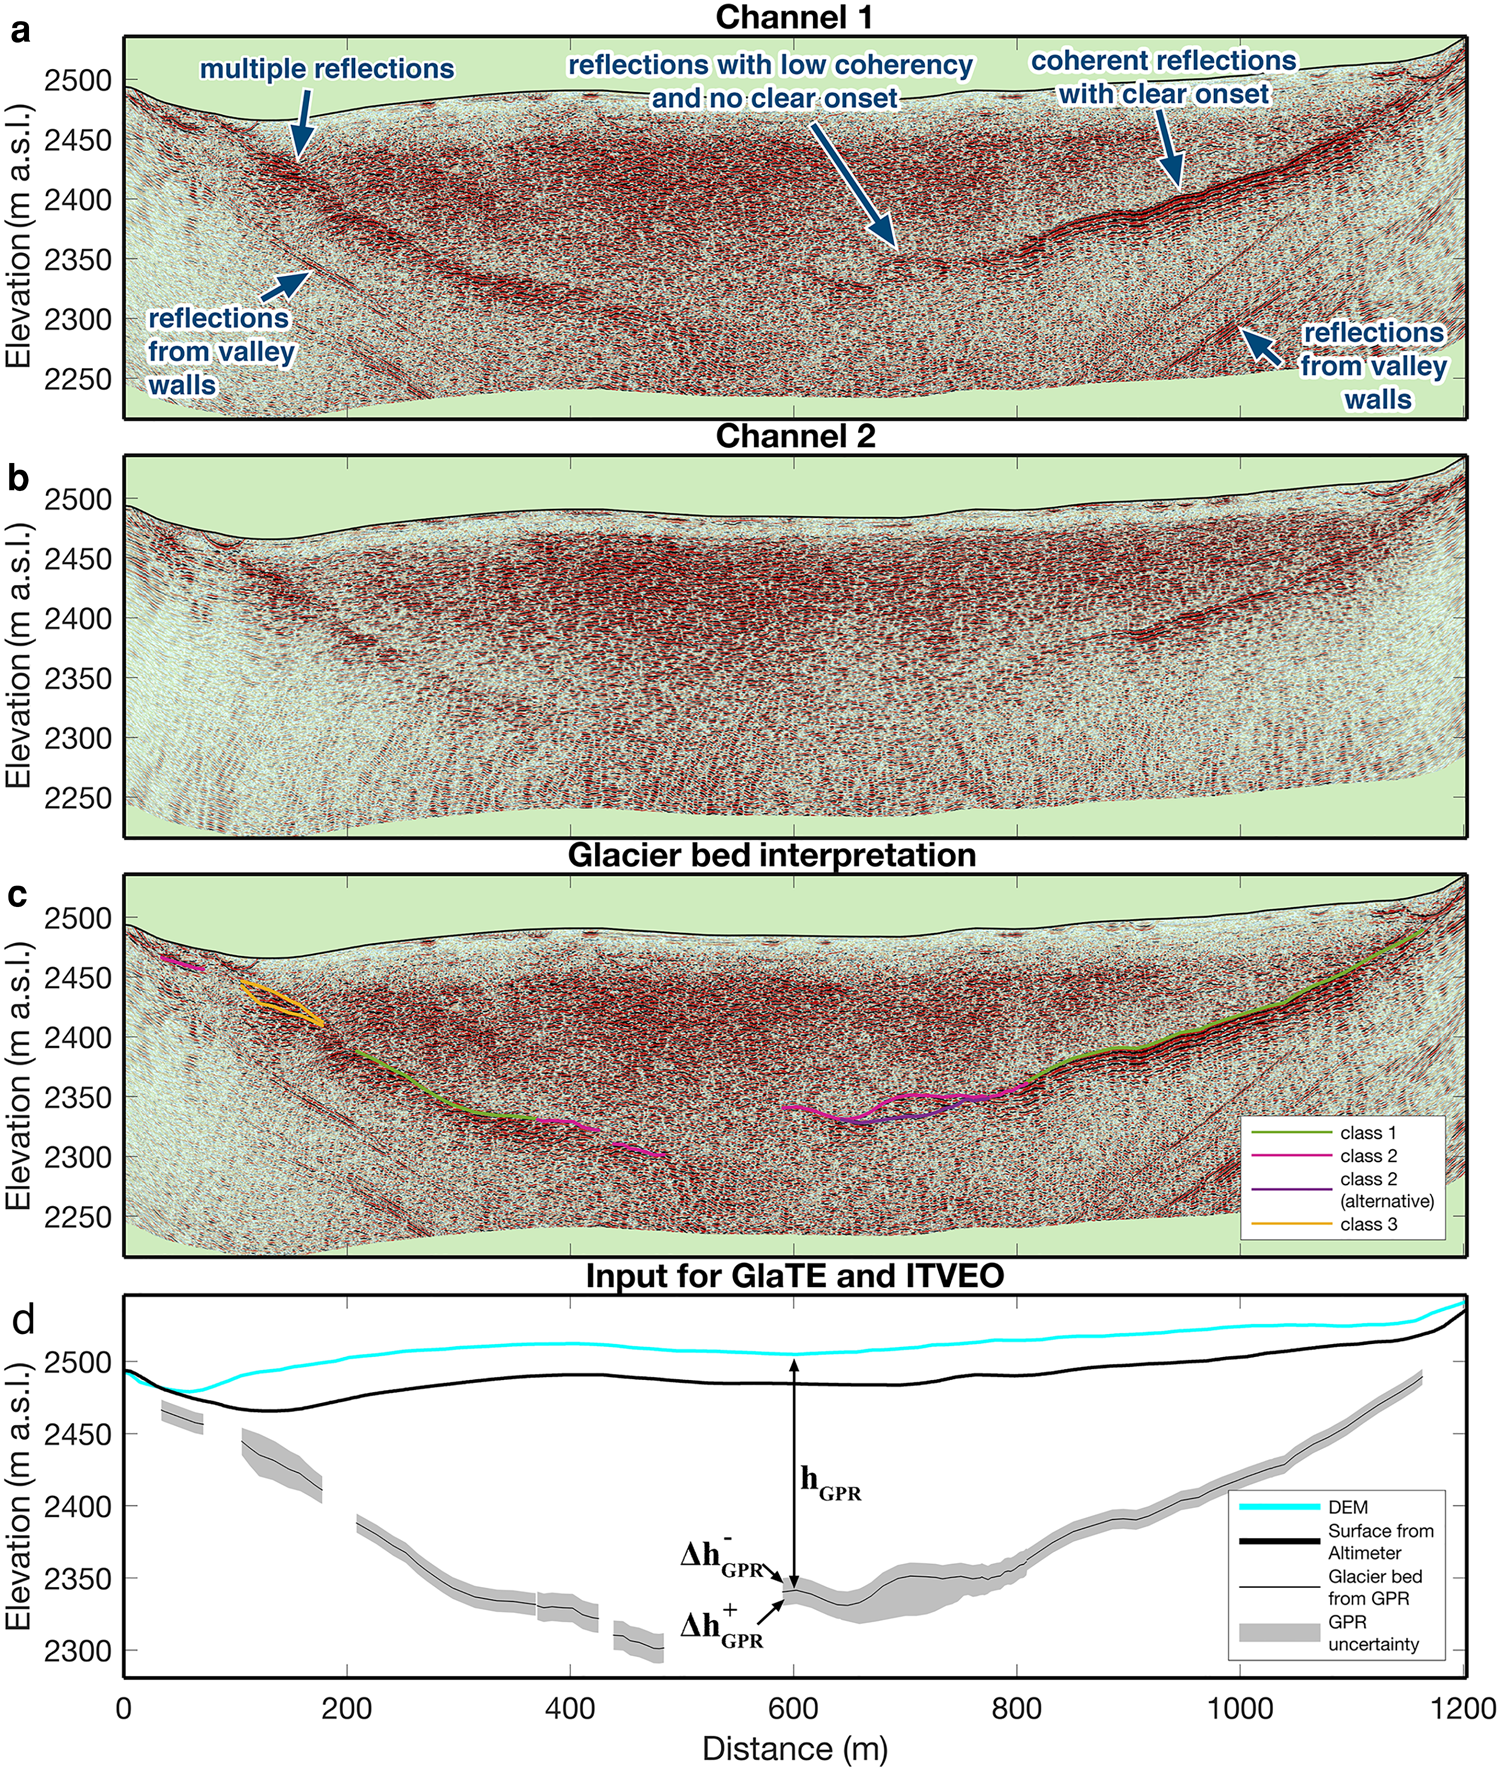
When interpreting glacier bed reflections, we distinguished three quality classes (Fig. 3c) in order to later account for the data quality when estimating the uncertainty in the measured ice thickness and to deal with ambiguous reflections. The first and highest quality class was assigned to coherent reflections with a clear onset. The second class was assigned for reflections not occurring coherently over greater distances or with a poorly defined onset. In either case, an alternative event could be selected, for example if it was not possible to clearly distinguish between a true glacier bed reflection occurring from within the profile and an image of an off-plane reflection. The hierarchy of main and alternative reflection was defined on a case-by-case basis, either by the coherence of the reflection or from a glaciological point of view. In cases of multiple reflections, for which no clear onset can be identified, but which most probably originate from the glacier bed, it was not possible to pick an individual event. Instead, a minimum–maximum time window was picked and labeled as third-class pick, whereas the actual ice thickness was defined by the mean of the selected range.
In case of an unambiguous interpretation of glacier bed reflections, the uncertainty in measured ice thickness was estimated from the error in the GPR wave velocity in temperate ice and the uncertainty in picking reflections in the radargrams. For the GPR wave velocity we used 0.169±0.005 m ns−1 following Glen and Paren (Reference Glen and Paren1975), which is less conservative than the uncertainty of ±0.008 m ns−1 used by Lapazaran and others (Reference Lapazaran, Otero, Martín-Español and Navarro2016) as that study applied it to a polythermal glacier. For the picking uncertainty, Rutishauser and others (Reference Rutishauser, Maurer and Bauder2016) estimated an uncertainty of ±5 m. From our experience, this picking uncertainty is an appropriate estimate on average. Here, we used ±3 m for reflections with a well-defined onset (class 1) and ±7 m for reflections with a poorly defined onset (classes 2 and 3). For data from the literature or from older studies, for which we do not know the data quality, an average picking uncertainty of ±5 m was assumed. In cases, where the interpretation was ambiguous and an alternative reflection was identified or reflections were picked over a time window (class 3), the uncertainty bound spans over the entire range of the identified glacier bed reflections, additionally to the velocity and the picking uncertainty. This procedure results in uncertainty ranges $\Delta h_{{\rm GPR}}^{-}$ toward smaller and $\Delta h_{{\rm GPR}}^{ + }$
 toward larger ice thickness as displayed in Figure 3d.
Since the GPR data were acquired in different years and during different seasons, the measured ice thicknesses were not directly compatible with the DEM on which the ice thickness interpolation was based on. Thanks to the differential GNSS and laser-altimeter measurements with the AIR-ETH system, however, the precise elevation datum of the glacier surface and likewise of the glacier bed is known for each measured ice thickness. It was therefore permissible to subtract the glacier bed elevation from the DEM (SwissALTI3D-r2019) and use this standardized ice thickness h GPR (see Fig. 3d) as input for the ice thickness interpolation as explained in Section 2.
3.2. Interpolation with ice thickness modeling
To obtain continuous ice thickness maps from the partly sparse coverage of GPR profiles, we applied an interpolation using two independent distributed ice thickness modeling algorithms. The basic concept is to optimize an ice thickness model using the available data for each glacier and to use the calibrated model to optimally estimate ice thickness distributions in unmeasured regions of the glacier. To this end, we rely on the algorithm Glacier Thickness Estimate (GlaTE) that has been recently developed by Langhammer and others (Reference Langhammer, Grab, Bauder and Maurer2019a), and on the Ice Thickness and Volume Estimation method Observation-based (ITVEO) method, a further development of the approach presented in Huss and Farinotti (Reference Huss and Farinotti2012).
GlaTE and ITVEO are well suited for the current study, because they can efficiently account for large amounts of ice thickness measurement data and are relatively inexpensive for applications to large sets of glaciers. Both models follow a concept presented first by Farinotti and others (Reference Farinotti, Huss, Bauder, Funk and Truffer2009b), which bases on mass conservation, apparent mass balances and Glen's ice flow law (Glen, Reference Glen1955). A main difference persists in the way this concept is implemented, especially with computations being performed within ice flow sheds for GlaTE and within elevation bands for ITVEO. Furthermore, the schemes with which ice thickness observations are incorporated are also fundamentally different among the two models as explained in detail below.
The final maps of ice thickness distribution and glacier bed topography were obtained in a last step by averaging the results of the two algorithms, and is subsequently referred to as the MEAN. Unless specified differently, we hereafter refer to the MEAN result when discussing ice thickness distributions and glacier bed topography maps.
3.2.1. Glacier thickness estimate (GlaTE)
The GlaTE algorithm used in this study is identical to the one presented in Langhammer and others (Reference Langhammer, Grab, Bauder and Maurer2019a), except for a few modifications. GlaTE includes a modeling algorithm equivalent to the one of Clarke and others (Reference Clarke2013). The approach builds on a physically based ice flow model that estimates the glacier bed topography from the surface topography, apparent mass-balance fields, and a stress–strain relationship for basal shear derived from Glen's law (Glen, Reference Glen1955). The resulting ice thickness model is combined with the ice thicknesses measured with GPR using an inversion scheme. As detailed in Appendix A, this scheme is an extended form of the one presented by Langhammer and others (Reference Langhammer, Grab, Bauder and Maurer2019a), with the main difference that it also accounts for glacier bed topography gradients along the glacier boundary.
3.2.2. Ice thickness and volume estimation – observation-based (ITVEO)
The basis of the ITVEO approach for inter- and extrapolating point ice thickness observations to the entire glacier is an ice thickness model that was originally developed for global-scale applications by Huss and Farinotti (Reference Huss and Farinotti2012). In the framework of ITMIX2 (Farinotti and others, Reference Farinotti2021) the approach has been extended to be able to incorporate thickness observations for constraining the model solution to match measurements. This methodology has been further developed in the current study as described in Appendix B.
3.2.3. Final ice thickness distribution and glacier bed topography
The two independent models GlaTE and ITVEO result in ice thickness distributions h glate(x, y) and h itveo(x, y). Since both were computed within identical glacier outlines and produced on identical grids with a 10 m resolution, no further processing was required prior to averaging the two models. With the above notation, the final maps of ice thickness distributions and glacier bed topography is simply obtained from

to which we refer to hereafter as MEAN. It has been concluded from the Ice Thickness Model Intercomparison eXperiments – ITMIX (Farinotti and others, Reference Farinotti2017) and ITMIX2 (Farinotti and others, Reference Farinotti2021), that model ensembles have a higher skill in predicting ice thickness than any individual model, provided all models perform similarly well. In ITMIX2, GlaTE and ITVEO both showed a similarly good performance. Thus, averaging these two models is a first step toward a more robust areal interpolation.
The measured ice thicknesses used as input for obtaining the ice thickness distributions were standardized to be compatible with the DEM as introduced in Section 2. Therefore, DEM, ice thickness distribution and glacier bed topography form a consistent triplet. This permits the glacier bed topography to be determined by subtracting the ice thickness from the DEM. The glacier bed topography is thus consistent with the DEM and, by combining the two, terrain models of the hypothetically completely deglacierized landscape can be generated.
3.3. Ice volumes, homogenization to a specific year and temporal extrapolation
The ice volume of individual glaciers was obtained from summation of interpolated thicknesses at all gridcells, multiplied with the cell area 10 m × 10 m. The resulting ice volumes refer to the recording years of the base data on which the glacier outlines and the surface topography given by the DEM are based on, hereafter referred to as the inventory year. In order to provide a nation-wide ice volume estimate referring to a specific year, a temporal homogenization of the glacier-specific volume to a single year was required. The center year of the 2019-release of swissALTI3D is 2015 (slightly younger according to the area-weighted average), whereas it is 2016 for the SGI2016 (GLAMOS, Reference GLAMOS2020b). We thus decided to homogenize the volume to the year 2016, referred to as the reference year hereafter.
For this homogenization we rely on both long-term geodetic ice volume changes available for each individual Swiss glacier over the period 1980–2010 (Fischer and others, Reference Fischer, Huss and Hölzle2015), and in situ observations of year-to-year mass-balance variability at up to 20 glaciers in all glacierized regions of Switzerland spanning the period 1970–2020 (GLAMOS, Reference GLAMOS1881–2018, Reference GLAMOS2019). For each glacier with direct observations, the annual mass-balance anomaly with respect to that glacier's long-term mean, given by Fischer and others (Reference Fischer, Huss and Hölzle2015), was evaluated and spatially extrapolated to all unmeasured Swiss glaciers based on an inverse-distance weighting scheme. For extrapolation to glaciers North of the main Alpine crest this scheme attributes a higher weight to observed mass balances on the same side of the weather divide, and vice versa for glaciers south of the main Alpine crest. Annual mass-balance anomalies ΔB i,y of glacier i and year y were then superimposed on the glacier's long-term average mass balance $\overline {B}_i$ . Converting glacier mass balance into an annual change in ice volume requires an estimate of the time-evolving area A y for each glacier and a mean density ρΔV = 850 kg m−3 (Huss, Reference Huss2013) for the occurring volume change. Mean annual glacier-specific area-change was derived from the observed glacier area change between 1973 and 2010 (Fischer and others, Reference Fischer, Huss, Barboux and Hoelzle2014). The same rate was also used to extrapolate glacier area up to 2020. Ice volume change ΔV g,y of glacier i in year y is thus obtained as

Summation of annual ice volume changes relative to ice volume for the inventory year, that is the volume based on direct thickness observations, yields series for the evolution of each glacier's volume over time. Overall, ice volume in Switzerland is finally obtained for every year between 1970 and 2020 as the total volume of all glaciers. This series is useful to relate our new regional ice volume estimate to previous studies, and to analyze relative changes in ice volume.
4. Uncertainties
4.1. Point-specific ice thickness uncertainty
The point-specific ice thickness uncertainty is estimated as the standard uncertainty u ±(x, y) in ice thickness at an arbitrary point of the resulting ice thickness models. For its estimation, we consider uncertainties of the ice thickness interpolation $u_{{\rm int}}^{\pm }( x,\; \, y)$ , uncertainties in GPR measurements $u_{{\rm gpr}}^{\pm }( x,\; \, y)$
 and uncertainties in surface elevation $u_{{\rm surf}}^{\pm }( x,\; \, y)$
 . The superscript ‘+’ indicates uncertainty toward larger and the superscript ‘−’ toward smaller ice thickness, respectively. Quantity $u_{{\rm int}}^{\pm }( x,\; \, y)$
 was estimated using a bootstrap technique (Efron, Reference Efron1979), $u_{{\rm gpr}}^{\pm }( x,\; \, y)$
 by repeating the ice thickness interpolation while replacing the measured ice thickness input h GPR by $h_{{\rm GPR}}-\Delta h_{{\rm GPR}}^{-}$
 and h GPR+$\Delta h_{{\rm GPR}}^{ + }$
 , and for $u_{{\rm surf}}^{\pm }( x,\; \, y)$
 we estimated a value which is constant across individual glaciers. More details about the computation of these uncertainty components are given in Appendix C.
Since quantities $u_{{\rm int}}^{\pm }( x,\; \, y)$ , $u_{{\rm gpr}}^{\pm }( x,\; \, y)$
 and $u_{{\rm surf}}^{\pm }( x,\; \, y)$
 are controlled by mechanisms independent from each other, they are presumed to be uncorrelated. The total ice thickness uncertainty at a specific point is therefore obtained from

which is applied separately for quantities u + and u −.
4.2. Ice volume uncertainty
The ice volume uncertainty $\bar u_{{\rm V}}$ is expected to be substantially smaller than the sum of the point-specific ice thickness uncertainties u ±(x, y) introduced above, because values of u ±(x, y) cancel each other out to a certain extent when averaging over entire glaciers and, even more, over the entire Swiss Alps. Since uncertainties in total glacier volumes can be regarded as mean uncertainties, we use the overline-notation to distinguish the volumetric uncertainty components from their point-specific counterparts. The components incorporated for computing $\bar u_{{\rm V}}$
 are the uncertainties in ice thickness interpolation $\bar u_{{\rm int}}$
 , uncertainties due to GPR measurement errors $\bar u_{{\rm gpr}}$
 , uncertainties in glacier area $\bar u_{{\rm area}}$
 and uncertainties due to errors in surface elevation $\bar u_{{\rm surf}}$
 . The GPR measurement errors affect the ice volume uncertainty of glaciers both with and without GPR data, the latter via the model calibration. To distinguish between the two cases, we define $\bar u_{{\rm gpr}} = \bar u_{{\rm w/\, gpr}}$
 for glaciers with GPR data, and $\bar u_{{\rm gpr}} = \bar u_{{\rm w/o\, gpr}}$
 for glaciers without GPR data.
The computation of the ice volumes consists of the summation over all cells and all glaciers. When propagating the errors, we have to consider that uncertainties of individual cells are usually correlated and, for some uncertainty components, a correlation among all glaciers has to be considered as well. Details about the computation of these uncertainty components are given in Appendix D.
For propagating the individual uncertainty components to the total volume uncertainty $\bar u_{{\rm V}, i}$ of an individual glacier i, all components are again presumed to be uncorrelated, leading to an uncertainty of

Across the entire Swiss Alps, it is assumed that $\bar u_{{\rm int}, i}$ and $\bar u_{{\rm gpr}, i}$
 are uncorrelated among different glaciers, whereas a correlation is assumed for $\bar u_{{\rm area}, i}$
 and $\bar u_{{\rm surf}, i}$
 (see Appendix D for further details). From the corresponding Swiss-wide values for these uncertainty components, the uncertainty of the entire ice volume in the Swiss Alps is estimated to be

Quantity $\bar u_{{\rm V}}$ refers to the uncertainty of the ice volume in entire Switzerland for the inventory year, which is 2016 (see Section 3.3). The uncertainty arising by homogenizing ice volumes to a given year y is obtained from

where $\bar u_{{\rm V}}$ is the uncertainty computed from Eqn (5), A y is the glacier area in the year y and A 2016 the one in the reference year. The homogenization uncertainty $\bar u_{{\rm hom}}$
 is defined as the root-sum-square of the uncertainty of the long-term geodetic mass balances, estimated as 0.07 m a−1 (Fischer and others, Reference Fischer, Huss and Hölzle2015), the effect of the uncertain extrapolation of the glacier area change on mass balance, estimated as 0.05 m a−1, and the uncertainty related to the extrapolation of the year-to-year variability in mass balance to glaciers without data, estimated as 0.2 m a−1.
5. Results
5.1. GPR measurements
In the framework of the current study, a total of 890 km of GPR profiles has been recorded during the years 2016 to 2019. Additionally, another 60 km were recorded in spring 2020, which have not been used for our ice thickness interpolation, but are used below in Section 5.2 for an independent validation of our ice thickness model results. Together with the GPR data of previous studies, there is now measured ice thickness along a total of around 2450 km of GPR profiles for the Swiss Alps (Table 1). These data were recorded on 251 different glaciers (red areas in Fig. 1a). Expressed in area, this is a coverage of 81% and it comprises 93% of the total glacier ice volume, computed from the volume estimate of our study. This is a remarkably high coverage. To our knowledge, such a comprehensive coverage of ice thickness observations exists for Iceland (Björnsson and Pálsson, Reference Björnsson and Pálsson2020) but not for other glacierized mountain ranges at a regional scale (here almost 1000 km2 of glacier area). Nevertheless, not all glaciers could be surveyed in an optimal manner, for example with regard to data quality, and with the desired density of observations. To visualize the heterogeneity of the data coverage, we computed the mean of the distances of each point on a glacier to the closest GPR point measurement, d mean−gpr. Resulting values are listed in Table 2 and in the Supplementary material and displayed color-coded in Figure 1. The highest coverage (among the larger glaciers) exists for Glacier de la Plane Morte (A55f/03) with a distance of 57 m to the closest GPR point. The lowest coverages were found for the large glaciers Fieschergletscher (B40/07), and Gornergletscher (B56/07), the latter with the highest value of 810 m. Averaging d mean−gpr over all glaciers with GPR data results in 187 m. The actual location of GPR survey points is displayed in gray in Figure 1b. For Fieschergletscher with its relatively low coverage, we, for example, observe that the large parts of the glacier located on steep slopes have not been surveyed.
GPR contribution from the different sources and how many glaciers (in numbers, area and volume) are covered

aFor sources ‘GlaThiDa’ (3.0.1) and ‘VAW’ (unpublished), see Section 2. ‘New’ refers to the data recorded in this study. Data from ‘GlaThiDa’, ‘VAW’, ‘New (2016–19)’ were used as input for the glaciological modeling, whereas data ‘New (2020)’ were recorded in spring 2020 and used for independent validation only. ‘Total’ is the sum of numbers from all sources (a specific glacier can be covered with data from different sources), and ‘Fraction’ is the percentage from the Swiss-total.
Twenty largest glaciers by volumes, for which GPR data were used for ice thickness modeling. A complete list of glaciers with GPR data is provided in the Supplementary material

The following information is provided: areas according to the SGI2016 (A), volumes (V 2016), mean thickness (h mean) and maximum thickness (h max) of the interpolated ice thickness distributions, mean distance to closest GPR point (d mean−gpr), total profile lengths, year of the GPR survey and the corresponding references for the GPR data. aGPR survey references: [1] Bauder and others (Reference Bauder, Funk and Gudmundsson2003)b; [2] Capt and others (Reference Capt, Bosson, Fischer, Micheletti and Lambiel2016)a; [3] Farinotti and others (Reference Farinotti, Huss, Bauder and Funk2009a) after Thyssen and Ahmad (Reference Thyssen and Ahmad1969); [4] Farinotti and others (Reference Farinotti, Huss, Bauder and Funk2009a)a; [5] Feiger and others (Reference Feiger, Huss, Leinss, Sold and Farinotti2018)a; [6] Fischer and others (Reference Fischer2013)a, Huss and Fischer (Reference Huss and Fischer2016)a; [7] VAW (Reference VAW1998)b; [8] Grab and others (Reference Grab2020); [9] Grab and others (Reference Grab2020) acquired in 2020; [10] Huss (Reference Huss2010)a; [11] Huss and others (Reference Huss, Farinotti, Bauder and Funk2008)a; [12] unpublished GPR data from 2008 (ETHZ) and 2012 (UZH, UFR)a; [13] Huybrechts and others (Reference Huybrechts, Rybak, Nemec and Eisen2008); [14] Lüthi (Reference Lüthi2000)b; [15] Moll (Reference Moll2012)a; [16] Rutishauser and others (Reference Rutishauser, Maurer and Bauder2016)a; [17] Sugiyama and others (Reference Sugiyama, Bauder, Huss, Riesen and Funk2008)a; [18] unpublished GPR data form UFRa; [19] unpublished GPR data ETHZb; [20] Waechter and Roethlisberger (Reference Waechter and Röthlisberger1982)b; [21] Roethlisberger and Funk (Reference Röthlisberger and Funk1987)b; [22] Gudmundsson (Reference Gudmundsson1994) and Funk and others (Reference Funk, Gudmundsson and Hermann1994)b; [23] Lüthi (Reference Lüthi1994)b; [24] Sharp and others (Reference Sharp1993); [25] VAW (Reference VAW2010)b; [26] VAW (Reference VAW2011)b; [27] VAW (Reference VAW2012)b; [28] VAW (Reference VAW2014a)b; [29] VAW (Reference VAW2014b)b; [30] VAW (Reference VAW2017a); [31] VAW (Reference VAW2017b); [32] VAW (Reference VAW2019) aretrieved from GlaThiDa Consortium (Reference GlaThiDa Consortium W2019),bretrieved from GLAMOS (Reference GLAMOS2020a).
5.2. Ice thickness distribution and glacier bed topography
The ice thickness distribution resulting from Eqn (1) is illustrated in Figure 4a for the example region of the Bernese Alps. In this region, Grosser Aletschgletscher (B36/26 in Fig. 1), the largest glacier of the European Alps, reaches a maximum ice thickness of 790 m. Subtracting the ice thickness from the DEM yields the glacier bed topography. This is shown as hillshade in Figure 4b. Parts of the glacier bed topography, which feature overdeepenings, are displayed in red colors, with the color-code indicating the overdeepening depth. For other regions of the Swiss Alps, analogous figures are provided in the Supplementary material.
Ice thickness and glacier bed overdeepenings in the Bernese Alps (see box in Fig. 1): (a) ice thickness distribution. (b) Hillshade of the glacier-bed topography within SGI2016 outlines and color-coded the depth of overdeepenings. For other parts of the Swiss Alps, see the Supplementary material. Background: hillshade from the swissALTI3D after Swisstopo (Reference Swisstopo2019).

5.2.1. GlaTE-, ITVEO- and MEAN performance
A comparison between modeled and measured ice thickness as well as a comparison among GlaTE, ITVEO and MEAN is shown exemplarily in Figure 5 for Kanderfirn, Tschingelfirn and Blüemlisalpgletscher (glaciers marked with IDs A55b/13, A54m/21 and A55b/02 in Fig. 1b). Profiles 3, 7 and 45 are three sections along GPR profiles (Figs 5b to d). Comparisons from all other, not shown, profiles reveal similar insights: in general, we observe a smaller amount of structural details in the modeled ice thickness distributions in comparison with the ice thickness measured with GPR (e.g. Fig. 5c). This is related to the limited resolution of the models (10 m grid size). One could argue that interpolation could be performed on an even denser grid. However, to avoid the appearance of artificial structural details within the large space in-between GPR profiles, a smoothing constraint had to be applied to both models. This counteracts the ability to fit the GPR data, independently from the grid resolution. In most cases, the models fit the measured ice thicknesses well within the measurement uncertainty, indicating that an adequate weight was given to the smoothness constraint. At the glacier margins and especially at the glacier tongues, ice thickness measured with GPR sometimes exhibit larger values than the modeled ice thickness (Fig. 5b). This is because some weight is given to the model boundary constraints, which force the models to approach zero ice thickness toward the glacier margins.
Comparison of glacier bed elevations measured with GPR with modeled glacier bed elevations from MEAN, GlaTE and ITVEO. (a) Map of the region (see also Fig. 1). Location of the selected GPR profiles are shown in orange together with locations of all other profiles measured on these glaciers in black. The purple profiles are transects without GPR data. (b)–(d) Comparison of glacier bed elevations along the selected GPR-profiles. (e)–(h) Comparison of glacier bed elevations along transects without GPR data.

Intercomparing the performance of GlaTE and ITVEO, we observe only small differences between the two models within GPR cross sections. Generally, the GlaTE model converged to a slightly smoother ice thickness distributions compared to ITVEO (e.g. Fig. 5d). This is a result of the somewhat less restrictive constraints of the GlaTE model, which only targets for a fit of 95% of the cells with GPR data (Langhammer and others, Reference Langhammer, Grab, Bauder and Maurer2019a), and was, thus, obtained at the expense of a somewhat poorer GPR fit. For comparing GlaTE and ITVEO at locations not covered by the GPR profiles, a transverse (A) and longitudinal (B) cross section, as well as a section across an ice divide (C), is shown in Figures 5e–g. Furthermore, a transverse cross section on Blüemlisalpgletscher (D) is shown in Figure 5h, for which no GPR data exist at all. As expected, the ice thicknesses of the two models deviate more in these cases than along GPR profiles, with differences of up to ~25% of the local ice thickness for the sections on glaciers with GPR data and up to ~35% for the glacier without any GPR data. In many cases, the ice thickness of GlaTE is larger than the one of ITVEO in the vicinity of the glacier margins, as can be seen in Figures 5f and h. This indicates a slight tendency toward more U-shaped cross sections for GlaTE and toward more V-shaped cross sections for ITVEO. For MEAN, however, pronounced features of the individual models are averaged out, yielding higher robustness against artificial structures that are not evident in the measured ice thickness.
For comparing the ice thickness distribution obtained by modeling with the measured GPR data, modeled ice thickness values were bilinearly interpolated and extracted for the exact GPR locations. Averaged over the entire Swiss Alps, the modeled values fit within the measurement uncertainty for around 85% of the GPR-locations (83% for GlaTE and 86% for ITVEO). As discussed above for the example shown in Figure 5, the main reasons for not fitting the remaining 15% of GPR data are (1) the limited resolution of the models in combination with smoothness constraints, (2) the model boundary constraints which sometimes contradict with the measured ice thickness values, and, in a few cases, (3) contradictory measurements between GPR data from different sources. The latter could not be avoided because the GPR raw data were not available to judge on the reason for the contradiction.
5.2.2. Uncertainty of interpolated ice thicknesses
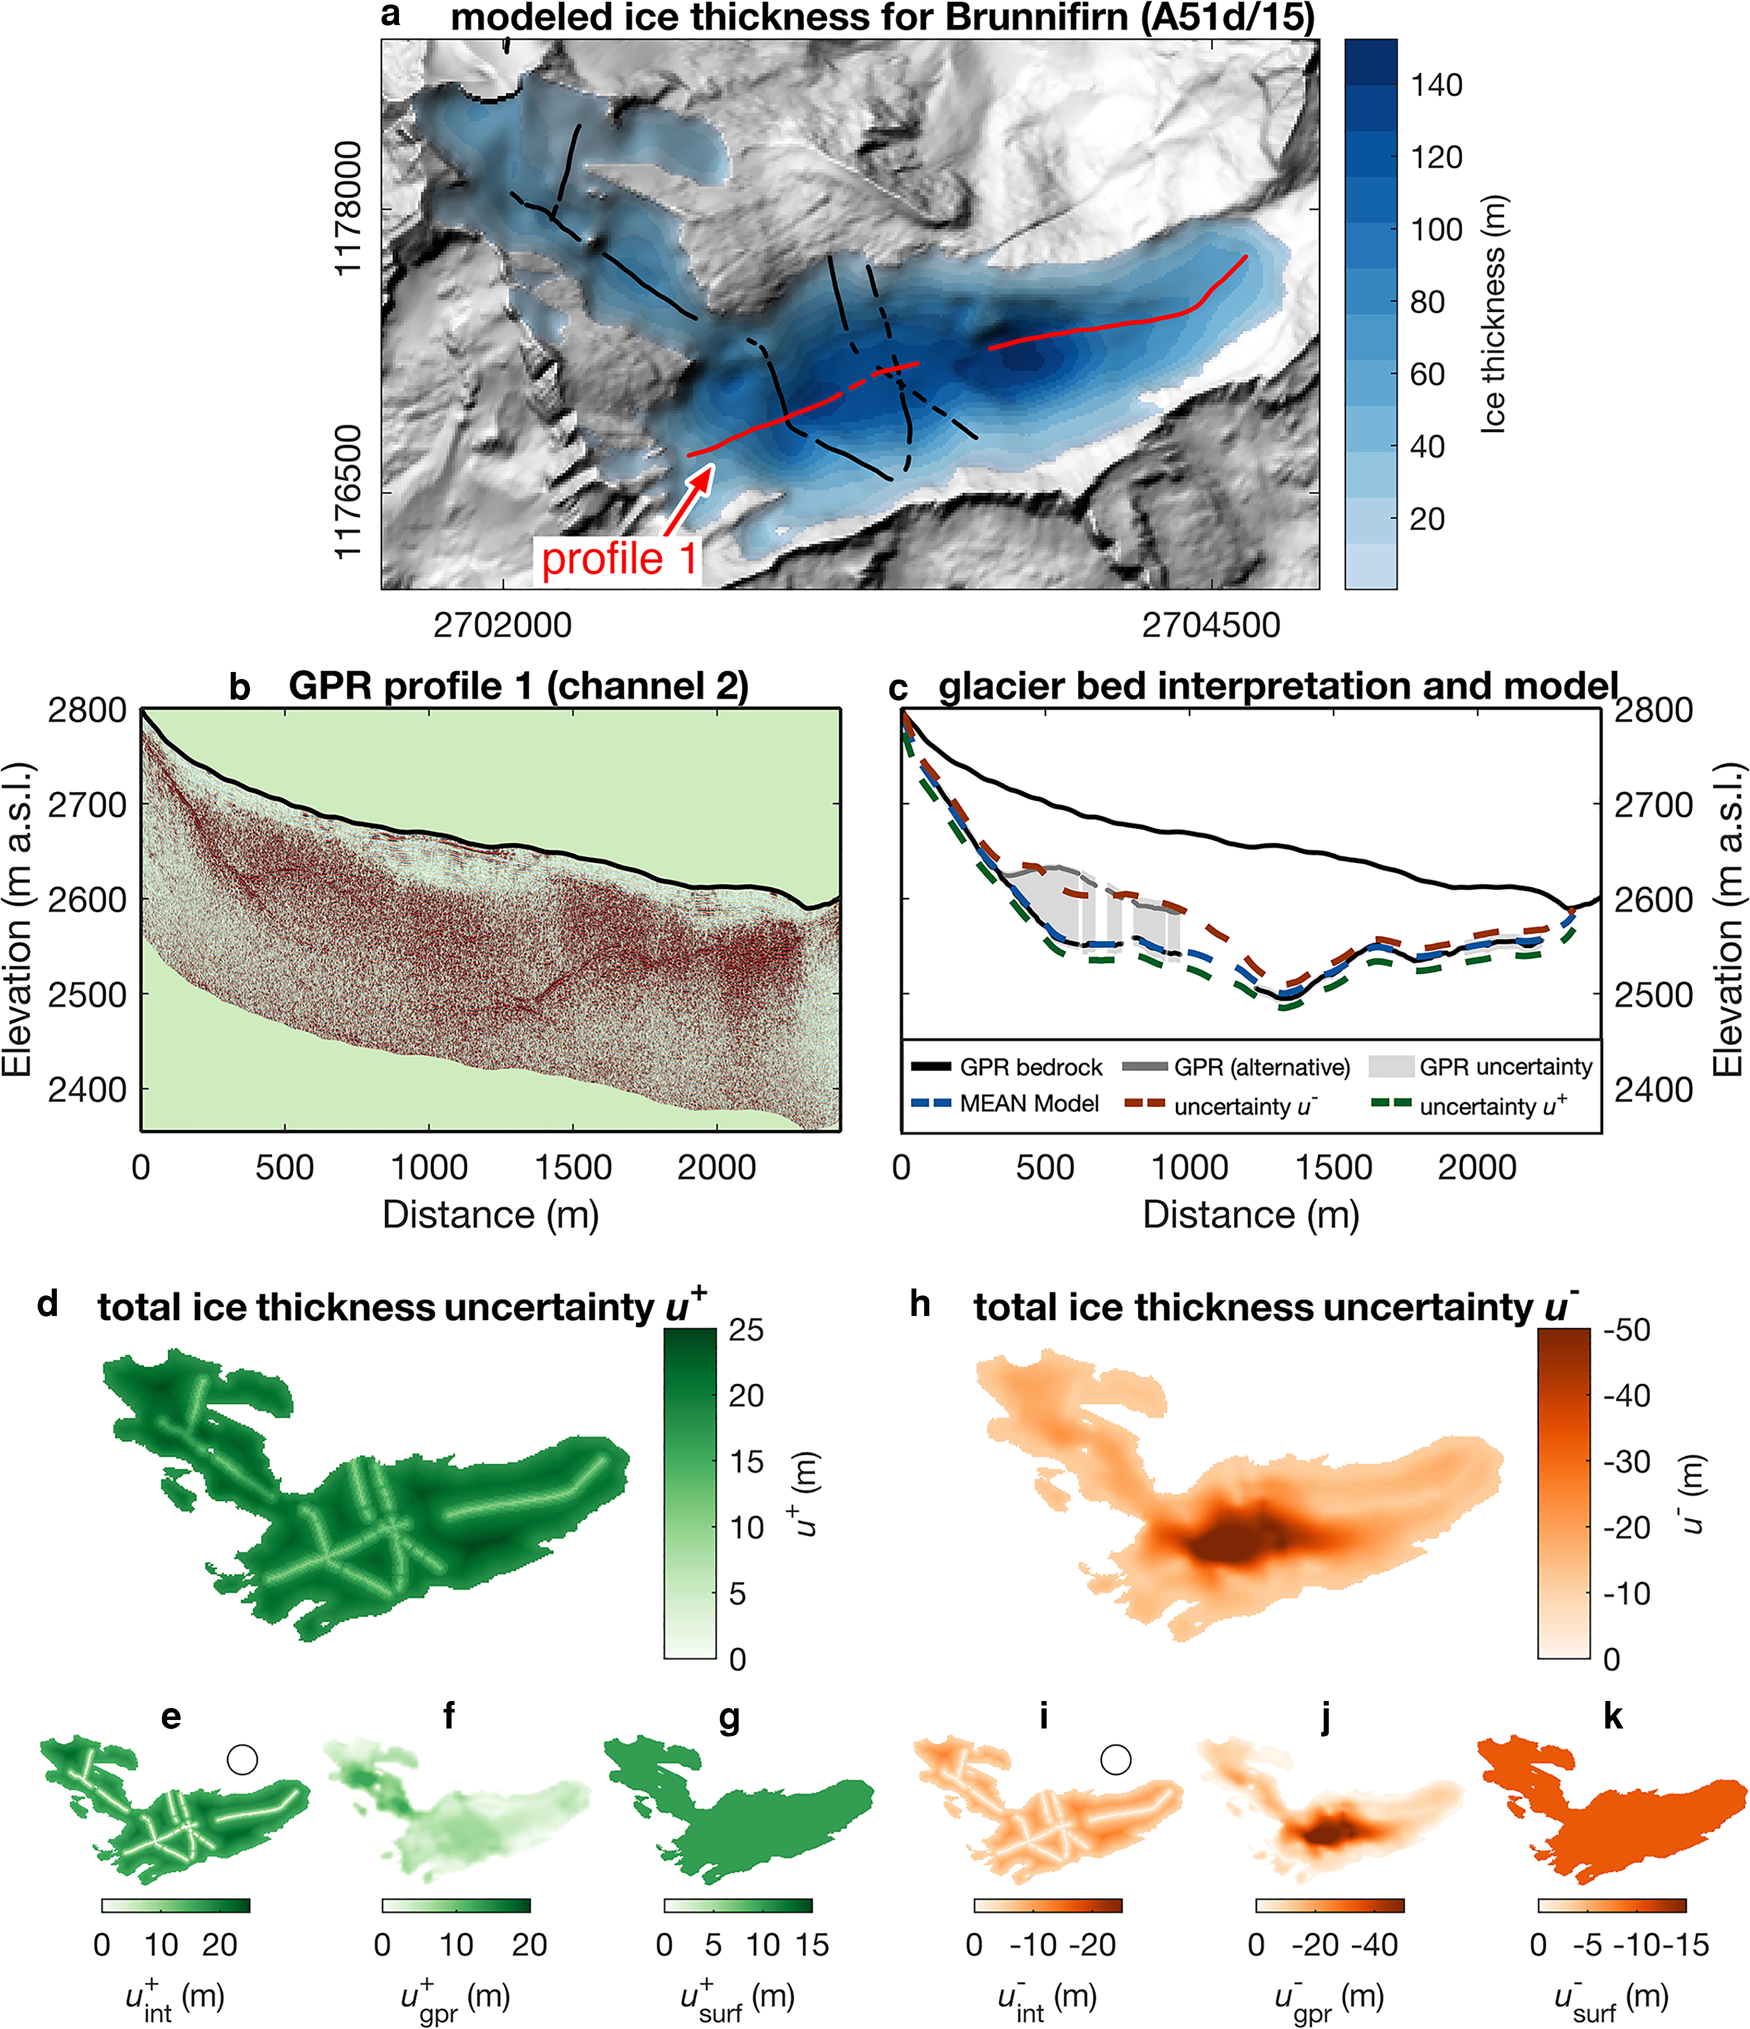
For each point (x, y) of the interpolated ice thickness map, the standard uncertainty u ±(x, y) is estimated from Eqn (3). An example of the resulting uncertainty distribution is presented in Figure 6 for Brunnifirn, a small glacier in central Switzerland (glacier A51d/15 in Fig. 1a). This glacier was selected because some pronounced measurement-uncertainty occur in GPR profile 1. The ice thickness distribution from Brunnifirn reveals ice thicknesses up to ~140 m (Fig. 6a). The GPR data recorded along profile 1 is displayed in Figure 6b, together with its interpreted ice thickness profile shown in Figure 6c. Due to ambiguous reflections in the upper part of this profile, there are large uncertainties in the measured ice thickness. How this impacts the uncertainty of the ice thickness distribution toward smaller and larger ice thickness is presented in Figures 6d and h, respectively. The contribution from the individual error sources, interpolation uncertainty, GPR-uncertainty, and surface elevation uncertainty are displayed in Figures 6e–g and i–k. We observe the lower uncertainty bound to be strongly dominated by the GPR-uncertainty due to the large measurement uncertainty in profile 1 toward smaller ice thickness. In contrast, the GPR-uncertainty toward larger ice thickness is relatively small. Therefore, the interpolation uncertainty is the quantity dominating the upper uncertainty bound for the example of Brunnifirn.
Brunnifirn as an example for estimating point-specific ice thickness uncertainties. (a) Ice thickness distribution with GPR-profile locations. (b) Example GPR-profile and (c) corresponding glacier bed interpretation with uncertainties of the GPR measurement, comparison with the ice thickness model and the model uncertainty. Total ice thickness uncertainty toward larger (d) and smaller (h) ice thickness and the corresponding contribution from interpolation- ($u_{{\rm int}}^{\pm }$ ), GPR- ($u_{{\rm gpr}}^{\pm }$
 ) and surface DEM-uncertainties ($u_{{\rm surf}}^{\pm }$
 ) in the small subpanels (e)–(g) and (i)–(k). The circles shown in (e) and (i) indicate over which distances $u_{{\rm int}}^{\pm }$
 , is expected to spatially correlate (see Section D).
For validating our point-specific uncertainty estimates, we compare u ±(x, y) with the uncertainty intervals $\Delta h_{{\rm GPR}}^{\pm }$ of measured ice thicknesses h GPR acquired on 33 glaciers in the spring 2020 campaigns. These are data that had not been used for the ice thickness interpolation. For nine of these glaciers, older GPR data already existed and have been used for the ice thickness interpolation, whereas for the other 24 glaciers, no data were available before. We find that (i) for 39% of the points, $\Delta h_{{\rm GPR}}^{\pm }$
 is entirely within u ±(x, y), (ii) for 25% of the points, h GPR falls within u ±(x, y) but not the entire interval $\Delta h_{{\rm GPR}}^{\pm }$
 , (iii) for 17% of the points, h GPR is outside u ±(x, y) but part of $\Delta h_{{\rm GPR}}^{\pm }$
 is overlapping with u ±(x, y) and (iv) for 19% of the points, there is no overlap of the uncertainty ranges at all. Compliance, that is, the measurement falls within the modeling uncertainty range, is assumed for both cases (i) and (ii), whereas non-compliance is assumed for both cases (iii) and (iv). From this follows that u ±(x, y) accommodates a total of 39 + 25 = 64% of the measured ice thicknesses, which is in good agreement of u ±(x, y) being the standard uncertainty, which by definition is expected to encompass ~68% of the true ice thickness. For glaciers previously without GPR data, the compliance percentage is similar (66%) to the one for glaciers which already had GPR data (62%).
5.3. Total ice volume in the Swiss Alps
Summing over all glaciers, we find a total ice volume of 59.31 km3 for the MEAN model and the respective inventory year of all individual glaciers. The volumes resulting from the GlaTE and ITVEO models are almost identical, being 59.30 and 59.32 km3, respectively. This high agreement is accidental. In fact, the two models differ slightly more when differentiating between glacier size classes. After homogenization, we find a total ice volume in the Swiss Alps for the year 2016 of V 2016 = 58.8 ± 2.5 km3. For the magnitudes of the uncertainty components for the total ice volume we find $\bar u_{{\rm int}}$ = 0.24 km3, $\bar u_{{\rm w/\, gpr}}$
 = 0.14 km3, $\bar u_{{\rm w/o\, gpr}}$
 = 2.44 km3, $\bar u_{{\rm area}}$
 = 0.30 km3 and $\bar u_{{\rm surf}}$
 = 0.54 km3. Substituting into Eqn (5), it results an uncertainty of $\bar u_{{\rm V}}$
 = ±2.54 km3 or of 4.3%, respectively.
To investigate, how the uncertainty of glaciers of different size and with/without GPR data contribute to the total ice volume uncertainty (for individual glaciers see Fig. S13 in the Supplementary material), the cumulative uncertainty $\bar u_{{\rm V}}$ is consecutively calculated from Eqn (5) for all glaciers with average ice thickness up to a certain size (Fig. 7a). The cumulative ice volume for glaciers with and without GPR data, and the cumulative glacier area, are displayed in Figure 7b. It becomes evident that the predominant part of the volume uncertainty stems from glaciers with average ice thicknesses <50 m, although they only account for around one quarter of the total ice volume. The main factor controlling the uncertainty of these smaller glaciers is $\bar u_{{\rm w/o\, gpr}}$
 , that is the uncertainty of calibrating the ice thickness models for glaciers without GPR data. For all other glaciers, for which GPR data have been acquired, $\bar u_{{\rm surf}}$
 is the most important contribution to the uncertainty, followed by $\bar u_{{\rm area}}$
 , $\bar u_{{\rm int}}$
 and $\bar u_{{\rm w/\, gpr}}$
 .
.
(a) Overall ice volume uncertainties and share of the different uncertainty components computed by cumulating all glaciers according to their average ice thickness. (b) Cumulative ice volume for glaciers with and without GPR data, and cumulative glacier area.

6. Discussion
6.1. Ice volumes from earlier studies
The total ice volume in the Swiss Alps resulting from our study is V 2016 = 58.7 ± 2.5 km3 and, when extrapolating the ice volume to 2020, V 2020 = 52.9 ± 2.7 km3. Earlier estimates of the Swiss glacier volume were presented in various studies based on the glacier inventories of 1973 (Muller and others, Reference Muller, Caflish and Müller1976; Maisch, Reference Maisch2000), 1999 (Farinotti and others, Reference Farinotti, Huss, Bauder and Funk2009a; Linsbauer and others, Reference Linsbauer, Paul and Haeberli2012) and 2010 (Fischer and others, Reference Fischer, Huss and Hölzle2015). Furthermore, Farinotti and others (Reference Farinotti, Round, Huss, Compagno and Zekollari2019) estimated the total ice volumes in the European Alps for the year 2003 and Haeberli and others (Reference Haeberli, Oerlemans and Zemp2019) for the year 2018. The corresponding volume estimates are displayed in Figure 8. Based on empirical relationships between glacier area and mean ice thickness, Muller and others (Reference Muller, Caflish and Müller1976) estimated a volume of 67 km3 and Maisch (Reference Maisch2000) of 74 km3 for the year 1973. Estimations based on measured ice thickness for a subset of glaciers combined with modeled ice thickness have been obtained by Farinotti and others (Reference Farinotti, Huss, Bauder and Funk2009a) with 75 ± 9 km3 and Linsbauer and others (Reference Linsbauer, Paul and Haeberli2012) with 65 ± 20 km3 both for the year 1999, and by Fischer and others (Reference Fischer, Huss and Hölzle2015) with 60 km3 referring to the year 2010.
Temporal extrapolation of the total ice volume in Swiss glaciers for the period 1973–2020 (black curve with gray uncertainty range from Eqn 6) based on the overall volume in 2016 inferred in the current study (red asterisk), see Section 3.3 for details. The time series of overall glacier volume allows direct comparison to previous ice volume estimates for the Swiss Alps (green).

First of all, it is noteworthy that our estimated uncertainty is clearly smaller than the one by Farinotti and others (Reference Farinotti, Huss, Bauder and Funk2009a) and Linsbauer and others (Reference Linsbauer, Paul and Haeberli2012), which we attribute to the larger amount of ice thickness data used compared to previous studies. Furthermore, when homogenizing our results to the corresponding years of the previous estimates we find ice volumes of 65.2 ± 2.8 km3 (2010), of 77.2 ± 4.6 km3 (1999) and of 94.0 ± 10.9 km3 (1973) (Fig. 8). This indicates that the early studies by Muller and others (Reference Muller, Caflish and Müller1976) and Maisch (Reference Maisch2000) likely underestimated the volumes that were present in the 1970s in comparison with our results. High agreement was found with the estimate by Farinotti and others (Reference Farinotti, Huss, Bauder and Funk2009a) with a discrepancy of only ~2 km3. Also for the study by Linsbauer and others (Reference Linsbauer, Paul and Haeberli2012) the error bars overlap, although their ice volume estimate is substantially lower by ~12 km3. The estimate by Fischer and others (Reference Fischer, Huss and Hölzle2015) for the year 2010 is close to our estimate but again slightly lower by ~5 km3, which might be due to the somewhat underestimated glacier area in their inventory (Fischer and others, Reference Fischer, Huss, Barboux and Hoelzle2014) in comparison with the SGI2016 (GLAMOS, Reference GLAMOS2020b). Huss and Farinotti (Reference Huss and Farinotti2012) estimated that Swiss glaciers contribute with 58.7% to the total ice volume of the European Alps. Based on this percentage, the volume estimate by Farinotti and others (Reference Farinotti, Round, Huss, Compagno and Zekollari2019) is equivalent to 75 ± 18 km3 for the year 2003, which closely fits our estimate for the corresponding year. For Haeberli and others (Reference Haeberli, Oerlemans and Zemp2019) it is equivalent to 49 ± 15 km3, which is lower by ~6 km3 in comparison with our results.
It is apparent from Figure 8 that from the newer studies, the ones by Linsbauer and others (Reference Linsbauer, Paul and Haeberli2012) and by Haeberli and others (Reference Haeberli, Oerlemans and Zemp2019) tend to underestimate the ice volumes with respect to other recent estimates and the result of our assessment. It is difficult to investigate whether such differences are related to the ice thickness observations that were available for constraining the individual estimates, or whether they can be attributed to the different type of ice thickness model used. Model types differing from GlaTE and ITVEO are for instance models based on the shallow ice approximation (e.g. Linsbauer and others, Reference Linsbauer, Paul and Haeberli2012) or 2-D approaches based on the continuity equation (e.g. Morlighem and others, Reference Morlighem2011) and on the parallel ice sheet model (e.g. Van Pelt and others, Reference van Pelt2013). Although ITMIX2 (Farinotti and others, Reference Farinotti2021) does not provide a direct answer in our case, no significant differences in performance or biases regarding computed ice thickness between models of different types were found. Overall, ITMIX2 revealed no drift in the model-derived ice thicknesses when restricting the input to fewer observational data. This was the case for both, individual models and the model ensemble. The absence of such a drift indicates that our ice volume estimate at the mountain-range scale is relatively robust with regard to the model types. Therefore, we expect only minor discrepancies in the total ice volume if another model type would have been constrained with the comprehensive set of ice thickness data available today. It is probable, however, that the model type has a larger impact on the volume estimate of individual glaciers or the ice thickness distribution at the local scale. Within the ITMIX2 experiment, GlaTE and ITVEO were part of the group of models giving preference to the reproduction of observational data over internal model consistency. Therefore, including a model that emphasizes internal model consistency might improve our results for glaciers with sub-optimally distributed point observations. Such a model is for instance the one presented by Van Pelt and others (Reference van Pelt2013), which showed a strong performance in ITMIX2.
As introduced in Section 3.3 and presented in Figure 8, our homogenization approach also allows extrapolating the overall ice volume of Swiss glaciers backward in time. Our results indicate a volume of 65.2 ± 2.8 km3 in 2010, 76.5 ± 4.4 km3 in 2000 and 95.1 ± 9.0 km3 in 1980. This indicates that ~0.9 km3a−1 ice were lost between 1980 and 2000, 1.1 km3a−1 between 2000 and 2010 and 1.2 km3a−1 between 2010 and 2020. With reference to the earlier ice volumes, it is ~43% of the Swiss glacier volume that has been lost over the last 40 years, 29% within the last 20 years and around 17% within the last 10 years. These relative ice volume changes confirm the recent acceleration of glacier mass loss presented for example by Zemp and others (Reference Zemp2015) and Beniston and others (Reference Beniston2018).
6.2. GPR data coverage
The measured ice thickness forming the basis of our study will be publicly available. For some of the older data this is already the case through database GlaThiDa (GlaThiDa Consortium, Reference GlaThiDa Consortium W2019) and for all the new data and some data from older studies it is made available in the framework of the study presented here. As displayed in Figure 1, these data cover the overwhelming part of the glacierized areas in the Swiss Alps. Our uncertainty analysis, however, shows that the few glacier areas remaining without GPR data contribute the most to the uncertainty in the Swiss-wide total ice volume due to the uncertainty in model calibration for those glaciers. Therefore, performing GPR-campaigns on the largest glaciers remaining without GPR data to date, would be the most effective option for further reducing this uncertainty. The largest glacier (in volume) without GPR data is Dammagletscher (marked with ID A51f/10 in Fig. 1) with an area of 3.8 km2 and an estimated volume of 0.12 km3. A list with the largest glaciers without GPR data is given in the Supplementary material.
The uncertainty arising from the interpolation procedure between the sparse grid of GPR-measurement locations contributes relatively little to the overall uncertainty of our total ice volume estimate. Therefore, we conclude that no further refinement of the GPR coverage would be required for future volume estimates or similar studies focusing on scales beyond the one of individual glaciers. Recommendations about survey layouts at such scales was deduced from our earlier study (Langhammer and others, Reference Langhammer, Grab, Bauder and Maurer2019a) where we proposed cost-optimized GPR survey layouts.
The interpolation uncertainty contributes significantly to the point-specific uncertainty in ice thickness as, for example, shown in Figure 6d. For specific studies on smaller scales, it might therefore be recommendable to acquire GPR data on denser grids than we have typically done. An example for such a survey is a detailed study that we have performed on the tongue of Oberaletschgletscher, for which data were acquired on a dense grid with around 70 m profile-interspacing as shown in Figure 1 (Oberaletschgletscher marked with ID B36/01).
6.3. Ice thickness distribution and glacier bed topography
The ice thickness maps and the glacier bed topography maps resulting from our study are made publicly available as well. We anticipate these data to be of value for various further glaciological investigations or studies in related fields. For example, the study of Gabbi and others (Reference Gabbi, Farinotti, Bauder and Maurer2012) investigated river runoff projections using a glacio-hydrological model that requires detailed information about the ice thickness distribution as a function of elevation and slope exposition. It was frequently stressed that more accurate ice thickness data are the most important factor for reducing the uncertainty in long-term projections of glacier retreat and corresponding changes in the runoff regime (e.g. Huss and others, Reference Huss, Zemp, Joerg and Salzmann2014), for example to obtain the precise timing of maximum glacier melt volumes (Schaefli and others, Reference Schaefli, Manso, Fischer, Huss and Farinotti2019), or to better predict future hydropower revenue (Gaudard and others, Reference Gaudard, Gabbi, Bauder and Romerio2016). From our data, for example, the total ice volume for individual river catchments and across different elevation bands can be calculated (see Supplementary material). It is important to note here that we homogenized the ice volumes but not the ice thickness distributions. The latter are given for the inventory years defined by the DEM (swissALTI3D and r2019) and thus exhibit some heterogeneity. For this reason, we also deliver the meta data, which provides the inventory year in the form of raster data (Supplementary Fig. S11).
The maps of glacier bed topography provide information on the future valley morphology forming after glacier retreat, which is expected to further accelerate in the coming decades (Zekollari and others, Reference Zekollari, Huss and Farinotti2019). Such a map, for example, contains information on glacier bed overdeepenings, which can be further analyzed with regard to their potential for the formation of future proglacial lakes. Based on the glacier bed topography and the distribution of today's ice volume, various studies have aimed at predicting the size and the formation time of such lakes in the Alps (Frey and others, Reference Frey, Haeberli, Linsbauer, Huggel and Paul2010; Linsbauer and others, Reference Linsbauer, Paul and Haeberli2012; Gharehchahi and others, Reference Gharehchahi2020; Magnin and others, Reference Magnin, Haeberli, Linsbauer, Deline and Ravanel2020; Shugar and others, Reference Shugar2020). Such information is important since future lakes might change the hazard situation in the corresponding regions, or can be large enough to be of economic interest for tourism, fresh water supply or in the context of hydropower (Haeberli and others, Reference Haeberli2016). We have thus analyzed the glacier bed map resulting from our study with regard to locations and volumes of overdeepenings. For the example region of the Bernese Alps, the location of anticipated overdeepenings is displayed in Figure 4b with the color code indicating their depth. In comparison with the earlier study by Linsbauer and others (Reference Linsbauer, Paul and Haeberli2012), there is a good agreement with regard to the locations where the most prominent overdeepenings occur. Computing the total volume of these overdeepenings across entire Switzerland results in a volume of around 1 km3 and delivers an estimate of future lake volumes. More than half of this lake volumes occur in the glacier beds of only four glaciers (Supplementary Fig. S9c). For the same glaciers except for Rhonegletscher, also Linsbauer and others (Reference Linsbauer, Paul and Haeberli2012) observed large overdeepening volumes. The total volume, however, is substantially smaller than the lake volume of ~2 km3 estimated by Linsbauer and others (Reference Linsbauer, Paul and Haeberli2012). The discrepancy can to some degree be explained by the different modeling technique used by Linsbauer and others (Reference Linsbauer, Paul and Haeberli2012) in comparison with the one used here. Nevertheless, since our results are based on substantially larger amounts of measured ice thickness data, it is likely that the total volume of lakes forming in the future in the Swiss Alps is smaller than previously assumed.
When referring to our glacier bed topography, it is important to note that it might also consist of unconsolidated sediment rather than bedrock. Reflections in the GPR images interpreted as the glacier bed, typically originate from the uppermost horizons with a pronounced GPR impedance contrast. In case of porous basal sediment layers saturated with liquid water or of a liquid water film on top of a well consolidated sediment deposit, such pronounced impedance contrasts occur at the base of the ice rather than at the base of the sediment layers. Thus, we expect that our glacier bed topography in general represents the topography at the base of the ice.
7. Conclusions
We have measured the ice thickness of all larger and most medium-sized (≥0.02 km3) glaciers of the Swiss Alps that had not been surveyed before, and we have refined the measurement grids on some of the glaciers with only partial surveys from previous studies. Together with the pre-existing data, measured ice thickness data are now available for 251 glaciers, which account for 81% of the glacierized area in the Swiss Alps. Altogether, these glaciers contain 93% of the total ice volume. With this comprehensive data coverage, our dataset has a great potential for various further investigations.
The measured ice thickness data, available only on the sparse grid of GPR profiles, were interpolated using two independent glaciological modeling techniques, GlaTE and ITVEO, together with the glacier outlines from the Swiss Glacier Inventory 2016 and the digital elevation model swissALTI3D-r2019. The use of more than one algorithm leads to a higher robustness of our results, in particular against interpolation artifacts. We obtained continuous ice thickness and glacier bed topography maps for all glaciers in the Swiss Alps at 10 m resolution, and estimated a total ice volume of 58.7 ± 2.5 km3 for the year 2016 and of 52.9 ± 2.7 km3 for 2020. Thanks to the much more complete coverage of measurements, we were able to estimate the total ice volume, the ice thickness distribution and glacier bed topography with substantially lower uncertainty than in previous studies. The overall uncertainty is mainly controlled by the uncertainty in the ice volume of glaciers remaining without GPR data, which accounts for only 7% of the total ice volume. The volumes of these glaciers were estimated by extrapolating the model calibration from glaciers with GPR data to glaciers without GPR data.
Our results are accessible as the SwissGlacierThickness-R2020 data collection (Grab and others, Reference Grab2020) for further use. This data collection also includes the ice thickness point data, which will be additionally available through a future release of GlaThiDa (Welty and others, Reference Welty2020). We anticipate these data to be of value for various further studies, as, for example, investigations of river runoff projections, or for predicting locations and volumes of proglacial lakes that will occur in the course of glacier retreat. An analysis of our glacier bed topography maps, for example, revealed that the volume of such lakes forming in the future in the Swiss Alps is probably smaller than it was assumed from earlier studies.
Supplementary material
The supplementary material for this article can be found at https://doi.org/10.1017/jog.2021.55
Data and code accessibility
All ice thickness point-data measured with GPR, if not published on GlaThiDa 3.0.1 and except the once presented by Huybrechts and others (Reference Huybrechts, Rybak, Nemec and Eisen2008) and Sharp and others (Reference Sharp1993), are publicly accessible from the ETH Zurich Research Collection as the SwissGlacierThickness-R2020 data package (Grab and others, Reference Grab2020, https://doi.org/10.3929/ethz-b-000434697). The same accounts for the raster data of the modeled ice thickness and of the glacier bed elevations together with the meta data. SwissGlacierThickness-R2020 contains the following datasets:
(1) Ice thickness measured with GPR and estimation of measurement uncertainty for the entire Swiss Alps and for each glacier (ASCII and SHP)
(2) Ice thickness map, valid for the inventory years (after swissALTI3D (r2019) metadata) for the entire Swiss Alps and for each glacier (TIF)
(3) Ice thickness uncertainty map for the entire Swiss Alps and for each glacier (TIF)
(4) Map with inventory year of each ice thickness model cell, according to metadata of swissALTI3D (r2019), for the entire Swiss Alps and for each glacier (TIF)
(5) Glacier bed map for the entire Swiss Alps and for each glacier (TIF)
The data formats are given in brackets, with ‘ASCII’ indicating ascii text files, ‘SHP’ indicating shape files and ‘TIF’ indicating geo-tiff files.
A Matlab implementation of GlaTE, together with test datasets was described by Langhammer and others (Reference Langhammer, Grab, Bauder and Maurer2019a). An updated version according to the current study is available at https://gitlab.com/hmaurer/glate.
Acknowledgments
The authors thank Beat Rinderknecht from BRTECHNIK and Christoph Bärlocher from ETH Zurich for constructing the GPR platform with great inventiveness and technical know-how, and Patrick Fauchère (also involved in the development phase) from Air Glacier and Hansueli Bärfuss from Heli Bernina for their passionate support in planning and conducting the field campaigns. Many thanks also go to Martin Funk, who supported us at the beginning of this project as the head of the Glaciology group at ETH Zurich. Under his lead, in cooperation with Norbert Blindow, and financed by the canton of Valais, helicopter-borne GPR campaigns were conducted on numerous glaciers in the Valais Alps, which motivated us to conduct the work presented here. At the same time, a data management was initiated by Yvo Weidmann, what was of great help during the entire course of our study. Fabian Amman with his master thesis, Pascale Carlen with her bachelor thesis, and Hendrik Pormes and Serafine Kattus during their student internships contributed to the work presented in this study. Financial support was provided by the Swiss Geophysical Commission SGPK, the Swiss Competence Center for Energy Research – Supply of Electricity (SCCER-SoE, Innosuisse), the Swiss National Science Foundation (grant numbers 200021_169329/1 and 200021_169329/2), and by ETH Zurich.
APPENDIX A. Interpolation with GlaTE
The way the model after Clarke and others (Reference Clarke2013) was implemented in GlaTE requires a DEM and glacier outlines as input data, whereas an apparent mass balance was calculated following Farinotti and others (Reference Farinotti, Huss, Bauder, Funk and Truffer2009b). The subdivision of individual glaciers into flowsheds, as required by the method of Clarke and others (Reference Clarke2013), was computed from the DEM with the Matlab®-based TOPO-Toolbox (Schwanghart and Kuhn, Reference Schwanghart and Kuhn2010).
In a first step of GlaTE, the Clarke model, yielding ice thickness distributions h Clarke(x, y), was calibrated using all available GPR data at locations (x gpr, y gpr) such that

with α = 1, by adjusting the apparent mass-balance gradients for the accumulation and ablation areas, with a constant ratio of 1.8 between the two (Farinotti and others, Reference Farinotti, Huss, Bauder, Funk and Truffer2009b). This means that in average, the ice thickness predicted from the model match with the ice thickness measured with GPR. The calibrated model was used for all glaciers without GPR data, whereas the spread of the glacier-specific α values observed from all glaciers with GPR data were considered in the uncertainty analysis (Appendix D).
For all glaciers with GPR data, we accounted for measured ice thicknesses in a systematic manner using the inversion scheme of GlaTE. For the current study, this inversion scheme was modified after Langhammer and others (Reference Langhammer, Grab, Bauder and Maurer2019a) and is of the form:

where h Clarke is a 1 × m array containing the ice thickness of the Clarke model, which is on a regular grid of dimension n x × n y = m, and h glate is a 1 × m array containing the ice thickness after applying constraints to the Clarke model. These constraints are the GPR-ice thickness h GPR, zero ice thickness at the glacier boundary, and a smoothing constraint, which are assigned to the corresponding modeling cells via the operators G, B0 and S, respectively, as explained in detail in Langhammer and others (Reference Langhammer, Grab, Bauder and Maurer2019a). Additionally, a constraint for the glacier bed slope close to the glacier boundary was introduced. It consists of an estimate of the glacier bed elevation gradient in the vicinity of the glacier boundary, $\nabla h_{\rm bound}$ , which was obtained by extrapolating the elevation gradient of the surface elevation DEM adjacent to the glacier into the glacier area. It was applied to the glacier model via the difference operator Bgb, which is a sparse matrix of dimension m × m populated only for model cells which are <4 cell-widths away from the glacier boundary. Another modification in comparison with Langhammer and others (2019b) is that for debris-covered areas the apparent mass-balance gradients were reduced by 40% (e.g. Nicholson and Benn, Reference Nicholson and Benn2006).
In Eqn (A.2), λ1, λ2, λ3 and λ4 are the weighting factors for the corresponding constraints. When inverting for h glate, the goal was to give maximum weights to the Clarke model and the smoothness constraint while still fitting the GPR data. This was achieved by setting λ1 = λ3 = 1 and defining values for λ2 and λ4 in an iterative manner. Starting with λ2 = 0.5 and λ4 = 12 we iteratively increased λ2 and decreased λ4 as long as the ice thickness of the GlaTE model h glate matches a minimum of 95% of the ice thickness measured by GPR within the uncertainty interval $[ h_{{\rm GPR}} -\Delta h_{{\rm GPR}}^{-},\; \, h_{{\rm GPR}} + \Delta h_{{\rm GPR}}^{ + }]$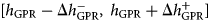 . This procedure was applied to all except for 12 glaciers, which required a glacier model weight of λ2 = 0.1 in order to appropriately fit the GPR data. The grid size of the GlaTE model was defined depending on the size of the glacier and was 10, 30 or 50 m, and up-sampled to 10 m grid size before averaging with the ITVEO model.
APPENDIX B. Interpolation with ITVEO
The basic ice thickness model behind ITVEO builds on the concepts of Farinotti and others (Reference Farinotti, Huss, Bauder, Funk and Truffer2009b), but avoids the necessity of defining ice-flow lines and catchments by performing all computations on 10 m elevation bands sampled from the surface topography. The model takes into account variations in the valley shape and the basal shear stress along the glacier's longitudinal profile, as well as the variability in basal sliding along the glacier. Based on calibrated apparent mass-balance gradients, ice volume fluxes are estimated, and thickness is calculated by inverting the flow law for ice (Glen, Reference Glen1955). Computed averages of elevation-band ice thickness are extrapolated to a regular grid by considering both local surface slope and distance from the glacier margin. We refer the reader to Huss and Farinotti (Reference Huss and Farinotti2012) for more details.
The ITVEO approach performs an optimization of computed ice thickness distribution on all individual point thickness observations at the scale of individual glaciers in a three-step procedure including (i) model optimization, (ii) spatial bias correction of modeled thickness and (iii) spatial interpolation based on measured point data and bias-corrected model results for un-surveyed regions. In a first step, the apparent mass-balance gradient (Huss and Farinotti, Reference Huss and Farinotti2012) is calibrated to minimize the average misfit of computed thickness with the available observations. The apparent mass balance is computed as in Huss and Farinotti (Reference Huss and Farinotti2012) with two linear elevation gradients for the ablation and the accumulation area (with a fixed ratio of 1.8) prescribing a balanced mass budget of the entire glacier. In addition, negative apparent mass balance over debris-covered areas has been reduced by 40% to account for lower melt rates in these regions (e.g. Nicholson and Benn, Reference Nicholson and Benn2006). Second, relative differences of modeled and measured point ice thicknesses were averaged using an inverse-distance weighting scheme in a radius of 50–500 m (depending on glacier size) for every gridcell and results were then spatially interpolated. After smoothing this relative spatial ice thickness correction field is superimposed on the computed ice thickness distribution, resulting in a bias-corrected model-based ice thickness distribution. Although this result is corrected for errors in the model at the intermediate scale, it will not perfectly match GPR thickness on the profile. In a final and third step, the thickness distribution was thus spatially interpolated based on (1) all available thickness observations, (2) the model results adjusted in steps (i) and (ii), buffered in a distance of between 20 and 200 m (depending on glacier size) around the direct observations and (3) the condition of zero thickness on the glacier margin. This approach yields an agreement of the final ice thickness distribution at the point observations and relies on computed thickness, optimally adjusted to the measurements, in regions of the glacier without data. The ITVEO approach was used to evaluate thickness distribution for all 235 (recordings until 2019) glaciers with direct observations. For glaciers, without point thickness data (19% of the overall glacier area in Switzerland) average parameters of the apparent mass-balance gradient for the respective glacier size class originating from step (i) were taken to run the ice thickness model.
APPENDIX C. Components of point-specific ice thickness uncertainty
Components considered when estimating point-specific ice thickness uncertainties from Eqn (3) are the interpolation uncertainty $u_{{\rm int}}^{\pm }( x,\; \, y)$ , the GPR measurements uncertainty $u_{{\rm gpr}}^{\pm }( x,\; \, y)$
 and the surface elevation uncertainty $u_{{\rm surf}}^{\pm }( x,\; \, y)$
 .
.
For estimating $u_{{\rm int}}^{\pm } ( x,\; \, y)$ , a similar experiment is performed as the one presented by Farinotti and others (Reference Farinotti2021), which is a form of the bootstrap technique (Efron, Reference Efron1979). The model-based ice thickness interpolation is repeated 30 times with GlaTE and ITVEO based on randomly selected subsets (20, 50 and 80%, 10 times each) of the total GPR data. The deviations between modeled and measured ice thickness at locations of skipped data were then analyzed with respect to the distance d to the closest retained point with measured ice thickness. In contrast to Farinotti and others (Reference Farinotti2021), points at the glacier boundary, where ice thickness is known to be zero, are also regarded as points with known ice thickness. Model misfits Δh are defined as deviations of the modeled ice thickness from the GPR-ice thickness plus/minus the GPR-measurement uncertainty, and normalized by the modeled mean ice thickness of the corresponding glacier, $\bar h_i$
 . The distribution of the ice thickness deviations is shown in Figure S12 (Supplementary material) for 50-m distance intervals. For better visibility, zero-misfit values are clipped. They are strongly predominating because any fit within the GPR-uncertainty is regarded as a zero misfit.
For each distance interval, the mean and 2σ-confidence interval of the model misfit distribution was computed (red symbols in Supplementary Fig. S12). For distances up to around 500 m, the dataset of model misfits is densely populated and we find a steady increase of the ice thickness deviation with increasing distance. To transfer this misfit to modeling cells without GPR data, a linear regression is fitted through the 2σ-confidence intervals for the distance ranges from 50 to 500 m and we find

and

for misfits toward larger and smaller ice thickness, respectively. For glaciers without GPR data, Eqns (C.1) and (C.2) are applied using only the distance to the glacier boundary to specify d.
The impact of the GPR measurement uncertainty at each point on the glacier, $u_{{\rm gpr}}^{\pm } ( x,\; \, y)$ , is estimated by repeating the ice thickness modeling while consistently using the maximum and minimum ice thickness with respect to the GPR uncertainty range. From model-based interpolation using minimum/maximum observed thickness for all glaciers with GPR data, a minimum–maximum range plus one standard deviation of the ice thickness calibration for glaciers without GPR data is calculated, yielding an estimate of $u_{{\rm gpr}}^{\pm } ( x,\; \, y)$
 for those glaciers.
For the uncertainty in surface elevation, we assume $u_{{\rm surf}}^{\pm } ( x,\; \, y) = \pm 10$ m. Parts of this estimate are due to the uncertainty of the DEM, which according to Swisstopo (Reference Swisstopo2019) is 1–3 m for elevations above 2000 m a.s.l. Larger parts, however, are expected from defining the glacier surface elevation at the time of GPR data acquisition. For glaciers, for which the surface elevation was not properly logged during GPR data acquisition, the uncertainty in surface elevation is set to $u_{{\rm surf}}^{\pm } ( x,\; \, y) = \pm 20$
 m.
m.
APPENDIX D. Components of the ice volume uncertainty
Components considered when estimating ice volume uncertainties from Eqns (4) and (5) are the interpolation uncertainties $\bar u_{{\rm int}}$ , GPR measurement uncertainties $\bar u_{{\rm gpr}}$
 , glacier area uncertainties $\bar u_{{\rm area}}$
 and surface elevation uncertainties $\bar u_{{\rm surf}}$
 . In contrast to the point-specific uncertainties in ice thickness, they have to be expressed as volumetric uncertainties under consideration of potential spatial correlations.
The point-specific interpolation uncertainty $u_{{\rm int}} ^{\pm } ( x,\; \, y)$ (Appendix C) is correlated with various degrees with the uncertainty of other cells, depending on inter-cell distance, GPR-data coverage and the lateral shape of the glacier. For propagating the spatially distributed ice thickness uncertainty to the volumetric interpolation uncertainty $\bar u_{{\rm int}, \, i}$
 of an entire glacier i, we therefore follow the approach introduced by Rolstad and others (Reference Rolstad, Haug and Denby2009), which takes this spatial correlation into account. From a variogram analysis after Schwanghart (Reference Schwanghart2020), the correlation length a i is obtained for each glacier, which is a measure of the circular area $\pi a_i^{2}$
 , over which $u_{{\rm int}}^{\pm } ( x,\; \, y)$
 is typically correlated. For the example of Brunnifirn we find a = 170 m. This is the radius of a circular area of the size of the black circle in Figures 6e and i, which roughly fits into the largest areas not covered with GPR data or into side-branches of the glacier. From the correlation length and the standard deviation of $u_{{\rm int}, \, i}^{\pm } ( x,\; \, y)$
 , the volumetric interpolation uncertainty is computed from (after Rolstad and others, Reference Rolstad, Haug and Denby2009)

where n is the number of gridcells inside the glacier outline, L is the grid resolution and σint, i is the standard deviation of $u_{{\rm int}, \, i}^{\pm } ( x,\; \, y)$ over the entire glacier. In cases where the variogram analysis yields correlation lengths of similar dimension to glacier size, as sometimes occurring for very small glaciers, $u_{{\rm int}}^{\pm } ( x,\; \, y)$
 has to be expected to be strongly correlated across the entire glacier. In this case, we compute $\bar u_{{\rm int}, \, i} = \sum _{k = 1}^{p} u_{{\rm mod}, \, k}^{\pm } ( x,\; \, y)$
 , where p is the number of cells. For cells of different glaciers, no correlation is assumed and the volumetric interpolation uncertainty of all m glaciers is computed from

Volumetric uncertainties due to GPR errors are treated separately for glaciers with (subscript ‘w/’) and without (subscript ‘w/o’) GPR data, with $\bar u_{{\rm gpr}}^{2} = \bar u_{{\rm w/\, gpr}}^{2} + \bar u_{{\rm w/o\, gpr}}^{2}$ . For obtaining $\bar u_{{\rm w/gpr}, \, i}$
 , ensemble modeling is performed, assuming the GPR-uncertainty to be correlated only within specific GPR-profiles. Therefore, the ice thickness modeling of all m glaciers is repeated 10 times, while the GPR-ice thickness is varied within the interval $[ -c \Delta h_{{\rm GPR}} ^{-},\; \, c \Delta h_{{\rm GPR}}^{ + }]$
 with c being randomly chosen from a uniform distribution within the interval [0, 1] for each GPR-profile. For each realization j the ice volume $\tilde V_{i, j}$
 is computed. The uncertainty for an individual glacier i with ice volume V i is then given by the standard deviation of the volume differences:

Across different glaciers, $\bar u_{{\rm w/\, gpr}, \, i}$ is assumed to be uncorrelated. Therefore, uncertainty of the overall ice volume in Switzerland with respect to interpolation errors is given by

For glaciers without GPR data, the volumetric uncertainty is estimated from the ice volume difference resulting from calibration with minimum and maximum GPR-uncertainties plus one standard deviation of the corresponding α-values observed from GlaTE modeling according to Eqn (A.1). For both models GlaTE and ITVEO, this leads to ice volume uncertainties of ~±20%, and from the GlaTE model, the standard deviation of α from all glaciers with GPR data is found to be 30%. Therefore, we set $\bar u_{{\rm w/o\, gpr}, \, i} = \Delta \alpha V_i$ with Δα = (0.2 + 0.3). The uncertainty of the summed ice volumes of all glaciers without GPR data, V w/o is defined as $\bar u_{{\rm w/o\, gpr}} = \Delta \alpha V_{{\rm w/o}}$
 .
.
The range of errors in the areal extent of the glaciers, given by the SGI2016, is expected to be in the order of 5%. We observed a difference of this magnitude when comparing the SGI2016 with the glacier area given by Weidmann and others (Reference Weidmann, Bärtschi, Zingg and Schmassmann2019). To express it as a volume uncertainty, the area-uncertainty is multiplied with an estimate in ice thickness of the corresponding area. This ice thickness is much smaller than the overall mean ice thickness $\bar h_i$ , since the areas in question are observed (by comparing with Weidmann and others, Reference Weidmann, Bärtschi, Zingg and Schmassmann2019) to be at the glacier margins and inside narrow snow-filled gorges. Here, this thickness is set to $( {1}/{10}) \bar h_i$
 . Therefore, the uncertainty for individual glaciers i with area A i is then estimated from $\bar u_{{\rm area}, \, i} = 0.05 A_i ( {1}/{10}) \bar h_i$
 . It is potentially strongly correlated among all glaciers, for example by systematically missing glacier parts in the shadow of high rock cliffs with very poor visibility on orthoimages. Thus, for the overall Swiss-wide volume uncertainty we compute $\bar u_{{\rm area}} = \sum _{i = 1}^{m} \bar u_{{\rm area}, \, i}$
 .
.
Errors of the DEM are expected to be partially averaged out, when averaging across larger areas. However, in case of spatial correlations, e.g. with slope and exposure, some systematic errors will still be inherent. An error dz = 0.5 m is thus assumed which is substantially smaller than the point-specific error of 10 m introduced above. For glaciers with erroneous surface elevation in the GPR dataset (see Section 2) we use dz = 10 m. The volumetric uncertainties with respect to surface elevation errors are then set to be $\bar u_{{\rm surf}, \, i} = A_i\, {\rm d}z_i$ and $\bar u_{{\rm surf}} = \sum _{i = 1}^{m} A_i\, {\rm d}z_i$
 .
.


 Open access