

INTRODUCTION
Although pet dogs often live singly or in small groups within a household, they also have a social network with other dogs that they meet, usually on walks. So far, little is known about the structure of social networks for pet dogs. Past work has focused mainly on the ecology of free-roaming dogs (e.g. [Reference Meek1–Reference Boitani and Serpell4]), owned and stray-dog populations in rabies areas (e.g. [Reference Matter5, Reference Kitala6]), or studied the individual behaviours in dog–dog interactions [Reference Bradshaw and Lea7]. There has been no research into the frequency, extent and nature of contact within a population of owned pet dogs in Western society. However such contacts are potentially important for a number of reasons, including both the spread of disease within the dog population, and the possible spread of zoonotic disease from dogs to humans.
Many factors, essentially host and pathogen characteristics, and environment, influence disease transmission, but clearly the opportunities for contact, and the nature of the contacts between hosts will play a major role. In pet dogs, this may relate not only to the individual behaviour of the dog, but the management of the dog by the owners, both within and outside the home. We have previously carried out a community-based questionnaire study which examined dog–dog and dog–human interactions in terms of management and behaviour, mainly within the household [Reference Westgarth8].
Data was also obtained from this community on the walking patterns of owners and dogs outside the home. The aim of the present study was to explore these data using social network analysis and discuss the potential implications of the network structure for disease transmission. In particular, we investigated (a) the use of public space for dog-walking, (b) the potential for contact among households through dog-walking and (c) factors affecting these. Whilst we did not measure actual physical contact between dogs, the information gained provided us with an opportunity to assess the potential for contact between dogs being walked in the same areas and in the same time periods. Dogs utilizing shared time and space could also contact pathogens indirectly through, for example, investigation of urine or faeces.
Although dogs have not yet been studied in this way, social network analysis has been used in a number of other species to investigate contact between individuals in relation to infectious disease transmission [Reference Christley and French9–Reference Corner, Pfeiffer and Morris13]. This approach enables consideration of the patterns in which individuals are linked in small groups and as part of a larger network [Reference Friedman and Aral14]. Each individual or unit of study is classed as a ‘node’ and connected to other nodes through ‘ties’. In the case of infectious disease, ties can represent a risk-potential linkage between two individuals, where infection could be spread if an infectious agent was present [Reference Friedman and Aral14]. Many previous studies analyse network data as one mode (i.e. involving contact between a single class of nodes [Reference Christley and French9, Reference Klovdahl10, Reference Corner, Pfeiffer and Morris13, Reference Lusseau15]). Here we collect two-mode network data (i.e. incorporating two different node sets of walking areas and dog-owning households). We use a combination of one- and two-mode network analytical approaches, thus minimizing information loss [Reference Borgatti and Everett16]. Understanding of such contact networks provides insight into transmission dynamics and may aid identification of targets for intervention and control [Reference Shirley and Rushton17–Reference Shirley and Rushton20].
MATERIAL AND METHODS
A doorstep interview of 1278 households in a community in Cheshire, UK [Reference Westgarth21], identified 260 dog-owning households that were subsequently recruited into a questionnaire study of owner and dog behaviour and general management [Reference Westgarth8]. The community studied is on the edge of a town and was selected because it is reasonably well defined by natural boundaries; has a mixture of medium- and low-density housing; has public amenities including parks; and is near to sports fields, a wildlife reserve and agricultural land. At the tim.e of data collection, study participants were also provided with a map of the local area on which to mark any regular routes used for dog walks. For data analysis in the present study, the map was divided into 768 square grids (each representing an area 125 m×125 m) and each grid area that was entered by a household during their dog walks was recorded. The subsequent two-mode network generated consisted of households linked to grid areas. This was then further converted to a one-mode network of households that contacted each other via common walking areas.
Network characteristics calculated included: degree of a node, defined as the number of ties incident upon that node (i.e. number of households walking in an area or number of areas walked in by each household); the density of a network, comparing the numbers of ties present to the theoretical maximum number of ties; the minimum path length, i.e. shortest number of steps to travel between two nodes (e.g. two households), and the average clustering coefficient, which is the average probability that two neighbours of a given node are also neighbours of each other. (For further explanation of network terminology and methodology see refs [Reference Borgatti and Everett16, 22–24].)
For each household, the number of different grid areas visited (two-mode household degree) was analysed for associations with other data using Kruskal–Wallis tests in Minitab [22] as the data did not follow a normal distribution. These included dog types (UK Kennel Club breed type, size, age, sex, neuter status), household types (number of dogs, number of people, age of people, occupations), walk frequency, walk length, whether they regularly walk in the same place or have varied walks, travel outside of the local area for walks, walking with friends or allowing the dog off lead [Reference Westgarth8]. The same analyses were also performed for the number of households contactable through common grid areas (one-mode household degree) in which households were considered connected if they walked in at least one area in common. One measure of the strength of the contact between households is the number of areas in which they walked in common (i.e. a valued network). In order to assess the effect of more stringent definitions of potential contact, these data were also analysed by using different cut-off values (e.g. only considering contact among households which walked in 10 or more areas in common).
It could be argued that dogs that are walked through street areas may be more likely to be on lead and possibly less likely to physically interact even if they are walked through the same place at the same time, unless owners stop to talk to each other or allow their dogs to interact. For this reason, the map was also analysed for areas of park, field and public footpath, termed ‘green areas’, where the dogs may have been more likely to be off lead and free to interact if they come across each other. Eighteen such areas were identified (GA1–18); the smallest was contained in one grid area, the largest in 23 grids. A second two-mode network using households linked to green areas was constructed. In order to investigate the temporal effect of time of walk on network structure, the ‘green areas’ network was also analysed following subdivision according to the reported time of walking (categorized as 06:00–09:00, 09:00–12:00, 12:00–15:00, 15:00–18:00, 18:00–21:00 and 21:00–24:00 hours). Some households were categorized as ‘varied’ if they did not walk at a regular time, and these were evaluated within their own network. Normalization of the degree of each green area was performed in order to compare their importance in the network during different time periods. A method specific to two-mode networks was used [Reference Borgatti and Everett16], essentially:
Excel [23] and Minitab [22] were used to graphically represent data. Clustering of the dog-walking areas, based on the number of households visiting each grid area was illustrated using a filled contour map (R statistical package [24, Reference Crawley and Crawly25]) and the significance of clusters tested using the spatial scan statistic [Reference Kulldorff26]. The social network analysis software UCINET and Netdraw [Reference Borgatti, Everett and Freeman27] were used to visualize the networks. Network statistics such as density, node characteristics such as normalized degrees, and minimum path length between nodes were calculated initially in UCINET and then adjusted in Excel [23] using methods developed specifically for two-mode networks as appropriate [Reference Borgatti and Everett16].
Hierarchical clustering (Ward's method) was used to identify subgroups of households and green areas. For this, main clusters of households were first identified on the basis of their use of green areas. Subsequently, clusters of green areas were identified on the basis of their use by households. That is, hierarchical cluster analysis was performed separately on the rows (households) and columns (green areas) of the two-mode contact matrix. This indirect approach to block modelling was performed using the R statistical package [24].
RESULTS
Of the 1278 households initially surveyed, 1142 were contacted (89%), and 260 (owning 327 dogs) were recruited into the questionnaire study (of 264 dog-owning households identified). In total, 224 households returned the questionnaire [Reference Westgarth8, Reference Westgarth21]. Marked maps were provided by 214 households (96% of those that returned the questionnaire and 82% of all dog-owning households recruited). In total, 524 of the potential 768 grid areas were utilized for dog-walking and there was a high level of connectivity between the nodes.
Use of public space
Households reported utilizing between 1 and 258 grid areas with a median of 25. In network terms, this is defined as the two-mode household degree. These data were highly skewed, with most households reporting visiting only a few areas but a few households reporting large numbers (Fig. 1a). Several factors were associated with the number of grid areas visited during dog-walking (Table 1). There was an association between the number of dogs in the house and the number of areas visited: one-, two- and three-dog households had median numbers of areas visited of 23, 31 and 50, respectively (P=0·01) although the outliers with the very high numbers of areas visited were still mostly one-dog households.
(a) Distribution of number of grid areas visited per household (two-mode household degree). (b) Plot of the number of other household-to-household contacts through use of common grid areas (one-mode household degree) against number of areas visited (two-mode household degree). (c) Plot of the large component size (number of connected nodes) at different tie strengths between the nodes, for the one-mode network of contact between households through use of common grid areas. (d) Distribution of number of households visiting each grid area (two-mode area degree) (log-log scale).
Frequency of attributes of the households and dogs in the study

Dogs that visited higher numbers of areas were reported to spend more time off lead (P=0·001), had longer average walk durations (P<0·001), and had varied walk routes, rather than walking in the same place (P<0·001). The dog owners that walked in many areas also reported higher frequencies of taking the dog outside of the local area (i.e. outside the area illustrated in the map provided) to be walked (P=0·01). There was no evidence for an association between number of areas visited and general type (known breed, cross or unknown), size, sex, neutered status or age of dog. There was also no evidence for an effect of: number of people in the household, ages, or occupations of the people in the household, frequency of walks or commonly walking with a group of friends.
There was a nonlinear relationship between the number of grid areas visited and the number of other households that a household may contact through these areas (Fig. 1b) with the two-mode degree increasing approximately logarithmically with one-mode degree. Thus, small increases in walking range by households using only a few areas could markedly increase the number of other households potentially contacted, whereas for those households already visiting many areas increasing the walking range would have limited impact.
Factors associated with the number of households contacted were similar to those associated with the number of grid areas visited (Table 1), although not walking outside of the map area. For UK Kennel Club breed types there were differences (P=0·01), with ranking of groups by median numbers of areas visited (highest to lowest): Working, Unrecognized (including Jack Russell and Patterdale terriers), Pastoral, Crossbreed, Toy, Utility, Hound, Gundog, Terrier.
The one-mode network of household–household contacts had an average clustering coefficient of 0·88, demonstrating a high level of clustering between the households. This value remained high when various cut-off levels (from 10 to 60) in the strength of the ties between nodes were examined (e.g. a cut-off level of 50 meant that only those households connected by walking in 50 or more areas in common were considered to be linked). The relationship between the strength of the tie and the size of the network was investigated (Fig. 1c); as the value of the ties increased, the number of connected nodes decreased through the formation of isolated nodes, but a single large connected component remained, rather than subdivision into smaller networks. Sequential targeted deletion of nodes, starting with the highest degree, demonstrated that the redundancy of links in the network was such that it took until removal of the 164th node (i.e. 77% of households) before any subdivision of the network was observed, and this only served to isolate one node from the large component.
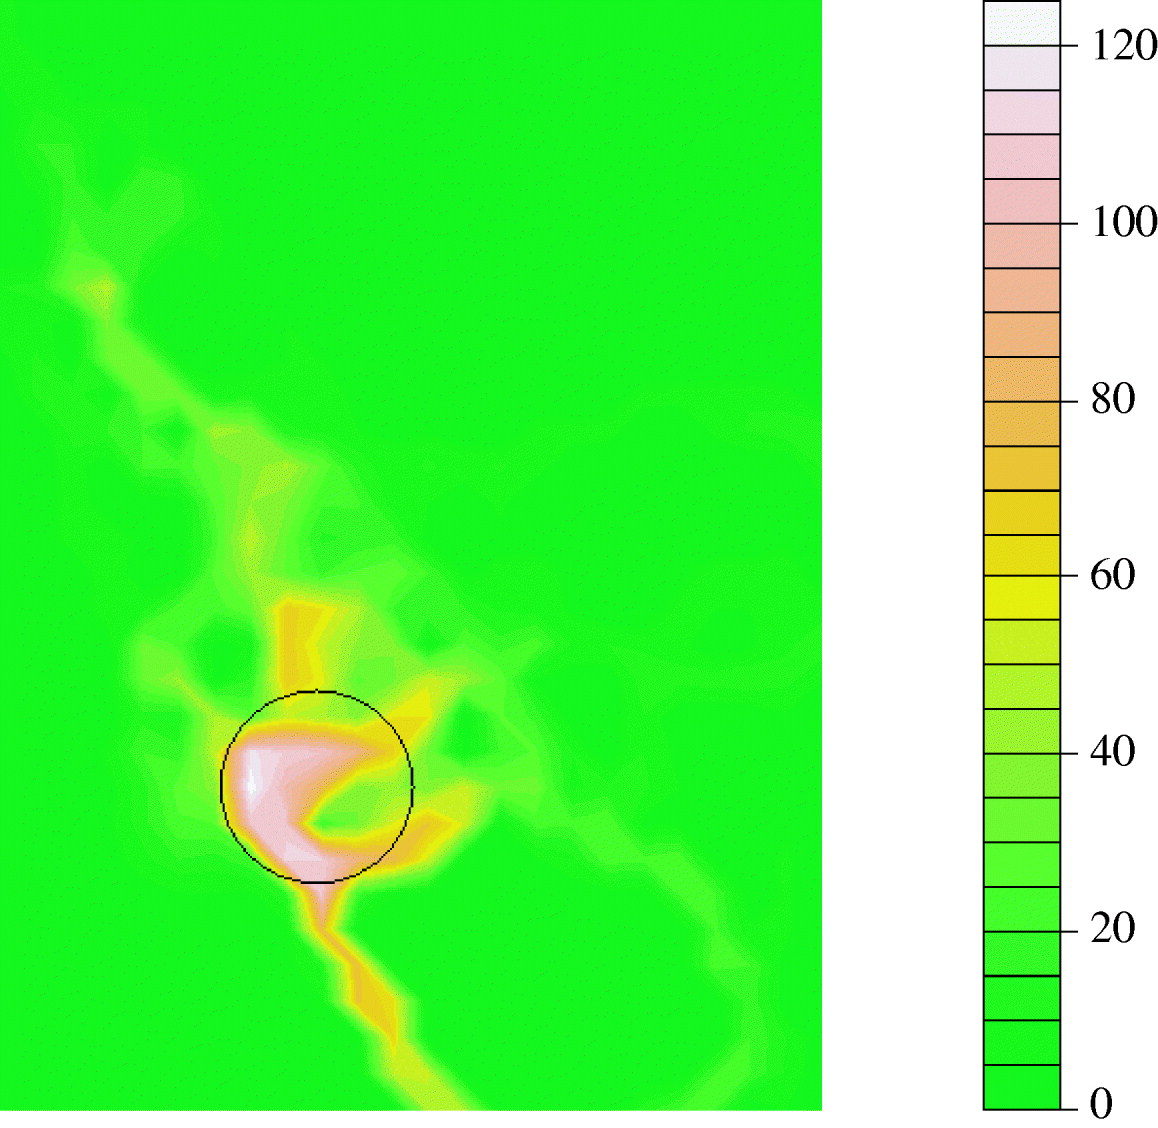
For each grid area the number of households that reported to walk through them was also recorded and again was highly skewed (Fig. 1d). Indeed, there was evidence that, over the observed range, this approximated a power-law distribution. Most areas were visited by a few households but a few areas were visited by more than half of the households; the two-mode area degree ranged from 1 to 124 (excluding areas not visited at all). There was evidence of spatial aggregation of grid areas used by many households with a significant cluster identified using the spatial scan statistic (P=0·001, Fig. 2). A nature reserve, a country park path and a road (leading to the nature reserve) were amongst the most popular walking areas.
Smoothed spatial plot of number of households walking in each grid area. The scale represents numbers of households walking through that area (degree). White=high, green=low. The black circular outline indicates the significant cluster (P=0·001) identified using the spatial scan statistic.
Use of green areas
Even using a more restrictive contact definition in which households were linked only through use of specified green areas, there remained a single large connected component; only 21 (9·8%) households were excluded from this network by not walking in any of the green areas. One small park outside of our recruitment area was not used by any of the respondents, even though dogs are commonly seen to be walked there.
Indirect block modelling of the household×green areas network (Fig. 3a, Table 2) suggested the presence of three groups of green areas (A, B and C) and four groups of households (h1, h2, h3 and h4). The largest group of households (h1, 45% of households) visited both of the main groups of green areas (A and B). Two smaller household groups (h3 and h4) each utilized only one group of green areas (B and A, respectively). Households in group h2 also predominantly used group A green areas. Household types h2 and h4 were distinguished through use of different, but overlapping subsets of the group A green areas. A few h2 households also used green areas in group B. Only three households (all in h2), used group C green areas.
(a) Two-mode network for green areas at all times (number of households=193). Multi-dimensional scaling plot (circles=households, squares=groups) of walking areas (set of paths or a park) termed green areas. Colour of nodes indicates membership of clusters of households (h1=dark green, h2=light blue, h3=dark blue, h4=red) or green areas (A=orange, B=light green, C=pink) identified through indirect block modelling. (b) Two-mode network for time period 09:00–12:00 hours as an example (n=48). Fixed node coordinates from (a).

Groups of green areas and households identified using indirect block modelling and the number of household to green area links for each combinationFootnote *

* For example, a household in group h1 visiting a green area A would add 1 to the total number of links for that combination. The density (in parentheses) is the observed number of links divided by the maximum possible for each combination.
The network was further subdivided into smaller networks of dogs that are walked in the same place at approximately the same time of day. Fifty-six households did not walk at a particular time of day but at varied times and were, for analysis purposes, separated into their own network even though they may be present at various times in the areas that they choose to walk in. Overall, subdivision of the networks by time suggested that the basic structure was stable across various times of the day. An example network for the time 09:00–12:00 hours is shown in Figure 3b.
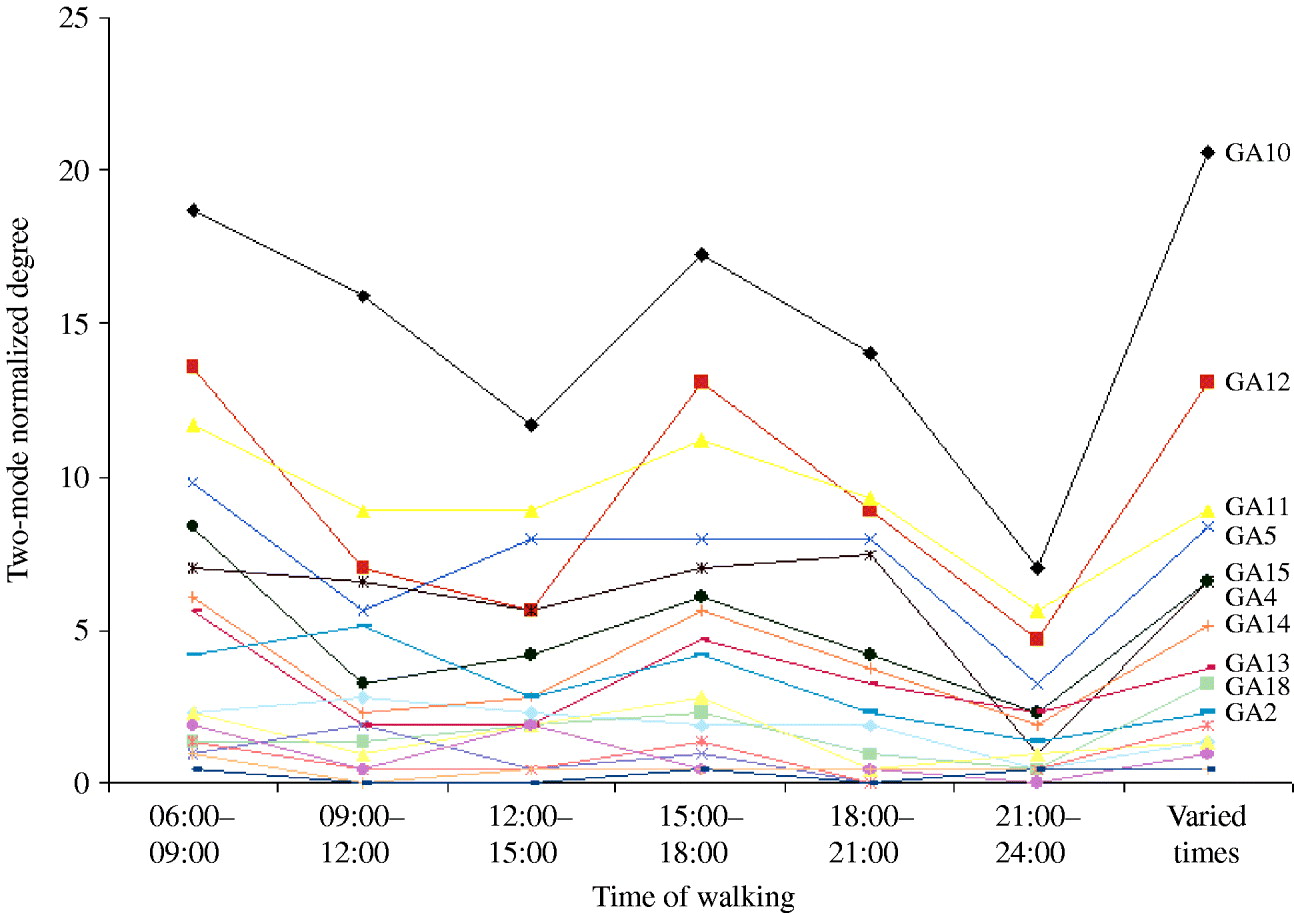
The 17 green areas used were ranked by their degree; the most used areas were all located in a nature reserve. The normalized degree for each of the green areas across the different time periods is shown in Figure 4. Some of the most important walking locations varied between times of the day. However, the most important area in the network was always the same site.
Two-mode normalized degrees for each green area (GA) at different walking times.
In the green areas network, households could commonly contact another household through two ‘steps’ (56%) or four ‘steps’ (25%), compared to 74% and 26% respectively in the grid areas network. A two-step is defined as one-step to area, one-step to household, i.e. two households walking in a common area. Therefore households are contactable with all other households in the grid areas network either directly or through one of the households that they walk in the same area with; whereas in the green areas network 19% of all household pairs were isolated from each other. However, when the network was subset by time, the number of isolated household pairs increased to 91–99%; 21:00–24:00 hours had the most number of isolated pairs, and 06:00–09:00 hours the least, reflecting the popularity of that time for walking.
The density of the green areas network was 0·34 (34% of the possible ties are present), compared to densities of 0·04–0·11 (4–11%) when time of walking was considered; 06:00–09:00 and 15:00–18:00 hours were most dense as they were the most popular walking times.
DISCUSSION
It is not uncommon for pet dogs to contact several other dogs on their daily walks [Reference Westgarth8]. However, using network analysis of dog-walking patterns in a small community, this study has demonstrated that a surprisingly high level of overall potential contact exists between the dogs through their utilization of public space. All household pairs in the grid areas network, or 81% in the green areas network, could contact each other either through walking in a common area, or through one other household they walked in the same area with. We have only measured the potential for contact; in reality the number of actual interactions between dogs is likely to be much lower, but there is a lack of data available on this. However, even if only a proportion of these potential events resulted in actual contact, there would probably remain considerable connectivity given the level of opportunity demonstrated here. For example, when investigating the effect of the number of common walking areas linking households, even when only strong tie strengths were considered, a single large component remained, and clustering was still high.
In addition, the networks described would, in reality, be more extensive, incorporating dogs that live outside our recruitment area and also the four dog-owning households in our study area that declined to participate. There will also be those that were in the study area but were non-contactable (an estimated 33 households, if assuming that an equal 24% of non-contactable households also owned dogs). In addition, the networks did not include the ten dog-owners that either walked their dogs in such varied areas that they could not provide specific routes on the map, or did not walk in the areas represented on the map. Nor did they include the roaming behaviours of stray dogs and free-roaming pet dogs, although only 1% of the dogs in our study were reported to be allowed to roam freely [Reference Westgarth8] and it is unlikely that there are many strays in this environment.
Although this study could not determine whether dogs actually came into physical contact, the exposure to dog excretions in the environment may also pose a risk of disease transmission. For example, many canine enteric pathogens, such as Campylobacter [Reference Murphy, Carroll and Jordan28] and canine coronavirus [Reference Tennant, Gaskell and Gaskell29], may be present in the short term, and others (such as parvovirus) may persist in the environment for several months [Reference Ikeda30]. From an early age all canids investigate and sniff urine and faeces from other animals in order to gain information about conspecifics and may urinate or defecate on this excreta, or roll in it [Reference Fox31]. It has been suggested that female urine deposits are particularly attractive to other dogs [Reference Doty and Dunbar32].
Although indirect contact may be sufficient in some cases for disease transmission, it is probable that direct physical contact is of higher risk, for example in the transmission of upper respiratory tract diseases by contact with infectious discharges or by aerosol [Reference Greene and Greene33]. Whether dogs actually physically contact each other if they are present in an area at the same time will also depend on their individual behaviour; avoidance behaviours may act to reduce the number of contacts, and play, investigative or aggressive behaviours may increase them. It is not currently known how likely dogs are to contact each other given the opportunity, but due to the increased emphasis over recent years on the importance of socialization [Reference Hunthausen, Seksel, Horwitz, Mills and Heath34], it is likely that many dogs do choose to interact and owners may encourage this. Some of the dogs may be kept on a lead at all times, however, this does not necessarily prevent them from physically interacting.
Our networks demonstrated short path lengths, clustering of nodes, and some skewed degree distributions; characteristics observed in many networks. Such networks often demonstrate rapid disease spread [Reference Shirley and Rushton17, Reference Watts and Strogatz35] and theoretical studies have shown this effect to be tolerant to random removal of nodes, as most nodes are not highly connected. In contrast, targeted removal of the most highly connected nodes is reported to dramatically change the path structure between the remaining nodes, decreasing their ability to communicate across the network [Reference Albert, Jeong and Barabasi19]. How such studies translate to empirical studies such as ours, and their practical applications, is not clear. However, there could be important implications for disease prevention. In theory, highly connected dogs could be identified and ‘removed’ from the infectious disease network, for example through targeted vaccination or stopped from being walked during a critical disease (epidemic) period. However, the high overall connectivity of our network meant that experimental targeted removal of nodes in this manner did not have the effect described above.
The distribution of the number of households visiting each area was highly skewed, and approximated a power-law distribution over the observed range. This suggests that, when extrapolated to larger regions, there may be areas that are visited by an extremely large number of dog-owning households. However, although unobserved in our sample, a cut-off is likely to occur in this distribution, due to practical constraints on the number of households that can use a particular area.
Common features of areas with high degrees included park or recreation space, or the access to such spaces. Such areas represent areas of high risk potential for the transmission of disease and could be targeted for restricting access should disease outbreaks occur, although this may not prove very practical in reality. Furthermore, it is difficult to predict the effect of ‘closure’ of specific highly used areas; walking may become more widely disseminated throughout the community (perhaps reducing contact between dogs) or may simply tend to relocate to a few other locations, or even on the street. Detailed knowledge of space utilization by dog owners may also facilitate placement of dog waste disposal bins and other public health measures.
Analysis of the number of areas visited by each household also suggested a skewed distribution of dog-walking distance and variability of routes. Most households walked dogs in only a few areas, but a small number visited many areas. However, this did not appear to follow a power-law distribution, possibly because lifestyle constraints acting on a dog owner are also likely to influence the number of areas he/she can practically walk in. In addition, as the number of areas visited rose, there was a limit on the number of extra households contacted. However, this may be due to the ‘invisibility’ (in the present study) of other dogs that walked in those areas but lived outside our questionnaire recruitment area.
The dogs in the higher-degree households may be important for assisting the transmission of disease through the network, as they have the potential to contact more other dogs. The households that walked dogs in many areas were also identified from the questionnaire as those who walked their dogs for longer and on more varied routes, thus supporting the findings using the map-and-grid system. These households were also more likely to let their dogs off lead, had increased numbers of dogs, and were more likely to own Working, Pastoral or some terrier types. This small group of highly connected dogs are also those walked more frequently in a wider area outside the range of the map. They are thus involved in a much larger network of dogs than is described here, and may act as important disseminators for transmitting infectious diseases through the wider population.
When considering green space areas only, the households divided approximately into four groups and the areas into three. This division of the dog population may act to slow transmission of pathogens, and may enable targeted intervention to be applied. However, there was still considerable interconnectedness, both within and between the household groups, which may limit the effectiveness of any intervention. The effect of time of walking was investigated, in order to focus on the possibility of direct contact transmission, and separate networks were constructed for those households that walked at different times of day to those that walked at varied times. Omission of households which reported varying times of dog-walking from this analysis would result in underestimation of the connectedness of the networks; conversely, inclusion in each time network incorrectly assumes that these households are present all day and would lead to an overestimation of the contact possible between dogs. The general structure of the networks appeared stable through time, but they did have considerably reduced connectedness, decreased density and increased number of isolates. However, separating the network into time periods did not fragment the network into non-interconnecting clusters and so direct contact transmission pathways were still present across the general network.
The study community was in a semi-rural area and it is unknown how generalizable the results are to other areas. However, urban areas are likely to have less available green space for dog-walking and this may lead to further concentration of dog-walking in these few popular areas. Another potential limitation of the study is that the contact definition used was necessarily relatively imprecise due to the data collection method. Further studies, investigating possible contact behaviours and their actual frequencies are currently being performed and will better elucidate the potential for transmission of important pathogens through dog-owning communities. However, collection of appropriate data for such studies is difficult and relies on observational data collection (although the presence of observers may alter behaviour). The impact of use of the lead as a control measure to reduce contacts is also being investigated. In the longer term, pathogen-specific contact networks should also be explored. In conclusion, pet dogs and their owners are more highly connected than they may first appear, which is beneficial socially, but emphasizes the need for high standards of welfare and preventive veterinary care for dogs.
ACKNOWLEDGEMENTS
The authors thank Defra for funding the research and the people (and their dogs) who participated in the study.
DECLARATION OF INTEREST
None.


