


8.1 Introduction
This chapter’s central thesis is that speech rhythm plays a critical role in the parsing and understanding of spoken language. Moreover, rhythm provides a sensory framework for low-frequency (3 Hz–25 Hz) acoustic modulations to interact with other modulatory signals such as visual speech cues. Such sensory modulation provides a potential gateway for accessing endogenous neural activity oscillating at comparable frequencies, hence facilitating cognitive access to linguistic information useful for interpretating inherently ambiguous acoustic signals. The rest of this chapter discusses a variety of experimental and theoretical evidence in support of this thesis.
8.2 A Brief History of Early Speech Modulation Research
The prosodic properties of spoken language have attracted a lot of attention in recent years (e.g., Loukina et al., Reference Loukina, Kochanski, Rosner, Shih and Keane2011; Ravignani and Norton, Reference Ravignani and Norton2017; Poeppel and Assaneo, Reference Poeppel and Assaneo2020). Some of this newfound interest is due to an increasing awareness that the linguistic (especially phonemic) models of yesteryear are not entirely in accord with how speech and often intense is processed in the real world, where background noise and reverberation are commonplace and often intense (Assmann and Summerfield, Reference Assmann, Summerfield, Greenberg, Ainsworth, Fay and Popper2004).
For many years, speech models focused on the signal’s spectral structure as the basis for decoding spoken language (e.g., Jakobson et al., Reference Jakobson, Fant and Halle1952/Reference Jakobson, Fant and Halle1963; Fletcher, Reference Fletcher1953; Ladefoged, 1968/Reference Ladefoged1995; Allen, Reference Allen, Ramachandran and Mammone1995; Stevens, Reference Stevens1998). These frequency-based models assume that processing of the speech signal amounts to linking spectral patterns with phonemic elements, which in turn are used to recognize words and other (e.g., phrasal) linguistic elements. In this context, “spectral” refers to the frequency analysis performed by the auditory system, one that provides a tonotopically structured profile (with respect to auditory neural discharge patterns) as a function of time (i.e., a frequency versus time representation) that some region(s) of the brain (presumably, higher-level language areas) associate with specific phonetic properties, either articulatory-acoustic features (e.g., Chomsky and Halle, Reference Chomsky and Halle1968; Jakobson, Reference Jakobson1968), “landmarks” (Stevens, Reference Stevens1998), or individual “phonemes” (e.g., Ladefoged, 1968/Reference Ladefoged1995), in a cognitive (and neurological) effort to infer the words spoken (in their appropriate sequence). The detailed mechanism(s) by which this neural time–frequency activity is linked to linguistic elements isn’t described in detail, nor is it a means for connecting such linguistic entities to higher-level constructs such as syllables, words, or phrases (and other meaningful elements).
Although there were clues early on that nonphonemic elements might play an important role (e.g., Dudley, Reference Dudley1939, Reference Dudley1940; Kozhnekov and Chistovich, Reference Kozhnekov and Chistovich1965; Liberman et al., Reference Liberman, Cooper, Shankweiler and Studdert-Kennedy1967), the spectral-phonemic perspective formed the foundation of mainstream speech research until recently. This spectral focus played an especially prominent role in automatic speech recognition (ASR) technology in which lexical models were based on strings of phonemic elements (hereafter “phonemes” [Rabiner and Juang, Reference Rabiner, Juang, Benesty, Sondhi and Huang2008]). Considerable effort was put into developing “language models” and “pronunciation dictionaries” to compensate for sub-par recognition of the phonetic constituents of the words spoken. Such systems required advance knowledge of the likely words spoken (“language models”) to have a reasonable chance of accurately inferring them (e.g., Jelinek, Reference Jelinek1998).
8.2.1 The Modulation Spectrum: Origins and Motivation
The seeds for an alternative approach, based on slow modulations in the speech waveform, were planted in the 1970s when the first steps were taken towards dethroning the spectral-phonemic framework.
The original goal of Houtgast and Steekeken’s (Reference Houtgast and Steeneken1973, Reference Houtgast and Steeneken1985) research was a practical one. They wanted a metric to predict when speech would be intelligible in a variety of listening environments (e.g., concert auditoria, theaters, and classrooms). They found that the acoustic properties most predictive of intelligibility (i.e., the ability to accurately report the words spoken in the correct order) were not spectral (i.e., acoustic frequency) but rather ones based on extremely slow modulations in the speech signal. How slow? So slow that when expressed in units of frequency, they were well below the threshold of tonal pitch (ca. 30 Hz). In other words, the key acoustic features for intelligibility are orthogonal to the classic spectral elements that had long dominated phonetics and speech research.
To quantify these very low-frequency modulations, Houtgast and Steeneken developed a novel method for their computation and visualization called the modulation spectrum. By analogy with the frequency spectrum, they measured the amount of energy in a bank of modulation-frequency filters. Highly intelligible speech, presented in high signal-to-noise-ratio conditions, exhibited a peak in the modulation spectrum at ca. 4 Hz–5 Hz. However, there was considerable energy down to ca. 3 Hz and up to ca. 12 Hz. The 4 Hz–5 Hz peak implied there was something special about syllables, whose durational properties (125 ms–250 ms) correspond closely to that time frame (when expressed in frequency units). The modulation spectrum turned out to be an excellent predictor of intelligibility because of its sensitivity to acoustic interference from reverberation (the result of acoustic reflections off hard surfaces such as walls, floors, and ceilings) or background noise (e.g., multi-talker speech babble or street noise). In extremely noisy environments, where intelligibility is severely degraded, they found that the peak of the modulation spectrum is significantly attenuated or even flattened.
Despite Houtgast and Steeneken’s compelling data, the modulation spectrum’s specific connection to intelligibility was left unresolved.
8.2.2 Modulation’s Role in an Early Form of Speech Synthesis
Deeper insight emerged in the 1990s when several studies investigated how low-frequency modulations in the speech waveform impact intelligibility. But before discussing this research, it’s helpful to summarize the pioneering research of Homer Dudley, an engineer working at Bell Laboratories in the 1930s. Dudley wanted to improve the quality of speech transmitted over the telephone (his workplace was a subsidiary of AT&T). To do so, he developed two analog tools, the voder and the vocoder (the latter being a more sophisticated version of the former). These were analog filter banks designed to “quantize” speech into a more compact form than the original signal allowed. In two groundbreaking articles (Dudley Reference Dudley1939, Reference Dudley1940), Dudley made a key distinction between the “carrier” associated with spectral features distinguishing phonetic segments (aka “temporal fine structure” [Smith et al., Reference Smith, Delgutte and Oxenham2002]) and the “modulator” (whose time course roughly follows syllabic elements). The latter was the precursor to what is now called the “speech envelope,” but it is important to note that Dudley’s original terminology applied to an engineering application designed to simulate human speech, not to a perceptual or neurological property.
In Dudley’s view, both the carrier and the modulator were essential for speech to sound natural and intelligible. Because the bandwidth of the telephone was limited in those days, Dudley sought to determine how much of the signal’s bandwidth could be reduced (i.e., “compressed”) without serious impact on intelligibility or quality. Dudley noted that a relatively small number (ca. 10) of frequency channels was required for the speech to be intelligible (and sound natural). Through this simple demonstration, the importance of auditory frequency analysis was demonstrated using a primitive form of what later came to be known as speech synthesis (or “text to speech”).
8.2.3 The Importance of Low-Frequency Modulations in Speech Perception
The broader significance of Dudley’s demonstration and Houtgast and Steeneken’s intelligibility assessment tool emerged with new research in the 1990s. The next step came from a group headed by Reinier Plomp (see Plomp, Reference Plomp2003, for a review of his research). One of Plomp’s students, Rob Drullman (Drullman et al., Reference Drullman, Festen and Plomp1994), performed, as part of his PhD research, a set of perceptual experiments in which the low-frequency modulations in the acoustic speech signal were selectively low- or high-pass filtered (keeping other acoustic properties untouched), and the impact of such manipulations on intelligibility were assessed. “Smearing” (Drullman’s term) of syllabic elements, resulting from low-pass filtering of the modulations in the speech signal, seriously impaired intelligibility. Listeners found it challenging to parse the speech stream into distinct, identifiable words. Drullman’s results were roughly consistent with Houtgast and Steeneken’s earlier studies. Modulation frequencies below 16 Hz were found to be essential for highly intelligible speech, and modulations in the vicinity of 3 Hz–8 Hz were shown to be especially important (in line with the intuition that syllabic elements are indeed important).
In the US, Shannon et al. (Reference Shannon, Zeng, Kamath and Wygonski1995) at the House Ear Institute used an updated version of Dudley’s vocoder to demonstrate the importance of low-frequency modulations using a novel method. In place of voiced speech, a broadband white noise signal served as the input to the vocoder. This noise signal was modulated by the original voiced version of the speech signal. In other words, the original speech signal’s fine time structure was replaced by white noise (i.e., equal energy per Hz band). The modulatory properties of the original speech signal were varied, along with specific details based on the spectral bandwidth and number of frequency channels. A single-channel modulator comprising the full spectral bandwidth of the signal (analogous to the speech envelope) was not intelligible. Only when the noise signal was filtered into four, eight, or more frequency channels were the resulting signals intelligible, indicating that the modulatory properties of the speech signal needed to be manipulated in a specific way. Another way of stating their finding is that a diversity of slow modulation patterns, derived from a broad range of distinct frequency channels, is essential for producing artificial speech that is readily understood. This noise-excited vocoder provided a demonstration that the rhythmic properties of speech could not be satisfactorily represented by a modulatory envelope derived from a unitary source (i.e., the full-band speech signal or even an octave-band signal derived from just a single region of the spectrum).
This key insight, buttressed by Drullman’s studies, suggested that the “speech envelope” is inadequate to fully characterize the rhythmic properties of speech. Instead, speech is most faithfully represented by a series of distinct low-frequency modulation patterns emanating from different parts of the tonotopically organized auditory array. How these tonotopically distinct modulation patterns give rise to a unitary sense of rhythm is not well understood.
At this juncture in the modulation story, my colleagues and I began a series of studies (summarized in Greenberg, Reference Greenberg, Greenberg and Ainsworth2006, Reference Greenberg2022) to delve deeper into how these low-frequency modulation patterns impact intelligibility, as described later in the chapter. But before doing so, let’s examine some early research on speech synthesis before returning to our consideration of slow waveform modulations.
8.3 Modulations and Rhythm in Speech Technology
A group of researchers in Japan sought to create more natural-sounding speech than was possible using Dudley’s original vocoder or through a different method known as vocal-tract-based synthesis.
Beginning in the late 1980s, researchers at ATR (Advanced Telecommunications Research Institute in Japan) began to experiment with high-quality recordings of human talkers speaking a broad range of different words that provided a comprehensive repertoire of phonetic, syllabic, lexical, and phrasal contexts (i.e., read sentences and paragraphs). The recorded material sounded very natural, so the key step to deploy this recorded corpus to generate novel material was to define the appropriate acoustic “target” units and then choose a closely matched snippet of speech and connect it to another snippet with minimum distortion. Digital splicing algorithms were developed to figure out which snippet most closely approximated the desired target for each linguistic element being modeled. This method is called unit selection (Iwahashi et al., Reference Iwahashi, Kaiki and Sagisaka1992; Black and Campbell, Reference Black and Campbell1995), which soon became the foundation for most high-quality speech synthesis in which novel words and sentences could be generated from the limited amount (often just several hours) of pre-recorded material. The next challenge was to figure out how to splice the chosen snippets together to produce an output that minimized “glitches” and other distortions to optimize intelligibility. The approach came to be known as “concatenative synthesis” and quickly became the dominant form of speech synthesis. Only in recent years has concatenative synthesis been superseded by more sophisticated (and more natural-sounding) methods (summarized by Karagiannakos, Reference Karagiannakos2021).
Concatenative synthesis’s key insight is that prosodic properties, such as tempo and meter, matter greatly, both for naturalness and intelligibility. By using spoken material as the core of the synthesis engine, the ATR researchers (implicitly) recognized the importance of low-frequency modulation patterns for producing high-quality spoken material.
Efforts to incorporate modulation models in ASR began in the 1990s (Greenberg and Kingsbury, Reference Greenberg and Kingsbury1997; Kingsbury et al., Reference Kingsbury, Morgan and Greenberg1998; Kanedera et al., Reference Kanedera, Arai, Hermansky and Pavel1999). However, these early efforts didn’t produce a true breakthrough due to their failure to “translate” modulation patterns into meaningful linguistic elements (as well as their failure to incorporate modulation phase appropriately into sub-word and lexical representations). Later efforts, using more realistic modulation models, improved word recognition slightly (e.g., Hermansky, Reference Hermansky2010; Avila et al., Reference Avila, Kashirsagar and Tiwari2019), but optimal utilization of modulation patterns and rhythm would have to wait until the advent of “attention” and “transformers” (and other broad-context approaches) to ASR in the late 2010s and early 2020s (e.g., Vaswani et al., Reference Vaswani, Shazeer and Parmar2017).
8.4 Modulation as an Integrative Framework
The power of modulation models lies mostly in their ability to integrate sensory (and cognitive) information across a range of scenarios that would otherwise be challenging for purely spectral models. This limitation of the spectral-phoneme approach is of prime concern, as listeners rarely converse in pristine (i.e., little or no noise) environments. Honking autos, infants crying, barking dogs, cocktail-party babble, and so forth can pose a challenge for decoding speech. In many listening environments, speech’s acoustic signature changes into something quite distinct from the waveform emanating from the speaker’s vocal tract. And yet most listeners have little difficulty engaging in social discourse under such conditions (much of the time).
The basis of such resilience is unclear, but low-frequency modulation patterns are probably key. The importance of these slow fluctuations may have to do with two other sources of low-frequency modulation – one sensory, the other neural.
Visual speech cues (aka “speech reading”) can facilitate comprehension, especially in challenging environments (Grant and Walden, Reference Grant and Walden2000) and for the hearing-impaired (Grant et al., Reference Grant, Walden and Seitz1998). The opening and closing of the lips, the up and down motion of the jaw, the to-and-fro movement of the tongue, provide a coarse visual analog of certain features of the waveform’s modulation (see Chapter 2). Such visual cues are associated primarily with two linguistic features: “place of articulation” (Skipper et al., Reference Skipper, van Wassenhove, Nusbaum and Small2007), which serves to distinguish among certain consonants (e.g., [p] versus [t] versus [k]), and syllable dynamics germane to lexical and post-lexical parsing (Grant and Walden, Reference Grant and Walden1996). So important are visual cues that their presence can transform largely unintelligible signals into readily understandable speech in challenging listening conditions (e.g., background noise, multi-speech babble, extreme reverberation [Grant and Walden, Reference Grant and Walden2000]). Why is this sensory boost so important for modulation models?
It is likely because of the interaction of distinct but complimentary cues capable of providing the sort of linguistic specificity required to successfully decode the speech signal across a broad range of listening conditions. For example, place-of-articulation information is most closely associated with acoustic frequencies between 1,500 Hz and 3,500 Hz (Stevens, Reference Stevens1998), while syllable parsing is most facilitated by that region of the spectrum ca. 3 kHz (Grant and Walden, Reference Grant and Walden1996). It is the blending of classic phonetic cues with prosodic information that likely provides the foundation for speech intelligibility and comprehension.
8.5 The Speech Envelope as a Model of Auditory Modulation
The “speech envelope” is often used as a proxy for auditory neural activity in studies of linguistic rhythm (e.g., Aiken and Picton, Reference Aiken and Picton2008; Ding et al., Reference Ding, Patel and Chen2017; Oganian and Chang, Reference Oganian and Chang2019; Poeppel and Assaneo, Reference Poeppel and Assaneo2020). The envelope’s popularity stems from its ability to portray modulation in simple terms (e.g., Figure 8.1). It aids the visualization of neural activity that may be associated with such rhythmic qualities as speaking rate, metrical beat, and prosodic meter.
The speech envelope illustrated.
The “speech envelope” for a single sentence (shown in black). The temporal fine structure is portrayed in very light gray. Syllable boundaries are indicated by dotted vertical lines. The contour shows the “rate of change” in envelope energy, analogous to “delta features” used in certain ASR applications. Note how coarse the speech envelope is relative to the speech signal’s finer details. The envelope contour pertains to the broadband, unfiltered signal.
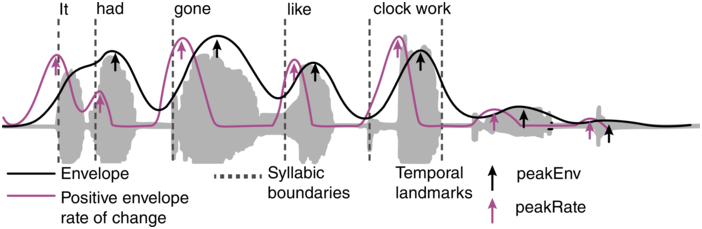
Figure 8.1 Long description
A line shows the envelope of the sound, tracing the peaks and valleys. Another line shows the positive rate of change of the sound's amplitude. The dotted lines mark the perceived boundaries between syllables. Other arrows point to the peaks of the envelope, indicating the highest amplitude points. Other arrows point to the peaks of the positive rate of change, indicating the steepest positive slope in the sound's amplitude. A text at the top of the graph reads, It had gone like clock work.
However, the term “speech envelope” is potentially misleading, as there is no physiological evidence that the excitation of auditory neural elements (e.g., clusters of neurons) modulates to the sort of coarse envelope signal portrayed. Rather, the “envelope” is best thought of as an “artistic” (i.e., graphical) rendering of what the excitatory signal is believed to be at various level(s) of the brain.
Acoustic signals are spectrally filtered, initially in the auditory periphery (i.e., cochlea, auditory nerve), and are subject to additional frequency analysis upstream. Because of this filtering, the auditory signal driving the activity of single units and neural clusters likely differs from the full-spectrum speech envelope portrayed so frequently in the literature.
Auditory filtering decomposes the speech signal into neural waveforms that vary across the tonotopic axis. The speech envelope pattern most closely matching the composite waveform is weighted most heavily to frequencies below 1 kHz (a result of the low-frequency bias of the acoustic speech signal; see Fant, Reference Fant1960). But such low-frequency elements are not necessarily the primary sources of speech rhythm (either sensed or perceived). Nor is this spectral region necessarily the most important for intelligibility (Miller, Reference Miller1951; Fletcher, Reference Fletcher1953).
Rather, spoken language’s resilience and richness are likely a consequence of its “polychromatic” qualities. For example, visual speech cues reinforce (and enhance) linguistic information derived from the acoustic signal (e.g., Grant et al., Reference Grant, Walden and Seitz1998; Skipper et al., Reference Skipper, van Wassenhove, Nusbaum and Small2007). The situational setting (aka “semantic context”) also contributes (by constraining the number of likely options) (e.g., Pollack and Picket, Reference Pollack and Pickett1964; Greenberg and Christiansen, Reference Greenberg, Christiansen, Dau, Buchholz, Harte and Christiansen2007). It is these multifaceted qualities of spoken language that are fundamental to its semantic and emotional impact. Only a glimmer of this polychromatic character is evident in the acoustic signal. By confining the analysis of speech rhythm to the acoustic envelope alone, one risks overlooking other contributing elements (such as those discussed below).
8.6 The Contribution of Higher-Frequency Acoustic Information to Intelligibility
The minimum bandwidth required to reliably transmit intelligible speech is 300 Hz–3,400 Hz (Miller, Reference Miller1951; Fletcher, Reference Fletcher1953). Because spectral bandwidth was both precious and costly in the early days of telephony, AT&T needed to know the minimum bandwidth required to ensure the signal was reliably intelligible (defined as 96% of the words being correct or better). Early “articulation” studies highlighted the importance of frequencies between 1,500 Hz and 3,400 Hz (Fletcher, Reference Fletcher1953; Allen, Reference Allen, Ramachandran and Mammone1995; Stevens, Reference Stevens1998).
What is this observation’s relevance for speech rhythm?
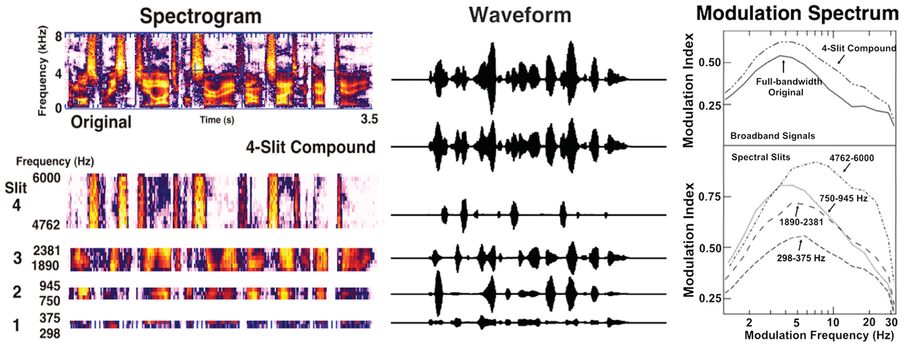
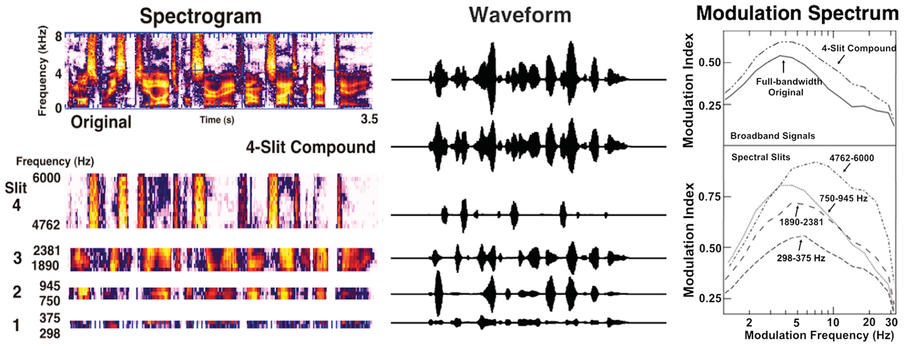
It is relevant because the lower frequencies (<1,500 Hz) contribute far more to the speech envelope than the mid- and higher frequencies. Although the speech modulation envelope appears reasonable (by eye), it excludes certain portions of the spectrum essential for intelligibility. The higher speech frequencies contribute less to the acoustic signal’s waveform on account of their lower amplitude (see Fant, Reference Fant1960). But this does not mean these higher frequencies contribute less to speech communication – on the contrary. Because of the auditory system’s acute sensitivity to the mid-range portion of the spectrum (1,500–4,000 Hz) along with the presence of spectral filtering, auditory waveforms associated with this higher-frequency region are modulated as much as, if not more than, waveforms associated with the lower part of the speech spectrum (Figure 8.2). It is these all-important higher-frequency elements that are missing from the prototypical “speech envelope.”
Speech waveforms, spectrograms, and modulation spectra across acoustic frequencies.
Spectrographic and time domain representations of the single sentence “The most recent geological survey found seismic activity” (Greenberg et al., Reference Greenberg, Arai and Silipo1998). The waveforms are plotted on the same amplitude scale, while the scale of the original, unfiltered signal is compressed by a factor of five for illustrative clarity. The frequency axis of the spectrographic display of the channels has been nonlinearly compressed for illustrative purposes. Note the quasi-orthogonal temporal registration of the waveform modulation pattern across frequency channels. On the right are modulation spectra (magnitude component) associated with each of four, 1/3-octave channels. The peak of the spectrum (in all but the highest channel) lies between 4 Hz and 6 Hz. Note the large amount of energy in the higher-modulation frequencies associated with the highest-frequency channel. The modulation spectra of the four-channel compound and the original, unfiltered signal are illustrated for comparison (top panel).
The portion of the acoustic frequency spectrum whose waveform most closely approximates this envelope model is not highly intelligible; indeed, it sounds muffled and indistinct (see Miller, Reference Miller1951), due to two factors. The portion of the spectrum essential for accurate consonant decoding is mostly above 1,500 Hz, and these higher frequencies facilitate the micro-parsing (at the syllable level) of the speech stream (see Kösem et al., Reference Kösem, Dai, McQueen and Hagoort2023, for data consistent with this assertion).
A study by Smoorenburg (Reference Smoorenburg1992) is instructive for illustrating the importance of the higher frequencies. Using conventional audiometric measures, he found that the nature of the acoustic background was critical for determining which portion of the spectrum contributed most to intelligibility. In quiet conditions (i.e., no background noise), the most accurate predictor is a listener’s pure-tone threshold below 2 kHz. However, in high-noise environments, the best predictor is tonal thresholds above 2 kHz. Such results suggest it is the higher frequencies in the signal (and auditory tonotopic array) that underlie the resilience of speech comprehension in adverse listening conditions, an important finding for ameliorating hearing impairment among the hard of hearing.
The harmful impact of background noise (and other forms of acoustic interference) on intelligibility may be due, in part, to the challenge of parsing (into syllabic and lexical elements) the incoming speech signal, thereby making it difficult to distinguish one syllable from another. This is where speech rhythm likely comes into play; it provides a linguistic foundation with which to segregate, analyze, and recognize the signal’s syllabic sequences (and their articulatory constituents) and recode the signal within a semantic framework that can be readily transformed into a meaningful interpretation for action.
What are the properties associated with the higher end of the speech spectrum so critical for intelligibility? As we’ve seen, the parsing of spoken material at the syllable level appears to be especially focused on the spectral region around 3 kHz. Knowing the number of and stress patterns of syllables within and across words is helpful for comprehension (McQueen and Dilley, Reference McQueen, Dilley, Gussenhoven and Chen2020), especially under adverse conditions (Grant and Walden, Reference Grant and Walden1996). Such knowledge may reflect how lexical elements are stored in the brain, as can be seen in the “tip of the tongue” phenomenon (Brown and McNeil, Reference Brown and McNeill1966), where syllable number, stress pattern, and initial consonant appear to be key for lexical recall (and imply that words are more than mere strings of phonemic elements [Greenberg, Reference Greenberg1999, Reference Greenberg, Greenberg and Ainsworth2006]). Another way of stating such findings is that prosodic knowledge (e.g., syllable number and stress patterning) can reduce the listener’s uncertainty regarding the identity of words spoken under a broad range of listening conditions. Hence, low-frequency modulation is a critical component of rhythm, and high-frequency modulatory patterns appear to be important for syllable parsing.
8.7 Modulation Phase and Speech Intelligibility
Houtgast and Steeneken’s intelligibility metric measured only the modulation spectrum’s magnitude component (a limitation of their analog instrumentation). Although their metric did an excellent job of estimating intelligibility across a variety of acoustic environments, their original formulation of the modulation spectrum was not designed to provide a more granular measure for use in speech perception models.
The phase (i.e., relative timing) component of the modulation spectrum provides a set of acoustic features useful for distinguishing phonetic segments, especially consonants, from one another. In effect, modulation phase provides a means of integrating critical phonetic information such as “place” and “manner” of articulation into a unified modulation representation. This is because phase, as used in the complex modulation spectrum (CMS), is a proxy for temporal alignment across the acoustic frequency axis. When articulatory-acoustic cues signaling place and manner of articulation are out of alignment with other properties of the speech signal, intelligibility deteriorates. This is what happens in highly reverberant environments such as noisy restaurants or transportation hubs (e.g., bus terminals, train stations).
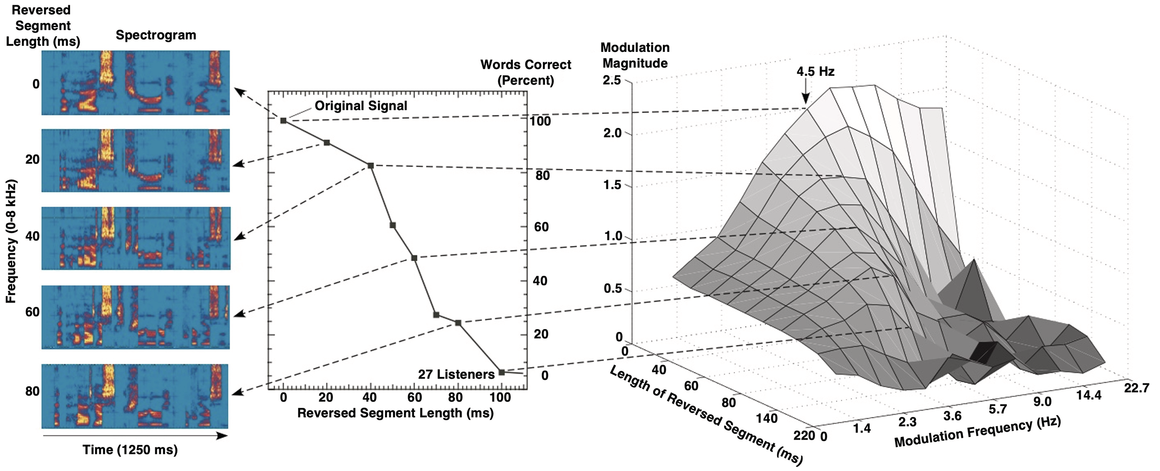
Greenberg and Arai (Reference Greenberg and Arai2001, Reference Greenberg and Arai2004) developed a novel method for combining the phase and magnitude components of the modulation spectrum into a unified representation that closely corresponds to the intelligibility of spoken English sentences (Figure 8.3). It is likely that the processing of speech in the auditory system involves certain neural operations akin to the computations involved in the CMS (see Elhilali, Reference Elhilali, Siedenburg, Saitis, McAdams, Popper and Fay2019). And as cited elsewhere in this chapter, modulation phase has been shown to (modestly) improve ASR performance (Kanedera et al., Reference Kanedera, Arai, Hermansky and Pavel1999; Hermansky, Reference Hermansky2010; Avila et al., Reference Avila, Kashirsagar and Tiwari2019).
Speech intelligibility and the CMS.
The CMS integrates the magnitude and phase components into a single value. The sentence material’s intelligibility for a listening experiment was manipulated by locally time-reversing the speech signal over different segment lengths. As the reversed-segment duration increases beyond 40 ms, intelligibility declines precipitously, as does the magnitude of the CMS. The spectro-temporal properties (and articulatory-acoustic features) also deteriorate appreciably under such conditions.
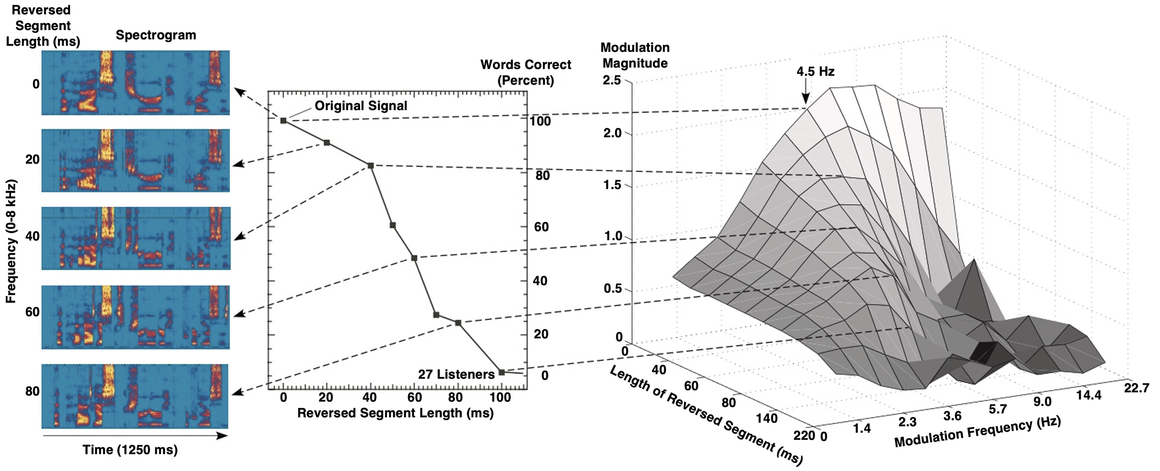
Figure 8.3 Long description
Left Panel: The spectrograms of the reversed segment visually represent the frequency and time components of the audio signal. The frequency ranges from 0 to 80 and the time ranges from 1250 milliseconds. Middle Panel: A point line graph compares the percentage of words correct, which ranges from 0 through 100, with the reversed segment length which ranges from 0 through 100. It plots a declining line which originates at (0, 100) and terminates at (100, 0). Right Panel: A 3 D surface plot showing the effect of both the length of the reversed segment and the modulation frequency on the modulation magnitude. The plot shows that the modulation magnitude is highest for shorter reversed segments and lower modulation frequencies. The peak of the surface is at a reversed segment length of approximately 100 milliseconds and a modulation frequency of 4.5 Hertz.
8.8 Rhythm as a Linguistic Parser
There are other reasons to believe phonemic elements are not the only, or even the optimal, way to linguistically model the speech stream. From both an acoustic and a spectral perspective, the speech signal has been likened to “scrambled eggs” (Hockett, Reference Hockett1960) with respect to how phonemic elements unfold acoustically when displayed in 2-D or 2.5-D representations (e.g., a spectrogram). There is considerable overlap between contiguous segments with respect to their phonetic properties. It is indeed a challenge to pinpoint where a phonetic element ends and the following one begins, especially for syllable-medial (typically vocalic) constituents (Greenberg, Reference Greenberg, Greenberg and Ainsworth2006). Rhythmic properties may facilitate the delineation of phonetic elements within a syllable by highlighting onsets, codas, and the interstitial nuclei.
The phonetic quality of a consonantal segment is heavily influenced by a variety of linguistic factors, the most important being its position within the syllable (e.g., onset, nucleus, coda), the syllable’s degree of prominence/stress (high, mid, low), and its approximate “place of articulation” (front, center, back of the oral cavity). The interaction of such features is what (mostly) determines how a consonant is phonetically realized within a syllable (Greenberg, Reference Greenberg, Greenberg and Ainsworth2006). Vocalic segments are sensitive to such factors as well, but their phonetic expression differs from consonants in that intensity, duration, and vowel height are the most relevant features. Vowels are more intense, longer, and lower in tongue height in highly prominent syllables than their less prominent counterparts (Greenberg et al., Reference Greenberg, Carvey, Hitchcock and Chang2003; Cho, Reference Cho2005).
8.9 Speech, Rhythm, and the Brain
How this parsing, analysis, and recoding are performed within the brain is not well understood. This is where speech rhythm is likely to play a prominent role, as it provides a sensory framework for low-frequency acoustic modulation to interact with other modulatory signals such as visual speech cues. Such sensory modulation provides a gateway for accessing endogenous neural activity that modulates at comparable (low) frequencies and incorporates a variety of information useful for interpretating ambiguous acoustic signals (see Chapter 3).
Low-frequency neural rhythms (aka “oscillations”) have been long thought to play a role in the processing of spoken language (Lenneberg, Reference Lenneberg1967) and certain other behaviors (Buzsaki, Reference Buzsaki2006, Reference Buzsaki2021; Chapter 3). Such cortical oscillations have been recorded in the language areas of the brain (e.g., Meyer, Reference Meyer2018; Poeppel and Assaneo, Reference Poeppel and Assaneo2020; Greenberg, Reference Greenberg2022). Although the specific function(s) of “delta” (0.5 Hz–3.5 Hz), “theta” (3.5 Hz–7 Hz), “beta” (10 Hz–25 Hz), and “gamma” (25 Hz–60 Hz) oscillations remains controversial (Buzsaki, Reference Buzsaki2006, Reference Buzsaki2021), it has been proposed that such endogenous rhythms are involved with certain aspects of linguistic processing (e.g., Greenberg, Reference Greenberg2011; Ding et al., Reference Ding, Melloni, Zhang, Tian and Poeppel2016).
It is tempting to link various brain rhythms to the processing and interpretation of specific linguistic constituents based largely on temporal properties. The periodicity of theta rhythm (3.5–7 Hz) coincides with that of syllabic elements (140–300 ms) across languages (Ding et al., Reference Ding, Melloni, Zhang, Tian and Poeppel2016), while “beta” oscillations (10–25 Hz) are similar in duration to the typical phonetic segment (40–100 ms) (Ding et al., Reference Ding, Melloni, Zhang, Tian and Poeppel2016). And the ultra-low-frequency “delta” waves (0.5 Hz–3.5 Hz) are comparable in length to spoken phrases and sentences (300 ms–2,000 ms). However, it’s unlikely the brain operates in such a rigid, lockstep fashion as some have proposed (e.g., Ghitza, Reference Ghitza2011).
Speech rhythm is often realized via certain modulatory properties of the signal. Prominent syllables are generally more intense than their less prominent counterparts (Greenberg et al., Reference Greenberg, Carvey, Hitchcock and Chang2003), which typically precede or follow them. This variation in amplitude (or “voice intensity”) helps pinpoint the most informative parts of the utterance to aid the listener’s parsing and interpretation of the communication (Greenberg, Reference Greenberg2022), especially helpful in adverse listening conditions (Assman and Summerfield, Reference Assmann, Summerfield, Greenberg, Ainsworth, Fay and Popper2004). The most prominent (i.e., highly stressed) syllables are longer in duration than their more lightly or unstressed counterparts, and such patterning is reflected in the modulation spectrum by a pronounced peak between 3 Hz and 6 Hz (Greenberg et al., Reference Greenberg, Carvey, Hitchcock and Chang2003, Figure 4). Shorter, less prominent syllables are represented in the modulation spectrum with energy in the 7 Hz to 12 Hz range.
8.10 Rhythmic-Centric Representations
It is widely acknowledged that such prosodic features as syllable prominence, stress accent, and phrasal intonation are as (if not more) important for linguistic communication than the classic notion of the phoneme. This is because prosody can influence the phonetic realization of much of what’s spoken (e.g., Greenberg, Reference Greenberg, Greenberg and Ainsworth2006). It also plays an outsized role in heavily emotional speech where certain syllables are often emphasized (aka hyper-articulation) to ensure the listener truly gets the speaker’s point (Lindblom, Reference Lindblom, Hardcastle and Marchal1990).
It has been hypothesized that the root cause of certain communication disorders may lie in neural timing issues as evidenced in deviant patterns of brain oscillations (Giraud and Poeppel, Reference Giraud and Poeppel2012; Leong and Goswami, Reference Leong and Goswami2014; Ding et al., Reference Ding, Melloni, Zhang, Tian and Poeppel2016, Reference Ding, Patel and Chen2017).
Models of spoken (and possibly written) language would likely benefit from integrating articulatory, acoustic, visual, and motor features into a unified theoretical framework that focuses on the interaction among different sources of linguistic information (e.g., McQueen and Dilley, Reference McQueen, Dilley, Gussenhoven and Chen2020). Such a unified perspective could aid in the development of new (and hopefully more efficacious) methods for teaching children to read and speak effectively (Leong and Goswami, Reference Leong and Goswami2014), as well as provide more effective ways of treating and ameliorating communication disorders impacting so many across their lifespan.
8.11 Acknowledgements
I thank the following colleagues for collaborating on research mentioned in this article: Takayuki Arai, Hannah Carvey, Shuangyu Chang, Oded Ghitza, Jeff Good, Ken Grant, Leah Hitchcock, Joy Hollenback, Brian Kingsbury, Nelson Morgan, and Rosaria Silipo. I would also like to thank reviewers Bettina Braun and Ting Huang for their helpful suggestions for improving this chapter. Thanks, as well, to the organizers of this special volume, Lars Meyer, Antje Strauss, and Caroline Duchow. Some of the material in this chapter was presented on March 12, 2021, at a virtual workshop in memory of John Ohala, organized by John Kingston and Didier Demolin.
Summary
Slow modulation of the acoustic speech signal plays a critical role in a listener’s ability to decode and comprehend spoken language. This low-frequency (3 Hz–16 Hz) rhythmic patterning derives from an interaction of articulatory processes with information-encoding imperatives shielding linguistic elements from adverse acoustic conditions common in the real world.
Implications
Models of spoken language often focus on phonemic elements as key building blocks of lexical meaning. A prosodic perspective, incorporating rhythm and syllabic prominence as central features, provides a more comprehensive foundation for understanding how listeners decode the speech signal, especially in adverse listening environments.
Gains
A prosodic, rhythmic model of spoken language understanding provides a theoretical foundation for investigating the neural bases of spoken and written language. Low-frequency (3 Hz–25 Hz) cerebral oscillations offer potential insight into the neurological bases of linguistic behavior, in particular how listeners go from sound to meaning.

 Open access