


1. Introduction
Life is filled with decisions. Most decisions are small and quickly forgotten but others have long-lasting consequences. The commercial success of popular books dedicated to help readers improve their decision-making (e.g., Duke, Reference Duke2020) highlights our desire to choose better. However, not every decision can be carefully researched and reflected on, nor should it. Such cognitive effort should be reserved for the most important decisions; those that are most likely to be consequential to one’s life—the ‘big’ decisions.
In the still-popular board game The Game of Life—originally created in 1860 by the renowned Milton Bradley—players simulate life by making a series of big decisions about college, jobs, marriage, children, and retirement. Does the game accurately reflect reality? What are life’s biggest decisions? What makes them so big? When do they occur? How can we make a good one? Which of them lead to happiness? Can we accurately predict any of these answers? Given that big decisions are often directly responsible for our health, wealth, and happiness, it is surprising how little attention has been given to understand how people tend to approach them (see Galotti, Reference Galotti2007 for an exception). The assumption that small consequential or big hypothetical decisions studied in the lab are good models for real big life decisions seems dubious given that no lab study can replicate all of the relevant factors nor the substantial consequences (Galotti, Reference Galotti2005).
Related research has investigated people’s recollection of major life events, which often include big decisions such as getting married (e.g., Schroots and Assink, Reference Schroots and Assink2005). However, for many of these ‘turning points’ the individual merely experienced the event, such as the death of a loved one. Here I am interested in the decisions that people actively made; not the events that simply happened to them. That is, I am interested in the subset of events where the individual was explicitly aware that there were two or more options available, and they consciously chose one.
Understanding big life decisions—as opposed to turning point life events—is important for at least 3 reasons. First, decisions are more central to one’s personal identity (Bem, Reference Bem and Berkowitz1972). This is because important decision points tend to cause individuals to reflect on who they are and who they want to be (Grotevant, Reference Grotevant1987; Swarm, Reference Swarm1983). Second, because individuals have control over decisions in a way that is not possible with many major life events, such as a pandemic. As a result, individuals can plan before making a big life decision, which could involve seeking information, obtaining advice, and utilizing decision support tools, and thus partially control the outcome of those decisions. Presumably, the decision models that apply to small decisions—such as choosing between small stakes risky gambles—could also be informative for making big life decisions. Third, if big life decisions are predictable and yet poorly anticipated (Odermatt and Stutzer, Reference Odermatt and Stutzer2019), then interventions could be introduced to improve decision-making in these very important domains.
1.1. What is a big life decision?
To my knowledge, there are only 2 attempts to formally define a ‘big’ life decision. According to Ullmann-Margalit (Reference Ullmann-Margalit2006), big decisions are ‘… personal and transformative, decisions that one takes at major crossroads of one’s life’ (p. 158). Based on her own reflection, Ullmann-Margalit argued that big decisions are (1) likely to transform one’s future self in a significant way, (2) cannot be easily reversed, (3) known by the decision-maker to be transformative and irrevocable at the point of choice, and (4) serve as enduring reference points (including the options not taken). By contrast, Weiss et al. (Reference Weiss, Weiss and Edwards2009) argued that a big decision is one that forms ‘…a personal policy. That policy will in turn simplify a host of future little decisions’ (p. 1). Their definition also emphasizes that these decisions are made deliberatively. My definition of a big life decision is one in which the decision-maker/s explicitly made a choice between two or more options knowing that the outcome would have significant and often long-term consequences for how the decision-maker/s or others live.
Big life decisions are often the most challenging ones that people make, so it is also worth considering what makes a decision ‘hard’. According to Chang (Reference Chang2017), hard choices emerge when ‘neither alternative is better than the other, nor are they equally good. And yet they are comparable’ (p. 11). More pragmatically, Yates et al. (Reference Yates, Veinott, Patalano, Schneider and Shanteau2003) asked participants to describe several ‘hard’ and ‘easy’ decisions they had made. The resulting analysis produced 7 overarching factors that made a decision hard: Serious outcomes (i.e., there was potential for a serious loss); overwhelming options (i.e., too many options or characteristics to compare); onerous process (i.e., the process of making the decision was difficult); obscure possibilities (i.e., the outcomes were hard to imagine); poor clarity (i.e., no option was clearly superior); uncertain value (i.e., difficult to evaluate the utility of different outcomes); conflicting advisors (i.e., incompatible recommendations or advice). In carrying out this research, I was interested to discover how many of these elements were also related to big decisions, and what unique elements emerged.
1.2. What are the most common big life decisions?
Several studies have asked people to recall their most important life events (Baum and Stewart, Reference Baum and Stewart1990; Bohn, Reference Bohn2010; Elnick et al., Reference Elnick, Margrett, Fitzgerald and Labouvie-Vief1999; Enz and Talarico, Reference Enz and Talarico2016; Glück and Bluck, Reference Glück and Bluck2007; Rönkä et al., Reference Rönkä, Oravala and Pulkkinen2003; Thomsen and Berntsen, Reference Thomsen and Berntsen2009). These important life events—sometimes referred to as ‘turning points’—often relate to situations in which the individual had control but also include events over which the individual had little or no control (e.g., war; Rönkä et al., Reference Rönkä, Oravala and Pulkkinen2003). Importantly, recall of a past decision appears to be unaffected by the emotional response produced by that decision (Galotti, Reference Galotti1995). Table A1 in Online Supplement 1Footnote 1 displays the details of these life event studies. The subset of events that involve a high degree of personal control also tend to have a sizeable academic literature around them including life events associated with getting an education (e.g., Barrow and Malamud, Reference Barrow and Malamud2015; Galotti et al., Reference Galotti, Ciner, Altenbaumer, Geerts, Rupp and Woulfe2006; Galotti and Mark, Reference Galotti and Mark1994; Porter and Umbach, Reference Porter and Umbach2006), building a career (e.g., Noda, Reference Noda2020; Robst, Reference Robst2007), relocating (e.g., Blanchflower, Reference Blanchflower2021), finding a partner (e.g., Blanchflower, Reference Blanchflower2021; Ogolsky et al., Reference Ogolsky, Surra and Monk2016), starting a family (e.g., Nelson et al., Reference Nelson, Kushlev and Lyubomirsky2014; Twenge et al., Reference Twenge, Campbell and Foster2003), and retiring (Steiner and Amabile, Reference Steiner and Amabile2022). I was interested to discover what taxonomy best captured big life decisions and how that structure related to life event taxonomies.
1.3. What are the most important big life decisions?
Although life event studies have proven critical for our understanding of autobiographical memory, some procedural aspects limit their insight to the present research questions. In particular, these studies have almost exclusively focused on event frequency rather than event intensity. Although some events, such as getting married, are recalled as turning points more often than others, such as buying a car, it is unclear what the magnitude of difference in importance is between different events. There also lacks a comprehensive understanding of the event characteristics that cause it to become one of life’s turning points as opposed to yet another forgotten experience. Finally, life event studies exclude decisions not to act, which can nonetheless be important and even self-defining. In a related field, researchers have found that the most commonly reported regrets involved romance, family, education, career, finance, and parenting and are often about missed opportunities (Morrison and Roese, Reference Morrison and Roese2011). I was interested to discover the relative difference in magnitude between different big decisions and the decision elements that contributed to these differences.
1.4. How are big life decisions retrospectively evaluated?
What makes a decision ‘good’? Some decision theorists suggest that a good decision is one that adheres to rational principles, such as coherence (i.e., avoiding intransitive patterns of preferences) and consistency (i.e., avoiding preference reversals when confronted with the same decision situation) (Savage, Reference Savage1954). However, this approach is generally unhelpful when thinking about complex decisions for which it is impossible to evaluate such violations. Using a more pragmatic approach, Yates et al. (Reference Yates, Veinott, Patalano, Schneider and Shanteau2003) asked participants to describe several ‘good’ and ‘bad’ decisions they had made. The resulting analysis revealed 5 overarching factors that made a decision ‘good’: Good outcomes (i.e., the decision resulted in or was anticipated to result in positive outcomes); evaded bad outcomes (i.e., the decision resulted in avoiding or escaping from negative outcomes); new options (i.e., the decision opened up new options); good process (i.e., the process used to make the decision was sound); good affect (i.e., the decision produced positive emotions such as pride).
People mostly remember positive autobiographical events (De Vries and Watt, Reference De Vries and Watt1996). This propensity to recall more positive events is reinforced by the fading affect bias: The tendency for the emotional valance of events to fade, particularly for negative past events (Walker and Skowronski, Reference Walker and Skowronski2009). In some cases, negative events at the time of occurrence are later recalled positively (Skowronski et al., Reference Skowronski, Walker, Henderson and Bond2014). As people grow older they also tend to display a positivity effect; that is, a preference for focusing on positive information both in attention and memory (Mather and Carstensen, Reference Mather and Carstensen2005).
Big life decision elements

Big life decision categories and types

The fading affect bias and positivity bias suggest that recalled big life decisions will be overwhelmingly evaluated as positive. This is consistent with people’s tendency to increase their liking of a choice after making it, particularly when it was difficult (Brehm, Reference Brehm1956). However, the fading affect bias is weaker for important life events, particularly negative ones (Ritchie et al., Reference Ritchie, Skowronski, Wood, Walker, Vogl and Gibbons2006). It may be that traumatic events are particularly self-relevant and thus unlikely to fade over time. Moreover, the tendency for recalled events to later be evaluated as more positive was not found for events in which the participant had ‘plenty of choice’ (Rönkä et al., Reference Rönkä, Oravala and Pulkkinen2003). I was interested to discover how often negatively evaluated big decisions are mentioned.
1.5. When do big life decisions happen?
A common finding from autobiographical memory research is the ‘reminiscence bump’: The observation that those aged over 40 years old tend to have the strongest autobiographical memory for events that happened around the age of 20 years old (Rubin et al., Reference Rubin, Rahhal and Poon1998). The bump appears to be linked to a life period of transition with novel experiences and marked changes in self-identity (Rathbone et al., Reference Rathbone, Moulin and Conway2008) all guided by a narrative understanding of typical major life events—a cultural life script (Berntsen and Rubin, Reference Berntsen and Rubin2002). The bump is particularly evident for positive, high perceived-control scripted events such as getting married (Glück and Bluck, Reference Glück and Bluck2007). I was interested to discover whether the bump is also observed when thinking about big decisions as well as map out the typical big decision time course.
1.6. Overview of current studies
In this article, I describe 3 exploratory studies. In Study 1, I develop a definition of big life decisions, reveal the 10 elements of a big life decision, and introduce a new taxonomy of big life decision categories and types. In Study 2, I reveal people’s perceptions of and expectations for the average person’s big life decisions, thereby shedding light on the typical life script. In Study 3, I reveal people’s recollections for and evaluations of their own big life decisions, thereby shedding light on their lived life narrative. Study 1 and 2 are described briefly and in full in the Online Supplements whereas Study 3, which was considered the flagship, is described in full.
2. Study 1
In the mostly qualitative Study 1, 62 participants recruited using Prolific (www.prolific.co) ranging in age between 25 and 75 years described their definition of a big life decision, the elements of a big life decision, and 3 of their own big life decisions. Based on my analysis in addition to 2 independent judges, big decisions were found to have 10 elements (Table 1). After carefully reading through all the decisions, I classified them into a taxonomy comprising 58 decision types and 9 decision categories (Table 2). A ‘decision type’ refers to a commonly mentioned big life decision (e.g., get married) and a ‘decision category’ refers to a set of related decision types (e.g., relationships). Refer to Online Supplements 2 and 3 for a complete description of Study 1.
3. Study 2
In the mostly quantitative Study 2, 120 participants recruited using Prolific ranging in age between 24 and 75 years indicated (1) to what extent each of the decision elements in Table 1 applied to each of the decision types in Table 2, (2) the estimated age that an average person makes each big decision for the first time, (3) how big each decision was relative to others in Table 2 (i.e., its importance), and (4) the estimated percentage of adults in the country who would include the decision in their list of 10 biggest life decisions (i.e., expected incidence rate).
I figured that the decisions of most interest would be those that were both relatively important and relatively common. To reveal these decisions, I mapped average importance against the average expected incidence rate for each decision type (Figure 1). The correlation between importance and estimated incidence was positive, r = .40, p = .005. The 3 decisions in the upper-right corner of this figure—getting married, having a child, and buying a home—stand out as the most important and most common big life decisions. Other decisions, such as ending a life or moving to a new country, are less common but of the great importance when they do happen. Refer to Online Supplements 4 and 5 for a complete description of Study 2.
Scatterplot of average expected population incidence rate against average importance for each decision type in Study 2.

4. Study 3
In Study 3, participants were asked to describe and rate on numerous dimensions the 10 biggest decisions they had made in their past. This number of decisions was chosen as it was within the bounds of previous work asking about important life events (De Vries and Watt, Reference De Vries and Watt1996). I had 3 primary dependent variables. First, decision evaluation, which was measured by asking participants to judge, retrospectively, how good or bad each decision was. Second, decision importance, which was measured by asking participants to rank order their decisions from most to least big. Third, decision timing, which was measured by asking participants to state their age at the time of the decision. Given my intentionally age-diverse sample, I was also able to compare the responses of those who were younger with those who were older.
In addition to these 3 primary dependent variables, I also collected data for numerous other variables to explore the correlates of good and important decisions with various features about each decision as well as various features of the decision-maker (Appelt et al., Reference Appelt, Milch, Handgraaf and Weber2011). With respect to features of the decision, participants indicated who was responsible for the decision (e.g., individual or joint), the degree of advice sought, whether the decision involved change, the degree to which the decision was expected by others, the type of decision strategy used (e.g., intuitive or analytical), amount of time spent thinking about the decision, amount of confidence in the decision made, and the degree to which the decision could be reversed. With respect to features of the decision-maker, I measured personality, decision-making style, life orientation, life satisfaction, impulsiveness, cultural orientation, and risk attitude.
4.1. Method
4.1.1. Participants
Participants were recruited via CloudResearch (formerly TurkPrime; Litman et al., Reference Litman, Robinson and Abberbock2017), a participant -sourcing platform for online research, through both their Prime Panels function and integration with Amazon Mechanical Turk (MTurk). Participants were paid approximately US$7.00 for completing the study.
Participants were eligible to complete the study if they were aged between 20 and 80 years and living in the United States. A quota-based sampling approach was employed with the aim of recruiting at least 50 males and 50 females in each of the following age groups: 20–29 years, 30–39 years, 40–49 years, 50–59 years, 60–69 years, and 70–79 years. In addition, I aimed to use quota sampling to ensure the sample was generally representative of the United States in terms of ethnicity and geographic location. The sample size was based on an intuitive estimate of what would be sufficient to answer the research questions in this relatively new domain of inquiry as well as available financial resources. Given the expectation for some participants to be excluded from the analysis due to poor data quality, I oversampled.
A total of 1,418 participants began the survey. Of those, 1,156 participants passed the initial quota questions and were permitted to complete the survey. Of those, 714 participants completed the survey. Of those, 658 participants were judged to have answered the questions with sincerityFootnote 2 (see Table 3 for age breakdown). A full breakdown of the participant characteristics is presented in Table A11 in Online Supplement 8.
Characteristics of sample in Study 3

4.1.2. Procedure and materials
Participants were initially presented with screening and quota questions that confirmed eligibility to take part in the study by measuring their gender, age bracket, geographic location, and ethnicity. Participants who were eligible to take part in the survey then completed a further demographic questionnaire. These demographic questions measured specific location in the USA, marital status, level of education, employment status, household income, political orientation, English language proficiency, and the importance of religion.
Participants were informed that the survey was about the biggest decisions that they have made in their lives and were provided with the definition developed in Study 1. The study comprised 3 sections. Section 1 asked the participants to describe the 10 biggest decisions that they had made in the past. Section 2 asked the participants to describe the 10 biggest decisions that they expected to make in the future. The results from this forecasting section are not discussed further. Section 3 involved a series of questionnaire items that measured various individual difference variables.
In sections 1 and 2, for each decision, participants were asked to type into a textbox information about the decision they had made and the options that they had been or would be choosing between. In addition, for past decisions only, participants were asked to explicitly type into a textbox which option they chose. Next, participants were asked to indicate how old they were, or anticipated they would be, when making the decision.
For each decision, the participant was asked to categorize it into one of the decision types listed in Table 2. Due to the importance of accuracy for this categorization, participants were offered a potential US$7 bonus for accurate categorization of all the decisions that they recalled. Specifically, participants were informed that a week after the survey was completed that 10 participants would be randomly selected and the accuracy of each of these participants’ categorization would be assessed. If each decision was reasonably categorized, then a US$7 bonus would be given to the participant.
Two research assistants unfamiliar with the project were provided with the descriptions of each participant’s first decision and independently asked to judge the appropriate decision category and decision type using Table 2 for each of the 658 decisions. For decision category, the inter-rater agreement was 91.8% (Cohen’s kappa = 0.89). For decision type, the inter-rater agreement was 82.5% (Cohen’s kappa = 0.81). These inter-rater reliability findings are very good considering the number of possible categories and types. Many of the coder differences were caused by choices between 2 decision types (e.g., choosing to go to college vs. joining the military).
A third research assistant, also unfamiliar with the project, carefully read through every decision description as well as the participant’s categorization of the decision. Based on the research assistant’s analysis, I manually corrected 452 categorizations (3.4% of all categorizations). These corrections were only applied to obvious errors. Of these corrections, 81% moved from one of the ‘Other’ subcategories to a more specific category. For example, 35 corrections were from the ‘Other’ to ‘Travel/holiday (or not)’ subcategory. Another 35 corrections were from the ‘Family–Other’ to ‘Get married (or not)’ subcategory. In addition, due to a programming error, the ‘Choose where to study’ decision type was not presented to participants, so I made a further 84 changes from ‘Education–Other’ to ‘Choose where to study’ decision type.
For each past decision, participants were also asked to evaluate the decision on the following 11 dimensions. The degree of change associated with the decision (Maintain the status quo—Change, measured on a 2-point scale). The degree to which the decision was expected by loved ones (Expected–Unexpected, measured on a 2-point scale). The degree to which advice was sought prior to making the decision (No advice–A lot of advice, measured on a 3-point scale). Whether the decision had been made alone or with others (Individual decision–Joint decision, measured on a 2-point scale). The degree to which the decision was made based on intuition or analysis (It was entirely intuition–It was entirely analysis, measured on a 5-point scale). The amount of time spent thinking about the decision before making it (Seconds–Decades, measured on a 7-point scale). The degree of confidence in the decision at the time (Not at all confident–Extremely confident, measured on a 5-point scale). The degree of obligation felt when making the decision (Not at all obligated–Extremely obligated, measured on a 5-point scale). How big the decision felt at the time (Not at all big–Extremely big, measured on a 5-point scale). The degree of difficulty in changing the decision after it was made (Not at all hard to undo–Extremely hard to undo, measured on a 5-point scale). And, finally, the overall evaluation of the decision in retrospect (It was a very bad decision–It was a very good decision, measured on a 5-point scale).
At the end of both sections 1 and 2, participants were asked to rank by importance each past and future decision that they had described. Next, participants were asked to consider the 10 biggest decisions that they would make during their entire life and indicate how many of these decisions they have already made as of today versus would need to make in the future.
Participants next proceeded to section 3, where they completed the following individual differences measures in this order: personality (Gosling et al., Reference Gosling, Rentfrow and Swann2003), decision style (Hamilton et al., Reference Hamilton, Shih and Mohammed2016; Turner et al., Reference Turner, Rim, Betz and Nygren2012), life orientation (Scheier et al., Reference Scheier, Carver and Bridges1994), impulsiveness (Patton et al., Reference Patton, Stanford and Barratt1995), life satisfaction (Diener et al., Reference Diener, Emmons, Larsen and Griffin1985), psychological well-being (Diener et al., Reference Diener, Wirtz, Tov, Kim-Prieto, Choi, Oishi and Biswas-Diener2010), cultural orientation (Triandis and Gelfand, Reference Triandis and Gelfand1998), and risk tendency (Blais and Weber, Reference Blais and Weber2006). Further details about these measures are provided in Online Supplement 6. A copy of the survey is provided in Online Supplement 7.
4.1.3. Transparency and openness
Given the exploratory nature of this project, none of the reported studies were pre-registered. Nevertheless, I report all measures and data exclusions. Each study was programmed in Qualtrics. The decision to stop collecting data did not depend on the obtained results. Data were cleaned in Microsoft Excel before being imported into JMP Version 16 for analysis. All research materials, raw data, and analysis code are available at https://osf.io/n8kfp/?view_only=386146b2e9234435a259800b3bdd26c2.
4.2. Results
4.2.1. What are the most common big life decisions?
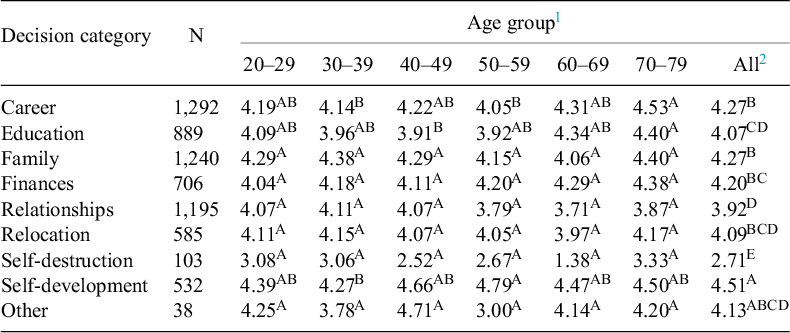
To learn what are the most common big life decisions, I first calculated the average number of big life decisions mentioned split by decision category and age group (Table 4). As noted by Schroots and Assink (Reference Schroots and Assink2005), these data could be examined as the number of events per decision category or as the number of individuals per decision category. Both have merit. I decided to use the former method given the research aims and to better align with past research. However, I do note that this format can be misleading when one individual reports multiple decisions of the same type.
Average number of big life decisions split by age group and decision category in Study 3

1 Values in the same row not connected by the same letter are significantly different by Tukey HSD.
2 Values in the same column not connected by the same number are significantly different by Tukey HSD.
The most common decision categories are related to career, family, and relationships whereas the least common decision categories are related to self-destruction and self-development. There were also some interesting age-related trends. For example, the prominence of career decisions increased with age whereas the prominence of education, self-destruction, and self-development decisions decreased with age.
I also calculated the average number of big life decisions mentioned split by decision type and age group (Table A12 in Online Supplement 8). The 5 most common decision types were to start a new job, get married, pursue a degree, have a child, and buy a home. Again, there were some interesting age-related trends. For example, reporting of the following decision types increased with age: get married, buy home, have a child, get divorced, and retire. By contrast, reporting of the following decision types decreased with age: pursue a degree, choose a major/specialization, choose where to study, getting a pet, buy something, starting and ending both romantic and nonromantic relationships, change physical appearance, and engage in a hobby/sport.
I noticed that the number of event counts for several decision categories was significantly moderately negatively correlated (Table A13 in Online Supplement 8). This suggests that making big decisions in some categories (e.g., career) was systematically at the expense of making big decisions in certain other categories (e.g., family and relationships).
I was also able to contrast expected incident rate of decision types in top 10 biggest decision lists (from Study 2; Table A6 in Online Supplement 4) with actual incidence rate in people’s list of recalled 10 biggest decision (from Study 3). Notably, the incidence of nearly every decision type was over-estimated. This is likely because those in Study 3 were constrained to report 10 decisions whereas there were no constraints for estimated incidence rates made in Study 2. Decision types that were most over-estimated were to sell home, retire, move to new place in same city, engage in sexual activity, and take social security. By contrast, the only decision types to be underestimated were to pursue a degree and start a new job/position.
4.2.2. What are the most important big life decisions?
To learn what are the most important big life decisions, I calculated the average rank of big life decisions split by decision category and age group (Table 5). On average, the 3 most important (i.e., lowest average rank) decision categories were relationships, family, and self-destruction. On average, those who were in their 20s ranked the education decision category as more important and the relationships decision category as less important.
Average rank of big life decisions split by age group and decision category in Study 3

1 Values in the same row not connected by the same letter are significantly different by Tukey HSD.
2 Values in the same column not connected by the same number are significantly different by Tukey HSD.
I also calculated the average rank of big life decisions split by decision type and age group (Table A14 in Online Supplement 8). The 5 most important decision types were end a life, self-harm, get married, have a child, and peruse religion or spirituality, all of which were mostly consistent with Study 2 (Figure 1). Although some of these events were relatively uncommon, when made they were quite often monumental. For example, there were only 62 reports of ending a life—often to terminate a pregnancy—and yet 50% of those who had made this decision ranked it as the biggest they had ever made. By contrast, getting married was the second most commonly mentioned decision and 48% of those who had made this decision ranked it as the biggest or second biggest they had ever made.
I was next interested in understanding what factors predict more important big life decisions. I conducted this analysis using the following 11 decision factors at the time of the decision: age (decision age); the perceived ‘bigness’ of the decision at the time of making it (bigness: coded 1 = ‘Not at all big’ to 5 = ‘Extremely big’); whether the decision involved change (change: coded 0 = ‘Maintain the status quo’ to 1 = ‘Change’); whether the decision was unexpected by loved ones (unexpectedness: coded 0 = ‘Expected’ to 1 = ‘Unexpected’); the degree of advice sought prior to making the decision (advice: coded 1 = ‘No advice’ to 3 = ‘A lot of advice’); whether there was shared responsibility for making the decision (responsibility: coded 0 = ‘Individual decision’ to 1 = ‘Joint decision’); the type of strategy approach adopted to make the decision (strategy: coded 1 = ‘It was entirely intuition’ to 5 = ‘It was entirely analysis’); the amount of time taken before making the decision (time: coded 1 = ‘Seconds’ to 7 = ‘Decades’); the degree of confidence in the decision at the time of making it (confidence: coded 1 = ‘Not at all confident’ to 5 = ‘Extremely confident’); the degree of obligation the decision-maker felt at the time of making the decision (obligation: coded 1 = ‘Not at all obligated’ to 5 = ‘Extremely obligated’); the degree to which it was difficult to reverse the decision after it was made (reversibility: coded 1 = ‘Not at all hard to undo’ to 5 = ‘Extremely hard to undo’).
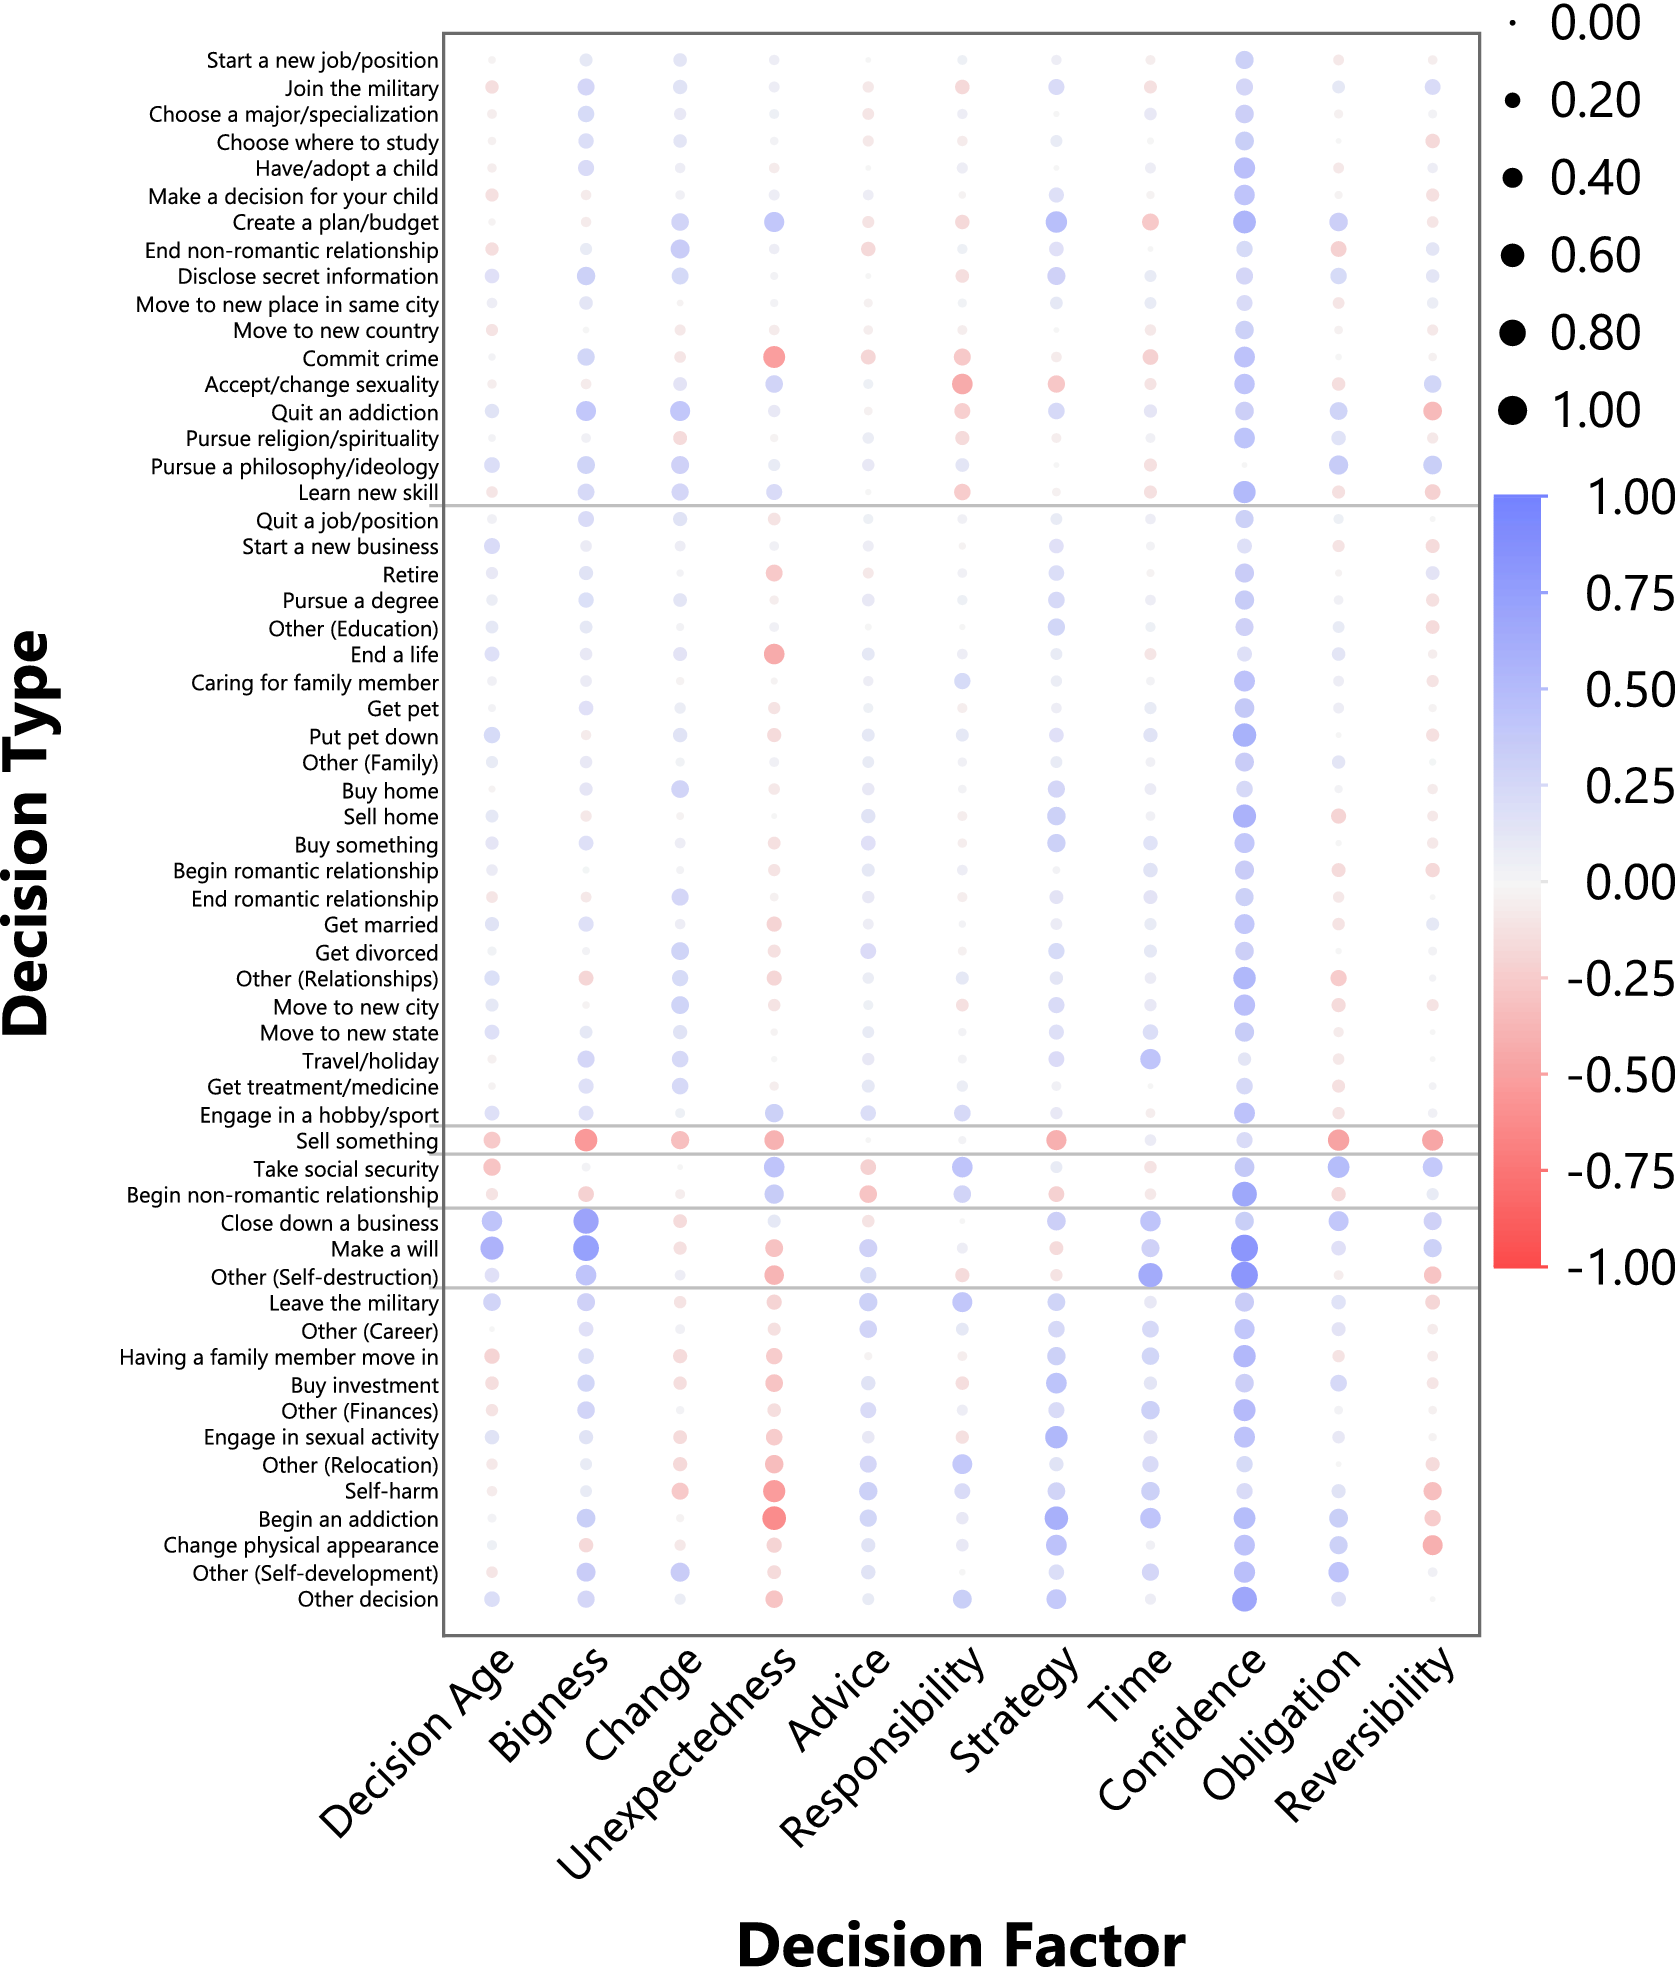
In terms of the analysis approach, I first looked at the correlation between the 11 decision factors, as well as decision evaluation, and decision rank (Table A15 in Online Supplement 8). I also ran this analysis for each decision category (Table A16 in Online Supplement 8) and for each decision type (Table A17 in Online Supplement 8). Next, I ran a hierarchical cluster analysis on the correlations between the decision factors and decision rank for each decision type. The clustering was done to classify the decision types according to which decision factors predict decision rank. The clustering that made the most sense divided the decision types into 5 clusters (Figure 2). Cluster 1, which included 29 decision types, was relatively high on decision age and relatively low on confidence. Cluster 2, which included 8 decision types, was relatively low on bigness, change, advice, responsibility, and time. Cluster 3, which included 19 decision types, was relatively high on bigness, change, reversibility, and evaluation. Clusters 4 and 5 each contained just one decision type and are not discussed further. Finally, I calculated the correlation between each cluster and decision rank for each decision factor (Table A18 in Online Supplement 8). A summary of the analyses is presented in Table 6. There are a number of interesting patterns that emerged. For example, lower-ranked (i.e., more important) decisions tended to be associated with:
-
• Younger decision age, especially for family decisions (such as making a decision for your child), career decisions (such as starting a new job/position), and education decisions (such a pursuing a degree). An exception was self-destruction decisions (such as beginning an addiction) for which an older decision age was associated with more important decisions.
-
• Joint decision-making, especially for finances decisions, relationships decisions, and education decisions (such as choosing where to study). There were exceptions for self-development decisions (such as pursuing religion/spirituality) and self-destruction decisions for which individual decision-making was associated with more important decisions.
-
• More obligated decision-making, especially for education decisions (such as choosing where to study), family decisions (such as making a decision for your child), and self-development decisions. There were exceptions for moving to a new state, selling something, and beginning an addiction for which less obligated decision-making was associated with more important decisions.
-
• More difficult to reverse decisions, especially for family decisions (such as making a decision for your child), relationships decisions (such as getting married), and education decisions (such as pursuing a degree).
Correlations between decision factors and decision rank for each decision type and cluster in Study 3.
Note: Horizontal lines demarcate different clusters.

4.2.3. How are big life decisions retrospectively evaluated?
To examine how different big life decisions were retrospectively evaluated, I calculated the average evaluation of big life decisions for each decision category and age group. This produced a score between 1 (corresponding to ‘It was a very bad decision’) and 5 (corresponding to ‘It was a very good decision’) (Table 7). Interestingly, nearly every score is above the mid-point, suggesting a strong tendency to positively evaluate past decisions. More specifically, on average, the decision categories evaluated most positively were self-development, career, and family whereas the decision categories evaluated most negatively were self-destruction, relationships, and education.
Analysis summary of decision factors’ association with decision rank in Study 3

Note: All displayed correlation coefficients are significant, p < .05.
a Listed decision categories and decision types are all significantly correlated with decision rank. Listed order is from smallest to largest p-value separated by whether the decision factor is positive ‘(+)’ or negative ‘(−)’ correlated.
Evaluation of big life decisions for each age group and decision category in Study 3
1 Values in the same row not connected by the same letter are significantly different by Tukey HSD.
2 Values in the same column not connected by the same number are significantly different by Tukey HSD.
I also calculated the average evaluation of big life decisions for each decision type and age group (Table A19 in Online Supplement 8). On average, the most positively evaluated decision types were to pursue a philosophy or ideology, take social security, quit an addiction, make a will, and pursue religion or spirituality whereas the most negatively evaluated decision types were to begin an addiction, commit a crime, engage in sexual activity, begin a nonromantic relationship, and disclose secret information. Consistent with the fading affect bias and positivity bias, there was some evidence that those who were in the oldest age group judged past decisions more positively.
In order to visually represent the 3 dependent variables discussed so far, I plotted average decision evaluation against average decision rank with decision frequency represented as the size of each point (Figure 3). Decision types located in the upper left region of the figure are considered relatively more important as well as very good decisions. Examples of decision types in this region include having/adopting a child and pursuing religion/spirituality. Decision types located in the mid-to-lower left region of the figure are also considered relatively more important but ambivalent or bad decisions. Examples of decision types in this region include ending a life, getting married, and self-harm. Decision types located in the upper right region of the figure are considered relatively less important as well as very good decisions. Examples of decision types in this region include taking social security, making a will, and travel/holiday. Decision types located in the mid-to-lower right region of the figure are considered relatively less important and ambivalent or bad decisions. Examples of decision types in this region include committing a crime and beginning an addiction.
Scatterplot of average decision rank against average decision evaluation for each decision type in Study 3. Note: The size of the point indicates the relative frequency of each decision type.
I was next interested in understanding what factors predict more positively evaluated big life decisions. I conducted this analysis using 2 different sets of predictor variables. The first set of variables, similar to decision rank, examined the relationship between decision evaluation and decision factors at the time of the decision. The second set of variables examined the relationship between decision evaluation and individual difference factors at the time of recalling the decision.
In terms of the analysis approach, I again first looked at the correlation between the 11 decision factors and decision evaluation (Table A15 in Online Supplement 8). I also did this analysis for each decision category (Table A20 in Online Supplement 8) and each decision type (Table A21 in Online Supplement 8). Next, I ran another hierarchical cluster analysis on the correlations between the decision factors and decision evaluation for each decision type. The clustering was done to classify the decision types according to which decision factors predicted decision evaluation. The clustering that made the most sense divided the decision types into 6 clusters (Figure 4). Cluster 1, which included 17 decision types, was relatively high on unexpectedness and relatively low on advice, responsibility, strategy, and time. Cluster 2, which included 23 decision types, was relatively high on decision age and relatively low on obligation. Cluster 6, which included 12 decision types, was relatively high on advice, responsibility, strategy, time, confidence, and obligation and relatively low on change and unexpectedness. Clusters 3, 4, and 5 each contained just 1, 2, and 3 decision types, respectively, and are not discussed further. Finally, I found the correlation between each cluster and decision evaluation for each decision factor (Table A22 in Online Supplement 8).
Correlations between decision factors and decision evaluation for each decision type and cluster in Study 3. Note: Horizontal lines demarcate different clusters. Clusters are based on the correlation between the decision factor and decision evaluation for each decision type.

A summary of the analyses is presented in Table 8. There are a number of interesting patterns that emerged. For example, better-evaluated decisions tended to be associated with:
-
• Change from the status quo, especially for self-development decisions (such as quitting an addiction), relationship decisions (such as getting a divorce), and career decisions (such as starting or a new job/position).
-
• Obtaining more advice, especially for relationships decisions (such as getting divorced) and finances decisions (such as buying something).
-
• Using a more analytic decision approach, especially for finances decisions (such as buying something), education decisions (such as pursuing a degree), and relocation decisions (such as moving to a new state).
-
• Less unexpectedness from friends and family, especially for self-destruction decisions (such as self-harm), relationship decisions (such as getting married), and finances decisions (such as retiring). An exception was engaging in a hobby/sport for which unexpectedness was positively associated with decision evaluation.
-
• Less difficult to reverse, especially for education decisions (such as pursuing a degree). An exception was getting married for which difficulty to reverse the decision was positively associated with decision evaluation.
Analysis summary of decision factors’ association with decision evaluation in Study 3

Note: All displayed correlation coefficients are significant, p < .05, except for the r = −.01.
a Listed decision categories and decision types are all significantly correlated with decision evaluation. Listed order is from smallest to largest p-value separated by whether the decision factor is positive ‘(+)’ or negative ‘(−)’ correlated.
The second set of variables investigated were the following 9 individual difference factors measured at the time of recalling the decision: personality, decision style (comprising both maximization tendency and rationality tendency), life orientation, impulsiveness, well-being (comprising both life satisfaction and psychological well-being), cultural orientation, and risk attitude. The correlations between these variables and decision evaluation are presented in Table A23 in Online Supplement 8. In what follows, I discuss some of the more interesting correlations and discuss the rest in Online Supplement 8.
Regarding decision style, correlations revealed that decisions were more positively evaluated when the decision-maker was higher in rational decision style (r = .09, p < .0001) and maximization tendency—both in terms of search maximization (r = .11, p < .0001) and outcome maximization (r = .08, p < .0001)—as well as lower in intuitive decision style (r = −.03, p = .01). Regarding risk tendency, correlations revealed that decisions were more positively evaluated when the decision-maker was lower in health domain risk (r = .09, p < .0001) and lower in ethical domain risk (r = .08, p < .0001).
4.2.4. When do big life decisions happen?
To learn when big life decisions happen, I calculated the average number of big life decisions estimated to have already been made for each age group. The averages were 3.27, 4.42, 5.23, 5.37, 6.57, and 6.66 for age groups 20–29 years, 30–39 years, 40–49 years, 50–59 years, 60–69 years, and 70–79 years, respectively. The only demographic variable that correlated more very than weakly with the average number of big life decisions estimated to have already was age (r = 0.45, p < .0001).
Next, I looked at participant’s reported ages at the time of making their big life decisions. These decision ages were divided into the following 8 equal-sized decision age bins: 0–9 years, 10–19 years, 20–29 years, 30–39 years, 40–49 years, 50–59 years, 60–69 years, and 70–79 years. Figure 5 displays the percentage of recalled big decisions in each bin for each age group. Consistent with the reminiscence bump, more decisions were recalled for the 20–29 decision age bin than any other bin for all age groups.Footnote 3
Percent of recalled past big decisions for each decision age period and age group in Study 3.

I next calculated the average age of individuals at the time of their big life decisions for each decision category and age group (Table 9). On average, education and self-destruction decision categories were mentioned most by those who were younger whereas finances, career, and family decision categories were mentioned most by those who were older. Apart from education and self-destruction decision categories, all other categories showed a positive age-dependent trend such that older age groups reported older ages at the time of making decisions.
I also calculated the average age of individuals at the time of their big life decisions for each decision type and age group (Table A24 in Online Supplement 8). Decisions that tended to be made early in life included choosing a major, joining the military, choosing where to study, beginning an addiction, and committing a crime. By contrast, decisions that tended to be made later in life included retiring, taking social security, making a will, closing down a business, and selling a home.
I was also able to contrast expected age at the time of the decision (from Study 2; Table A6 in Online Supplement 4) with actual age at the time of the decision (from Study 3). The following decision types were made earlier in life than expected: Caring for a family member, disclosing secret information, retire, move to a new country, and make a will. By contrast, the following decision types were made later in life than expected: selling something, getting a pet, buying something, beginning a nonromantic relationship, and travel/holiday.
5. General discussion
5.1. The character of big life decisions
Decisions are ubiquitous. Past research has investigated what makes a decision hard (vs. easy) and what makes a decision good (vs. bad) (Yates et al., Reference Yates, Veinott, Patalano, Schneider and Shanteau2003). This is the first comprehensive investigation of what makes a decision big (vs. small). My research makes several contributions to the literature of decision-making as well as autobiographical memory.
Average age at the time of big life decision for each age group and decision category in Study 3

1 Values in the same row not connected by the same letter are significantly different by Tukey HSD.
2 Values in the same column not connected by the same number are significantly different by Tukey HSD.
The first contribution of this research is to specify the 10 elements that characterize big life decisions; namely that they are rare, involve uncertain outcomes, involve much contemplation, relate to personal morals/values, require significant investment of resources, rule out many other options, affects multiple areas of life, affects other people, have long-lasting consequences, and are difficult to reverse. These 10 elements can be roughly be placed into 4 categories: those that relate to the decision context (Rare; Uncertain), those that relate to the decision process (Contemplation; Moral), those that relate to decision execution (Costly), and those that relate to the decision consequences (Precludes; Multiple Areas; Multiple People; Long-lasting; Irreversible).
The second contribution of this research is to develop a comprehensive taxonomy of big life decisions, which comprise 9 decision categories and 58 decision types. This taxonomy compliments those that have been created in the context of life event studies (e.g., Rönkä et al., Reference Rönkä, Oravala and Pulkkinen2003; Schroots and Assink, Reference Schroots and Assink2005). However, the current taxonomy is distinct from those in several important ways. First, the current taxonomy is the broadest; the closest alternative is in Bohn (Reference Bohn2010), which considered 35 life script events (Berntsen and Rubin, Reference Berntsen and Rubin2002) as well as 17 nonscripted life events. Second, the current taxonomy is narrower in scope in that it specifically relates to decisions in which the individual had a high degree of control and knowingly chose between two or more alternatives. Consequently, the current taxonomy excludes low-control events that appear in other taxonomies such as accidents, illnesses, and death (Baum and Stewart, Reference Baum and Stewart1990) and world affairs such as war (Rönkä et al., Reference Rönkä, Oravala and Pulkkinen2003). A benefit of this narrower scope is an ability to capture data about qualitatively different experiences that would otherwise be lumped together. For example, ‘leave home’ is a standard life script event but the current taxonomy distinguishes between 4 types of relocation. Third, although the current taxonomy’s decision categories of career, education, family, finances, relationships, relocation, self-destruction, and self-development map closely to the high-level categories of existing taxonomies, many of the more specific decision types in the current taxonomy are unique. These include decisions such as choosing which tertiary institution to attend, getting a pet, disclosing secret information, and changing physical appearance. Fourth, perhaps most importantly, the current taxonomy is the only one to include decisions of inaction. Event-based taxonomies are blind to these nonevents even though some of these decisions are among the most important in a person’s life (e.g., not to have children, not to get a divorce).
The third contribution of this research is to reveal what life’s biggest decisions are. Unique to my approach was to examine both the expected (Study 2) and actual (Study 3) frequency of each decision as well as expected and actual importance. Consistent with life event studies, which have almost exclusively focused on event frequencies (e.g., Baum and Stewart, Reference Baum and Stewart1990; De Vries and Watt, Reference De Vries and Watt1996; Glück and Bluck, Reference Glück and Bluck2007; Rönkä et al., Reference Rönkä, Oravala and Pulkkinen2003), I found that the most common big life decisions are pursuing a degree, starting (and quitting) a job, getting married (and divorced), having a child, buying (and selling) a home, and relocating. These common decisions map closely to the cultural life script of major events in a normal life (Berntsen and Rubin, Reference Berntsen and Rubin2002). Of course, these findings are limited to the extent that my sample was representative of the society. I used a carefully selected quota sampling method to gather data from a diverse sample of Americans but my research approach nonetheless excluded those without access to the internet or the inability or unwillingness to use it.
There were many examples of people explicitly choosing not to make a decision. In Study 3, I found that 18.8% of decisions were to maintain the status quo and decide not to do something. Situations in which the individual chose not to make a decision consistent with the cultural life script are particularly interesting. For example, for the marriage decision type, 389 (82.4%) responses were to make a change (usually, to get married) whereas 83 (17.6%) responses were to maintain the status quo (usually, to not get married). Other decision types for which maintaining the status quo was high were disclosing secret information (37.0%), caring for a family member (31.3%), creating a plan/budget (20.0%), and buying something (28.6%). Future research could potentially learn much from uncovering the motivations and decision strategies adopted by those who deviate from life script events.
It is also very insightful to look at how relatively important each type of decision was considered. Previous studies that have asked about event importance have not examined these data at the level of the event/decision (e.g., Newby-Clark and Ross, Reference Newby-Clark and Ross2003; Thomsen and Berntsen, Reference Thomsen and Berntsen2009). Although the correlation between importance and frequency is moderately positive, several decisions that were considered very important were relatively uncommon and thus do not appear on cultural life script lists. These include decisions to end a life (e.g., getting an abortion, turning off life support for a loved one), engaging in self-harm (e.g., attempting suicide), pursuing a higher-level purpose (e.g., religion, spirituality, philosophy, or ideology), acts related to gender and sexuality (e.g., revealing sexual preference to loved ones, changing gender identity), and caring for a family member (e.g., aging parent, unwell partner). Although uncommon, these decisions are momentous and cannot be ignored when thinking about significant life experiences. I note that many of these decisions could be considered embarrassing or contrary to social norms and so, given that my research relied on self-report, are likely to be underreported in the data.
5.2. Making good big life decisions
The fourth contribution of this research relates to the types of decisions that are considered good ones and the factors associated with those good decisions. Consistent with past research, the majority of recalled big decisions were evaluated, at least in retrospect, positively (De Vries and Watt, Reference De Vries and Watt1996), and this positivity bias was stronger for those who were older (Mather and Carstensen, Reference Mather and Carstensen2005). In Study 3, of the 6,580 reported decisions, 4,055 (61.6%) were considered ‘very good’ decisions, and 945 (14.3%) were considered ‘slightly good’ decisions. The most positively evaluated decisions were those of self-development such pursuing a philosophy/ideology or religion/spirituality. These findings support the idea that a good decision is one that contributes to a meaningful life; one characterized by purpose, coherence, and moral principles (Ryan and Deci, Reference Ryan and Deci2001).
I also examined the 1,580 (24.0%) decisions that were not positively evaluated. The most negatively evaluated decisions were those related to self-destruction such as beginning an addiction or committing a crime. Consistent with the regret literature, these decisions appear to correspond to those that moved the person further from their—or, perhaps, society’s—ideal version of themselves (Davidai and Gilovich, Reference Davidai and Gilovich2018). However, contrary to research from the regret literature, these negatively evaluated decisions were almost always decisions of action rather than inaction (Gilovich and Medvec, Reference Gilovich and Medvec1994). It may be that regrettable big life decisions of action made in early in life put one on an undesirable and near-inescapable trajectory (e.g., committing a crime leads to jail time, which leads to an inability to find decent work).
The next least positively evaluated decision category was relationships. This decision category had the interesting feature of approximately half of the decision types being about beginning a relationship (e.g., friendship, romance, marriage) and the rest about ending a relationship. When I crossed decision evaluation with the decision factor of change, it was quite clear that ending (presumably, bad) relationships that resulted in change from the status quo were generally very positively evaluated. By contrast, getting married, which was reported 472 times, was much more ambivalently evaluated. Sequentially crossing decision evaluation with each of the decision factors revealed that the marriage decision type was most positively evaluated when it was made after a lot of advice, with extreme confidence, was not unexpected or obliged by loved ones, and based on an even balance of both intuition and analysis.
I explored numerous factors associated with each decision at the time it was made with reference to its evaluation at the time I collected the data. My analysis revealed 10 significant decision factors, which varied in importance between decision categories. Looking at these factors together suggests that more positively evaluated decisions were those that used a good process to make the decision in the first place. A better process involved using a more analytical approach, obtaining more advice, spending more time thinking before making the decision, and avoiding choosing options due to obligation. This last factor supports Australian palliative caregiver Bronnie Ware’s (Reference Ware2012) report of the biggest regret of the dying: ‘I wish I’d had the courage to live a life true to myself, not the life others expected of me’. Better decisions also tended to be those associated with change, which is consistent with research that suggesting that people may be excessively cautious when facing life-changing choices and would often be better off by choosing the option that results in the most change (Levitt, Reference Levitt2021).
One of the most predictive factors was subjective feeling of confidence: decisions were evaluated more positively when the individual recalled feeling more confident in the decision at the time. This may be an artifact of the ‘best’ decision being more obvious. People tended to recall feeling most confident about decisions related to self-development (e.g., pursue a philosophy/ideology or religion/spirituality), finances (e.g., retire, buy a home), and family (e.g., getting married, have a child) and least confident about decision-related to self-destruction (e.g., self-harm), relationships (e.g., engage in sexual activity, begin a romantic relationship), and career (e.g., quitting a job, closing down a business). These findings are consistent with evidence accumulation theories of decision-making (e.g., Pleskac and Busemeyer, Reference Pleskac and Busemeyer2010), which suggests that subjective feelings of low confidence correspond to the metacognitive decision to continue to search for information. Consequently, a decision made with a high degree of subjective confidence signals that sufficient information has been collected to make a reasonable choice.
5.3. The time course of big life decisions
The fifth contribution of this research is to reveal when big life decisions are expected to (Study 2) and actually do (Study 3) happen. Consistent with the reminiscence bump, I found that big life decisions were most commonly reported as occurring between the ages of 20–29 years (Rubin et al., Reference Rubin, Rahhal and Poon1998). One explanation for the bump is that people use a mental life script, which contains a list of typical events that make up a normal life, as a scaffold to search memory, and the memories that surface are those in which the individual was able to take control of their life in a way that had a strong influence on their future self-identity (Berntsen and Rubin, Reference Berntsen and Rubin2002; Glück and Bluck, Reference Glück and Bluck2007; Rathbone et al., Reference Rathbone, Moulin and Conway2008). Our results support the idea that the bump is driven by the fact that many of life’s biggest decisions, which tend to shape our future experiences and define our sense of self, happen between the ages of 18 and 34.Footnote 4
Although big decisions are front-loaded, they nonetheless occur throughout one’s life. Consider the average age at the time of making some big life decisions (as reported in Study 3): Getting divorced (36.0 years), putting down a pet (39.3 years), selling a home (43.0 years), and retiring (59.1 years). Most people seem to recognize this fact. When asked how many of their life’s 10 biggest decisions they have already made, those in their 20s estimate about 3, those in their 40s estimate about 5 or 6, and those in their 70s estimate (only) about 7. It may be that a lifetime of experience leaves one with the insight that life is unpredictable and there are always big life decisions ahead. Or perhaps the very definition of a big decision evolves over time. Others may be demonstrating the bucket list effect and have delayed many of their big leisure decisions until after retirement (Freund, Reference Freund2020).
5.4. Limitations and future research
Although my taxonomy will be useful for future research investigating big life decisions, it is essential to acknowledge that the taxonomy is applicable primarily to middle-class Americans and, to a lesser extent, other Western, educated, industrialized, rich, and democratic societies (Henrich et al., Reference Henrich, Heine and Norenzayan2010). This is critical because past research has found differences between countries in both life stories as well and life scripts (Ottsen and Berntsen, Reference Ottsen and Berntsen2014). I also note that my taxonomy is predicated on the centrality of individual choice in the development of identity and well-being; however, the centrality of choice to these constructs is by no means universal (Markus and Schwartz, Reference Markus and Schwartz2010).
In my studies, it was difficult to counter outcome bias; that is, the tendency for people to think about a past decision in terms of its outcome while deemphasizing the circumstances and events proceeding the outcome (Baron and Hershey, Reference Baron and Hershey1988). Although I did ask participants to reflect on their decision strategy, future research could attempt to further limit the influence of outcome bias by asking participants to reflect on their intentions at the time (Sezer et al., Reference Sezer, Zhang, Gino and Bazerman2016).
I am careful not to immediately assume that negatively evaluated decisions should be considered regrettable ones; that is, decisions that the individual wishes they could take back. This is because even poorly evaluated decisions can contribute to a psychologically rich life—one characterized by a variety of interesting experiences, not all necessarily good, that lead to growth and perspective changes (Oishi and Westgate, Reference Oishi and Westgate2021). Research suggests that some people can even build a ‘redemption-based’ narrative identity that is borne of their early negative circumstances (McAdams and McLean, Reference McAdams and McLean2013). Future research could pursue this line of investigation by asking for both an evaluation of big life decisions as well as the degree to which those decisions are regretted.
6. Conclusions
How your life turns out depends critically on a handful of decisions. Given their vital importance for health, wealth, and happiness, surprisingly little attention has been directed to understanding the broad nature of such big life decisions. A better understanding will allow us to be better prepared to make them. This research has taken us some steps forward on that path.
Supplementary materials
The supplementary material for this article can be found at http://doi.org/10.1017/jdm.2023.30.
Data availability statement
Research materials, raw data, and code can be accessed at https://osf.io/n8kfp/?view_only=386146 b2e9234435a259800b3bdd26c2.
Acknowledgments
Thanks go to Ashleigh Powell, Katherine Newton, Nathan Moore, Rebecca Dooley, and Alex Kroeger for valuable research assistance. Thanks also go to TaeWoo Kim, members of the UTS Behavioral Lab, and members of the UNSW Cognition Lab for feedback.


 Open access