

Introduction
Oocytes grow within follicles in the ovary and, when fully grown, remain arrested in prophase of the first meiosis at the germinal vesicle (GV) stage. When ovulation is triggered, GV arrest is released, and the oocyte undergoes meiotic maturation during which it transitions through first meiotic metaphase (MI) into second meiotic metaphase (MII), and then rearrests as a mature MII egg. The investigations reported here concern one-carbon metabolism in oocytes during meiotic maturation. One-carbon metabolism supplies one-carbon groups to diverse biological processes including the synthesis of proteins, DNA, purines, antioxidants, polyamines, and the intracellular methyl pool (Loenen, Reference Loenen2006; Ikeda et al., Reference Ikeda, Koyama, Sugimoto and Kume2012a). At the core of one-carbon metabolism are two linked pathways, the folate and methionine cycles (Ikeda et al., Reference Ikeda, Koyama, Sugimoto and Kume2012a) (Figure 1). In the folate cycle, serine donates a one-carbon unit to tetrahydrofolate (THF) via the enzyme serine hydroxymethyltransferase (SHMT) to form 5,10-methyleneTHF, which shuttles one-carbon units into the methionine cycle (or alternatively into purine synthesis or thymidine synthesis for DNA). The main function of the methionine cycle is to remethylate homocysteine to regenerate methionine. To accomplish this, 5,10-methyleneTHF must first be reduced to 5-methylTHF using the enzyme 5,10-methylenetetrahydrofolate reductase (MTHFR) in the folate cycle. This commits it to the methionine cycle, as the sole function of 5-methylTHF in mammals is to remethylate homocysteine and therefore produce methionine (Banerjee and Matthews, Reference Banerjee and Matthews1990; Yamada et al., Reference Yamada, Strahler, Andrews and Matthews2005). Homocysteine remethylation is accomplished by the enzyme methionine synthase (MTR; 5-methyltetrahydrofolate-homocysteine methyltransferase). Therefore, MTHFR is the gatekeeping enzyme that controls the transfer of one-carbon units from the folate cycle into the methionine cycle. Methionine is then complexed with adenosine via the enzyme methionine adenosyltransferase (MAT) to produce S-adenosylmethionine (SAM), which constitutes the primary methyl pool in cells. Once SAM donates its methyl group, S-adenosylhomocysteine (SAH) remains and is then recycled to homocysteine via adenosyl homocysteinase (AHCY).
Schematic of folate and methionine cycles. In the folate cycle (left), serine donates a one-carbon unit that is used by the enzyme serine hydroxymethyltransferase (SHMT) to convert tetrahydrofolate (THF) to 5,10-methylenetetrahydrofolate. A portion of 5,10-methylenetetrahydrofolate is utilized in thymidine and purine synthesis, while 5,10-methylenetetrahydrofolate that instead will supply one-carbon units to the methionine cycle (right) is converted to 5-methyltetrahydrofolate by the enzyme 5,10-methylenetetrahydrofolate reductase (MTHFR). Therefore, MTHFR activity determines the flux of one-carbon units into the methionine cycle. The one-carbon unit carried by 5-methyltetrahydrofolate is used by methionine synthase (MTR) to remethylate homocysteine to yield methionine. Methionine is then complexed with adenosine in a reaction catalyzed by methionine adenosyltransferase (MAT) to produce SAM. SAM is used by a large array of methyltransferases to methylate their substrates, while a small portion is used in polyamine synthesis. After SAM donates its methyl group, S-adenosylhomocysteine (SAH) remains, which is then converted by the enzyme adenosylhomocysteinase (AHCY) to homocysteine that is available for remethylation. This figure was adapted and simplified from a published review (Ikeda et al., Reference Ikeda, Koyama, Sugimoto and Kume2012a) in which more detailed descriptions of these cycles are provided. Components shown in red trace the transfer of one-carbon units through the folate cycle and into the methionine cycle to produce SAM and then methylated products of methyltransferases. Enzymes are indicated by their symbols enclosed in boxes.

Essentially all of the enzymes involved in one-carbon metabolism have been shown to be expressed at the transcript level and in some cases protein levels in oocytes and preimplantation embryos, although mainly in mammals other than mouse (Ikeda et al., Reference Ikeda, Namekawa, Sugimoto and Kume2010, Reference Ikeda, Koyama, Sugimoto and Kume2012a; Kwong et al., Reference Kwong, Adamiak, Gwynn, Singh and Sinclair2010; An et al., Reference An, Sun, Zhang, Lu, Peng, Xu, Zhang and Su2020; Clare et al., Reference Clare, Pestinger, Kwong, Tutt, Xu, Byrne, Barrett, Emes and Sinclair2021). Folates are transported into growing oocytes and preimplantation embryos during the 2-cell to blastocyst stages (Kooistra et al., Reference Kooistra, Trasler and Baltz2013; Meredith et al., Reference Meredith, MacNeil, Trasler and Baltz2016), which ensures a pool of folate for the folate cycle. Serine, which is the one-carbon donor to the folate cycle, is transiently transported into mouse oocytes during meiotic maturation (Zhang et al., Reference Zhang, McClatchie and Baltz2020) and therefore can supply one-carbon units to the folate cycle in oocytes. It has also been confirmed that methionine can be converted into SAM at all stages of oocytes and preimplantation embryos (Menezo et al., Reference Menezo, Khatchadourian, Gharib, Hamidi, Greenland and Sarda1989). Inhibiting the folate cycle with antifolates blocks preimplantation development (O’Neill, Reference O’Neill1998; Kwong et al., Reference Kwong, Adamiak, Gwynn, Singh and Sinclair2010; Ikeda et al., Reference Ikeda, Sugimoto and Kume2012b; Zhang et al., Reference Zhang, Denomme, White, Leung, Lee, Greene, Mann, Trasler and Baltz2015), as does inhibiting methionine metabolism (Menezo et al., Reference Menezo, Khatchadourian, Gharib, Hamidi, Greenland and Sarda1989; Patkin et al., Reference Patkin, Kustova and Perticone1998; Ikeda et al., Reference Ikeda, Sugimoto and Kume2012b). Finally, experimental knockdown of MAT, which converts methionine to SAM, results in impaired oocyte maturation (An et al., Reference An, Sun, Zhang, Lu, Peng, Xu, Zhang and Su2020). Therefore, the folate and methionine cycles are likely to be functionally and physiologically important in oocytes and preimplantation embryos.
SAM is used in a large array of biochemical reactions and ranks only behind ATP as the substrate for the greatest number of enzymes (Schubert et al., Reference Schubert, Blumenthal and Cheng2003; Loenen, Reference Loenen2006). The large majority of SAM is used for methyltransferase-mediated methylation reactions, while a minor amount is decarboxylated and mainly used for polyamine synthesis (Loenen, Reference Loenen2006) (Figure 1). Methyltransferases participate in a very large array of metabolic and signalling pathways, with genes encoding methyltransferases accounting for an estimated 1% of all genes in mammals (Katz et al., Reference Katz, Dlakić and Clarke2003). It is not known how many of the diverse methyltransferases are expressed and active in oocytes or preimplantation embryos, but one area that has been well studied is the role of methyltransferase reactions in establishing and maintaining epigenetic marks during oogenesis and preimplantation embryogenesis, largely through DNA methyltransferases and histone methyltransferases. During oogenesis, the oocyte acquires the epigenetic markers that characterize the female gamete (Sendžikaitė and Kelsey, Reference Sendžikaitė and Kelsey2019). Following fertilization, the epigenetic markers of both the male and female genetic material contributed by the sperm and egg, respectively, are erased (with some exceptions that include imprinted genes). Embryonic epigenetic markings are then globally established, probably starting in the inner cell mass of the blastocyst and continuing through the early postimplantation period (Smith et al., Reference Smith, Chan, Mikkelsen, Gu, Gnirke, Regev and Meissner2012; Zhang et al., Reference Zhang, Denomme, White, Leung, Lee, Greene, Mann, Trasler and Baltz2015; Eckersley-Maslin et al., Reference Eckersley-Maslin, Alda-Catalinas and Reik2018; Stäubli and Peters, Reference Stäubli and Peters2021).
Despite the key role of MTHFR in linking the folate and methionine cycles, its expression and regulation in oocytes and preimplantation embryos are largely unknown. In the bovine, knockdown of MTHFR expression in embryos impaired blastocyst development (Ishitani et al., Reference Ishitani, Ikeda, Egashira, Sugimoto, Kume, Minami and Ohta2020). Several studies have also found that activity-impairing polymorphisms in human MTHFR are correlated with increased aneuploidies and implantation failures (Enciso et al., Reference Enciso, Sarasa, Xanthopoulou, Bristow, Bowles, Fragouli, Delhanty and Wells2016; Zhu et al., Reference Zhu, Wu, Ye, Li, Zeng and Zhang2018). MTHFR expression has not been investigated in mouse oocytes or embryos, nor has its regulation during these stages been elucidated in any species.
MTHFR activity is regulated by phosphorylation of its N-terminal serine-rich region (Yamada et al., Reference Yamada, Strahler, Andrews and Matthews2005; Zhu et al., Reference Zhu, Xiahou, Zhao, Peng, Zhao and Xu2014; Froese et al., Reference Froese, Kopec, Rembeza, Bezerra, Oberholzer, Suormala, Lutz, Chalk, Borkowska, Baumgartner and Yue2018). The priming phosphorylation site is on a conserved threonine near the amino terminus with at least seven phosphate groups being added to the same region after the initiating threonine phosphorylation (Yamada et al., Reference Yamada, Strahler, Andrews and Matthews2005; Froese et al., Reference Froese, Kopec, Rembeza, Bezerra, Oberholzer, Suormala, Lutz, Chalk, Borkowska, Baumgartner and Yue2018). Phosphorylation of MTHFR inhibits its activity by increasing its susceptibility to allosteric inhibition by SAM (Yamada et al., Reference Yamada, Strahler, Andrews and Matthews2005; Froese et al., Reference Froese, Kopec, Rembeza, Bezerra, Oberholzer, Suormala, Lutz, Chalk, Borkowska, Baumgartner and Yue2018; Zheng et al., Reference Zheng, Ramsamooj, Li, Johnson, Yaron, Sharra and Cantley2019). Therefore, at a given intracellular SAM concentration, phosphorylation reduces MTHFR activity and inhibits SAM production by the methionine cycle (Yamada et al., Reference Yamada, Strahler, Andrews and Matthews2005).
Recently, a large-scale study of the metabolome of maturing mouse oocytes has been reported (Li et al., Reference Li, Zhu, Shu, Guo, Guan, Zeng, Wang, Han, Zhang, Liu, Li, Hou, Gao, Ge, Ren, Zhang, Schedl, Guo, Chen and Wang2020). One metabolite that changed significantly during meiotic maturation was SAM, which increased ∼2.5-fold within several hours of the GV oocyte’s release from meiotic arrest and then decreased to baseline again in mature MII eggs. A decrease in intracellular SAM as occurs in MII eggs should allosterically activate MTHFR to maintain SAM levels (Yamada et al., Reference Yamada, Strahler, Andrews and Matthews2005; Froese et al., Reference Froese, Kopec, Rembeza, Bezerra, Oberholzer, Suormala, Lutz, Chalk, Borkowska, Baumgartner and Yue2018; Zheng et al., Reference Zheng, Ramsamooj, Li, Johnson, Yaron, Sharra and Cantley2019), which apparently does not occur in MII eggs as SAM levels remained low. One possibility is that MTHFR activity is downregulated while oocytes mature. Because MTHFR activity has been shown to be regulated by phosphorylation, we have investigated here whether the phosphorylation status of MTHFR changes during the meiotic maturation of oocytes.
Materials and methods
Chemicals and culture medium
Chemicals and components of modified KSOM culture medium (Lawitts and Biggers, Reference Lawitts and Biggers1993) were obtained from Sigma-Aldrich (Oakville, ON, Canada) unless otherwise indicated. Modified KSOM consisted of NaCl (95 mM), KCl (2.5 mM), KH2PO4 (0.35 mM), MgSO4·7H2O (0.2 mM), Na lactate (10 mM), glucose (0.2 mM), Na pyruvate (0.2 mM), NaHCO3 (25 mM), CaCl2·2H2O (1.7 mM), tetra sodium EDTA (0.01 mM), K penicillin G (0.16 mM), and streptomycin SO4 (0.03 mM). The modifications from standard KSOM were that glutamine and bovine serum albumin (BSA) were omitted, and 1 mg/ml polyvinyl alcohol was added. Components of KSOM-based medium were embryo-tested or cell culture-tested grades. HEPES-KSOM was identical to modified KSOM except that NaHCO3 was reduced to 4 mM and 21 mM HEPES was added, with pH adjusted to 7.4 with NaOH. The SrCl2-containing medium for egg activation was identical to modified KSOM, except that CaCl2 was omitted and 10 mM SrCl2 was added. Minimal Essential Medium Alpha (MEMα) was obtained from Life Technologies (catalogue # 12561–056; Burlington, ON, Canada) and supplemented with 1 mg/ml polyvinyl alcohol.
Oocyte and embryo collection
All animal protocols were approved by the University of Ottawa Animal Care Committee and complied with Canadian Council on Animal Care regulations. Mice were maintained on a 12 h, light:dark cycle and had unrestricted access to water and Teklad Global 18% protein rodent diet 2018 (Envigo, Indianapolis, IN, USA). Oocytes and embryos were obtained from 5–8-week-old female CD1 mice (Charles River Canada, St. Constant, QC, Canada), essentially as previously described (Hogan et al., Reference Hogan, Beddington, Constantini and Lacy1994). Females were superovulated by intraperitoneal injection of 5 IU equine chorionic gonadotropin (eCG, Prospec, Sturgeon County, AB, Canada). For mature eggs and embryos, they were injected with 5 IU human chorionic gonadotropin (hCG, Prospec) 47 h post-eCG. For embryos, females were mated overnight with BDF1 males (Charles River) after hCG injection. GV oocytes were obtained 44–46 h post-eCG from ovaries that were minced in HEPES-KSOM to release cumulus–oocyte complexes; cumulus cells were removed by repeated pipetting. MII eggs were obtained 14–16 h post-hCG by flushing oviducts with HEPES-KSOM using a blunt-end syringe. Eggs were exposed for 1–2 min to 300 µg/ml hyaluronidase in HEPES-KSOM to remove the expanded cumulus matrix. Embryos were obtained from mated females by flushing oviducts (1-cell, 2-cell) or oviducts with the uterus attached (morulae, blastocysts) at the following times post-hCG: 21–24 h (1-cell), 42–44 h (2-cell), 76 h (morulae), and 93–94 h (blastocysts).
When specified, GV oocytes, liver, and kidney were obtained from mice from a line in which the Mthfr gene had been knocked out on a C57Bl/6 background as previously described (Chan et al., Reference Chan, Cushnie, Neaga, Lawrance, Rozen and Trasler2010; Lawrance et al., Reference Lawrance, Racine, Deng, Wang, Lachapelle and Rozen2011). Mthfr −/−, Mthfr +/−, and Mthfr +/+ genotypes were obtained from breeding pairs of heterozygotes.
In vitro oocyte maturation and egg activation
For in vitro maturation, GV oocytes were cultured under mineral oil (Sigma catalogue # M8410–1) in 50-µl drops of MEMα with 1 mg/ml polyvinyl alcohol added. Oocytes underwent spontaneous maturation when removed from the ovarian follicle and placed into culture. Isolation of the oocytes from the ovary was considered the start of maturation (t = 0). The medium was equilibrated with 5% CO2 in air at 37°C, 100% humidity. Oocytes were removed from culture at times post-isolation as indicated.
For egg activation, MII eggs were transferred to Ca2+-free KSOM containing 10 mM SrCl2. The beginning of the exposure to SrCl2 was considered the start of egg activation (t = 0). Activated eggs were removed from culture at the times post-initiation of activation indicated. The medium was equilibrated with 5% CO2 in air at 37°C, 100% humidity.
RT-PCR and q-RT-PCR
RNA was extracted from 50 oocytes, eggs, or embryos using the RNeasy Micro Kit (Qiagen, Toronto, Ontario, Canada, catalogue #74004) according to the manufacturer’s directions. For oocytes, eggs, and embryos, 20 ng of carrier RNA was added. RNA was reverse transcribed with random hexamers using the Superscript IV Kit (Invitrogen, Carlsbad, CA, catalogue #18091050) according to the manufacturer’s directions.
Primers for murine Mthfr were designed from reference sequence NM_001161798.1 for Mthfr variant 1 (Mthfra) and NM_010840.3 for Mthfr variant 2 (Mthfrb). The primer sequences for the region common to both isoforms were 5′-TGGCTACAGAGTAACCTGCC-3′ for the forward primer and 5′-GATGTGGTAGTTGACCCGCA-3′ for the reverse primer (283-bp amplicon). The primers for the Mthfra-specific region were 5′-TGGGCACTGTTATCCATCCC-3′ for the forward primer and 5′-AGTCCATTCTGCGCCTCATC-3′ for the reverse primer (251 bp amplicon). The primers for the Mthfrb-specific region were 5′-GCCACCGATCTGACGCAA-3′ for the forward primer and 5′-AACAGCTCCCTCAGCAGTTC-3′ for the reverse primer (253-bp amplicon).
For each conventional PCR reaction, cDNA equivalent to six oocytes, eggs, or embryos was used, which yielded easily visible bands. Conventional PCR was carried out using a Bio-Rad (Mississauga, ON) T100 thermocycler with 40 cycles of 95°C (20 s), 55°C (30 s), 72°C (30 s), followed by 10 min at 72°C. PCR products were visualized by 1.5% agarose gel electrophoresis with ethidium bromide. Ppia was used as a loading control with primers as previously described (Mamo et al., Reference Mamo, Gal, Bodo and Dinnyes2007). A subset of amplicons was confirmed by sequencing.
For qRT-PCR, total RNA was isolated using the Arcturus PicoPure RNA isolation system (Applied Biosystems, Foster City, CA catalogue #KIT0204) with on-column DNase digestion using the RNase-Free DNase Set (Qiagen, Toronto, Ontario, Canada, catalogue #79254). RNA was isolated from pools of 34 oocytes. Total RNA was reverse transcribed with Superscript IV Kit (Invitrogen, Carlsbad, CA, catalogue #18091050). The cDNA was diluted so that an equivalent of three oocytes per qPCR reaction was used as the template.
Quantitative reverse-transcription PCR was carried out on a 7500 FAST Real-Time system (Applied Biosystems, Foster City, CA). Reactions were carried out using the PowerUp SYBRGreen Master Mix (Applied Biosystems, Foster City, CA catalogue #A25742) with MicroAmp Fast optical 96-well reaction plates and Adhesive Film (Applied Biosystems, Foster City, CA catalogue #4346907 and #4311971). Identical primer sets to those described for conventional RT-PCR were used for the Mthfr common region, Mthfra, and Mthfrb. In addition, the following primers were designed to amplify a 150-bp segment of the transcript for the gene RNA guanine-7 methyltransferase (Rnmt), which was used as a control gene: Forward: 5′-TGCTCTTAAAACGAATGCAGGC-3′; Reverse: 5′- CTGACTTACTTAAGTTCCCAGAG-3′. Samples were loaded in duplicate wells, which were averaged for one independent repeat. The qPCR program was 50°C (2 min), followed by 95°C (10 min), followed by 35 cycles of 95°C (15 s), 60°C (15 s), and 72°C (1 min). Following amplification, a melt curve from 60–95°C was performed to confirm the presence of a single PCR product. RNA abundance in oocytes was calculated by absolute quantification using a standard curve of known cDNA concentration (1:10 serial dilution from 1000 fg to 0.01 fg) obtained from mouse liver for each primer set. The standard curve was run adjacent to oocyte samples on each independent repeat and was also used to calculate the amplification efficiency of each primer set (acceptable range within 90–110%). In total, N = 3 independent biological repeats were performed.
Western blots
GV oocytes, eggs, or embryos were collected as described above with a minimal amount of medium and 2 µl RIPA lysis buffer (Thermo Fisher, Waltham, MA) was added. They were then frozen at −80°C until use. After thawing, sample volumes were equalized with additional RIPA buffer and then mixed with the appropriate amount of 2× or 4× Laemmli buffer with 2-mercaptoethaanol and boiled for 5 min. Samples were loaded onto 10% sodium dodecyl sulphate-polyacrylamide gel electrophoresis (SDS-PAGE) gels. Initially, proteins were separated at 70 V for 4 h. Subsequently, to obtain better separation of closely spaced bands, gels were run for 6 h. Precision Plus Protein Kaleidoscope molecular weight ladders (Bio-Rad) were used. Protein was transferred to a polyvinylidene difluoride (PVDF) membrane (Millipore cat. no. IPVH00010, pore size 0.45 μm) overnight at 4°C at 15 V. The membrane was blocked with 5% milk powder for 1 h at room temperature.
Except when otherwise specified, MTHFR was detected with 1:1000 Abcam (Cambridge, MA) recombinant anti-MTHFR rabbit monoclonal antibody (catalogue # ab203786) in 5% milk powder. Membranes were incubated overnight at 4°C. They were then washed three times (10 min each) with Tris-buffered saline with Tween 20 (TBST) and then incubated in 1:5000 goat anti-rabbit IgG, HRP-linked antibody (Cell Signaling Technology, Danvers, MA, catalogue #7074S) in 5% milk powder for 1 h at room temperature. After three washes (10 min each), the membrane was imaged using an ECL Prime Detection kit (GE Healthcare, Mississauga, ON, Canada) and HyBlot CL autoradiography film (Harvard Apparatus Canada, Saint-Laurent, QC, catalogue #DV-E3018). After MTHFR was detected, membranes were re-washed and incubated overnight at 4°C with antibodies against proteins used as loading controls. For gels separated for 4 h when specified, 1:200 anti-GAPDH (Santa Cruz, Dallas, TX, catalogue #sc-25778) was used, while for those separated for 6 h (where GAPDH would not generally be retained on the gel due to its lower molecular weight of ∼37 kDa), 1:1000 anti-vinculin (∼125 kDa) antibody (Abcam catalogue #ab129002) was used, each in 5% milk. GAPDH was detected with Clarity Western ECL Substrate, whereas vinculin was detected using ECL Prime (Bio-Rad).
For one set of western blots, MTHFR was detected using anti-porcine liver MTHFR rabbit polyclonal antibody that was a gift from Rima Rozen’s laboratory (McGill University, Montréal, QC, Canada) and which has been previously described (Frosst et al., Reference Frosst, Blom, Milos, Goyette, Sheppard, Matthews, Boers, den Heijer, Kluijtmans, van den Heuvel and Rozen1995; Christensen et al., Reference Christensen, Mikael, Leung, Lévesque, Deng, Wu, Malysheva, Best, Caudill, Greene and Rozen2015). These were run on 12% acrylamide SDS-PAGE. This antibody was used at 1:500 in 5% milk powder and otherwise treated as described above.
When tissue samples were run, fresh mouse liver was placed into RIPA lysis buffer with 5 µg/ml aprotinin and 1 mM PMSF on ice for 15 min, subjected to three or four freeze–thaw cycles using liquid nitrogen and warm water, and then homogenized. Homogenates were centrifuged at ∼15,000 g for 10 min at 4°C (Eppendorf model 5810). The supernatants were collected and protein concentration determined by DC Protein Assay (Bio-Rad).
Films were scanned using an Epson Photo 4990 scanner in transparency mode. Images were saved as 8-bit grayscale TIFF images at 1200 dpi. Images were adjusted to horizontal using the rotate function in FIJI ImageJ 1.53c software (Schindelin et al., Reference Schindelin, Arganda-Carreras, Frise, Kaynig, Longair, Pietzsch, Preibisch, Rueden, Saalfeld, Schmid, Tinevez, White, Hartenstein, Eliceiri, Tomancak and Cardona2012). All quantitative measurements were done on the original scan after adjustment to the horizontal. For figures, images were then cropped and brightness and contrast adjusted for optimal visualization. Original scans before rotation, brightness and contrast adjustment, or cropping are provided as supplementary figures.
Integrated band density was determined using FIJI ImageJ software. Bands or closely spaced sets of bands were enclosed by a rectangle and the mean grey value from 0–255 determined using the ImageJ ‘analyze/measure’ function. Density was calculated by subtracting the grey value from 255. Background was obtained away from the bands and subtracted from each measurement to obtain the density above background. To permit quantitative analyses, densities were normalized within each independent repeat to the value from a specified lane on that repeat.
To produce density profiles of lanes, the positions of molecular weight (MW) markers (200, 150, 100, 75, 50 kDa) were first determined using the Plot Profile function in FIJI ImageJ software and their vertical distance from the 200 kDa marker plotted as a function of log10 MW and fitted by linear regression (Prism 9, GraphPad Software, San Diego, CA; R2 was >0.96 for each regression). The Plot Profile function was used to obtain the density profile of each lane, using a rectangular selection 32 pixels in width. The MW marker regression parameters were then used to convert distance in pixels to MW. When indicated, ΔMW, the MW relative to a specified reference MW (e.g. the peak in an untreated or baseline sample) was plotted.
Phosphatase treatment
Lambda protein phosphatase (LPP) was used for protein dephosphorylation (New England BioLabs, Ipswich, MA, catalogue #P0753S). Oocytes and embryos were stored frozen. After thawing, RIPA buffer was added to equalize the total volumes in each sample. One-tenth of the final volume of 10× MnCl2 and 10× PMP buffer (supplied by manufacturer) was added. Each sample was divided in half. LPP (300 units) in water was added to the LPP-treated half and an equal volume of water was added to the paired control. Samples were incubated for 1 h at 30°C (temperature specified by manufacturer) with or without LPP.
In silico determination of transcript expression
RNA-seq data sets from nine separate studies were downloaded by the Ottawa Bioinformatics Core Facility from the Gene Expression Omnibus (https://www.ncbi.nlm.nih.gov/geo), These contained data for mouse GV oocytes, MII eggs, and preimplantation embryos from 1-cell to blastocyst stages (115 data sets in total). These were mapped to the mouse genome (GENCODE mouse release vM25) using salmon (https://combine-lab.github.io/salmon/). Only data sets with ≥5 million mapped reads were retained, yielding 93 samples in total for GV oocytes (N = 14 samples), MII eggs (N = 14), 1-cell embryos (N = 16), 2-cell embryos (N = 10), 4-cell embryos (N = 11), 8-cell embryos (N = 10), morulae (N = 10), and blastocysts (N = 8) as listed in Supplementary Table S1. Mapped transcripts were expressed for each sample as transcripts per million (TPM). Transcript expression profiles for Mthfr (mapped to Ensembl gene ID ENSMUSG00000029009), Rnmt (ENSMUSG00000009535), used as a control gene, and the folate/methionine cycle enzymes Shmt1, Shmt2, Mtr, Mat1a, Mat2a, Mat2b, Ahcy (Figure 1), and Bhmt were extracted from these data.
Data analysis
Data were graphed and analyzed using Prism 9 software. When error bars are shown, they represent the standard error of the mean (SEM). Differences between means were tested by one-way analysis of variance (ANOVA) with Tukey’s multiple comparison test. A two-tailed, one-sample t-test was used to test for difference between a measured mean and zero. A P-value < 0.05 was considered significant.
All data generated or analyzed during this study are included in this published article and its supplementary information files. The original data sets that were reanalyzed during the current study are available in the Gene Expression Omnibus (https://www.ncbi.nlm.nih.gov/geo).
Results
Mthfr transcript expression in oocytes and preimplantation embryos
Mthfr transcripts were detected by conventional RT-PCR in GV oocytes, MII eggs, 2-cell embryos, and blastocysts (Figure 2A). In the mouse, two isoforms of the MTHFR protein, MTHFRa and MTHFRb, are transcribed from alternate splicing of exon 1. These encode proteins with predicted MWs of 77 kDa for MTHFRa and 70 kDa for MTHFRb (Tran et al., Reference Tran, Leclerc, Chan, Pai, Hiou-Tim, Wu, Goyette, Artigas, Milos and Rozen2002). The transcripts for each isoform could be amplified by RT-PCR primers that were designed to specifically amplify Mthfra and Mthfrb transcripts (Figure 2A). Ppia was used as a loading control.
Expression of Mthfr transcripts in oocytes, eggs, and preimplantation embryos. (A) RT-PCR of Mthfr was carried out with 40 cycles of amplification on cDNA equivalent to six GV oocytes, MII eggs, 2-cell embryos (2c), or blastocysts (Bl). Negative controls had no cDNA added (−). Amplicons were detected for the portion of Mthfr common to both major isoforms and each of Mthfr a and b isoforms. Ppia was used as a loading control. The examples shown were cropped from different regions of the image of the same gel. Therefore, some of the marker lanes appear in more than one cropped image. Brightness and contrast were adjusted on the entire image before cropping individual images. The example shown is one of two similar independent repeats. (B) Mthfr transcript expression was calculated from RNA-seq data sets, with 8–16 data sets used at each stage. Each bar represents the mean expression in TPM ± SEM. The complete list of data sets and expression data are found in Supplementary Table S2. Means that are significantly different by ANOVA with Tukey’s multiple comparison test do not share letters. Rnmt expression was similarly determined and represents an example of a gene with minimal variation from GV oocytes through blastocysts. (C) Quantitative RT-PCR was used to measure expression of Mthfr, Mthfra, Mthfrb, and Rnmt in GV oocytes, MII eggs, 2-cell embryos (2c), or blastocysts (Bl). Each reaction contained cDNA from the equivalent of three oocytes, eggs, or embryos. Each bar represents the mean ± SEM of three independent repeats with individual values as indicated. Because of the limited region that differs between the a and b isoforms, optimal primers could not be designed, which may account for the lower total amount of amplicons produced. Means that are significantly different by ANOVA with Tukey’s multiple comparison test do not share letters. (D) Mthfr expression was normalized by Rnmt by calculating the ratio using the data in panel (C). The ratio was plotted on a log2 scale to allow comparison with the RNA-seq expression shown in panel (B). Means that are significantly different by ANOVA with Tukey’s multiple comparison test do not share letters. (E) Transcript levels were calculated for the enzymes required for SAM production in the folate and methionine cycles (Figure 1) using the RNA-seq data sets as in (B). Transcripts for the two serine hydroxymethyltransferase isoforms (Shmt1 and Shmt2), methionine synthase (Mtr), the three methionine adenosyltransferase isoforms (Mat1a and Mat2a,/Mat2b), and adenosylhomocysteinase (Ahcy) were all present, as was the parallel mechanism for homocysteine remethylation, betaine-homocysteine methyltransferase (Bhmt). Graphing and statistical analysis were as described in (B). The complete list of data sets and expression data are found in Supplementary Table S2.

To obtain a quantitative measure of Mthfr, we next calculated its relative expression from the RNA-seq data sets in Supplemental Table S1. The extracted data are listed in Supplementary Table S2. This indicated that Mthfr transcripts, expressed as a proportion of total transcripts at each stage (TPM), are present at lower levels from the GV through 1-cell stages and then at higher levels from the 2-cell through blastocyst stages (Figure 2B). We then performed q-RT-PCR, which quantifies absolute rather than proportional transcript levels. By this measure, total Mthfr remained essentially constant in GV oocytes, MII eggs, and 2-cell embryos and then increased by approximately three-fold in blastocysts (Figure 2C). Because of the limited regions of Mthfr transcript that differed between Mthfra and Mthfb, efficient primers could not be designed. Using the best primers that we identified in preliminary experiments, no statistically significant differences were detected between stages for either isoform.
For total Mthfr, the general pattern of low expression in GV oocytes and MII eggs, and higher expression in blastocysts was consistent between the RNA-seq and qRT-PCR data, but the expression at the 2-cell stage was discrepant. We hypothesized that this might be due to the fundamental difference between RNA-seq, which quantifies transcripts as a proportion of total mRNA, and qRT-PCR, which provides a measure of the absolute amount of transcript. We chose Rnmt as a control gene for RNA-seq because it is among the few transcripts that change minimally from the GV through blastocyst stages for RNA-seq (Figure 2B). However, when measured by qRT-PCR, Rnmt instead changed significantly, reaching a minimum at the 2-cell stage before rebounding in the blastocyst (Figure 2C), consistent with the amount of total mRNA being low in 2-cell embryos. Because of its essentially constant expression by RNA-seq, Rnmt can be used for normalization of qRT-PCR data to total mRNA. Therefore, we divided Mthfr expression by Rnmt expression, as measured by qRT-PCR (Figure 2D). This yielded a similar pattern to Mthfr expression measured by RNA-seq at the same stages. Together, this is consistent with Mthfr transcript being present in GV oocytes and MII eggs, decreasing in absolute level but constituting a higher proportion of total mRNA at the 2-cell stage, and then increasing in absolute terms after the 2-cell stage.
We also used the RNA-seq data sets to examine the expression of the other enzymes in the folate and methionine cycles that are crucial for SAM production, the SHMT isoforms Shmt1, and Shmt2, Mtr, the MAT isoforms Mat1a, Mat2a, and Mat2b, and Ahcy (Figure 1). The extracted data for these genes are in Supplementary Table S2. All transcripts were expressed in oocytes and/or preimplantation embryos (Figure 2E). In addition, expression of mRNA for BHMT, which can recycle homocysteine to methionine such as MTR but is active only in blastocysts (Lee et al., Reference Lee, Kooistra, Zhang, Slow, Fortier, Garrow, Lever, Trasler and Baltz2012), was confirmed.
MTHFR protein expression in oocytes and preimplantation embryos
To detect MTHFR protein, we tested several commercially available antibodies for specificity (not shown). We found that Abcam rabbit monoclonal anti-MTHFR (#203786) produced a set of closely spaced bands at the expected size of ∼75 kDa using mouse liver lysate (Figure 3A). They were present in Mthfr wild-type liver lysate, at lesser intensity in lysate from Mthfr heterozygous knockout liver (∼25%), and absent from Mthfr homozygous knockout liver (Figure 3A, B). A non-specific band also appeared below 50 kDa that did not interfere with MTHFR detection (Figure S1). We then tested whether bands corresponding to MTHFR appeared in mouse GV oocytes using lysates from 100, 75, 45, 25, and 10 oocytes, which revealed a band in GV oocytes near the size obtained with liver lysate (Figure 3C). The intensity of the MTHFR band varied approximately linearly with number of oocytes from 25–100 oocytes, while no band was detected with 10 oocytes using our protocols (Figure 3C, D). Further experiments were primarily done using 75 oocytes, eggs, or embryos per lane. Finally, we confirmed that the presumed MTHFR band was absent from GV stage oocytes obtained from Mthfr knockout female mice (Figure 3E).
Antibody validation. (A) Recombinant anti-MTHFR rabbit monoclonal antibody (Abcam catalogue # ab203786, 1:1000) was used. Liver homogenate was obtained from Mthfr wild type (+/+), heterozygous (+/−) or null (−/−) mice and 5 µg per lane was separated by PAGE. A set of bands near 75 kDa that reacted with anti-MTHFR antibody was apparent in the wild-type lane. They were present but lighter in heterozygotes and not detectable in the knockout liver lane. The membrane was re-probed with anti-vinculin antibody (Abcam, 1:1000) as a loading control. The example shown is one of three similar western blots (Figure S1). (B) MTHFR band density were quantified from the three independent repeats (Figure S1) using the measure function in ImageJ software. Background was subtracted and density measurements were normalized to wild-type on the same gel, which was arbitrarily set to 1. The shape of the symbol indicates measurements from the same repeat (circle, repeat 1; square, repeat 2; triangle, repeat 3). Different letters indicate significant difference (P < 0.01 by ANOVA with Tukey’s multiple comparison test). Liver samples showed a non-specific band with the MTHFR antibody below 50 kDa (Figure S1), but no non-specific bands were evident above 50 kDa. (C) MTHFR was probed in 10–100 GV oocytes as indicated. Liver (5 µg) was run for comparison. Unlike in liver, no bands other than the ones near 75 kDa were visible (Figure S2). (D) Band densities for GV oocytes on the blot shown in (C) were quantified as described in (B) and normalized to the density for 100 GV oocytes (set to 1). Density increased approximately linearly with number of GV oocytes. The line was fit by least square regression. (E) GV oocytes were obtained from Mthfr wild type (+/+) and knockout (−/−) female mice. Each lane contained lysate from 25 GV oocytes. Membranes were probed with anti-MTHFR and then re-probed with anti-GAPDH as indicated. No MTHFR band was visible in the lane with Mthfr knockout oocytes. The protocol was modified, using a 1 h PAGE separation and 70 min transfer. The complete scan is shown in Figure S3.

We determined the expression of MTHFR protein at stages ranging from GV oocytes to blastocysts and found that MTHFR was present at all stages tested (Figure 4A). Notably, there was an upward shift in the bands to higher apparent MW in mature MII eggs that persisted variably into 1-cell stage embryos before returning to the lower size at the 2-cell stage and beyond. Quantifying band density as a function of apparent MW showed that a closely spaced doublet (which could not always be resolved) appeared in MII eggs. The increase in apparent MW was ∼1–3 kDa (Figure 4B).
MTHFR in GV oocytes, MII eggs and preimplantation embryos. (A) Monoclonal rabbit anti-MTHFR (Abcam) was used to determine MTHFR expression in GV oocytes, MII eggs, 1-cell embryos (1c), 2-cell embryos (2c), morulae (M), and blastocysts (Bl) in three independent repeats. Each lane contained lysate from 75 oocytes, eggs, or embryos. Proteins were separated for 4 h by PAGE. GAPDH was used as a loading control. Original scans are shown in supplemental Figure S6. (B) Density as a function of apparent MW was determined for each stage in the western blots shown in (A). A shift upwards towards higher MW was evident from the GV to MII stages, which persisted variably into the 1-cell stage and then decreased in subsequent preimplantation stages. (C) MTHFR was detected using a polyclonal rabbit anti-MTHFR antibody (produced by Dr. Rima Rozen’s laboratory) in three independent repeats. A similar upward shift of the MTHFR band was apparent from the GV to MII stages. Each lane contained lysate from 50 oocytes, eggs, or embryos. Original scans are shown in Figure S7.

We had previously used an anti-MTHFR polyclonal antibody (Frosst et al., Reference Frosst, Blom, Milos, Goyette, Sheppard, Matthews, Boers, den Heijer, Kluijtmans, van den Heuvel and Rozen1995; Christensen et al., Reference Christensen, Mikael, Leung, Lévesque, Deng, Wu, Malysheva, Best, Caudill, Greene and Rozen2015) produced by the laboratory of Dr. Rima Rozen (McGill University) to assess the same stages. We confirmed that the putative ∼75 kDa MTHFR bands were also absent from tissues and GV oocytes of Mthfr knockout mice when using this antibody (Figures S4 and S5). This antibody similarly revealed an apparent increase in MW at the MII stage (Figure 4C). Therefore, MTHFR migrated at an apparently higher MW in MII eggs than in GV oocytes or in later preimplantation embryos.
MTHFR phosphorylation
It has previously been reported that MTHFR is regulated by phosphorylation and that this phosphorylation causes MTHFR to run at an apparently higher MW in western blots (Yamada et al., Reference Yamada, Strahler, Andrews and Matthews2005; Christensen et al., Reference Christensen, Mikael, Leung, Lévesque, Deng, Wu, Malysheva, Best, Caudill, Greene and Rozen2015; Zheng et al., Reference Zheng, Ramsamooj, Li, Johnson, Yaron, Sharra and Cantley2019). Therefore, we investigated whether the upward shift of MTHFR observed between GV oocytes and MII eggs was the result of phosphorylation. Phosphospecific antibodies against MTHFR are not available, but protein phosphatase treatment has previously been used to establish that MTHFR is regulated by phosphorylation (Yamada et al., Reference Yamada, Strahler, Andrews and Matthews2005; Christensen et al., Reference Christensen, Mikael, Leung, Lévesque, Deng, Wu, Malysheva, Best, Caudill, Greene and Rozen2015; Zheng et al., Reference Zheng, Ramsamooj, Li, Johnson, Yaron, Sharra and Cantley2019). Therefore, we used LPP to investigate whether MTHFR becomes phosphorylated in mouse eggs. When lysates of MII eggs and GV oocytes were treated with LPP, the phosphatase had no detectable effect on MTHFR from GV oocytes, but caused a downward shift in MTHFR from MII eggs (Figure 5A). Densitometry revealed that the major band in GV oocytes migrated at essentially the same position, whether the oocyte lysate had been treated with LPP or not (Figure 5B). However, the major MTHFR band in untreated MII eggs migrated more slowly than MTHFR from GV oocytes. With LPP treatment, MTHFR in MII eggs returned to approximately the same position as MTHFR from GV oocytes (Figure 5A, B). When quantified, the mean positions of the mid-peaks were not significantly different between GV oocytes with or without LPP treatment and MII eggs with LPP treatment, but the mean position of the major peak in untreated MII eggs was significantly higher, by ∼2.4 kDa (Figure 5C). Similar to GV oocytes, LPP treatment had no detectable effect on MTHFR from 2-cell embryos or blastocysts (Figure 5D). Therefore, MTHFR is apparently more highly phosphorylated in MII eggs than in GV oocytes, 2-cell embryos, or blastocysts. The band that was sensitive to LPP treatment was the major band in GV oocytes. This band is close to the predicted MW for MTHFR isoform b (70 kDa). Minor bands were present above this that were not sensitive to phosphatase treatment, with the highest lying near the predicted MW of MTHFR isoform a (77 kDa) and possibly reflecting some protein expression of this isoform.
Lambda protein phosphatase (LPP) treatment of GV oocytes and MII eggs. (A) GV oocytes or MII eggs were lysed and the lysate divided in half. LPP (300 units dissolved in water) was added to half (+) and water only (−) to the other half. MTHFR was detected on western blots probed with anti-MTHFR antibody (Abcam). Vinculin was used as a loading control. LPP had no apparent effect on GV oocytes but the upward-shifted bands in MII eggs were shifted back down with LPP treatment. Three independent repeats (indicated at top) were done with 75 oocytes or eggs per lane. Original scans are shown in Figure S8. (B) Density vs. MW was determined for each lane in the western blots shown in (A) and expressed as ΔMW, MW relative to the peak in GV oocytes in the same repeat (ΔMW = 0, indicated by dashed line in each plot). The closely spaced doublet of bands in MII eggs could not be completely resolved in the densitometric plots but appeared to represent upward shifts equivalent to ∼2.5 and ∼5 kDa. (C) The highest point of the lowest major band at each stage (indicated by an asterisk in (C)) was determined and ΔMW plotted for GV oocytes and MII eggs with and without LPP. Individual values are shown for repeats 1 (circles), 2 (squares) and 3 (triangles). The horizontal line indicates the mean. Means that do not share the same letter are significantly different (ANOVA with Tukey’s multiple comparison test (P < 0.001 for all pairwise comparisons not sharing a letter). (D) Two-cell embryos (2c) and blastocysts (Bl) were treated with LPP as in (A). LPP treatment had no apparent effect. Three independent repeats were performed with 75 embryos per lane. Labels are similar to (A). Original scans are shown in Figure S9.

Time course of MTHFR phosphorylation in oocytes
The results above implied that MTHFR becomes phosphorylated during meiotic maturation of the oocyte prior to its ovulation as a mature MII egg. To further investigate this, we isolated GV oocytes and placed them in culture, where they spontaneously exited GV arrest and proceeded through meiotic maturation. In vitro-maturing oocytes were collected at 0, 6, and 20 h at the GV, MI and MII stages, respectively. MTHFR from MI oocytes at 6 h exhibited an upward shift relative to MTHFR from GV oocytes, indicating that the extent of phosphorylation had increased (Figure 6A). However, there was a further upward shift from MI oocytes to MII eggs collected at 20 h (Figure 6A), recapitulating the pattern seen in MII eggs obtained after in vivo maturation (Figure 4). Therefore, MTHFR phosphorylation appears to take place in at least two stages (Figure 6). The first is reflected by an upward shift that occurs in MI oocytes by 6 h after GV oocytes had been released from meiotic arrest. The second takes place subsequently, resulting in the two higher bands detected in MII eggs. These latter bands lie ∼2.5–3.5 and 5–6 kDa above the major band in GV oocytes (Figure 6B).
Phosphorylation of MTHFR during meiotic maturation. (A) GV oocytes, MI oocytes, and MII eggs were collected fresh (GV), after 6 h culture (MI), or after 20 h (MII). Three independent repeats (as indicated) of western blots were performed with 75 oocytes or eggs per lane. The apparent MW had shifted upwards by 6 h and further by 20 h, indicating at least two phases of MTHFR phosphorylation. Original scans are shown in Figure S10. (B) Density vs. MW was determined for each lane in the western blots shown in (A) and expressed as ΔMW. The position of the major peak in GV oocytes (ΔMW = 0) and the two peaks in MII eggs for each independent repeat are indicated by dashed lines in each plot.

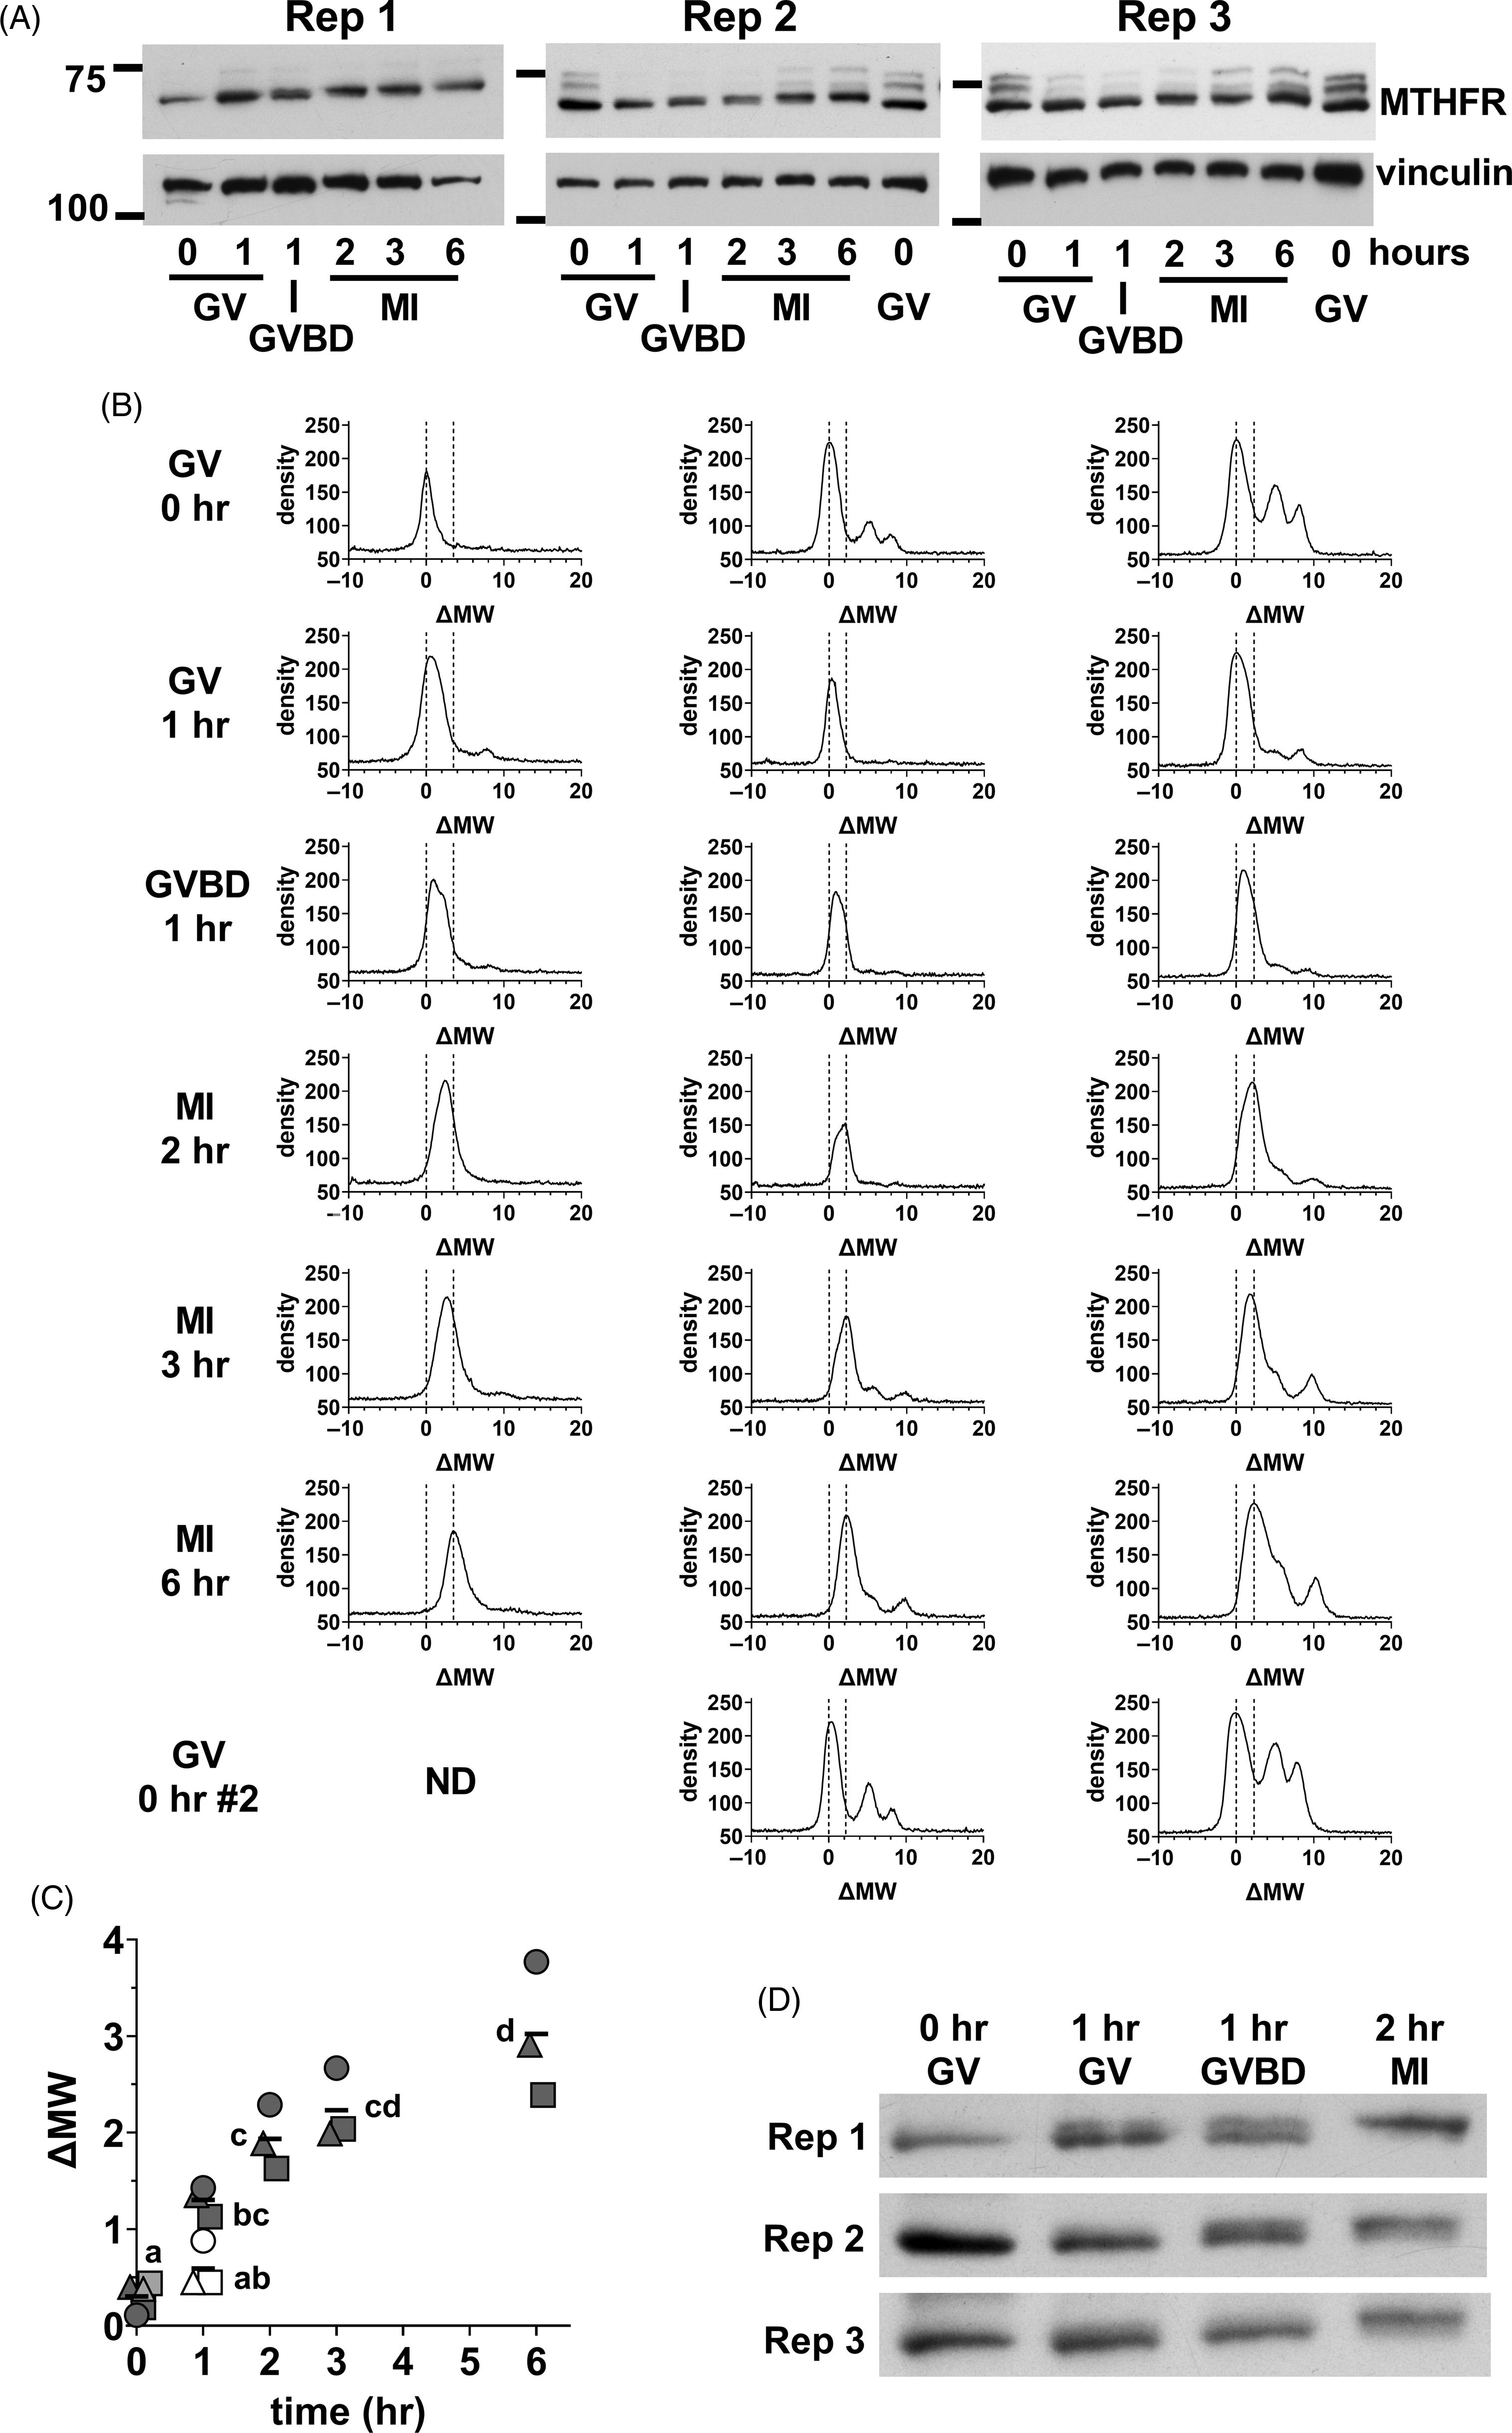
We next focused on the initial stages of MTHFR phosphorylation in oocytes. Oocyte lysate was prepared from GV oocytes (0 h), and oocytes at 1, 2, 3, and 6 h. At 1 h, there was a mix of oocytes still at the GV stage and those that had undergone germinal vesicle breakdown (GVBD) in which the nuclear envelope was absent that were separated. MI oocytes were collected at 2, 3 and 6 h. A progressive increase in apparent MW was evident from GV oocytes to MI oocytes at 6 h (Figure 7A). Densitometric scans indicated that the position of the major peak was similar in GV oocytes at 0 or 1 h, but that the peak had tended towards higher MW in oocytes that had undergone GVBD at 1 h (Figure 7B). The upward shift had further progressed in MI oocytes after 2–6 h of in vitro maturation. The shifts undergone by the peaks were quantified by calculating the midpoint of the peak at half-height above background and expressing this relative to the position in GV oocytes at t = 0 (ΔMW; Figure 7C), which confirmed the increase in apparent MW. A shorter exposure of the same western blots revealed that the initial upward shift was likely to be the result of the appearance of a higher band and loss of the lower band present in GV oocytes (Figure 7D). This appeared to be initiated near the time of GVBD, with the upper band more prominent in oocytes that had undergone GVBD and dominant in MI oocytes by 2 h.
Initial MTHFR phosphorylation during meiotic maturation. (A) Oocytes were collected during in vitro maturation at 0, 1, 2, 3, and 6 h. Oocytes were at the GV stage at 0 h. At 1 h, there was a mix of GV and GVBD oocytes. At 2–6 h, MI oocytes were present. Three independent repeats (as indicated) of western blots for MTHFR (Abcam antibody) were done with 75 oocytes per lane (time and stage indicated at bottom). Vinculin was used a loading control. The positions of the 75 and 100 kDa markers are indicated on the left. In repeats 2 and 3, a second set of GV oocytes (0 h) was included as the last lane to facilitate visualization of the upward shift of the MTHFR band. Original scans are shown in Figure S11. (B) Density vs. MW was determined for each lane in the western blots shown in (A) and expressed as ΔMW. Oocyte stage and time are indicated at the left. The position of the major peak in GV oocytes (ΔMW = 0) and the two peaks in MII eggs for each independent repeat are indicated by dashed lines in each plot. (C) The position of MTHFR bands were quantified by calculating the half-height of the major band (midway between peak and background) and determining the centre of the band at that height at each stage for the three repeats. Individual values are shown for repeats 1 (circles), 2 (squares) and 3 (triangles). The horizontal line indicates the mean. GV and GVBD oocytes were plotted separately at 1 h (GV = open symbols, GVBD = filled symbols). At t = 0, the symbols for the two samples run in the final lane in repeats 2 and 3 are shown filled with light grey. Some symbols have been displaced horizontally for visibility. Means that do not share the same letter are significantly different (ANOVA with Tukey’s multiple comparison test; P < 0.001 for all pairwise comparisons, except MI 2 h vs. GV 1 h, P < 0.01 and GV 0 h vs. GVBD 1 h and MI 2 h vs. MI 6 h, P < 0.05). (D) Substantially shorter exposure times were used for the MTHFR western blots shown in (A), which revealed two apparently distinct bands with a shift occurring from the lower band in GV oocytes to the upper band in MI oocytes. Original scans are shown in Figure S11 (scans of blots re-probed for vinculin).
MTHFR dephosphorylation after egg activation
As the MTHFR phosphorylation in MII eggs is apparently lost by the 1- to 2-cell stage, dephosphorylation must occur after egg activation. To visualize this, MII eggs were parthenogenetically activated using SrCl2. Timepoints from 0–60 min after the initiation of SrCl2 exposure showed that, by 15 min after the initial exposure to SrCl2, the higher bands in MII eggs were no longer visible and instead a single band was present that was somewhat lower than the most prominent band in MII eggs (Figure 8A, B). By 60 min, MTHFR had an apparent ΔMW of −2.7 ± 0.2 kDa (mean ± SEM; P = 0.007 by 1-sample t-test). This is similar to the shift observed in MII eggs after treatment with LPP (Figure 5C). We also assessed activated eggs at longer intervals after activation (2–24 h), which did not reveal further obvious changes (Figure S13). Therefore, after parthenogenetic egg activation, the higher bands present in MII eggs had rapidly disappeared.
Apparent decreased phosphorylation following MII egg activation. (A) MII eggs were collected at 0, 15, 30 and 60 min after the initiation of parthenogenetic activation using 10 mM SrCl2 in Ca2+-free KSOM medium. Three independent repeats (as indicated) of western blots for MTHFR (Abcam antibody) were carried out with 75 eggs per lane (time indicated at bottom). The position of the 75 kDa marker is indicated at right. Original scans are shown in Figure S12. (B) Density vs. MW was determined for each lane in the western blots shown in (A) and expressed as ΔMW. The time point is indicated at the left. The position of the major peak in MII eggs (ΔMW = 0) and the peak at 60 min for each independent repeat are indicated by dashed lines in each plot. The shifts (i.e. distance between dashed lines) were −2.95, −3.00, and −2.28 kDa for repeats 1, 2, and 3, respectively.

Discussion
Mthfr transcripts were present in mouse oocytes and embryos at all stages that were assessed. Those detected in oocytes are necessarily maternal transcripts. At the 2-cell stage, when most maternal transcripts have been degraded and widespread transcription from the embryonic genome commences in mouse (Vastenhouw et al., Reference Vastenhouw, Cao and Lipshitz2019), the absolute level of Mthfr transcripts decreased but apparently constituted a larger proportion of the total transcripts present at that stage than at earlier stages. Subsequently, Mthfr must have been transcribed from the embryonic genome, as transcript levels markedly increased. MTHFR protein was present in oocytes and eggs and in mouse embryos at the 1-cell, 2-cell, morula and blastocyst stages. MTHFR protein was present in GV oocytes, implying that MTHFR was synthesized during oogenesis. Unlike Mthfr transcripts, there was no substantial increase in the MTHFR protein after the 2-cell stage. This may indicate that Mthfr transcripts are accumulated for translation after implantation.
MTHFR alone is not sufficient to produce SAM in the absence of functional folate and methionine cycles. All the genes assessed here, including Mthfr, were also previously detected by non-quantitative conventional PCR in bovine oocytes and preimplantation embryos (Ikeda et al., Reference Ikeda, Namekawa, Sugimoto and Kume2010; Kwong et al., Reference Kwong, Adamiak, Gwynn, Singh and Sinclair2010), but they had not been assessed in mouse nor quantified. Therefore, we used the RNA-seq data sets to determine the expression of the other crucial enzymes shown in Figure 1 and found that mRNAs for all were expressed in least at some stages of mouse oocyte or preimplantation embryo (Figure 2E). SHMT is encoded by two different genes, Shmt1 that encodes cytosolic SHMT1 and Shmt2 that encodes mitochondrial SHMT2 (Tramonti et al., Reference Tramonti, Nardella, di Salvo, Barile, Cutruzzolà and Contestabile2018). SHMT2 was apparently maternally expressed and present in mouse oocytes, while SHMT1 was only expressed after the activation of the embryonic genome at the 2-cell stage. There are three homologues of MAT. Mat1a encodes MATα1 and Mat2a encodes MATα2, both of which are active enzymes, while Mat2b encodes a regulatory subunit, MATβ, that complexes with MATα2 (Murray et al., Reference Murray, Barbier-Torres, Fan, Mato and Lu2019). In mouse embryos, Mat1a and Mat2b appear to be maternally expressed in oocytes (although Mat1a is expressed at a lower level) while Mat2a shows mainly zygotic expression in embryos. A similar pattern of Mat1a and Mat2b expression has been previously reported (Sun et al., Reference Sun, Kang, Su, Zhang, Zhang, Liu, Zhang, Wang, Lu, Xing, Chen and Zhang2019). Both of the enzymes that have only one isoform, Ahcy and Mtr, are expressed throughout and exhibit both maternal and embryonic expression of their mRNAs. Therefore, at least at the transcript level, the components of functional coupled folate and methionine cycles appear to be expressed in mouse oocytes and preimplantation embryos. It remains to be determined when the proteins encoded by these transcripts are present and these enzymes are active. BHMT, like MTR, catalyzes the remethylation of homocysteine to methionine, but so far has been found to be active only in liver and blastocysts, in contrast with the essentially ubiquitous folate cycle. Data from the RNA-seq data sets confirmed our previous finding that the Bhmt transcript is expressed only in late preimplantation embryos, peaking at the morula stage (Lee et al., Reference Lee, Kooistra, Zhang, Slow, Fortier, Garrow, Lever, Trasler and Baltz2012).
MTHFR exists in two isoforms in mice, MTHFRa (variant 1) and MTHFRb (variant 2). The major isoform present in mouse oocytes and embryos is more likely to be MTHFRb. Mthfrb transcripts were expressed at a somewhat higher level when measured by q-RT-PCR. This, however, was not considered conclusive, as Mthfra transcripts were not absent and the range of possible isoform-specific primers was limited to a very small stretch of sequence, so that optimal primers could not be designed. Therefore, the total amount of the two transcripts did not add up to the total obtained using the primers to the common region, probably indicating that the isoform-specific primers were inefficient when initially amplifying from the cDNA template and quantitative comparisons between the two may not be valid. This raises the possibility that amplicon amounts may not directly reflect relative transcript levels for the two isoforms. That MTHFRb is the main isoform present, however, was also consistent with the apparent MW of the lowest and most prominent bands in GV oocytes and embryos, and of the protein in MII eggs after LPP-mediated dephosphorylation, which was closer to the predicted MW of ∼70 kDa for MTHFRb than the ∼77 kDa for MTHFRa. Both isoforms possess the priming threonine and additional sites that are phosphorylated in their N-termini (Tran et al., Reference Tran, Leclerc, Chan, Pai, Hiou-Tim, Wu, Goyette, Artigas, Milos and Rozen2002), so that both isoforms can potentially be regulated by phosphorylation.
The most striking result here was that MTHFR was transiently phosphorylated during meiotic maturation, with phosphorylation increasing gradually during MI and reaching its maximum in mature MII eggs. Dephosphorylation was rapid after egg activation in vitro. We variably observed the more slowly migrating bands corresponding to phospho-MTHFR in 1-cell embryos isolated from the oviduct of mated females, perhaps indicating that dephosphorylation may occur more slowly in vivo. Nevertheless, it is clear that MTHFR becomes maximally phosphorylated during meiotic maturation and then dephosphorylated again in early embryos after fertilization. Furthermore, MII eggs were apparently hyperphosphorylated compared with MI eggs. As phosphorylation results in inactivation of MTHFR (Yamada et al., Reference Yamada, Strahler, Andrews and Matthews2005; Zhu et al., Reference Zhu, Xiahou, Zhao, Peng, Zhao and Xu2014; Froese et al., Reference Froese, Kopec, Rembeza, Bezerra, Oberholzer, Suormala, Lutz, Chalk, Borkowska, Baumgartner and Yue2018), these results would be consistent with MTHFR activity being maximally suppressed in MII eggs.
Based on the results reported here and previously published work as cited below, we propose that SAM production is regulated in oocytes during meiotic maturation by at least two factors: the supply of one-carbon units through serine transport and regulation of MTHFR via phosphorylation. The intracellular SAM concentration increases ∼ 2.5-fold in oocytes between the GV and MI stages (Li et al., Reference Li, Zhu, Shu, Guo, Guan, Zeng, Wang, Han, Zhang, Liu, Li, Hou, Gao, Ge, Ren, Zhang, Schedl, Guo, Chen and Wang2020). This accumulation of SAM could be driven by an increased supply of one-carbon units from serine in the folate cycle. Serine transport is inactive in GV oocytes (Zhang et al., Reference Zhang, McClatchie and Baltz2020) and therefore the folate cycle would be deprived of one-carbon units at this stage. Serine transport, however, becomes rapidly activated when oocytes are released from meiotic arrest at the GV stage (Zhang et al., Reference Zhang, McClatchie and Baltz2020) and, consistent with this, the intracellular serine concentration rapidly increases by ∼15-fold in early MI oocytes compared with GV oocytes (Li et al., Reference Li, Zhu, Shu, Guo, Guan, Zeng, Wang, Han, Zhang, Liu, Li, Hou, Gao, Ge, Ren, Zhang, Schedl, Guo, Chen and Wang2020). The increase in serine flux (Zhang et al., Reference Zhang, McClatchie and Baltz2020) and intracellular concentration (Li et al., Reference Li, Zhu, Shu, Guo, Guan, Zeng, Wang, Han, Zhang, Liu, Li, Hou, Gao, Ge, Ren, Zhang, Schedl, Guo, Chen and Wang2020) would act to supply the folate cycle in MI oocytes. As shown here, MTHFR phosphorylation is minimal in very early MI oocytes, therefore MTHFR should be active and supply 5-methylTHF to the methionine cycle, producing the SAM that accumulates in MI oocytes. Therefore, the increase in intracellular SAM at the MI stage may be driven by the combination of the initiation of serine uptake and the presence of active, unphosphorylated MTHFR during the first few hours after GVBD and entry into MI.
MTHFR then becomes phosphorylated during MI to reach maximal phosphorylation in MII, which should substantially suppress its activity. In eggs, therefore, SAM could continue to be metabolized but would not be replenished, which is consistent with an observed ∼2.5-fold decrease in SAM concentration from the MI to MII stages that returns to the baseline level that was present in GV oocytes (Li et al., Reference Li, Zhu, Shu, Guo, Guan, Zeng, Wang, Han, Zhang, Liu, Li, Hou, Gao, Ge, Ren, Zhang, Schedl, Guo, Chen and Wang2020). Serine also decreases, by ∼4.5-fold, from MI to MII (Li et al., Reference Li, Zhu, Shu, Guo, Guan, Zeng, Wang, Han, Zhang, Liu, Li, Hou, Gao, Ge, Ren, Zhang, Schedl, Guo, Chen and Wang2020) and serine transport becomes inactivated again midway through MI (Zhang et al., Reference Zhang, McClatchie and Baltz2020) that reflects the cessation of a requirement for one-carbon units supplied by serine for the methionine cycle.
When serine donates its methyl moiety to folate, it is converted to glycine (Ikeda et al., Reference Ikeda, Koyama, Sugimoto and Kume2012a). Glycine increases substantially during meiotic maturation, reaching its maximum levels in MII eggs (Tartia et al., Reference Tartia, Rudraraju, Richards, Hammer, Talbot and Baltz2009; Li et al., Reference Li, Zhu, Shu, Guo, Guan, Zeng, Wang, Han, Zhang, Liu, Li, Hou, Gao, Ge, Ren, Zhang, Schedl, Guo, Chen and Wang2020). In large part, this is due to the activation of robust glycine transport into the oocyte during meiotic maturation (Tartia et al., Reference Tartia, Rudraraju, Richards, Hammer, Talbot and Baltz2009; Richard and Baltz, Reference Richard and Baltz2017), but a portion of the increase could represent a contribution from serine metabolism in the folate cycle. Furthermore, the increased intracellular concentration of glycine would inhibit the continued conversion of serine, further contributing to suppression of SAM production in the MII oocyte.
Together, this is consistent with a model in which the GV oocyte contains active MTHFR that is primed to produce SAM, but SAM production does not increase until the oocyte is released from GV arrest and serine begins to be supplied to the folate cycle. Once serine is supplied in the early MI oocyte, SAM production continues until MTHFR is phosphorylated and serine transport ceases. Because MTHFR is maximally phosphorylated in MII eggs, it would not respond to decreasing SAM levels by supplying one-carbon units to the methionine cycle, and therefore SAM levels decrease to minimal levels in MII eggs. We propose, therefore, that MTHFR activity is regulated by phosphorylation in oocytes during meiotic maturation so that SAM production reaches a maximum in MI oocytes after which it is consumed for its methyl groups and then maintained at a low level in the MII egg. Folates are accumulated in growing oocytes (Meredith et al., Reference Meredith, MacNeil, Trasler and Baltz2016) to support SAM production in the maturing oocyte, while, as detailed above, serine is transiently accumulated coincident with SAM production to supply the methyl groups.
To further confirm this model, it would need to be directly demonstrated that MTHFR activity is lower in MII eggs than in GV oocytes, as inferred from its phosphorylation status. MTHFR enzyme activity has previously been measured in tissue lysates (mainly liver) using an assay that detects the transfer of a radiolabelled one-carbon group from 5-methylTHF to a synthetic acceptor (Rosenblatt and Erbe, Reference Rosenblatt and Erbe1977; Goyette et al., Reference Goyette, Christensen, Rosenblatt and Rozen1996). However, the radiolabelled 5-methylTHF was no longer obtainable from commercial sources including by custom synthesis while the present work was being done. We were also unsuccessful in attempts to modify this assay to instead detect the product using liquid chromatography coupled to tandem mass spectrometry, even using liver lysate. Therefore, further confirmation of this model awaits future development of a MTHFR enzyme activity assay suitable for use with oocytes.
We did not detect any renewed phosphorylation of MTHFR in preimplantation embryos after fertilization, although we could have missed any transient events. as embryonic DNA is globally demethylated during the preimplantation period and then begins to be remethylated around the time of implantation, it is anticipated that an increased amount of SAM would be required to support both DNA methylation and histone methylation in the late blastocyst and after implantation. As well, overall metabolism generally increases by the blastocyst stage (Houghton et al., Reference Houghton, Thompson, Kennedy and Leese1996), which is likely to include many biochemical processes dependent on the diverse methyltransferases that use SAM as their substrate. This would be consistent with MTHFR remaining unphosphorylated and therefore active through preimplantation embryo development.
In most cells, including oocytes and preimplantation embryos before the blastocyst stage, the folate cycle is the sole producer of one-carbon units for the SAM methyl pool, as described in the Introduction. However, a parallel production exists in which the methyl donor is betaine (N,N,N-trimethylglycine). There, betaine transfers one of its methyl groups directly to homocysteine via the enzyme betaine-homocysteine methyltransferase (BHMT), independent of the folate cycle (Garrow, Reference Garrow1996; Ikeda et al., Reference Ikeda, Koyama, Sugimoto and Kume2012a). We have previously found that betaine is synthesized in the oocyte during meiotic maturation (McClatchie et al., Reference McClatchie, Meredith, Ouédraogo, Slow, Lever, Mann, Zeisel, Trasler and Baltz2017) and accumulated via transport in 1-cell and 2-cell embryos (Anas et al., Reference Anas, Lee, Zhou, Hammer, Slow, Karmouch, Liu, Bröer, Lever and Baltz2008). Furthermore, Bhmt transcripts are highly expressed and peak at the morula stage (Lee et al., Reference Lee, Kooistra, Zhang, Slow, Fortier, Garrow, Lever, Trasler and Baltz2012; Figure 2E) and BHMT protein is highly expressed and active in the inner cell mass of mouse blastocysts (Lee et al., Reference Lee, Kooistra, Zhang, Slow, Fortier, Garrow, Lever, Trasler and Baltz2012). The folate cycle and betaine/BHMT mechanism are both functional in the blastocyst. When either the folate cycle is suppressed or BHMT is separately knocked down, there is some decrease in development to the blastocyst and in cell number in surviving blastocysts (Lee et al., Reference Lee, Kooistra, Zhang, Slow, Fortier, Garrow, Lever, Trasler and Baltz2012; Zhang et al., Reference Zhang, Denomme, White, Leung, Lee, Greene, Mann, Trasler and Baltz2015). However, when both are inhibited simultaneously, few blastocysts develop, their SAM levels are greatly reduced, and they cannot produce viable fetuses (Zhang et al., Reference Zhang, Denomme, White, Leung, Lee, Greene, Mann, Trasler and Baltz2015). Therefore, in the mouse, SAM production is apparently boosted at the blastocyst stage by the addition of this second mechanism. It is unclear if this extends to non-rodent species, however, in which the folate cycle may instead be the sole route for SAM synthesis in blastocysts (Clare et al., Reference Clare, Pestinger, Kwong, Tutt, Xu, Byrne, Barrett, Emes and Sinclair2021).
In summary, MTHFR appears to be regulated by phosphorylation in maturing oocytes uniquely in the period of development from the arrested GV oocyte to the blastocyst. Its phosphorylation status is consistent with the changes observed in SAM levels and in serine concentration and transport. The mechanism of MTHFR phosphorylation in maturing oocytes remains unknown, although it has been reported that MTHFR can be phosphorylated by CDK1 (Zhu et al., Reference Zhu, Xiahou, Zhao, Peng, Zhao and Xu2014), and therefore may be controlled directly by resumption of the meiotic cell cycle. Why there might be an increased demand for one-carbon units supplied by SAM in maturing oocytes is also unknown. Further investigations will be needed to determine the mechanism controlling MTHFR and the fate of the one-carbon units supplied by SAM, and to confirm that phosphorylation of MTHFR decreases its enzyme activity in eggs.
Supplementary material
To view supplementary material for this article, please visit https://doi.org/10.1017/S0967199422000156
Acknowledgements
Analysis of the transcript expression data sets was carried out by Gareth Palidwor at the Ottawa Hospital Research Institute Bioinformatics Core. Initial identification of relevant RNA-seq data sets was performed by Angus Macaulay. Mthfr knockout mice were originally produced in the Rima Rozen laboratory at McGill University. The Rozen laboratory also kindly provided their MTHFR antibody, which was used here where specified.
Financial support
This work was supported by Canadian Institutes of Health Research grants PJT-169185, MOP-97972.
Conflict of interest
The authors declare none.
Ethical standards
The authors assert that all procedures contributing to this work complied with the ethical standards of the relevant national and institutional guides on the care and use of laboratory animals.


 Open access