





Nomenclature
Latin symbols
- ${C_p}$
-
Pressure coefficient,
${C_p} = \frac{{p - {p_\infty }}}{{0.5\rho U_\infty ^2}}$
-
${c_{ref}}$
-
Characteristic length, [
$m$
] -
$D$
-
Diameter, [
$m$
] -
$k$
-
Turbulent kinetic energy, [
${{\rm{m}}^2}{{\rm{s}}^{ - 2}}$
] -
${{\rm{M}}_\infty }$
-
Mach number
-
$n$
-
Rotational frequency, [Hz]
-
${N_b}$
-
Number of blades
-
$Q$
-
Propeller torque, [
$Nm$
] -
${\rm{Re}}$
-
Reynolds number,
$Re = \frac{{{U_{ref}}{c_{ref}}}}{\nu }$
-
$R$
-
Radius, [
$m$
] -
${\bf{R}}$
-
Flow residual vector
-
$T$
-
Propeller thrust, [
$N$
] -
${T_{install}}$
-
Installed propulsive thrust, [
$N$
] -
$U$
-
Local velocity, [
$m/s$
] -
${U_\infty }$
-
Free-stream velocity, [
$m/s$
] -
${U_{ref}}$
-
Reference velocity, [
$m/s$
] -
${V_{i,j,k}}$
-
Cell volume
-
${\bf{W}}$
-
Vector of conservative flow variables


Greek letters
-
${\eta _{Prop}}$
-
Propeller Froude efficiency,
${\eta _{Prop}} = \frac{{{T_{propeller}} \times {U_\infty }}}{{{P_{shaft}}}}$
-
$\eta _{propulsive}^{overall}$
-
Overall propulsive efficiency,
$\eta _{propulsive}^{overall} = \frac{{{T_{install}} \times {U_\infty }}}{{{P_{shaft}}}}$
-
$J$
-
Advance ratio of propellers,
$J = \frac{{{U_\infty }}}{{nD}}$
-
$\nu $
-
Kinematic viscosity, [
${m^2}/s$
] -
$\omega $
-
Turbulent frequency [
${{S}^{\!-1}}$
]


Acronyms
- CFD
-
Computational Fluid Dynamics
- DP
-
Distributed Propulsion
- HMB3
-
Helicopter Multi-Block 3
- HLP
-
High Lift Propeller
- MUSCL
-
Monotonic Upstream-Centred Scheme for Conservation Laws
- NASA
-
National Aeronautics and Space Administration
- OTW
-
Over-The-Wing
- RB
-
Resolved Blades
- RPM
-
Revolutions Per Minute
- RANS
-
Reynolds-Averaged Navier-Stokes
- SAS
-
Scale-Adaptive Simulation
- SST
-
Shear Stress Transport
- SCEPTOR
-
Scalable Convergent Electric Propulsion Technology Operations Research
- TMS
-
Time-Marching Simulation
- TMP
-
Tip-Mounted Propeller
- URANS
-
Unsteady Reynolds-Averaged Navier-Stokes
1.0 Introduction
Recent advancements in hybrid and electric propulsion technologies enable the development of distributed propulsion systems, which have potential to reduce energy consumption and emissions [Reference Hermetz, Ridel and Doll1]. An analysis of aero-propulsive synergistic effects in the preliminary design phase [Reference Kim, Perry and Ansell2] indicated improvements in overall robustness, capacity and system efficiency. Aero-propulsive coupling, in particular, offered a method for enhancing wing lift. As an example, comply with regulations on required stall speed, current designs often feature wings that are larger than necessary, e.g. for cruise. Local wing blowing can increase dynamic pressure using the propulsion system, thereby raising the loading of wing sections. This approach allows for a reduction in wing area while still achieving the required stall speed and could potentially lead to improved cruise performance [Reference Patterson and Borer3].
Propellers are more efficient than other propulsion techniques at subsonic speeds [Reference Rolls Royce4], however, the installation of propellers on the airframe can significantly influence the overall aircraft performance. Notably, wingtip-mounted propellers are a promising configuration for reducing induced drag through favourable wake interactions. This is particularly true when the propeller rotation is opposite to that of the wingtip vortex in a tractor configuration, as this setup can help mitigate the induced drag [Reference Stokkermans, Van Arnhem, Sinnige and Veldhuis5–Reference Miranda and Brennan7]. In a pusher layout, where the propeller counter-rotates relative to the wingtip vortex, the swirling flow induced by the wingtip can lead to reduced shaft power [Reference Miranda and Brennan7–Reference Janus, Chatterjee and Cave9]. However, the tip-mounted propeller configuration also has drawbacks, including the adverse effects of a highly loaded wingtip, the significant weight of the engine, inertia loads and a large yawing moment arm during one-engine-out scenarios.
Integrating wingtip-mounted propellers with a distributed propulsion system can further enhance the wing and propulsive efficiencies [Reference Della Vecchia, Malgieri, Nicolosi and De Marco10]. Notable examples of such efforts include the X-57 Maxwell aircraft [Reference Heeg, Stanford, Kreshock, Shen, Hoover and Truax11] and the Scalable Convergent Electric Propulsion Technology and Operations Research (SCEPTOR) concept [Reference Borer, Patterson, Viken, Moore, Bevirt, Stoll and Gibson12], which have attracted significant attention from industry, academia and government. A detailed characterisation of propeller-wing interactional effects is essential for developing novel flying vehicles. The wingtip-mounted propeller workshop (WIPP), led by NASA, has provided valuable insights into tip-mounted propeller configurations through extensive experimental campaigns [Reference Hooker, Wick, Ginn, Walker and Schiltgen13]. Prior research on distributed propulsion systems has optimised high-lift propeller installation locations using variable fidelity methods, demonstrating better performance compared to conventional configurations from distributed propulsion system with the over-the-wing (OTW) design [Reference Qiao, Zhang and Barakos14]. However, high-fidelity research combining tip-mounted propellers with distributed propulsion systems is currently rare. As a result, the performance and flow characteristics resulting from increased propeller-wing and propeller-propeller interactions remain largely unexplored.
This work employs a rigorously validated high-fidelity method, specifically designed to analyse propeller-wing and propeller-propeller interactions. For instance, this work examines configurations with tip-mounted propellers and distributed propulsion systems. The current work aims to identify the potential benefits of different emerging propulsion systems and offer better understanding of the fundamental flow physics associated with each configuration.
2.0 Numerical methods
2.1 HMB3 CFD solver
The in-house Helicopter Multi-Block (HMB3) computational fluid dynamics (CFD) solver is employed in this study. HMB3 can predict the aerodynamic performance and acoustics of propulsion systems, as shown in previous studies [Reference Steijl, Barakos and Badcock15,Reference Biava, Woodgate and Barakos16]. HMB3 has been widely used in the investigation of rotorcraft flows [Reference Antoniadis, Drikakis and Zhong17–Reference Garcia and Barakos20], helicopter rotor aeroelasticity [Reference Dehaeze and Barakos21], propeller aeroacoustics [Reference Chirico, Barakos and Bown22], flight mechanics [Reference Crozon, Steijl and Barakos23] and missile trajectory prediction [Reference Babu, Loupy, Dehaeze, Barakos and Taylor24]. Moreover, good agreement when compared to experimental results in aerodynamics, acoustics and aeroelasticity of propellers has been reported in previous studies [Reference Barakos and Johnson25–Reference Higgins, Zarev, Barakos and Green28]. Most recently, its ability to capture the interactions of multi-rotor flows and estimate the performance of ducted propellers was also documented [Reference Higgins, Barakos, Shahpar and Tristanto29–Reference Qiao31].
HMB3 solves the unsteady Reynolds averaged Navier-Stokes (URANS) equation in integral form using the Arbitrary Lagrangian-Eulerian formulation for time-dependent domains, including moving boundary layers. HMB3 uses a cell-centred finite volume approach to discretise the Navier-Stokes equations on multi-block, structured grids.
 \begin{align}\frac{d}{{dt}}\left( {{{\bf{W}}_{i,j,k}}{V_{i,j,k}}} \right) = - {{\bf{R}}_{i,j,k}}\left( {{{\bf{W}}_{i,j,k}}} \right),\end{align}
In Equation (1), $i$
,
$i$
, $j$
,
$j$
, $k$
represent the cell index,
$k$
represent the cell index, ${\bf{W}}$
and
${\bf{W}}$
and ${\bf{R}}$
are the vectors of conservative flow variables and the residual, respectively, and
${\bf{R}}$
are the vectors of conservative flow variables and the residual, respectively, and ${V_{i,j,k}}$
is the volume of the cell
${V_{i,j,k}}$
is the volume of the cell $i$
,
$i$
, $j$
,
$j$
, $k$
. The convective fluxes are evaluated using Osher’s approximate Riemann solver, while the viscous terms are discretised using a second-order central differences scheme. The third-order MUSCL (Monotone Upstream-centred Schemes for Conservation Laws) approach provides high-order accuracy in space. In the present work, simulations are conducted using the
$k$
. The convective fluxes are evaluated using Osher’s approximate Riemann solver, while the viscous terms are discretised using a second-order central differences scheme. The third-order MUSCL (Monotone Upstream-centred Schemes for Conservation Laws) approach provides high-order accuracy in space. In the present work, simulations are conducted using the $k - \omega $
shear stress transport (SST) turbulence model [Reference Menter32] as this has been well-validated in previous studies of interactional aerodynamics [Reference Qiao and Barakos33,Reference Qiao, Higgins, Barakos and Zhang34].
$k - \omega $
shear stress transport (SST) turbulence model [Reference Menter32] as this has been well-validated in previous studies of interactional aerodynamics [Reference Qiao and Barakos33,Reference Qiao, Higgins, Barakos and Zhang34].
2.2 CFD grids
For an isolated rotor in axial flight, the azimuthal symmetry of the configuration can be exploited, whereby only a fraction of the grid needs to be generated. The rotating reference frame (RRF) method is implemented in HMB3 [Reference Biava and Barakos35] for simulations with rotational periodicity. The governing flow equations are solved in a non-inertial reference frame, thus transforming the unsteady problem into a steady-state one. For unsteady simulations, the entire grid is required. However, this can be obtained by copying and rotating the grids of the steady simulations. Additionally, unsteady calculations are possible using the implicit, dual-time stepping approach. The computational grids used for propeller surfaces have a typical C-H topology. The spacing distribution has been set to the condition ${\rm{\Delta }}{y^ + } \lt 1$
, resulting in a first cell size of approximately
${\rm{\Delta }}{y^ + } \lt 1$
, resulting in a first cell size of approximately $2.0 \times {10^{ - 6}}c$
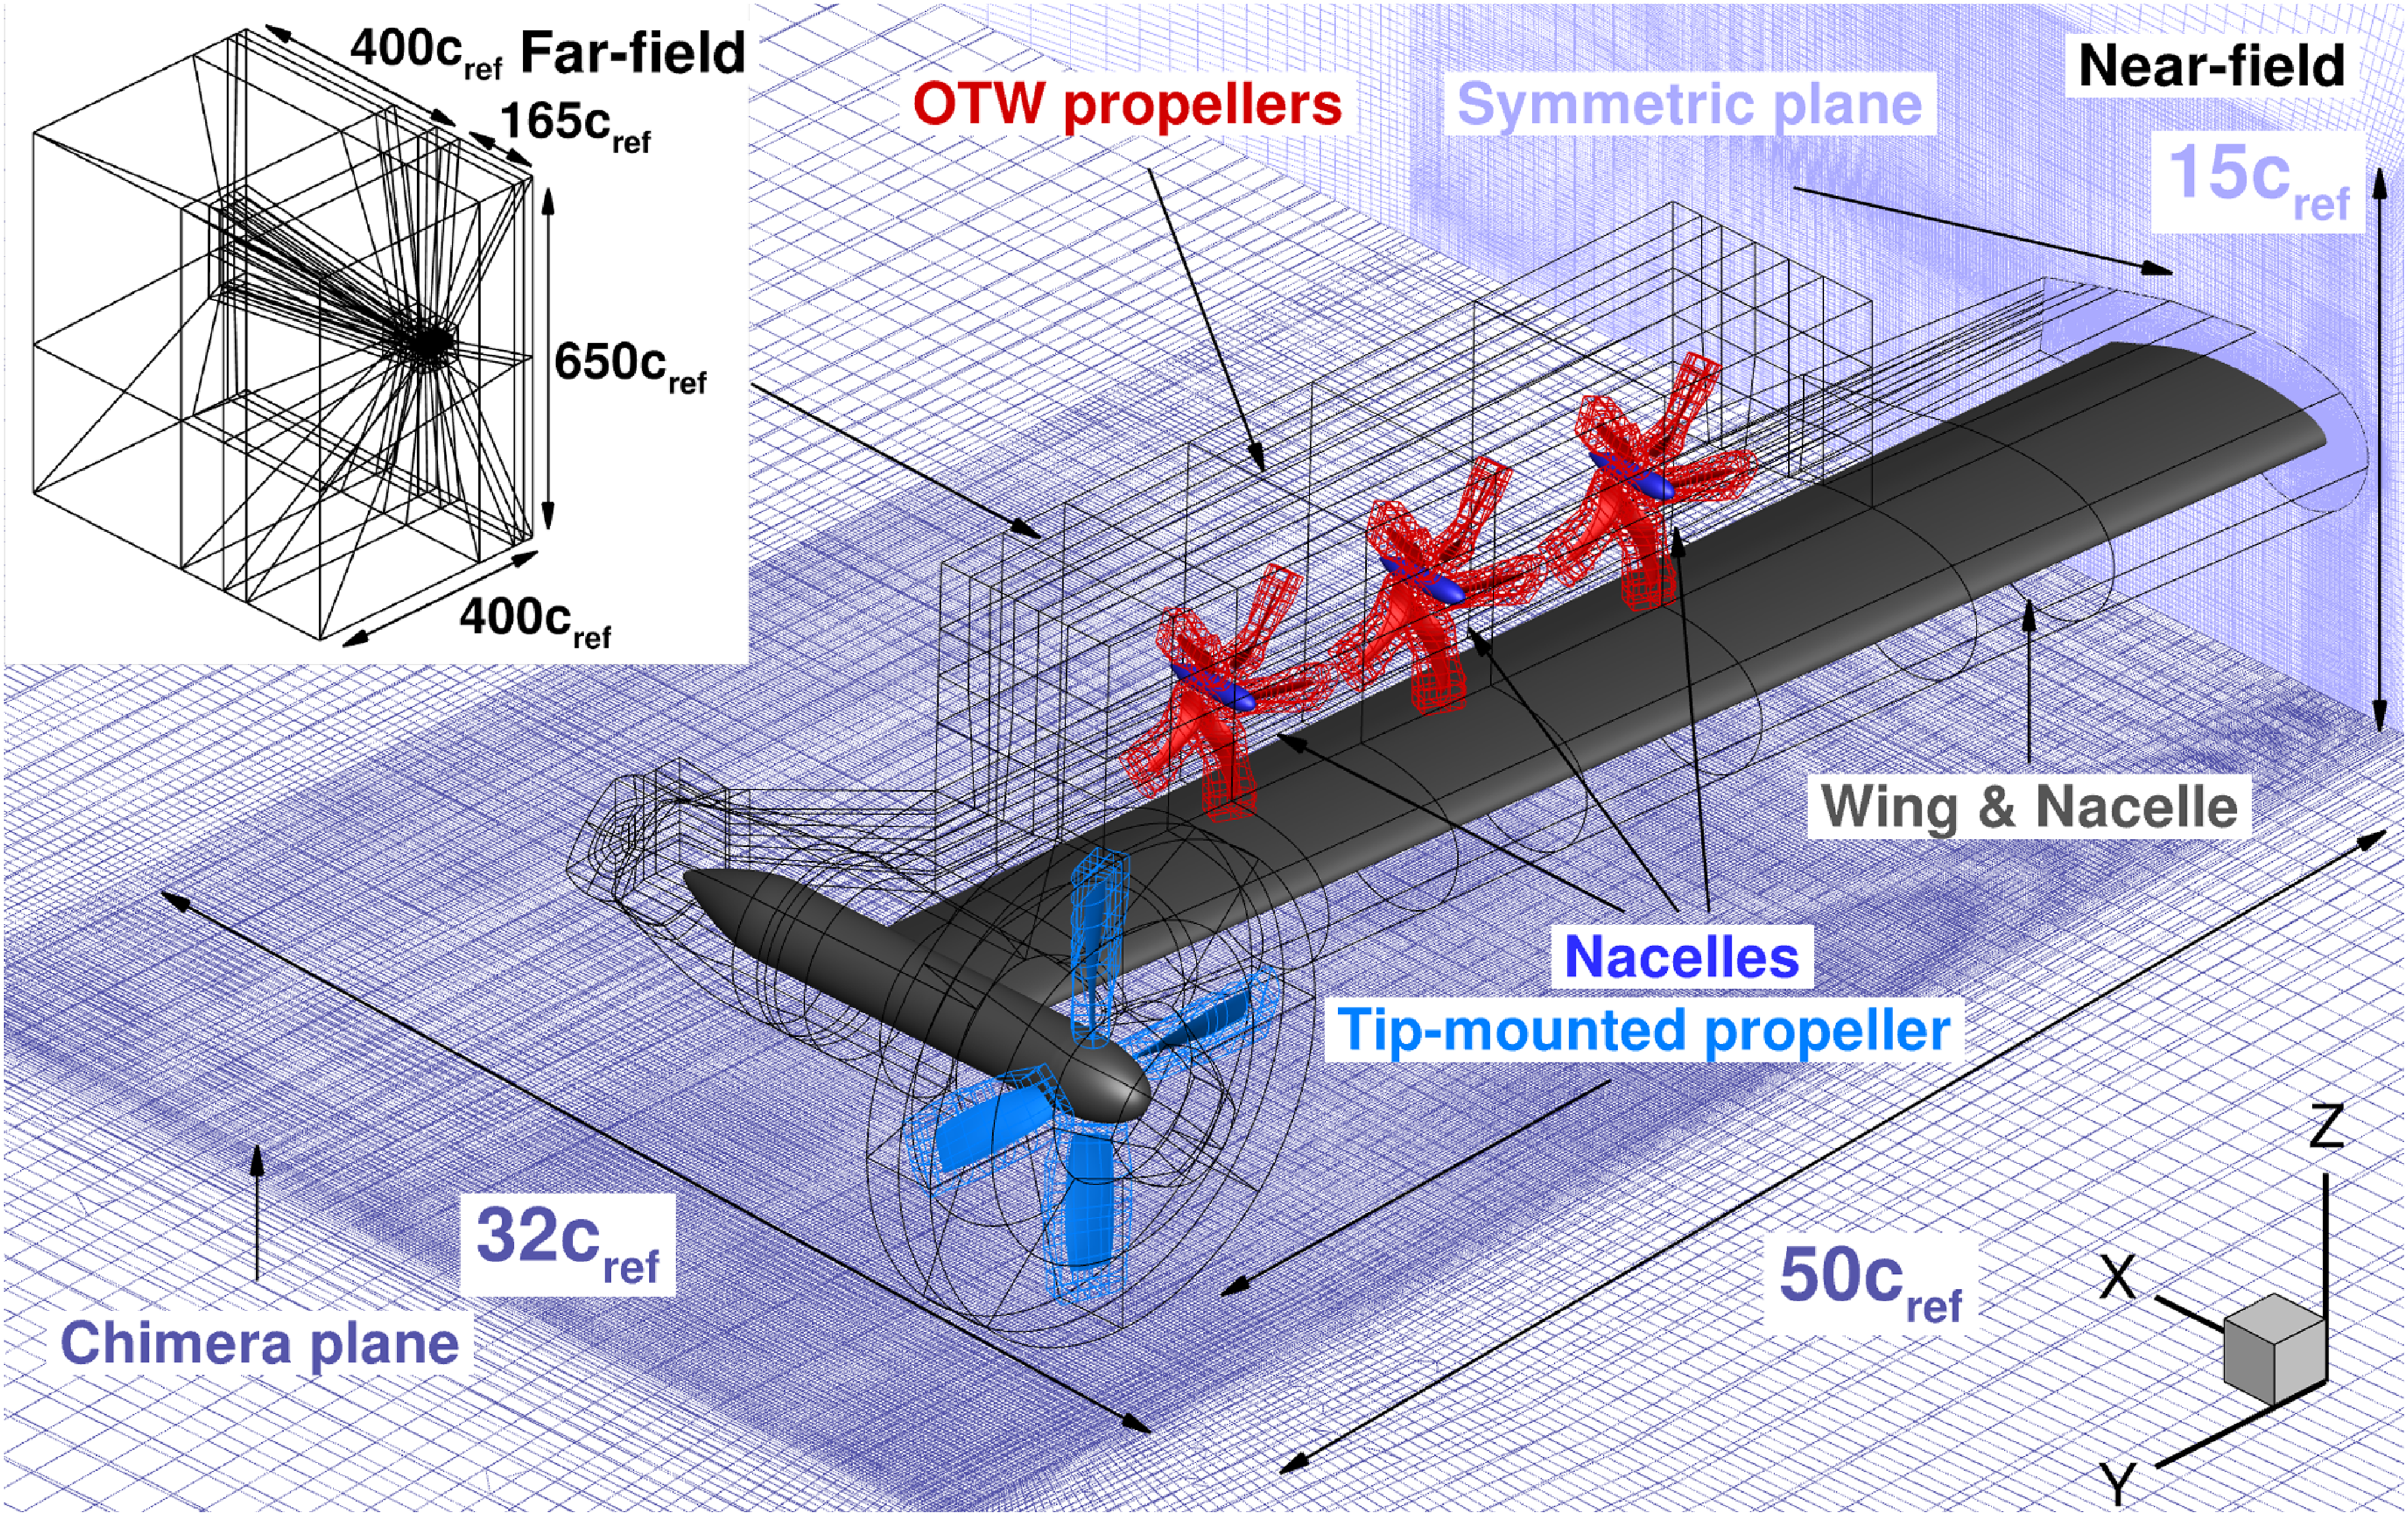
for all tested grids. Adiabatic wall boundary conditions are applied on the propellers, nacelles and wing, with freestream values of pressure and velocity used elsewhere. Overset grids were employed to capture the high-pressure gradient region and have been carefully designed for efficient load balancing. The number of near-body grid points for each tip-mounted propeller (TMP) blade is approximately 7.6 million, or 30.3 million for all four TMP blades. The number of near-body grid points for each high lift propeller (HLP) blade is approximately 2.7 million, and for all three HLP blades with 15 blades, a total of 40.5 million grid points are used. Each propeller spinner has approximately 3 million near-body volume grid points, and all three spinners have a total of 6 million grid points. The wing, nacelle of the TMP and additional refinement box for the OTW-DP system have an integrated design as indicated in Fig. 1 to help capture the detailed physics of the propeller wakes, including vortices shed from the blades, spinners and wing with a minimum of chimera levels, and have a total of 22 million grid points. In the off-body mesh system, there is a local refinement box of approximately 2.7 million points that envelopes the overall propulsion system and its wake region, to resolve and capture the shed vortices and wake. The far-field flow has a much lower pressure gradient, to help reduce the cost for these types of expensive numerical simulations, the grid points for the far-field are approximately 4.5 million. The total number of grid points in the current simulation is 124 million for the TMPDP configuration.
$2.0 \times {10^{ - 6}}c$
for all tested grids. Adiabatic wall boundary conditions are applied on the propellers, nacelles and wing, with freestream values of pressure and velocity used elsewhere. Overset grids were employed to capture the high-pressure gradient region and have been carefully designed for efficient load balancing. The number of near-body grid points for each tip-mounted propeller (TMP) blade is approximately 7.6 million, or 30.3 million for all four TMP blades. The number of near-body grid points for each high lift propeller (HLP) blade is approximately 2.7 million, and for all three HLP blades with 15 blades, a total of 40.5 million grid points are used. Each propeller spinner has approximately 3 million near-body volume grid points, and all three spinners have a total of 6 million grid points. The wing, nacelle of the TMP and additional refinement box for the OTW-DP system have an integrated design as indicated in Fig. 1 to help capture the detailed physics of the propeller wakes, including vortices shed from the blades, spinners and wing with a minimum of chimera levels, and have a total of 22 million grid points. In the off-body mesh system, there is a local refinement box of approximately 2.7 million points that envelopes the overall propulsion system and its wake region, to resolve and capture the shed vortices and wake. The far-field flow has a much lower pressure gradient, to help reduce the cost for these types of expensive numerical simulations, the grid points for the far-field are approximately 4.5 million. The total number of grid points in the current simulation is 124 million for the TMPDP configuration.
CFD grid topology used for TMP-DP configuration. The ${{\rm{c}}_{{\rm{ref}}}}$
is the TMP tip chord length.
${{\rm{c}}_{{\rm{ref}}}}$
is the TMP tip chord length.
For the time-marching computations, a time step corresponding to one degree of propeller rotation was used for all TMP cases. The convergence of the implicit scheme was determined based on the reduction of the flow field residual, compared to the previous time step. In particular, either a three-order-of-magnitude reduction, or 300 inner iterations were found to be sufficient for convergence at each unsteady step.
2.3 performance analysis
Furthermore, to assess the interference between propellers and lifting surfaces, it is evident that both components of each configuration cannot be independently evaluated. Thus, an integration of relevant forces (thrust T, drag D) should be employed to comprehensively compare the overall performance of different configurations.
In Equation (2), the overall installed thrust ( ${T_{{\rm{install}}}}$
) is calculated by subtracting the drag (
${T_{{\rm{install}}}}$
) is calculated by subtracting the drag ( ${D_{{\rm{lifting\;surface}}}}$
) of the lifting surface from the total thrust (
${D_{{\rm{lifting\;surface}}}}$
) of the lifting surface from the total thrust ( ${T_{{\rm{propellers}}}}$
) generated by the propellers.
${T_{{\rm{propellers}}}}$
) generated by the propellers.
 \begin{align}{T_{install}} = {T_{propellers}} - {D_{lifting{\rm{\;}}surface}}\end{align}
Subsequently, the overall propulsive efficiency can be simplified, this can be seen in Equation (3). Here, ${U_\infty }$
represents the free-stream velocity, and
${U_\infty }$
represents the free-stream velocity, and ${P_{{\rm{shaft}}}}$
denotes the power required by the propellers.
${P_{{\rm{shaft}}}}$
denotes the power required by the propellers.
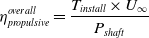 \begin{align}\eta _{propulsive}^{overall} = \frac{{{T_{install}} \times {U_\infty }}}{{{P_{shaft}}}}\end{align}
Finally, this study will apply the aforementioned equations to evaluate the overall propulsive efficiency of different configurations, ensuring that the lifting surface is trimmed to produce a higher or the same amount of lift.
3.0 Cfd validation
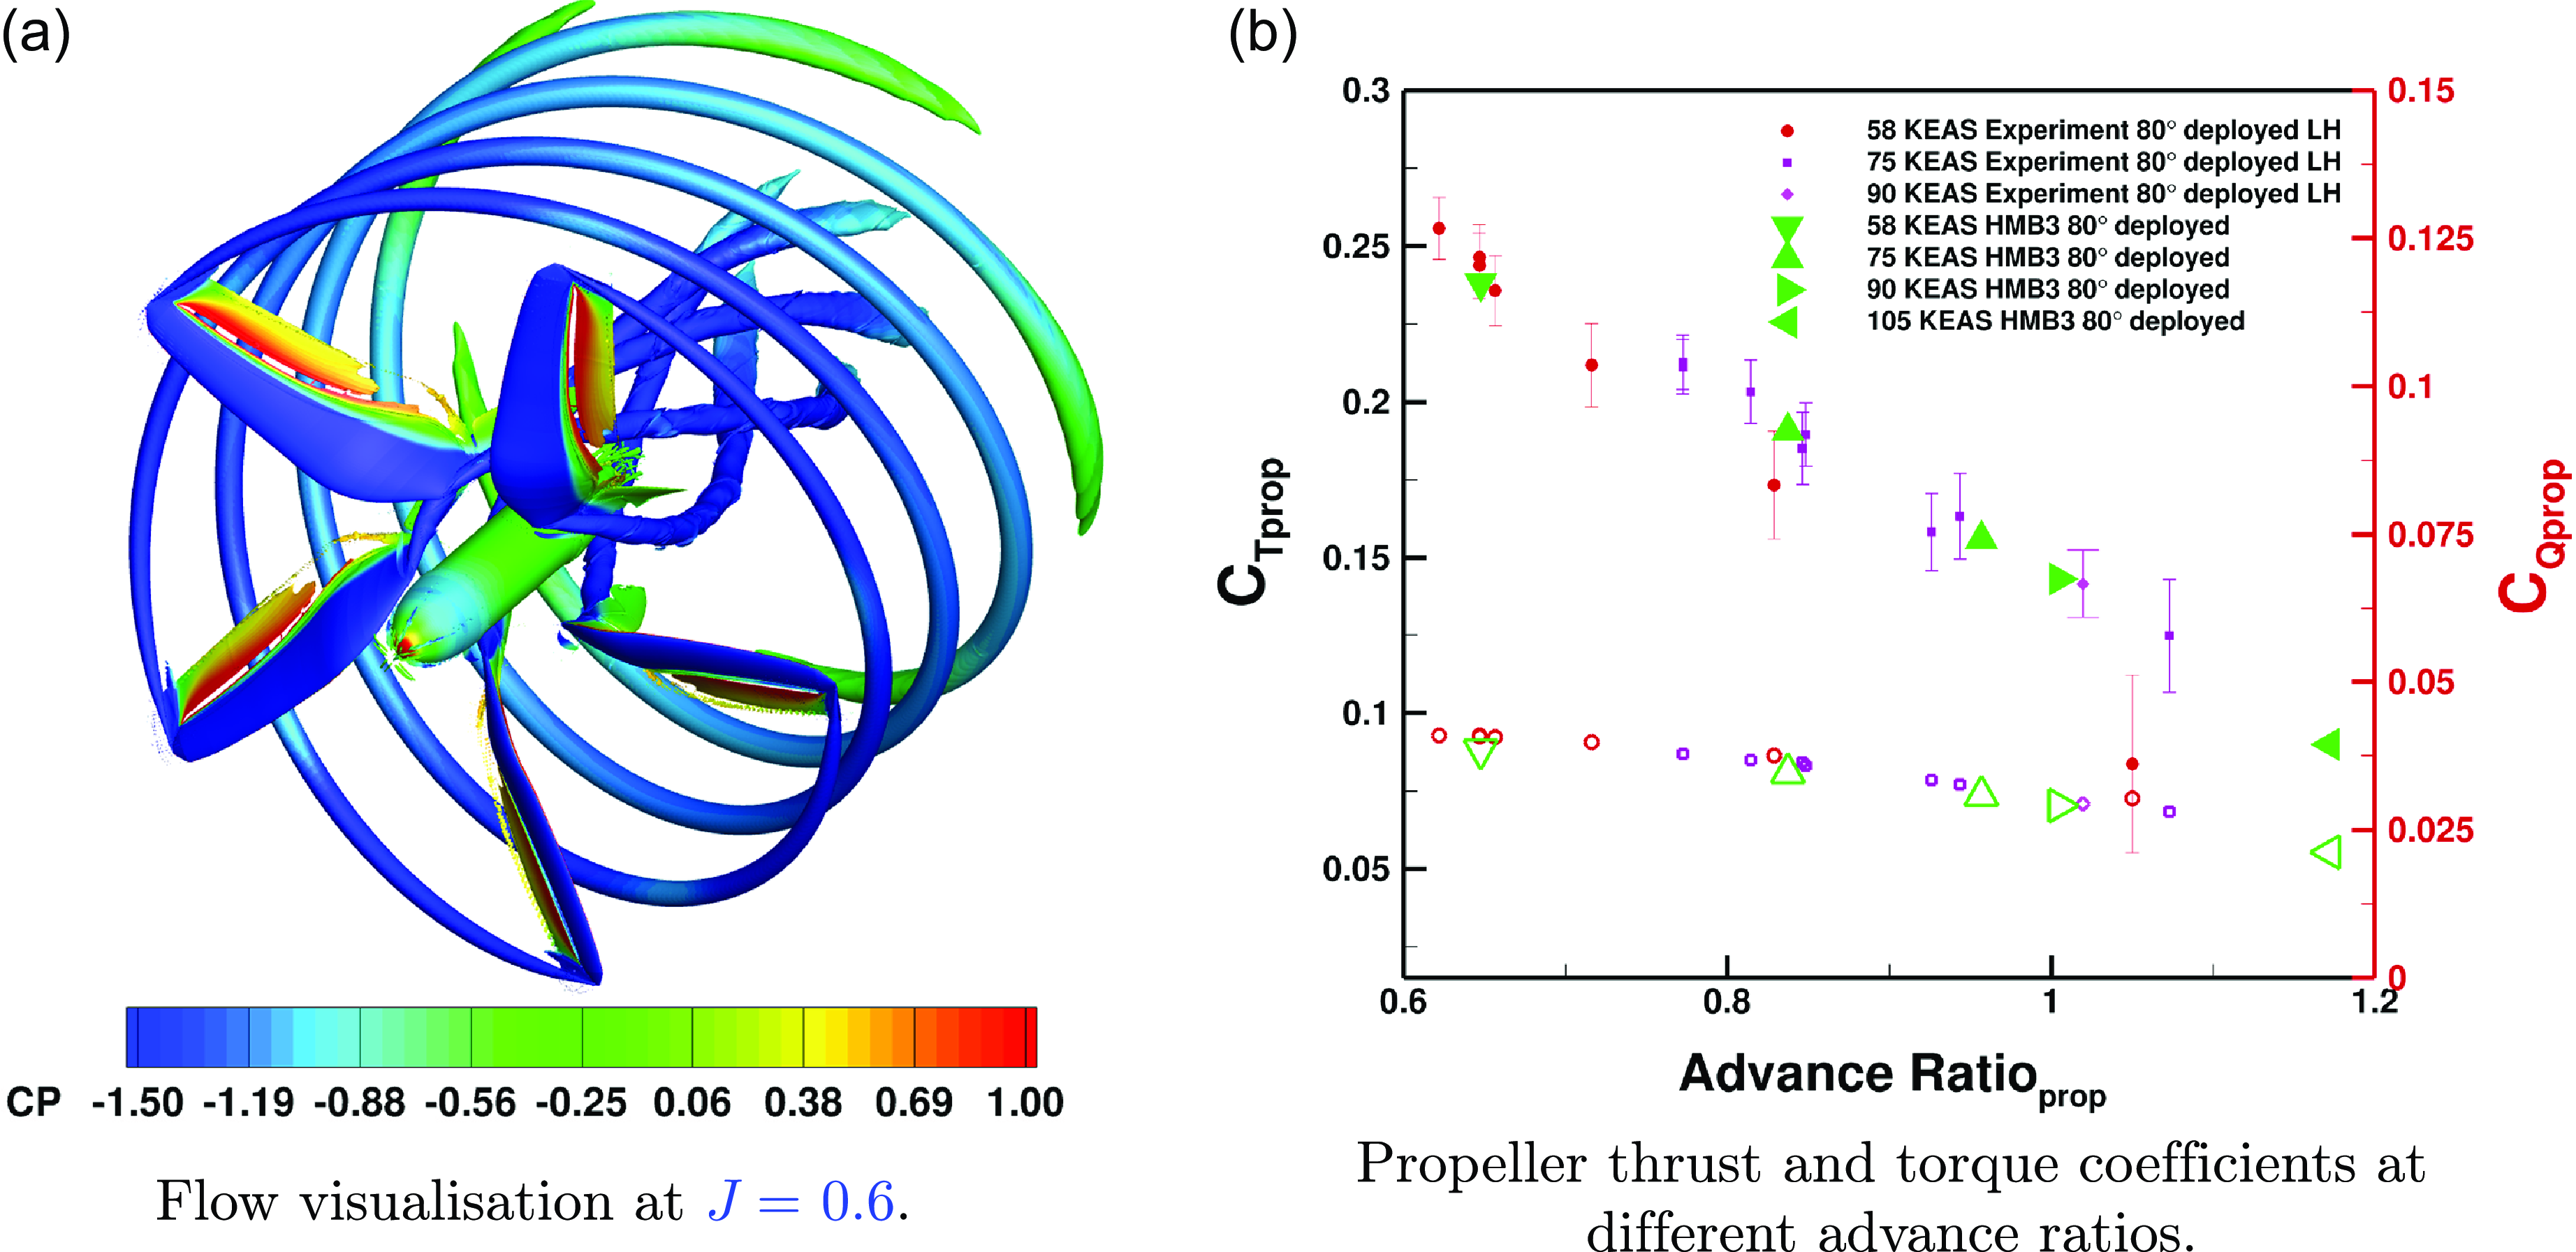
This work explores the tests of Litherland et al. [Reference Litherland, Borer and Zawodny36] within the SCEPTOR project [Reference Borer, Patterson, Viken, Moore, Bevirt, Stoll and Gibson12] and used conformal folding HLP [Reference Qiao, Zhang and Barakos14]. The HLP features five blades with a radius of 0.288m and a fixed pitch of 24.1 ${{\rm{\;}}^ \circ }$
at 75% of the blade radius. The blade parameterisation, simulation methods, mesh topology, and spatial/temporal discretisation used here are fully documented in our work [Reference Qiao, Zhang and Barakos14]. Various advance ratios, rotations and flight speeds were tested using the HMB3 CFD solver to predict the performance as illustrated in Fig. 2. Aerodynamic coefficients were compared against experiments at various advance ratios, showing good agreement between the results obtained from HMB3 and the experiments conducted by Litherland et al. [Reference Litherland, Borer and Zawodny36].
${{\rm{\;}}^ \circ }$
at 75% of the blade radius. The blade parameterisation, simulation methods, mesh topology, and spatial/temporal discretisation used here are fully documented in our work [Reference Qiao, Zhang and Barakos14]. Various advance ratios, rotations and flight speeds were tested using the HMB3 CFD solver to predict the performance as illustrated in Fig. 2. Aerodynamic coefficients were compared against experiments at various advance ratios, showing good agreement between the results obtained from HMB3 and the experiments conducted by Litherland et al. [Reference Litherland, Borer and Zawodny36].
(a) Flow visualisation using isosurfaces of Q-criteria and coloured by pressure coefficient calculated using free-stream velocity Mach 0.08. (b) Validation of HLP using the HMB3 solver [Reference Qiao and Barakos33,Reference Qiao, Higgins, Barakos and Zhang34,Reference Litherland, Borer and Zawodny36]. Empty symbols represent the respective torque coefficients. ${80^ \circ }$
refers to the deployment from the propeller axis of rotation or corresponds to about a
${80^ \circ }$
refers to the deployment from the propeller axis of rotation or corresponds to about a $ - {10^ \circ }$
coning angle relative to the fully deployed plane of rotation.
$ - {10^ \circ }$
coning angle relative to the fully deployed plane of rotation.
In an effort to bridge the knowledge gap in propeller/wing interactions, tests on WIPPs were conducted in the Lockheed Martin low-speed wind tunnel (LSWT) [Reference Hooker, Wick, Ginn, Walker and Schiltgen13]. The test model of the WIPP featured a semi-span wing measuring 1.7 meters (67 inches), as shown in Fig. 3(a), and a wingtip-mounted propeller scaled at 10% of the American four-engine turboprop military transport aircraft Lockheed C-130 Hercules designed and built by Lockheed Martin. Measurements of forces and moments were collected at various pitch angles and thrust settings. The selected test cases were referenced as Cases 79 and 180 in the experimental report [Reference NASA, Lockheed Martin, Helden Aerospace37], and the representative flow visualisation and comparisons are presented in Fig. 3, with the results obtained using HMB3 showing good agreement with the experimental measurements.
(a) Experimental set-up of wingtip-mounted propeller in the lockheed martin low speed wind tunnel [Reference Hooker, Wick, Ginn, Walker and Schiltgen13,Reference Qiao and Barakos33,Reference Qiao, Higgins, Barakos and Zhang34]. (b) Flow visualisation of wingtip-mounted propeller using isosurfaces of Q-criteria [Reference Qiao and Barakos33,Reference Qiao, Higgins, Barakos and Zhang34]. (c), (d) Surface pressure and wake validation. Cases 79 and 180 refer to the wake and boundary layer surveys at the same flow condition. The pressure coefficient extracted from the position of BL:57 is indicated with a red strip on the wing. Propeller wake results were extracted at a distance of +16.45 inches ahead of the trailing edge of the nacelle [Reference Qiao, Zhang and Barakos14,Reference Qiao and Barakos33,Reference Qiao, Higgins, Barakos and Zhang34].
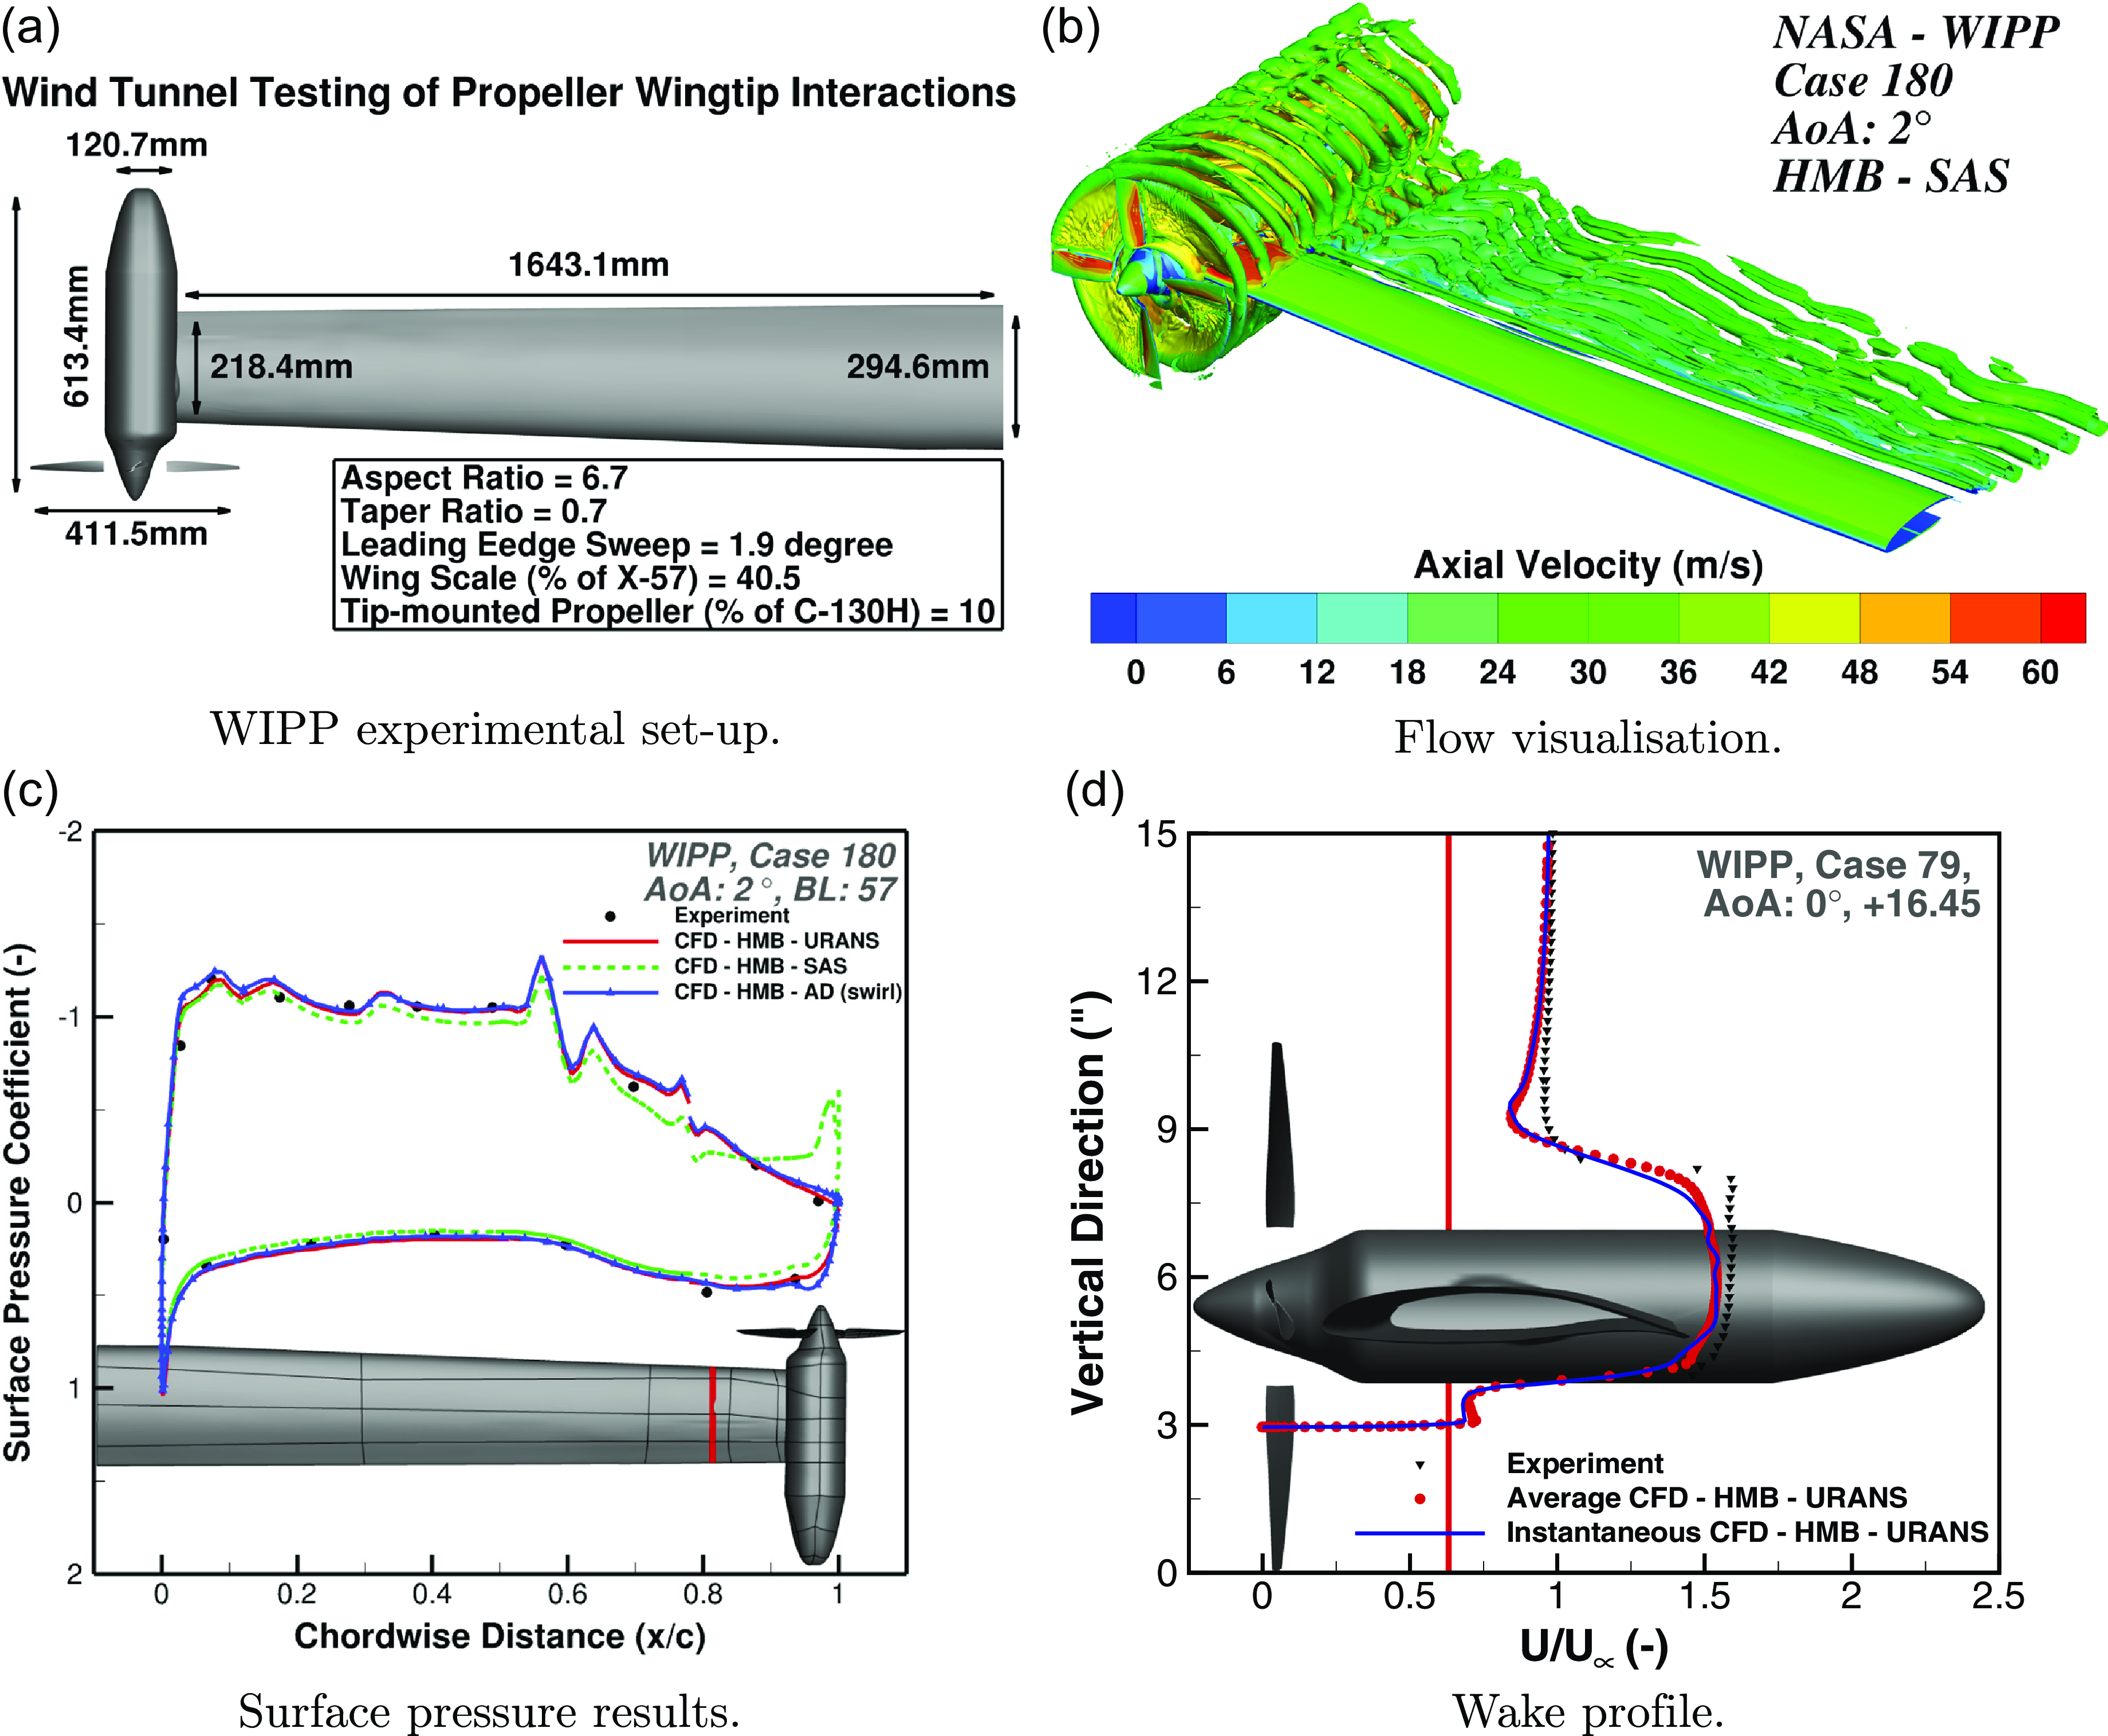
Based on the validation results presented, it is evident that the solver and the simulation strategies used in the current work are able to predict the performance of isolated propeller, propeller installed on wing and multi-propeller configurations, and to capture their associated interactional flow phenomena [Reference Qiao, Zhang and Barakos14,Reference Qiao, San Martin and Barakos38].
4.0 Distributed propulsion
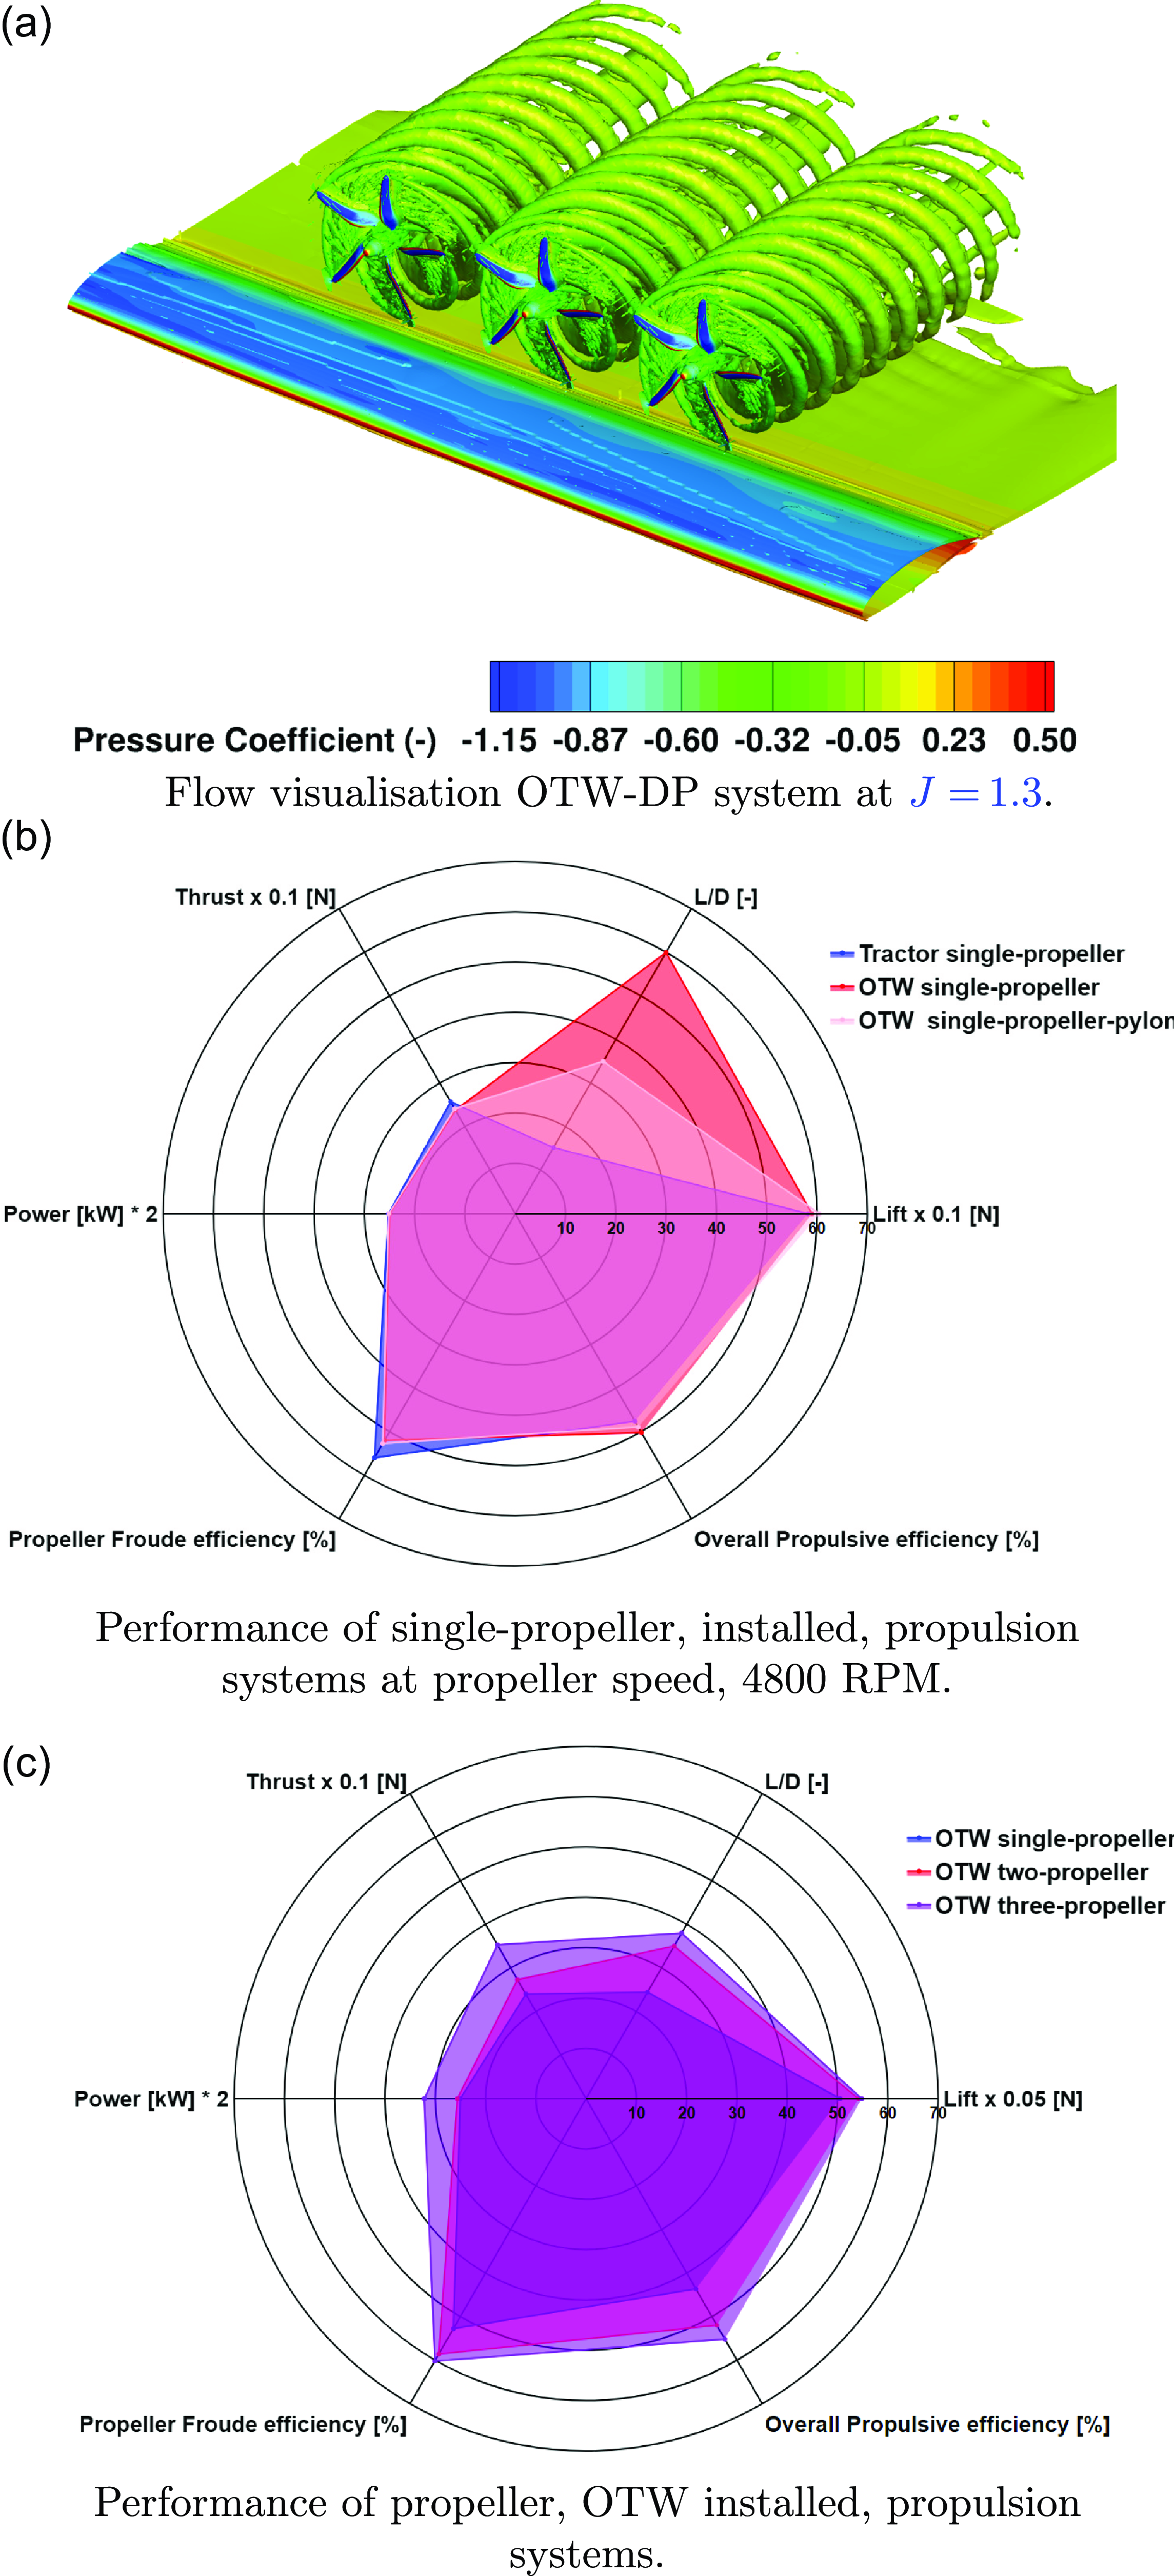
With the CFD method validated, the investigation of the distributed propulsion system was conducted using the WIPP geometry and the HLP. The flow visualisation of the OTW-DP propulsion system is presented in Fig. 4(b), and the performance of the OTW propulsion system with different number of installed propellers is shown in Figs 4(a) and (b). When transitioning from single-propeller to three-propeller Propulsion (DP) system, it was observed that the propellers were 14.2% ( ${\eta _{Prop}}$
) more efficient. In terms of overall efficiency, the three-propeller OTW configuration was 26.3% (
${\eta _{Prop}}$
) more efficient. In terms of overall efficiency, the three-propeller OTW configuration was 26.3% ( $\eta _{propulsiv}^{overall}$
) more efficient than the single-propeller installed OTW configuration, demonstrating the capability of a DP system to enhance the overall performance.
$\eta _{propulsiv}^{overall}$
) more efficient than the single-propeller installed OTW configuration, demonstrating the capability of a DP system to enhance the overall performance.
Flow visualisation of the OTW-DP system and the performance comparisons of a single propeller-installed tractor, pylon/no-pylon OTW, and different numbers of propeller-installed OTW configurations [Reference Qiao, Zhang and Barakos14].
5.0 Tip-mounted propeller and distributed propulsion
5.1 Test matrix
A previous study [Reference Qiao, Zhang and Barakos14] on distributed propulsion systems found that the OTW configuration, with varying numbers of installed HLPs, out-performed the tractor configurations in terms of overall performance. Additionally, research on tandem propellers [Reference Yin, De Gregorio and Rossignol39] has shown that the tip-to-tip distances and spacings significantly impacted their performance and noise emissions. Therefore, before conducting a comprehensive vehicle-level investigation, it is essential to examine the installation effects of tip-mounted and distributed propellers.
Figure 5 shows four configurations. Configurations C1 and C4 are compared at identical operating conditions (the TMP had the same blade pitch and rotation speed) to isolate the aerodynamic interactions introduced from the DP system. The installed HLP in configuration C2 is contrasted with the distributed HLPs in configuration C4 (HLP has the same pitch and rotation speed) to assess the impact of TMP, and the distributed OTW-installed propellers. Furthermore, a comparative analysis based on the equivalent thrust is conducted between the TMP-only configuration C3, shown in Fig. 5(a), and the TMPDP system C4, illustrated in Fig. 5(c), to investigate the individual component and overall propulsive performance.
Schematic of investigated configurations. C1 and C3 have different pitches and rotation speeds.
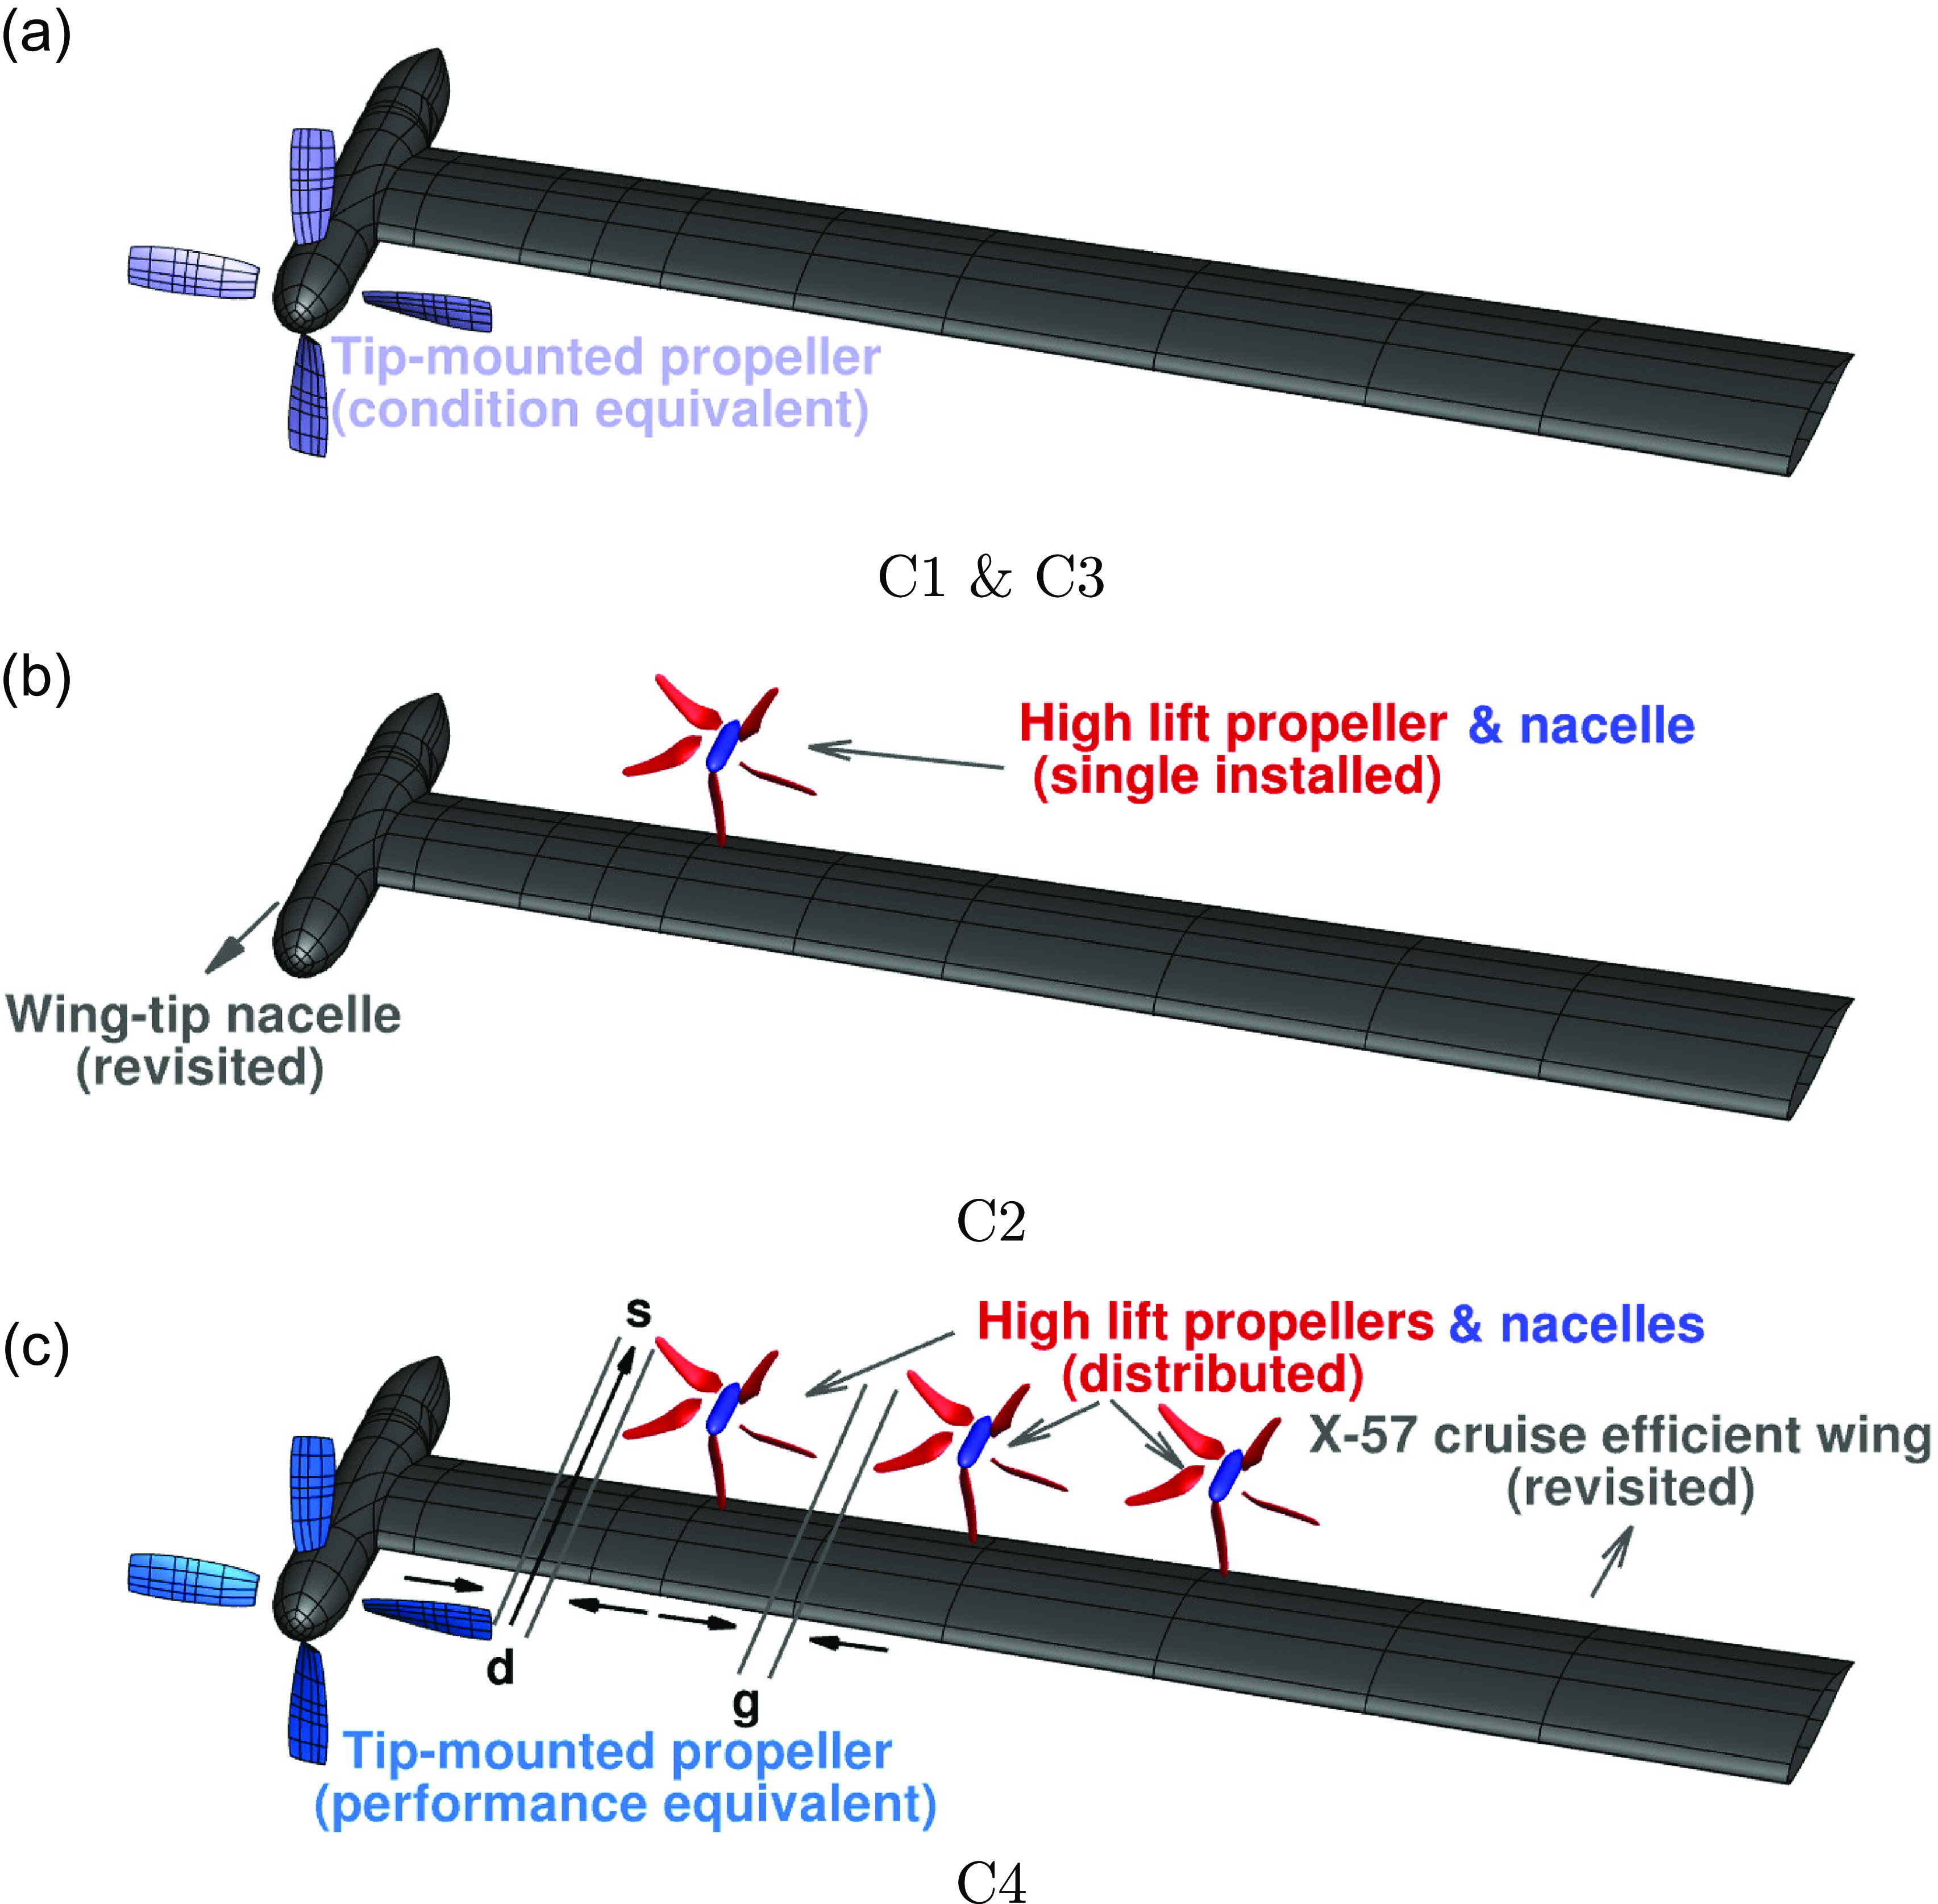
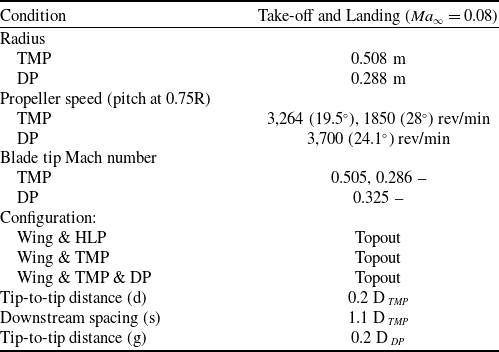
The same tip speed as the NASA WIPP experiments, corresponding to a Mach number of 0.505, is applied to the TMP in configuration C3. This is equivalent to the propeller speed of 3,264 RPM in the full-scale simulation of C3, as used in the current work. In the TMPDP system of Fig. 5(c), the propeller speed and blade pitch angle at 0.75R are precisely adjusted to produce the same thrust as the propulsion system C3 in Fig. 5(a). Specifically, the TMP in configuration C4 operates at 1850 RPM and a pitch of ${28^ \circ }$
, while the DP operates at 3,700 RPM with a pitch of
${28^ \circ }$
, while the DP operates at 3,700 RPM with a pitch of ${24.1^ \circ }$
. This setup results in tip Mach number 0.286 for the TMP and 0.325 for the DP. The propeller spacing in configuration 5(c) is selected to minimise performance losses due to aerodynamic interactions. Detailed specifications for all configurations are provided in Table 1.
${24.1^ \circ }$
. This setup results in tip Mach number 0.286 for the TMP and 0.325 for the DP. The propeller spacing in configuration 5(c) is selected to minimise performance losses due to aerodynamic interactions. Detailed specifications for all configurations are provided in Table 1.
Summary of the test condition used for the study of TMP and DP installed propulsion system
5.2 flow-field analysis
The interactions of the wake structures of the four configurations are presented using isosurfaces of instantaneous Q-criterion, in Fig. 6. In C1, the blade tip vortex, trailing edge vortex, root vortex, nacelle vortex and wing trailing edge vortex are all observed. The tip vortex follows a spiral path and convects downstream.
Flow visualisation of investigated configurations using Q-Criterion isosurfaces at ${\rm{Q}} = 0.1$
and coloured with pressure coefficient calculated using free stream velocity. Their test conditions are given in Table 1.
${\rm{Q}} = 0.1$
and coloured with pressure coefficient calculated using free stream velocity. Their test conditions are given in Table 1.
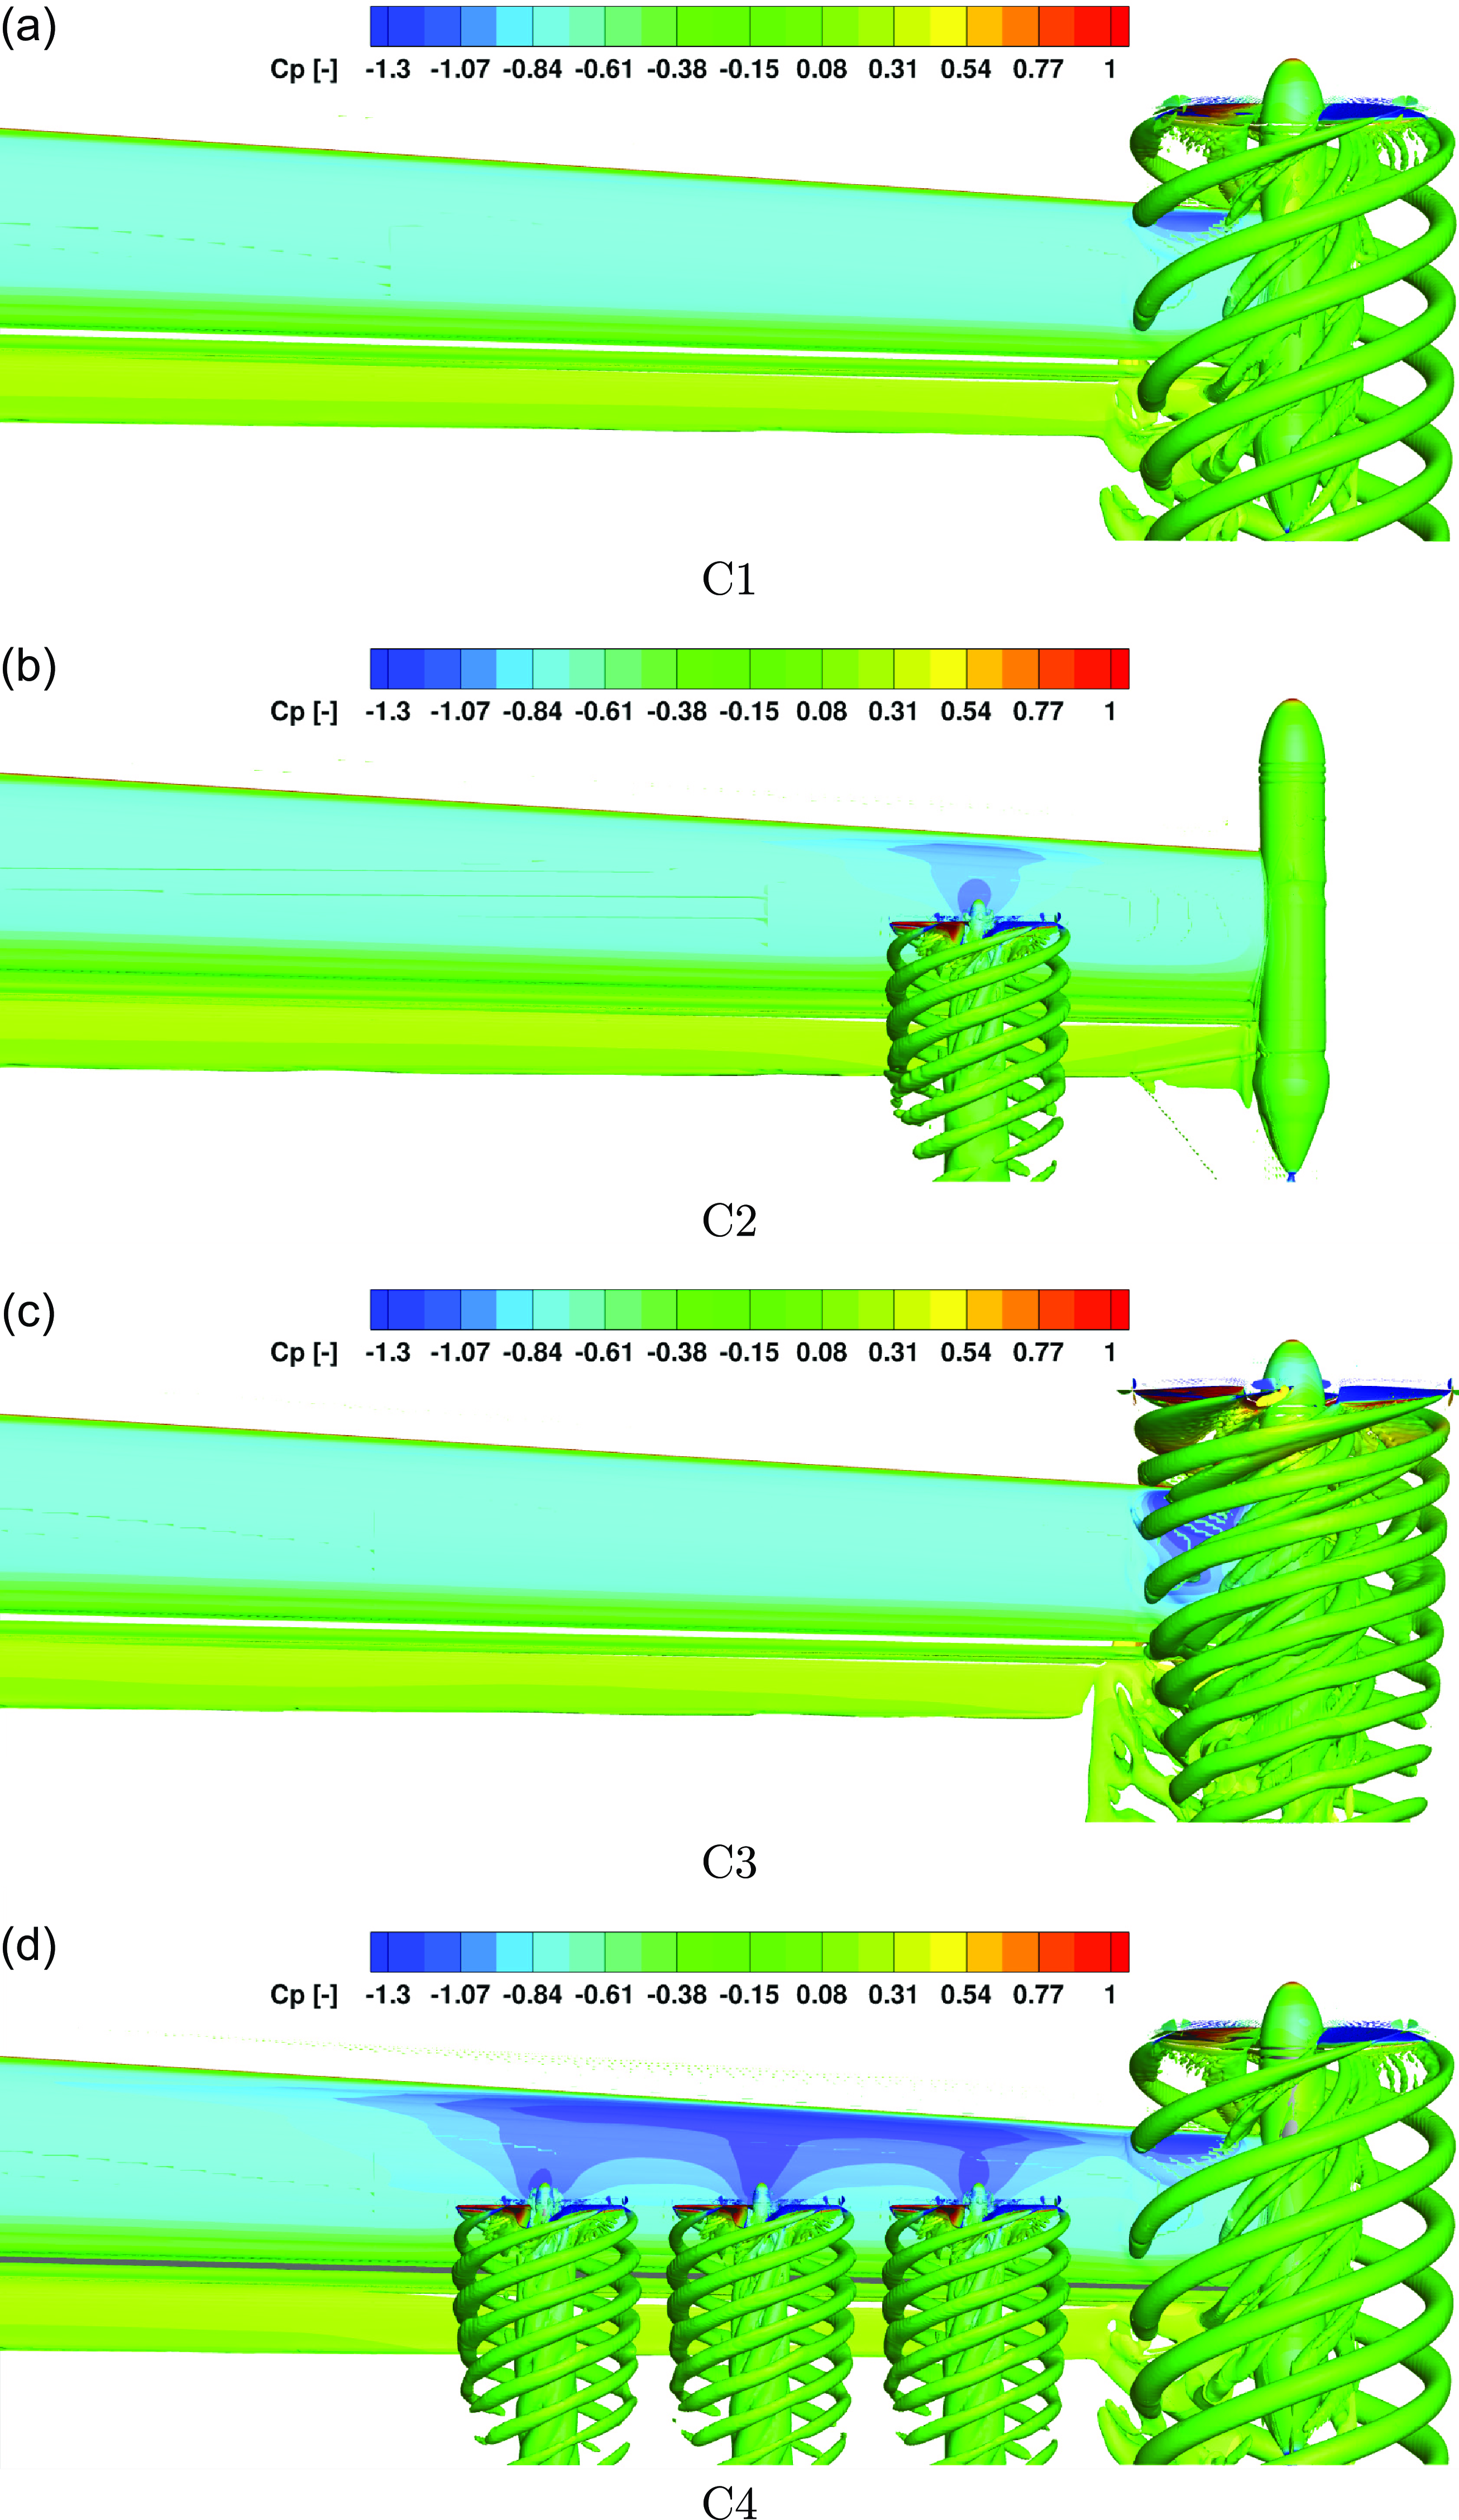
In the C2 configuration, a single OTW installed HLP shows more intense spiral structures due to its operation at higher speed. The nacelle and blade root vortices show a cylindrical shape with spirals moving downstream, and are as persistent as the tip vortices. The blade root and mid-span trailing edge vortices are mainly due to the non-uniform distribution of circulation on the propeller surface. There is no visible interference between the nacelles and the main wing wake. In addition, wingtip vortices are much weaker than the ones from the wing trailing edge and blades; hence, it is not visible in Fig. 6(b).
Moving to the C3 configuration, where the TMP is operating at a higher speed, and tip Mach number of 0.505, the most intense spirals are observed following a helicoidal path. Similar to the wing trailing edge around the spirals, a much stronger vortex sheet is formed due to the interactions with the spirals from TMP. This distortion leads to the vortices deteriorating faster.
When the TMP-DP system is simulated, the tip vortex structure is relatively similar to the C1 and C2 configurations since the configuration has been designed for minimal interactions from the different propellers. As an example, each propeller appears to be isolated from the rest.
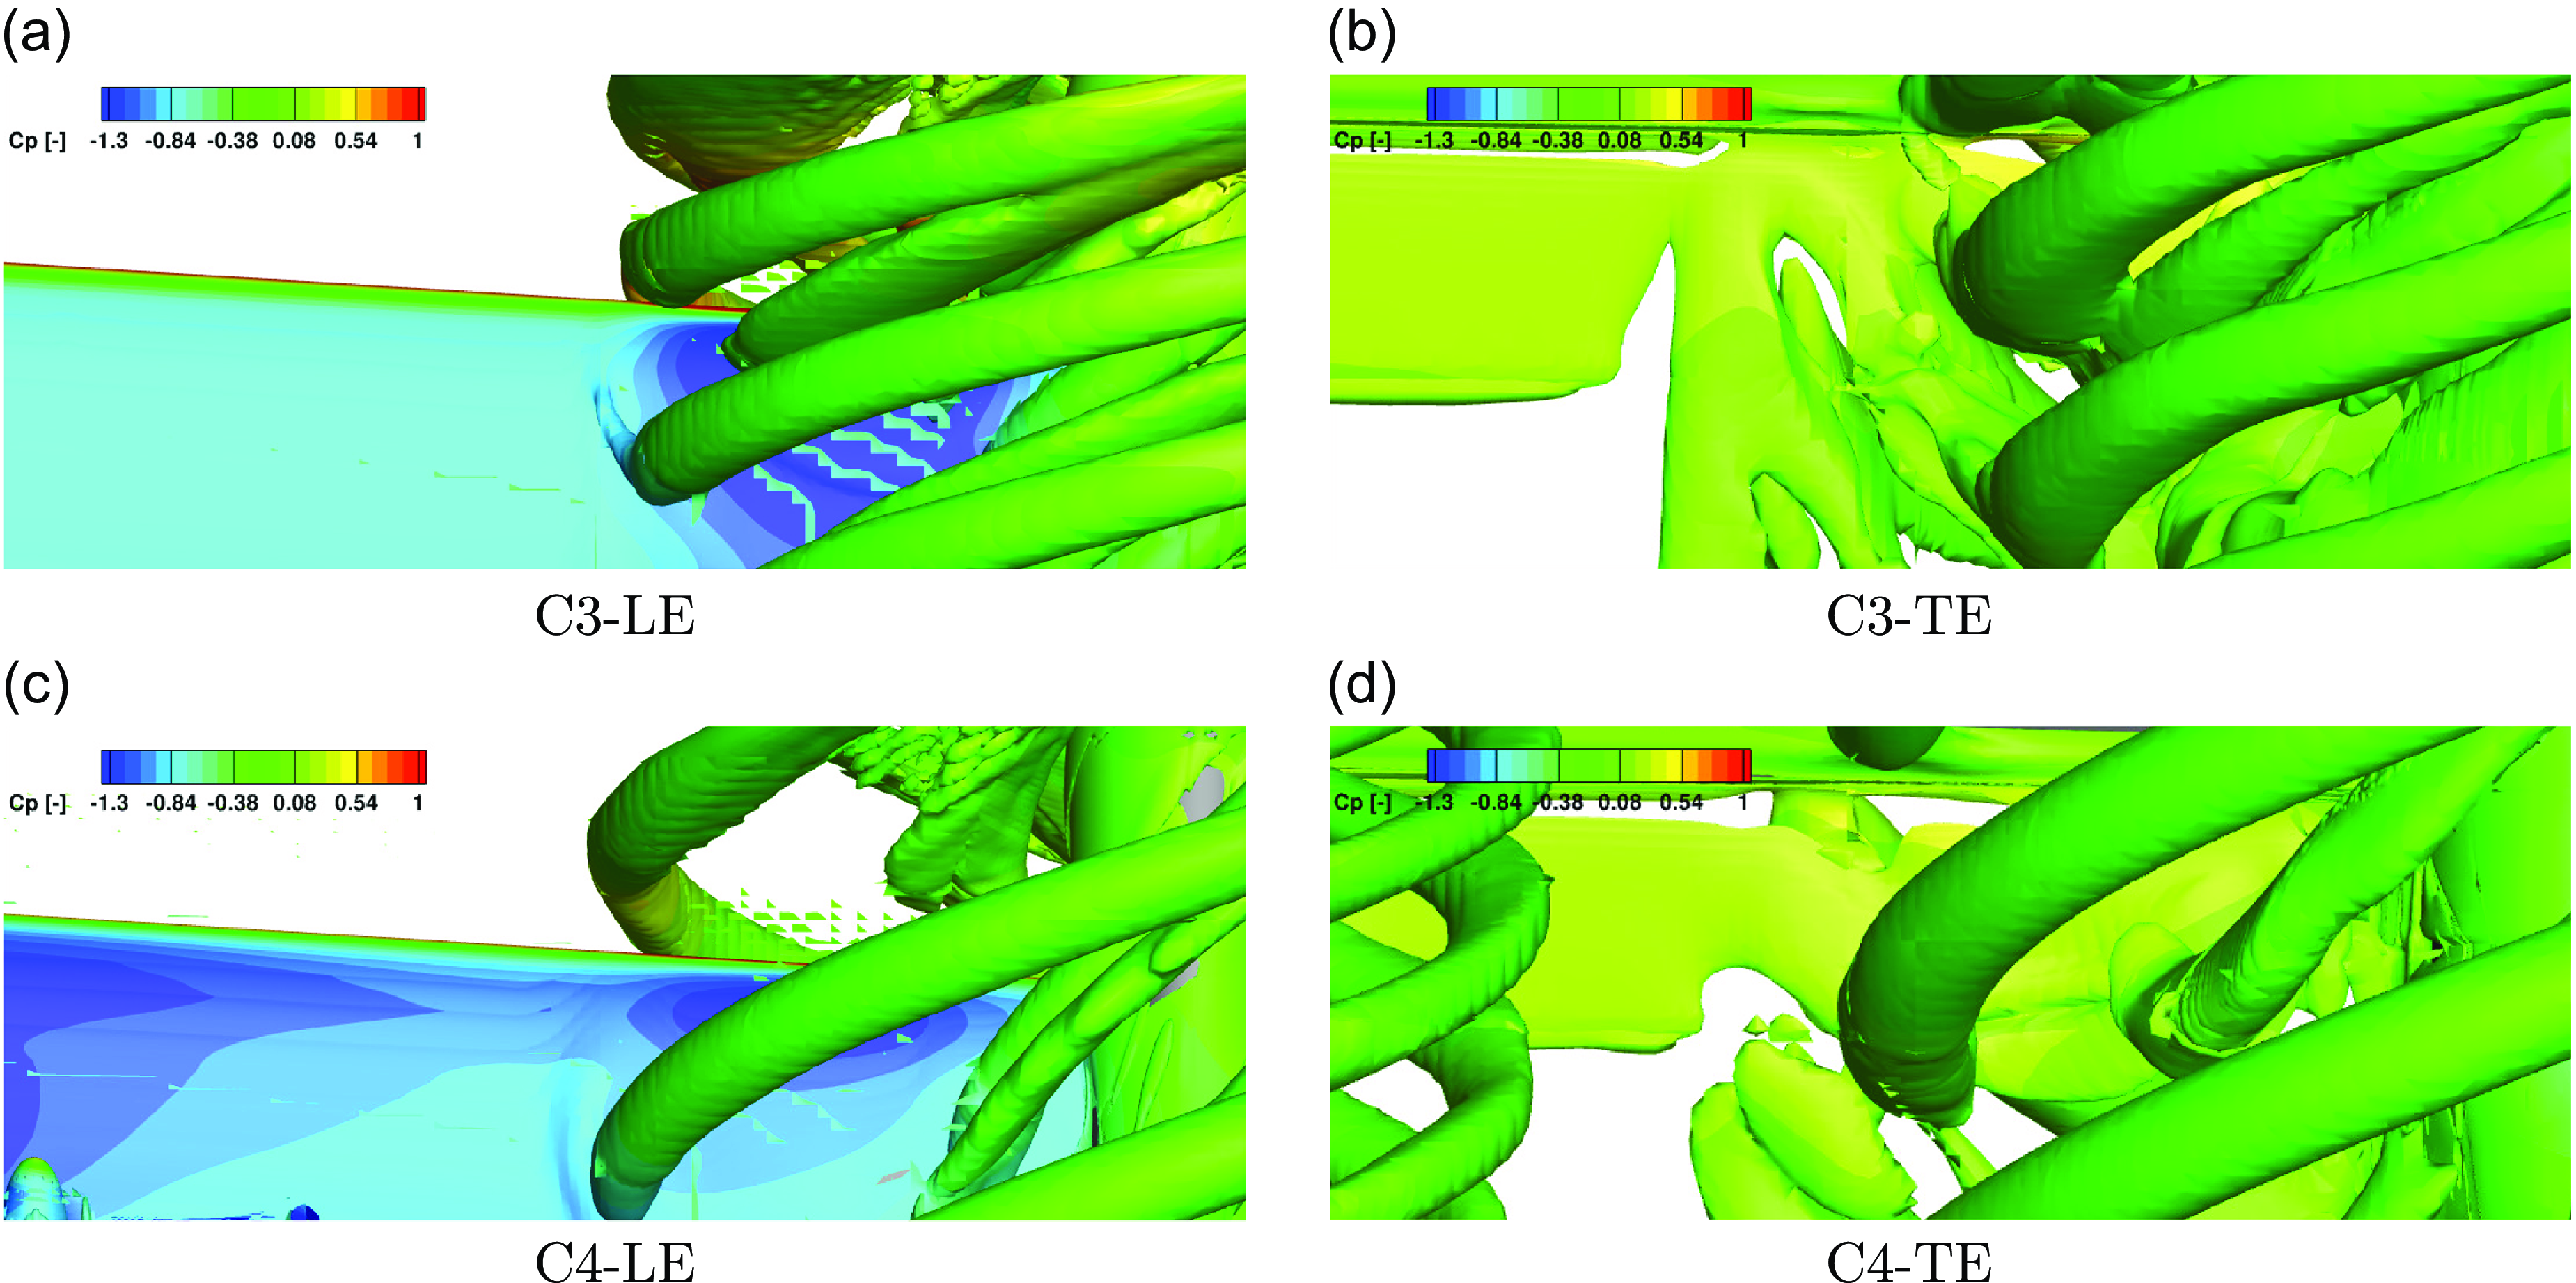
A more detailed flow visualisation of C3 and C4 configurations at LE and TE regions is shown in Fig. 7. It is observed that the C3 configuration has a stronger contraction of the wake in the TMP-only configuration. The wake of the TMP expanded more in the C4 configuration, as visualised in Fig. 7(c and d), which was caused by the TMP operating at a lower speed, and the installation of the OTW-DP system. In addition, both configurations at the TE region show the vortex sheet shedding from the wing trailing edge near the TMP slipstream region. This vortex sheet is evident in Fig. 8. It was also observed that the tip vortex at the upper side of the wing tends to move inner radii and the tip vortex at the lower side of the wing moves to outer radii.
Flow visualisation of C3 and C4 configurations at LE and TE regions using Q-Criterion isosurfaces at ${\rm{Q}} = 0.1$
and coloured with pressure coefficient calculated using free stream velocity. Their test conditions are given in Table 1.
${\rm{Q}} = 0.1$
and coloured with pressure coefficient calculated using free stream velocity. Their test conditions are given in Table 1.
The vorticity magnitude visualisation of the thrust equivalent C3 and C4 configurations.
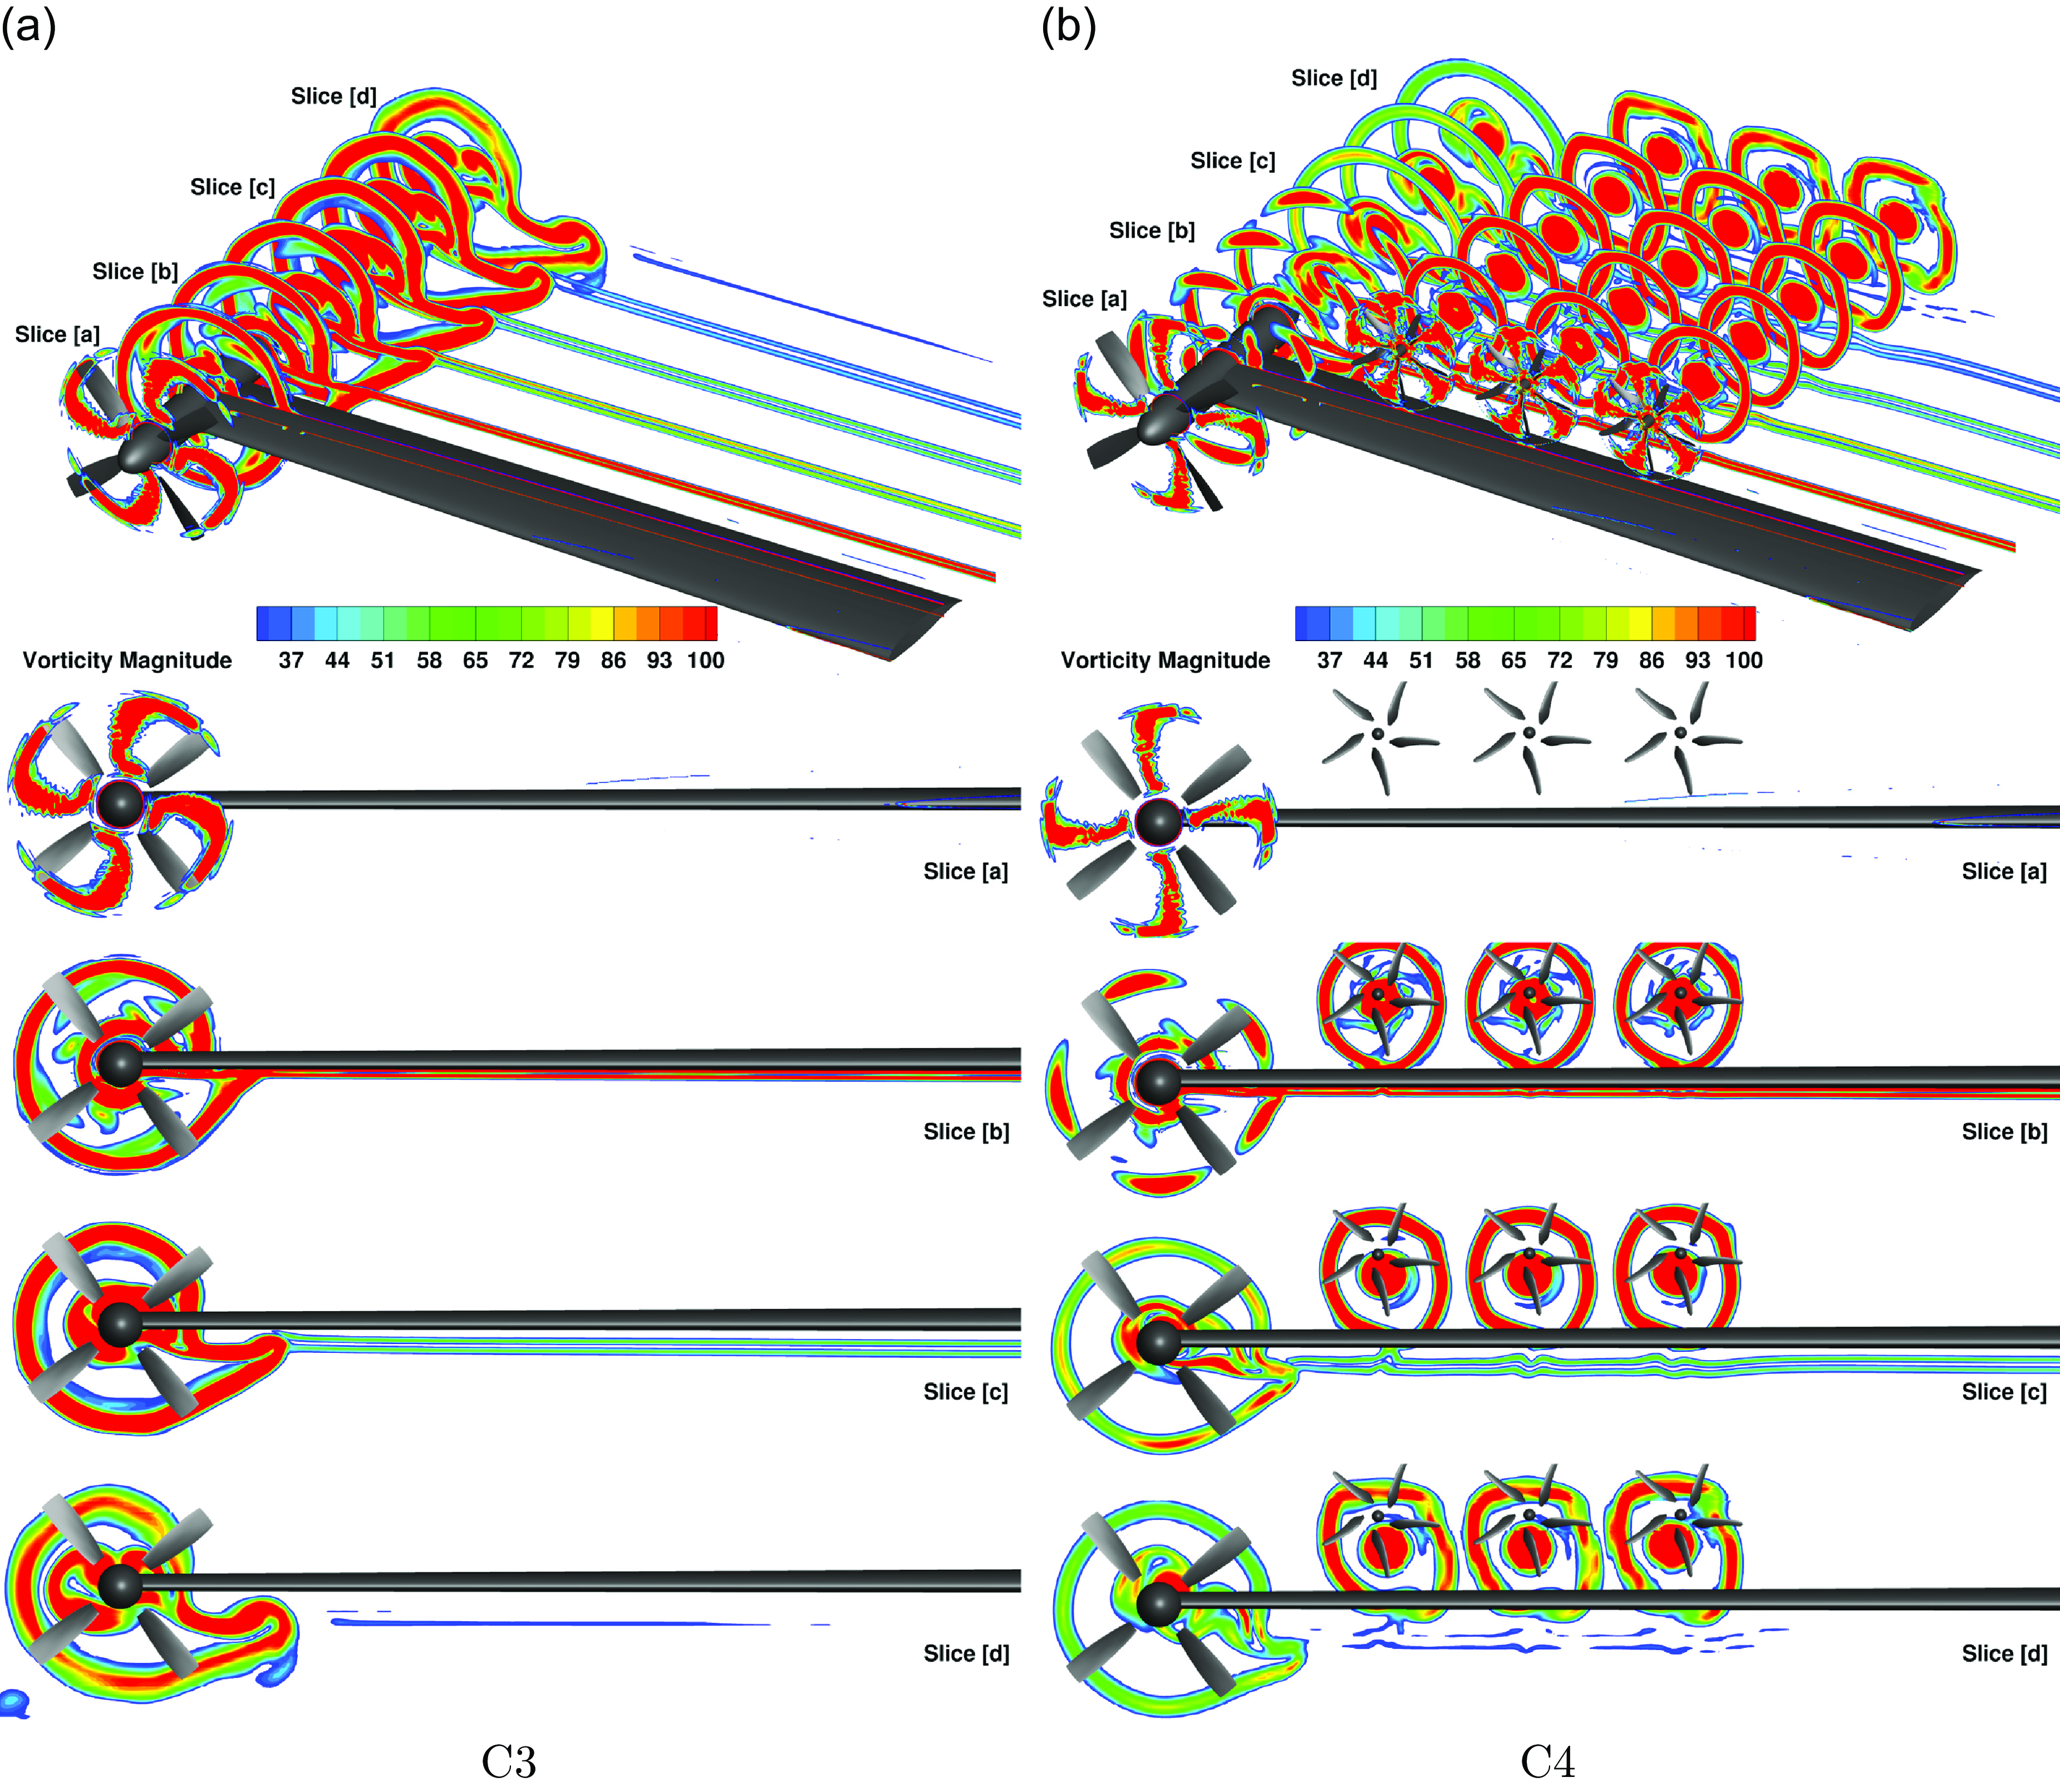
The visualisation of the vorticity presented in Fig. 8 to understand the different interaction mechanics and flow environments in these two configurations. An asymmetric vortex system is observed downstream. The near-field is dominated by strong tip and trailing edge vortices due to the higher local velocity at the blade tip and blade trailing edge, where the stronger blade root vortices were shed due to a higher twist at the blade root. The nacelle vortex can also be differentiated across all cases, especially in the C3 configuration. Vortex shedding from the wing with the blunt trailing edge also interferes with the TMP. Two major differences can be identified when comparing these two configurations.
First, the C4 configuration has a reduced vorticity magnitude of the TMP and shows earlier dissipation of the blade tip, trailing edge and root vortices, as depicted in Fig. 8(b). This reflects the different thrust each propeller is contributing. Slices [a] – [d] further show the paths of the wake; this suggests that the comparatively weaker wake from the TMP has a smaller impact on the wing. The vortices from the TMP in the C4 configuration indicate a higher degree of energy dissipation and tend to become more homogeneous propeller wakes than in the C3 configuration.
Second, the OTW installed DP system and their nacelles introduced additional vortices. Stronger vorticity can be seen in the DP system since it has a higher tip speed compared to the TMP system. The strength of the blade tip vortices is also reduced between the adjacent propellers due to the counter-rotating vortex system.
5.3 Wing loading and interactions
Examining the averaged surface pressure coefficient across different configurations, as depicted in Fig. 9, reveals that configurations C1 and C2 exhibit slightly lower suction pressures compared to C3 and C4. This difference is attributed to the single installed propeller operating at a lower speed in C1 and C2. In contrast, configuration C3 shows the highest suction pressure among all configurations, particularly when compared to C1. This result indicates that a larger and more intense suction region is formed behind the TMP due to higher induced velocities. Consequently, the TMP in C3 significantly enhances lift generation from the wing.
Averaged pressure coefficient of investigated configurations.

In the C4 configuration, which includes both TMP and DP systems, a suction area similar to that in C1 is observed, as the TMP operates at the same speed. However, there are minor effects from the DP installation in the region behind the TMP. Compared to C2, the DP system in C4 exhibits an expanded suction region, highlighting favourable interactions with the DP system. Within the DP system, the most significant suction region appears around the middle propeller, benefiting from the slipstream generated by the adjacent propellers. The interaction between the TMP and DP systems also results in favourable aerodynamic effects, as indicated by the suction profile in the TMP-DP system.
The effect of the pressure coefficient on the wing from different configurations alters the lift distribution along the wing span, as illustrated in Fig. 10. In the C3 configuration, a sharp peak in lift distribution is observed behind the tip region of the TMP, caused by higher induced velocities. In contrast, this peak is significantly diminished in the C1 configuration, due to the lower induced velocities. In C2, an increase in wing performance is evident, particularly with a lift increase at the propeller installation point. The C4 configuration shows a marked improvement in lift generation, featuring a reduced spike behind the TMP, and there is no significant lift drop seen between OTW propellers, resulting in a more uniform lift distribution. This uniformity is attributed to the beneficial effects of the DP system, which enhances the aerodynamic performance of the wing.
Time-averaged wing lift distributions of investigated configurations.
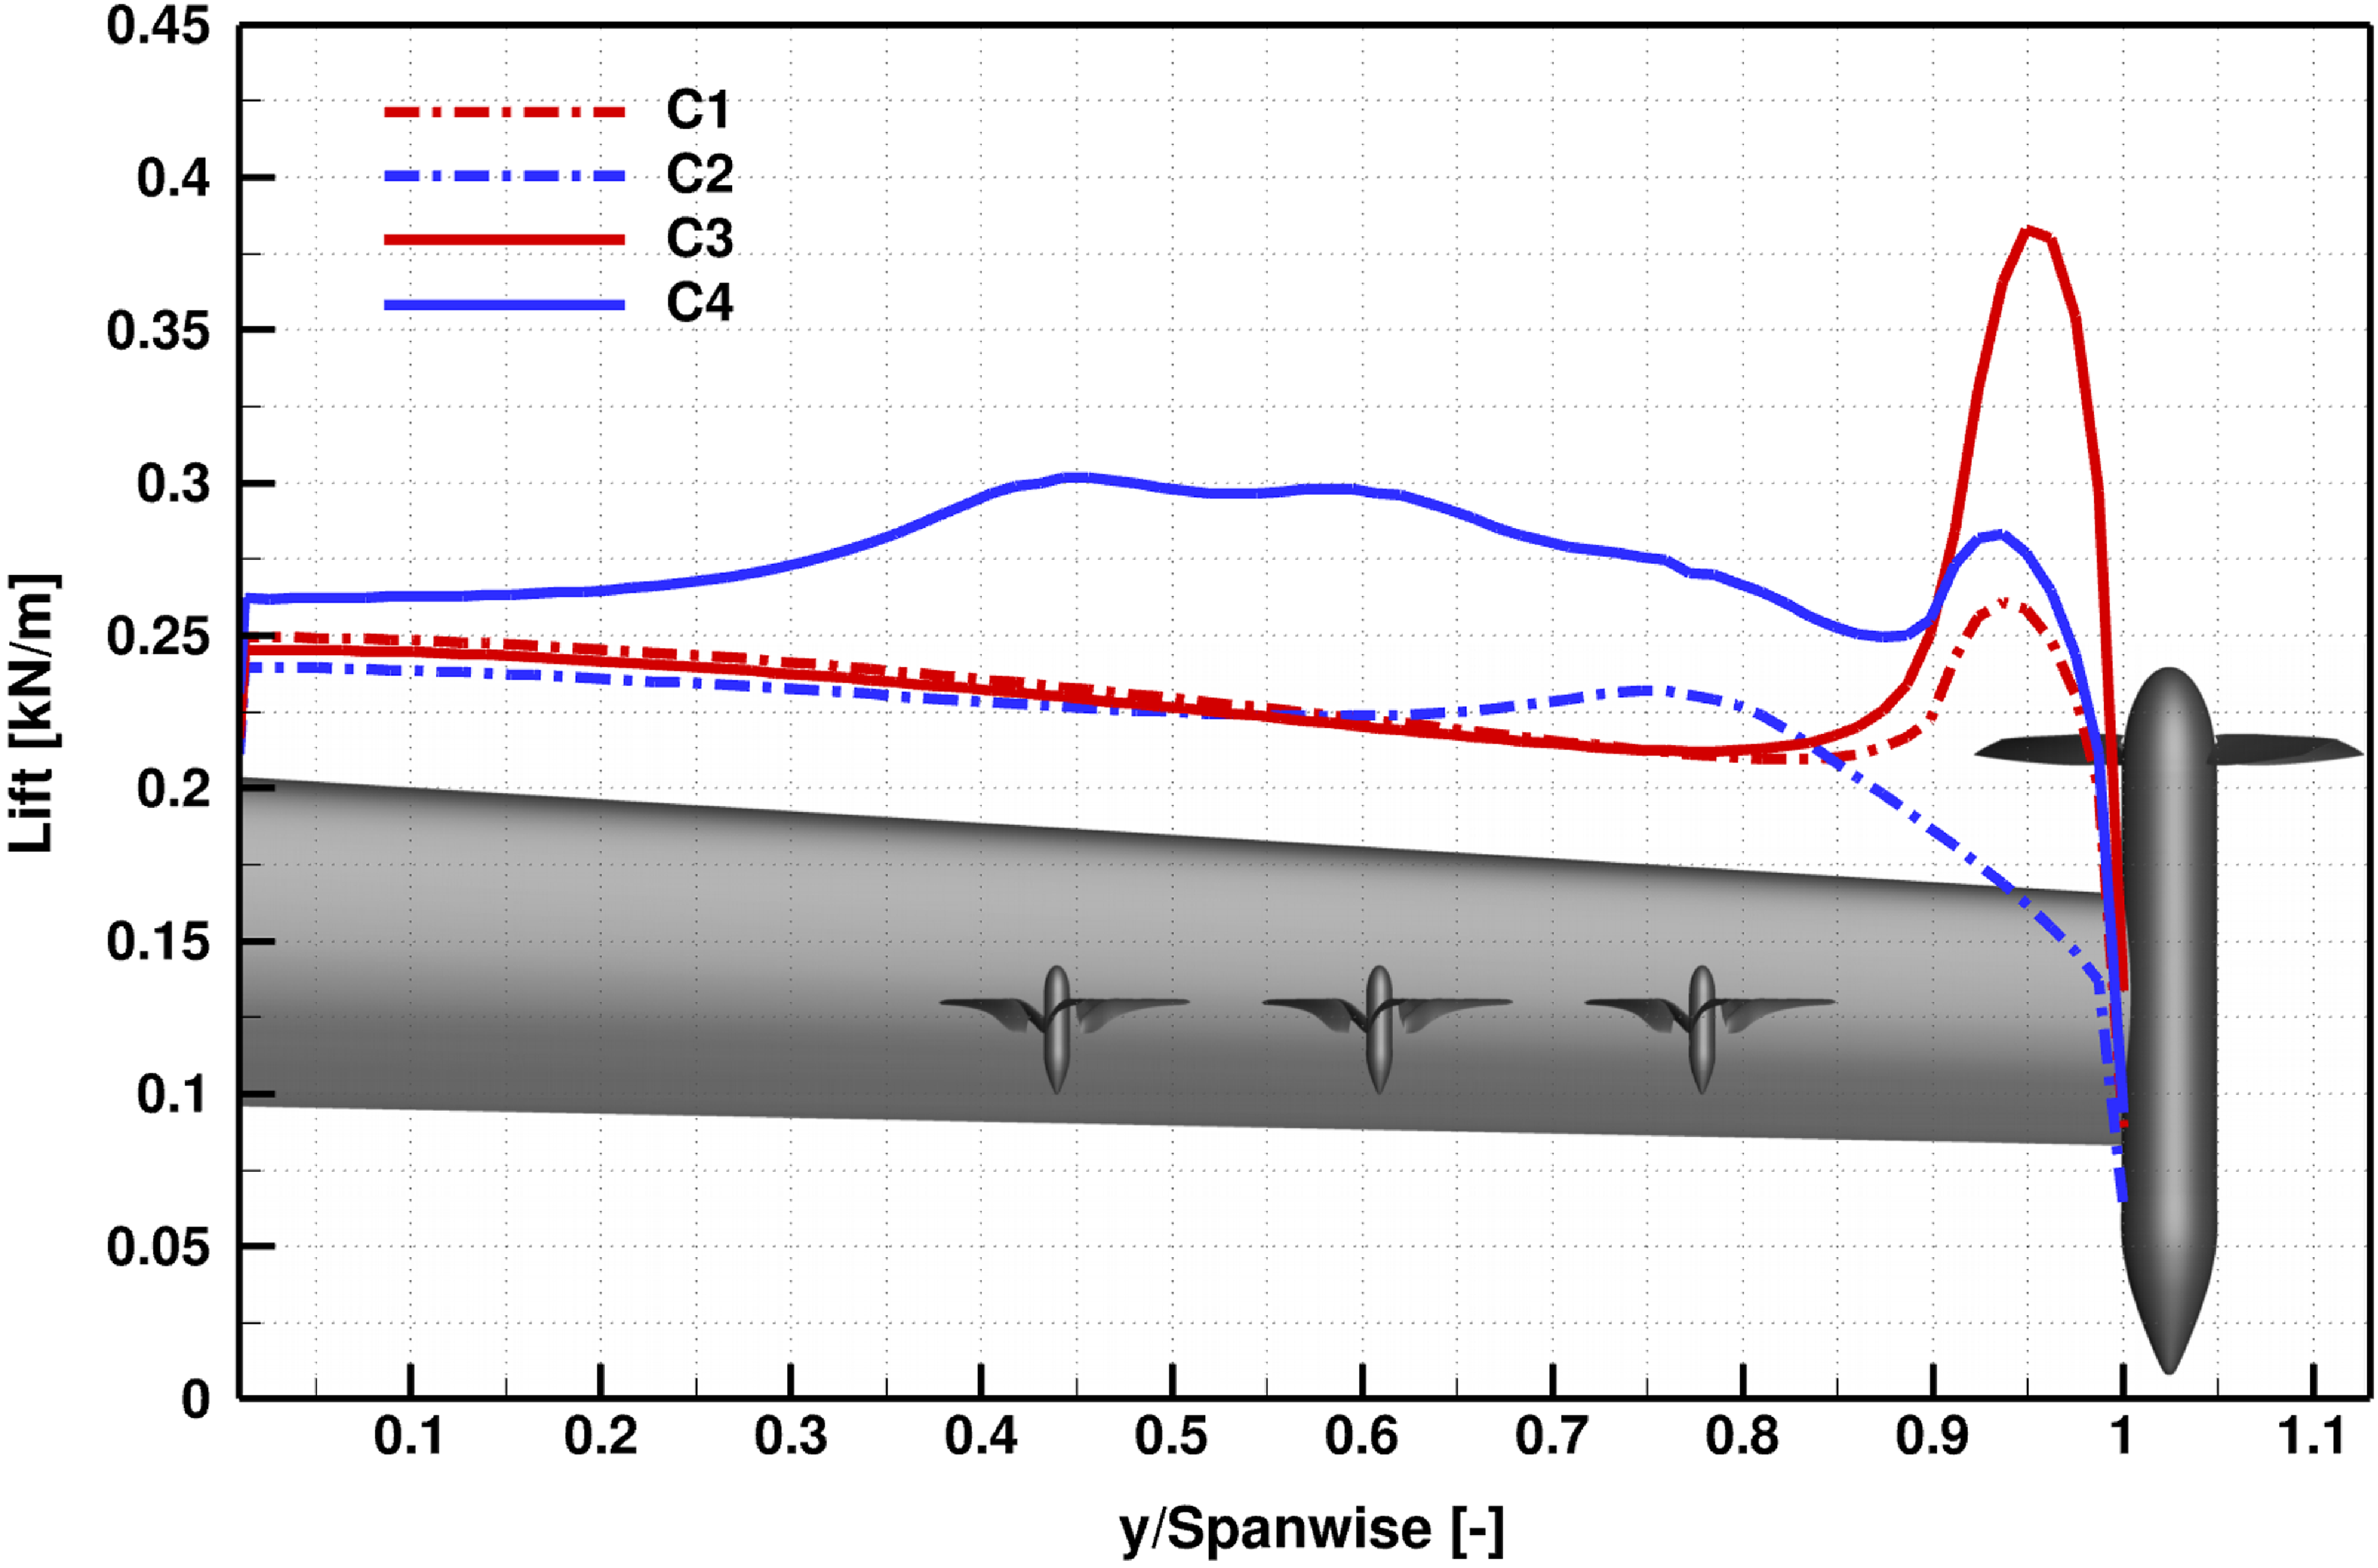
The propellers in the DP system create a distinct flow environment that benefits the wing. This design results in a smooth, high-lift spike originating from the innermost propeller. Overall, the relatively smooth lift distribution observed in the C4 configuration, as compared to the C3 configuration, indicates a favourable wing lift distribution achieved by the TMP-DP system.
5.4 Propeller blade loading and interactions
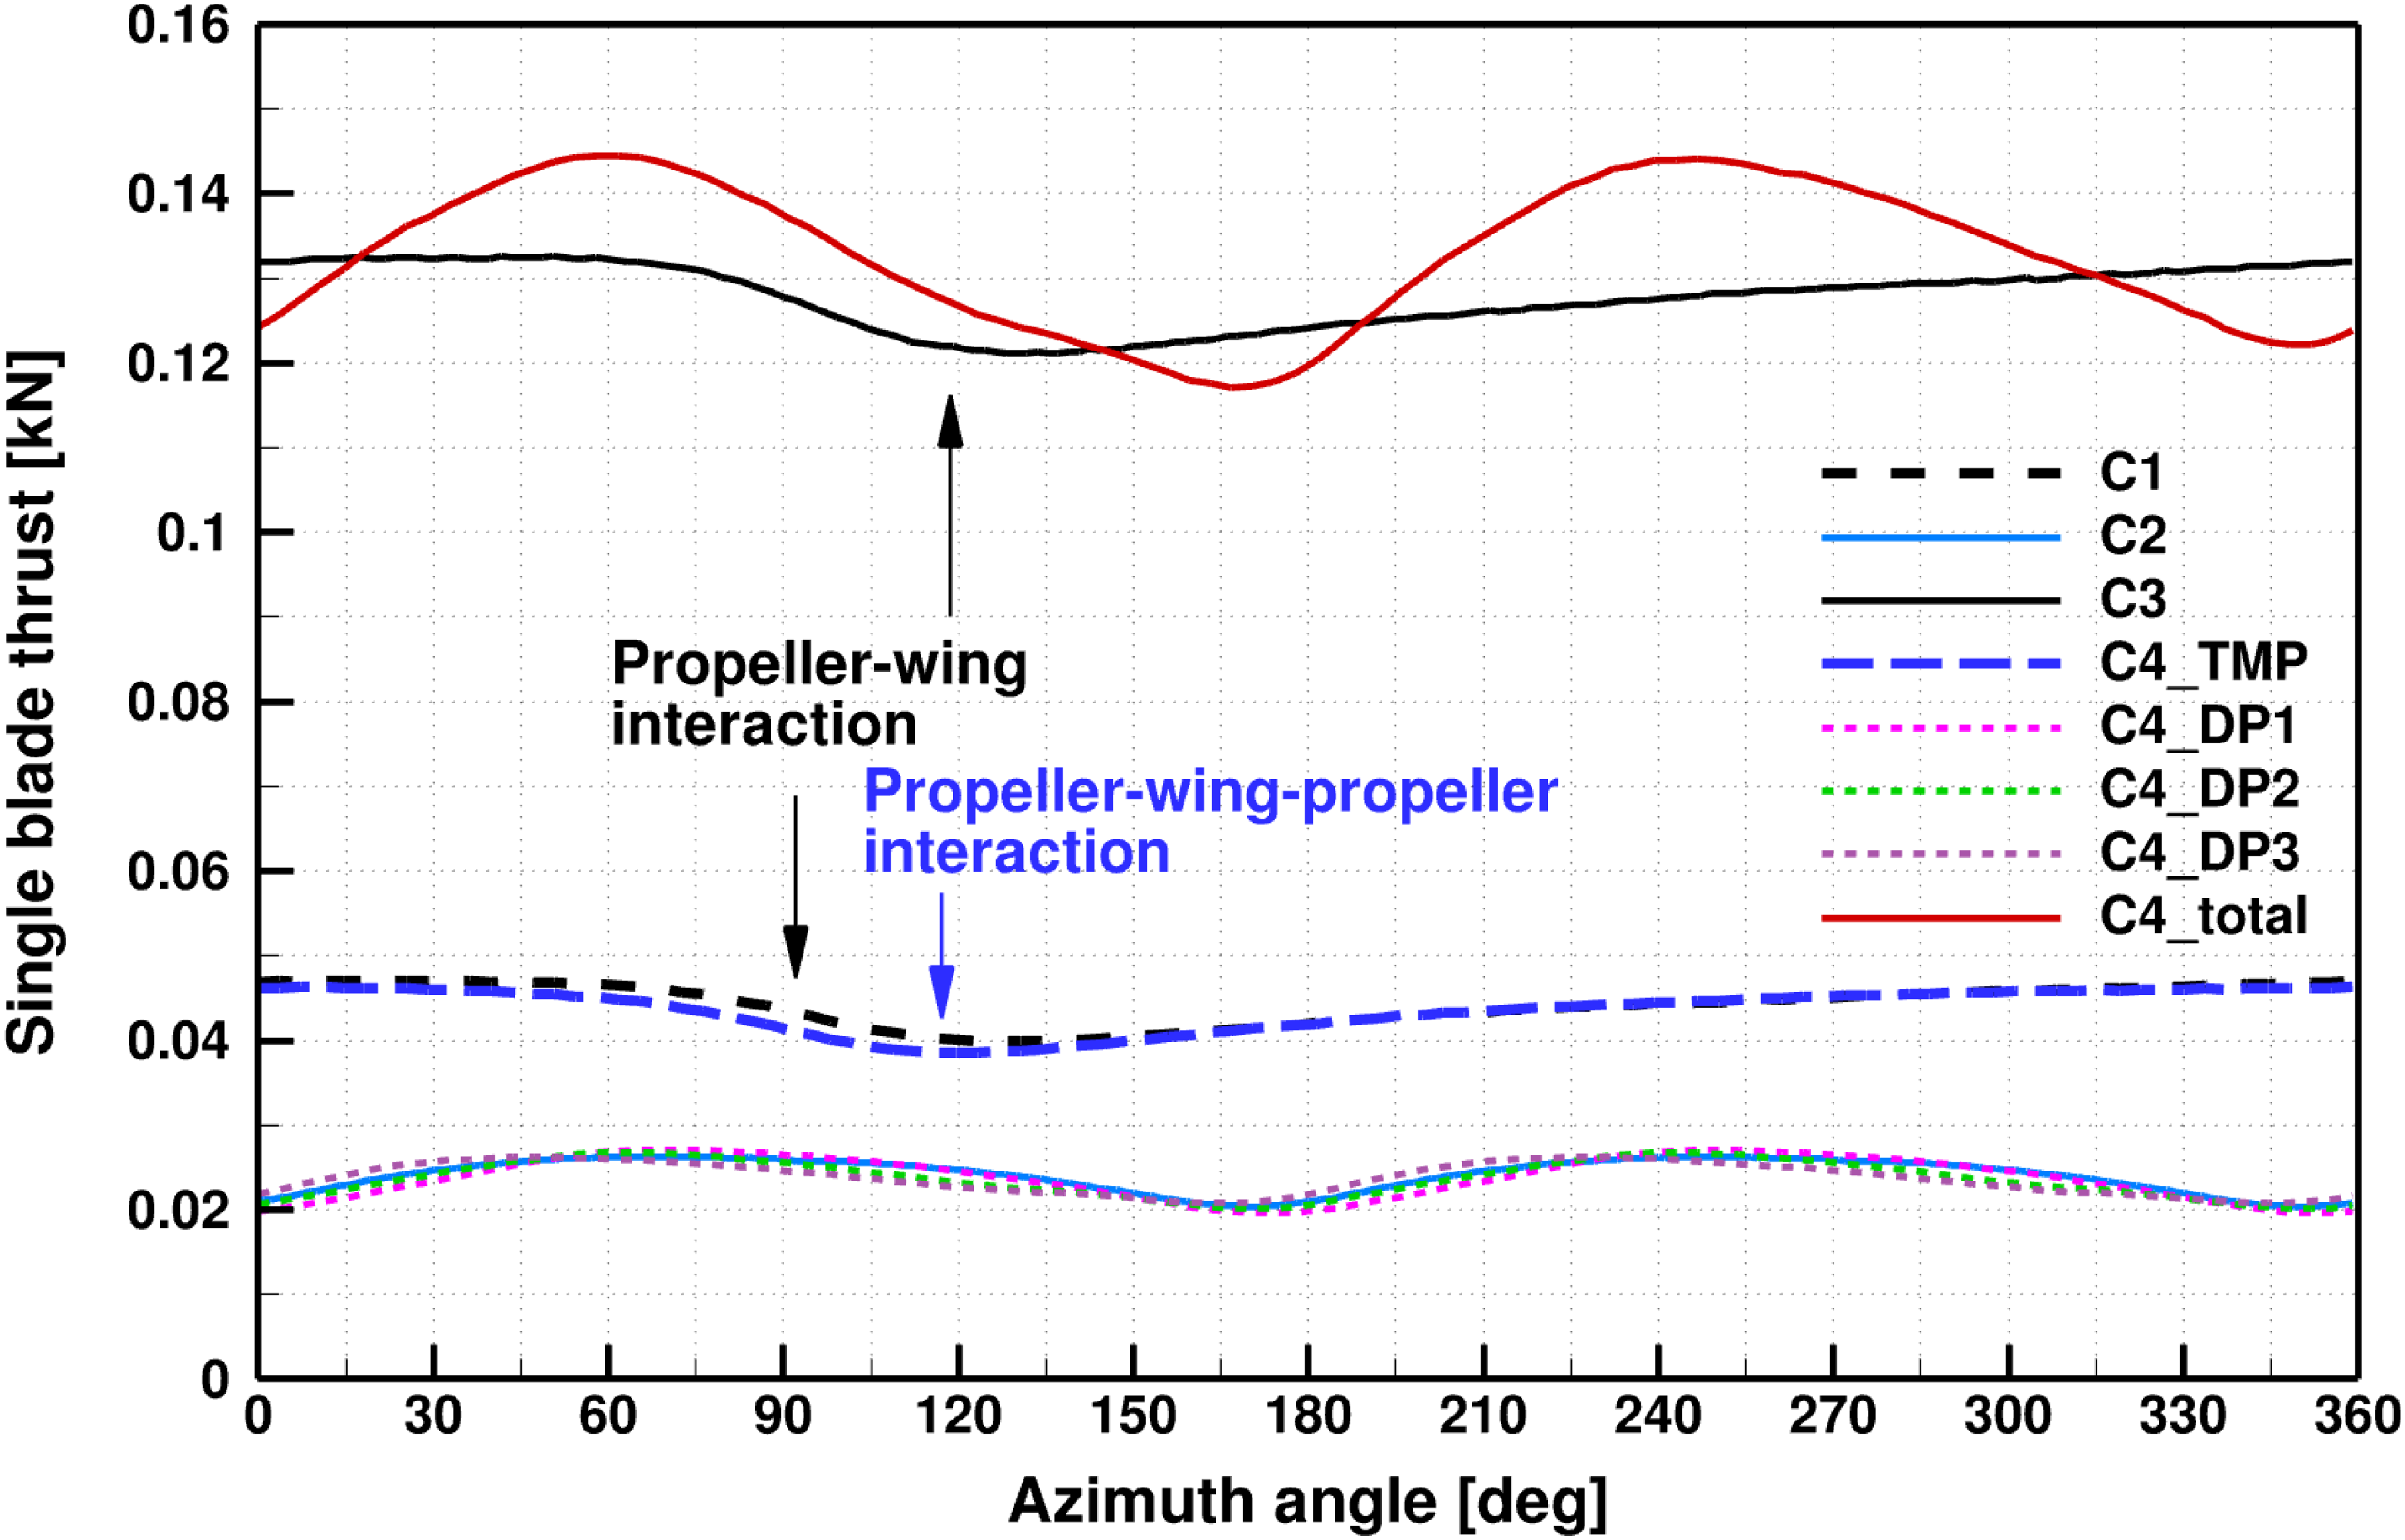
Figure 11 illustrates the variation in single blade thrust over the full azimuth, scaled according to the tip-mounted propeller. The data reveal a performance drop in the tip-mounted, propeller-only configurations, specifically in C1 and C3. This reduction in performance occurs as the blade passes near the wing. From configuration C1 to C3, the performance loss and the extent of the affected region increased. This trend is due to the higher tip velocity in configuration C3, which amplified unsteady loads resulting from the interaction between the propeller and the wing, as shown in Fig. 11 with the thrust drop at azimuth angle around ${120^ \circ }$
.
${120^ \circ }$
.
Comparing the single-installed HLP with the distributed HLP, as represented by configurations C2 and C4, the setup involving distributed propellers demonstrates limited performance degradation due to the multi-propeller system. This is particularly evident with the second and third propellers, which are positioned sufficiently far from the TMP downwash. Notably, two peaks in performance are observed, corresponding to the distributed HLPs operating at twice the speed of the TMP due to their smaller radius. Placing the distributed propeller 1.1 ${D_{TMP}}$
behind the TMP, with a tip-to-tip distance of 0.2
${D_{TMP}}$
behind the TMP, with a tip-to-tip distance of 0.2 ${D_{TMP}}$
, is effective in mitigating significant performance losses from installation effects. Furthermore, when examining the total thrust loads of the C4 configuration, the overall thrust performance is enhanced, with the two peaks preserved, thanks to the additional thrust contribution from the distributed propellers.
${D_{TMP}}$
, is effective in mitigating significant performance losses from installation effects. Furthermore, when examining the total thrust loads of the C4 configuration, the overall thrust performance is enhanced, with the two peaks preserved, thanks to the additional thrust contribution from the distributed propellers.
The thrust generated by the installed propellers varies across different configurations and conditions. Figure 12 presents the thrust distribution for all four configurations. The propellers exhibit asymmetric loads in all investigated cases, with variations depending on the configuration and operating conditions.
Single-blade thrust variations from investigated configurations.
Propeller thrust distribution from investigated configurations. (Rotation in counter-clockwise as seen from upstream.)
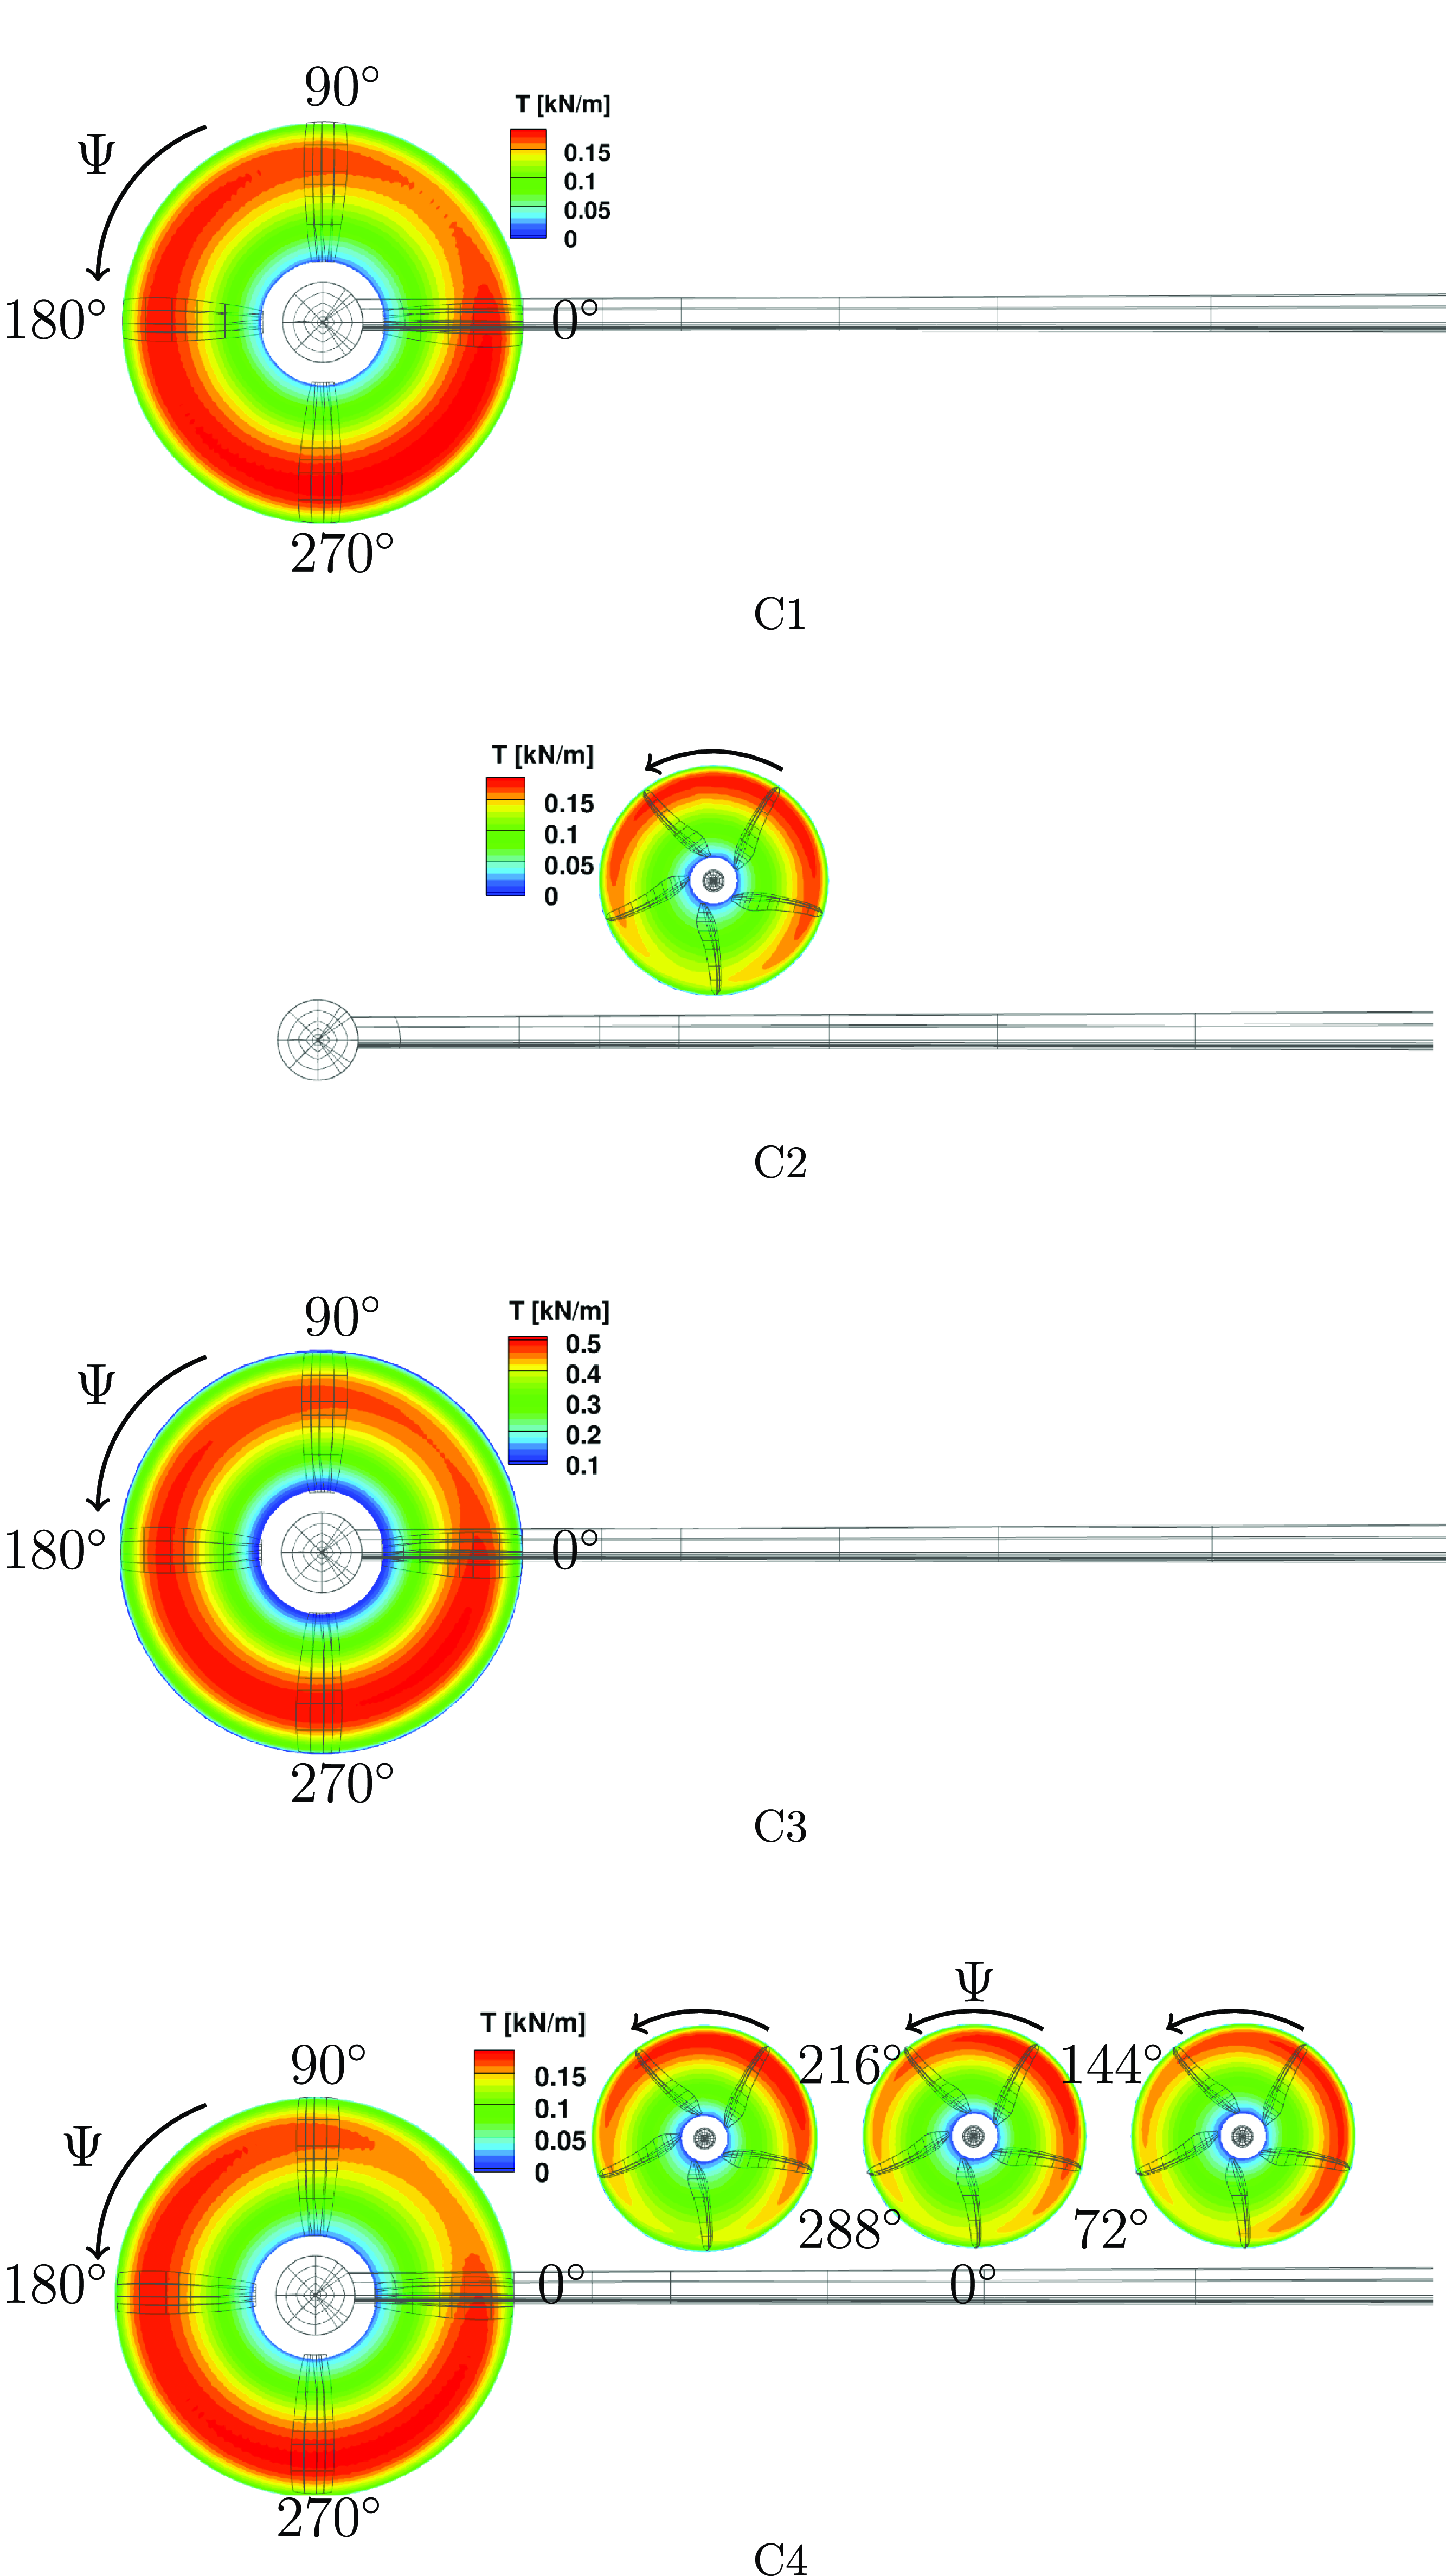
Figure 12(a) shows the thrust generated by the C1 propeller at different azimuth angles. It reveals that the TMP produces less thrust between azimuth angles of ${0^ \circ }$
and
${0^ \circ }$
and ${90^ \circ }$
. Similarly, Fig. 12(c) demonstrates a expanded reduction in thrust for the TMP between azimuth angles of
${90^ \circ }$
. Similarly, Fig. 12(c) demonstrates a expanded reduction in thrust for the TMP between azimuth angles of ${0^ \circ }$
and
${0^ \circ }$
and ${135^ \circ }$
.
${135^ \circ }$
.
This reduction is primarily attributed to two adverse effects: the asymmetric blade/disc effect, known as the P-factor, and propeller-wing interactions. The P-factor is an aerodynamic phenomenon observed in a rotating propeller, where the centre of the propeller thrust shifts off-centre when the aircraft operates at a high angle-of-attack. This phenomenon has two primary effects, especially when the propeller disc is slightly tilted toward the horizontal plane.
First, as the propeller rotates, the descending blade moves forward, experiencing a greater forward speed, while the ascending blade moves backward, resulting in a lower forward speed. Consequently, the descending blade generates more thrust than the ascending blade.
Second, the effective angle-of-attack increases for the descending blade and decreases for the ascending blade due to the tilt of the propeller disc. This difference further amplifies the thrust produced by the descending blade.
The increased forward speed of the descending blade slightly reduces its effective angle-of-attack, but the overall tilt of the propeller disc enhances the total effective angle-of-attack. This leads to higher flow velocity and an increased effective angle-of-attack, resulting in greater thrust production by the descending blade.
In the C4 configuration, Fig. 12(d) indicates asymmetric thrust due to installation effects. Performance loss is observed when the HLP is positioned close to the wing between azimuth angles of ${288^ \circ }$
and
${288^ \circ }$
and ${72^ \circ }$
. Comparing the single installed HLP in Fig. 12(b) with the distributed HLPs in Fig. 12(d), the HLP adjacent to the TMP experiences a thrust loss between azimuth angles of
${72^ \circ }$
. Comparing the single installed HLP in Fig. 12(b) with the distributed HLPs in Fig. 12(d), the HLP adjacent to the TMP experiences a thrust loss between azimuth angles of ${72^ \circ }$
and
${72^ \circ }$
and ${216^ \circ }$
, indicating that the combined effects increase the induced velocity in that region and slightly reduce the propeller performance at the stated azimuth angles. Around
${216^ \circ }$
, indicating that the combined effects increase the induced velocity in that region and slightly reduce the propeller performance at the stated azimuth angles. Around ${0^ \circ }$
, the HLPs shows slight unloading due to interactions with the TMP, wing and the other HLPs.
${0^ \circ }$
, the HLPs shows slight unloading due to interactions with the TMP, wing and the other HLPs.
Compared to the other two installed HLPs, the azimuths with higher thrust loads shift in a clockwise direction, while those experiencing performance loss tend to recover due to varying interaction mechanisms. This shift is attributed to the fact that the inboard propeller interacts primarily with the adjacent propeller and wing. Additionally, the increased wing chord length may lead to different levels of boundary layer ingestion.
5.5 Component performance analysis
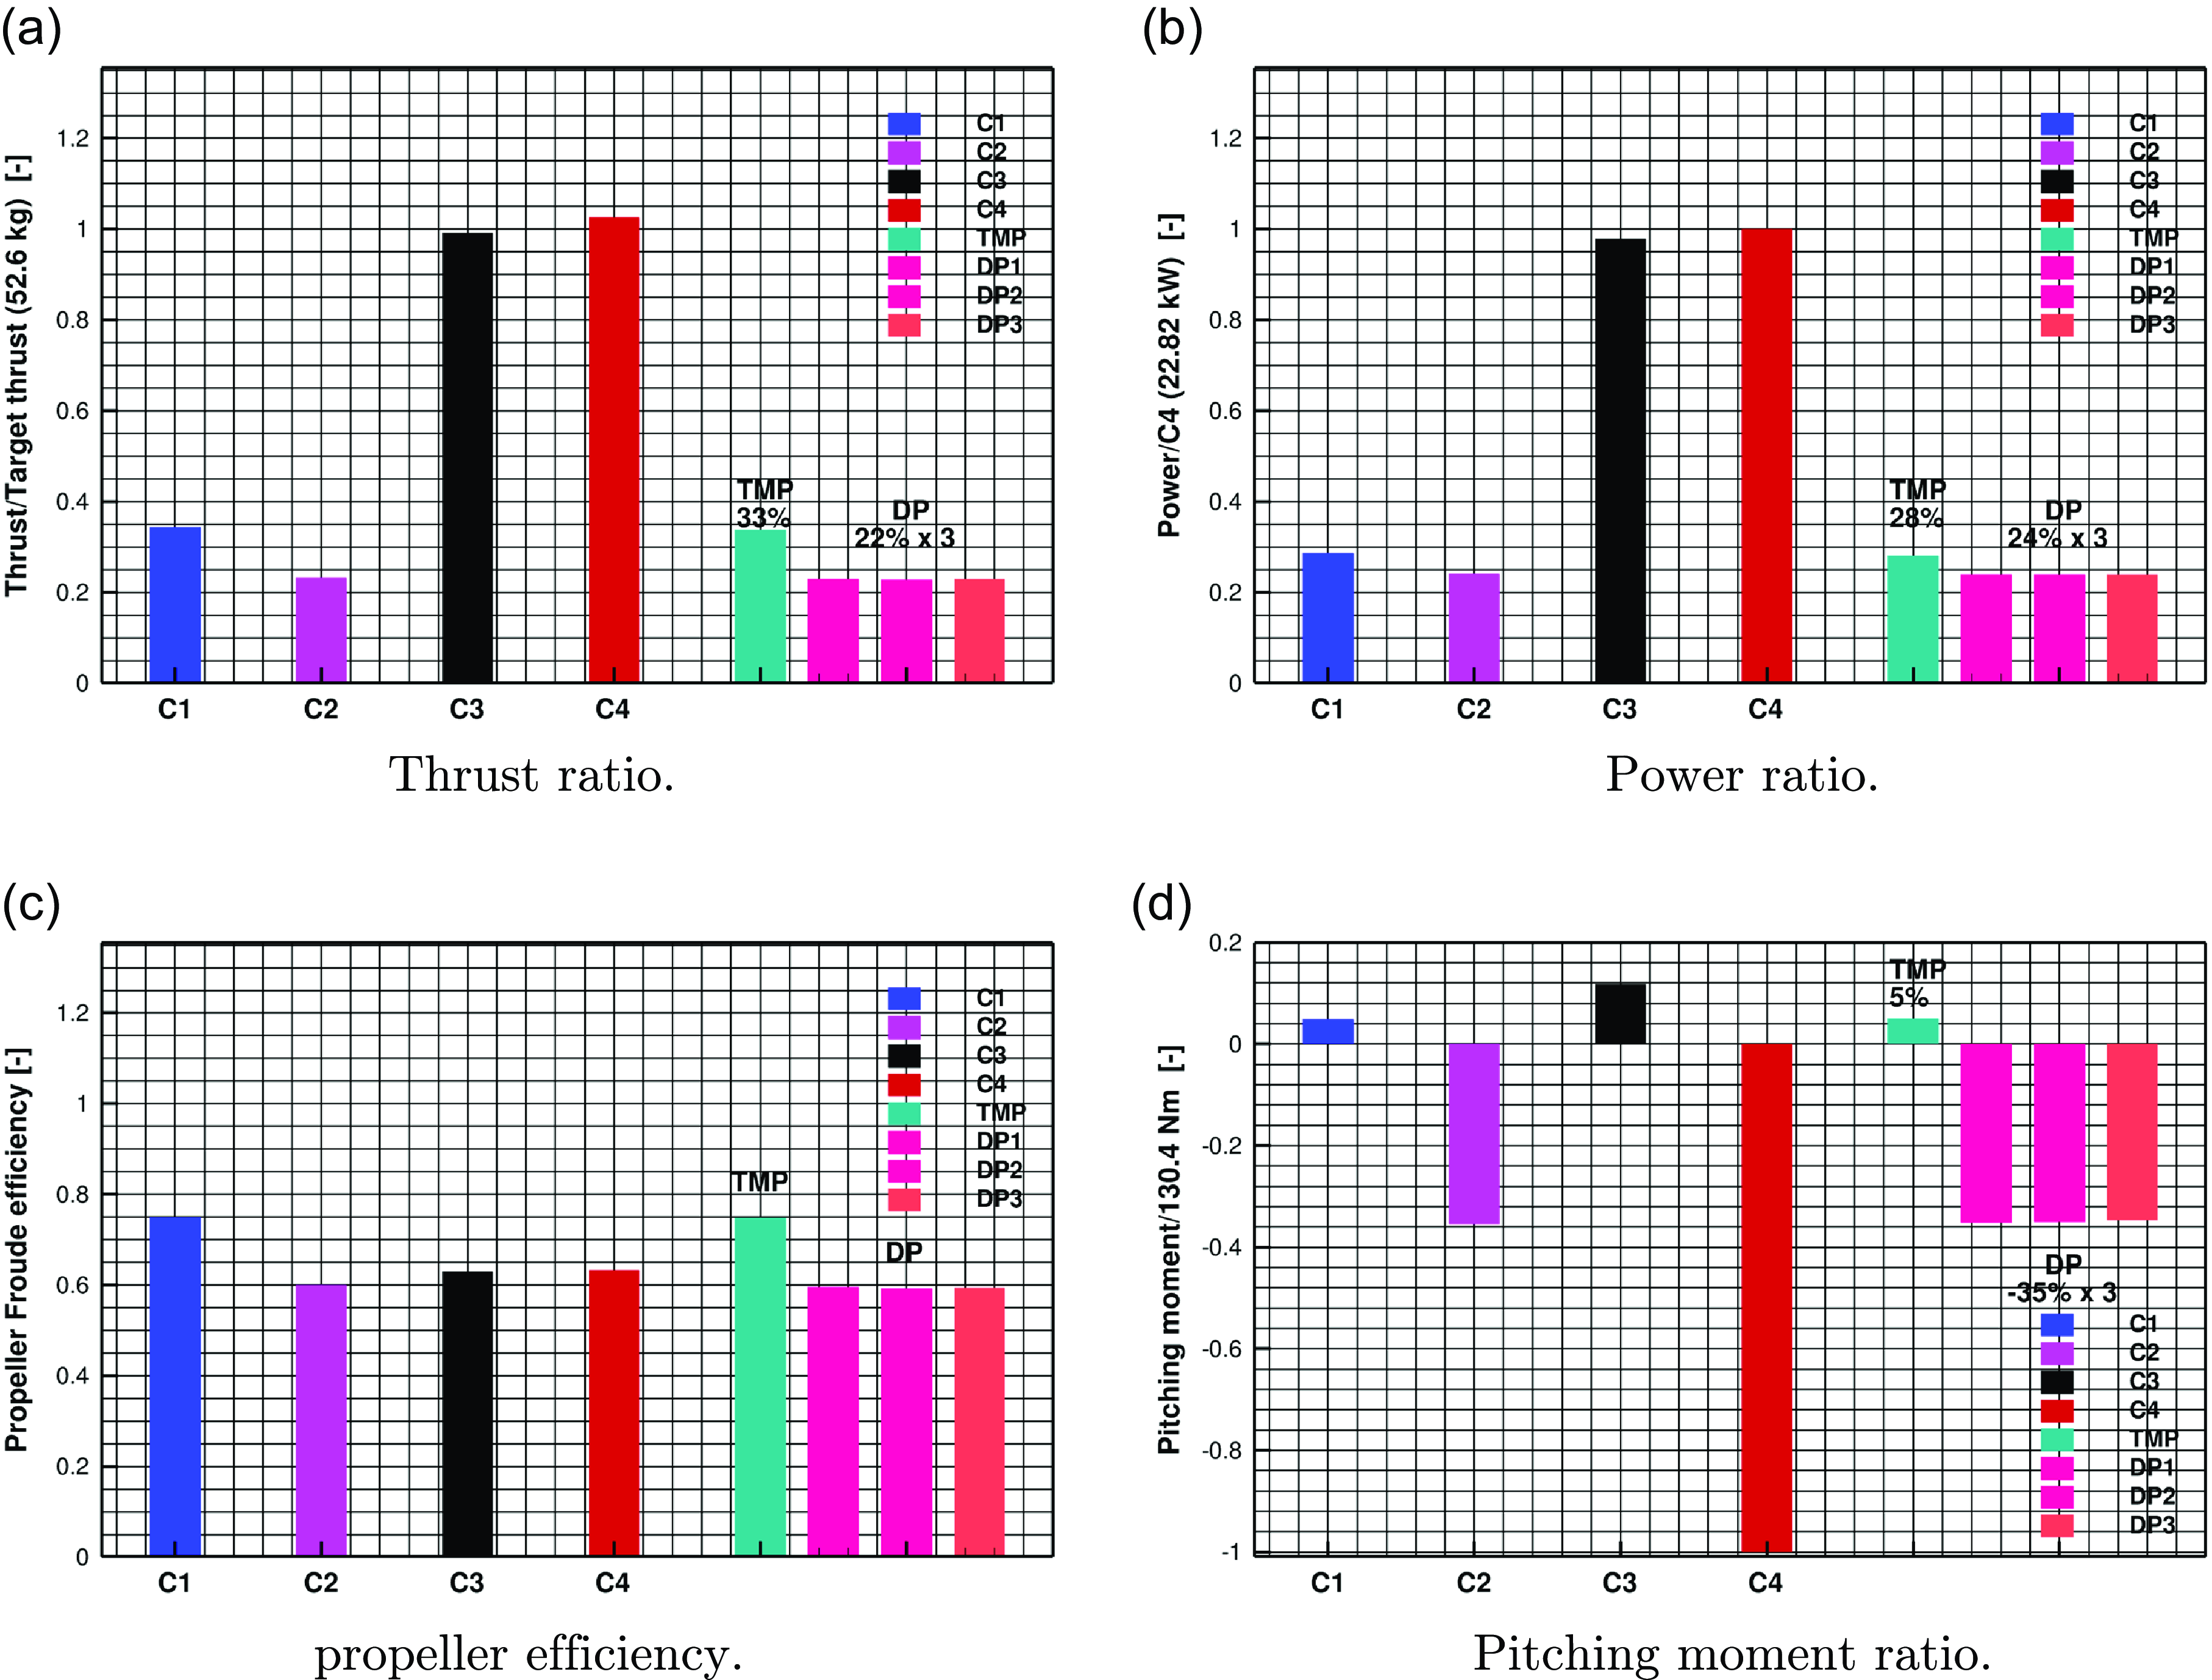
The contribution of thrust, power, efficiency and pitching moment is presented in Fig. 13 for all configurations and their components. Fig. 13(a), shows that TMP produces slightly more thrust than the HLP in the current setting, increasing the propeller speed from 1850 RPM to 3,264 RPM has more than double the thrust generation, where the C4 configuration with the TMP-DP design produces a slightly more thrust compared to the equivalent C3 (TMP-only) configuration. The contribution of each component within the C4 configuration shows that the TMP contributes about 33% of the thrust and the DP system contributes by about 66%. There is no significant performance loss within the TMP-DP system due to the aerodynamic interactions in the current design. The power distribution is seen in Fig. 13(b), the increase of thrust generation resulting from a higher power requirement. Within the C4 (TMP-DP) configuration, the TMP required 28% of the total power, and the DP system requires the rest of the 72% of the total power. The difference in thrust and power contribution is also reflected by the propeller efficiency distribution, in Fig. 13(c). It also indicated that the TMP is more efficient by operating at the lower speed condition in C1, but C4 has a 0.5% higher propeller efficiency and also produces 3.5% of additional thrust than the C3. In the current design, with the reduced unfavourable aerodynamic interactions, there is no harm to the performance by introducing the C4 (TMP-DP system). In addition, Fig. 13(d) shows that increasing the operating speed of the TMP would leads to an increase in nose up pitching moment (positive value), but the C4 configuration has a much larger nose-down pitching moment, which is mainly contributed by the OTW installed DP system. However, this can be balanced within the propulsion system by changing the position of the DP system, increasing and reducing the thrust contribution from the TMP and DP systems, respectively, or by a net balancing at the full vehicle level.
Overall and individual component performance comparisons of four configurations.
5.6 Overall performance analysis
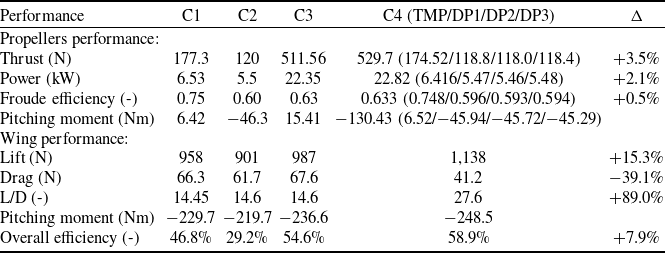
The performance of the overall system for equivalent configurations is presented in Fig. 14. The TMPDP configuration exhibits the highest lift among the configurations studied. Variations in thrust for the tip-mounted propellers have a lesser impact on the lift and drag of the wing due to the smaller wetted area, resulting in only minor changes in the lift-to-drag ratio (L/D). The addition of the OTW distributed propulsion system significantly increases the nose-down pitching moment, as indicated in Table 2.
Summary of the performance of TMP-only, OTW-only and TMP-DP systems. (TMP in C1 and OTW propeller in C2 have the same propeller speeds as their respective propellers in C4. C3 and C4 are thrust equivalent configurations, which matched the Tecnam P2006T aircraft at 52.6 kg thrust, from semi-wing, to achieve T/W 0.149.)
Performance comparisons of the thrust equivalent TMP-only (C3) and TMP-DP (C4) systems.
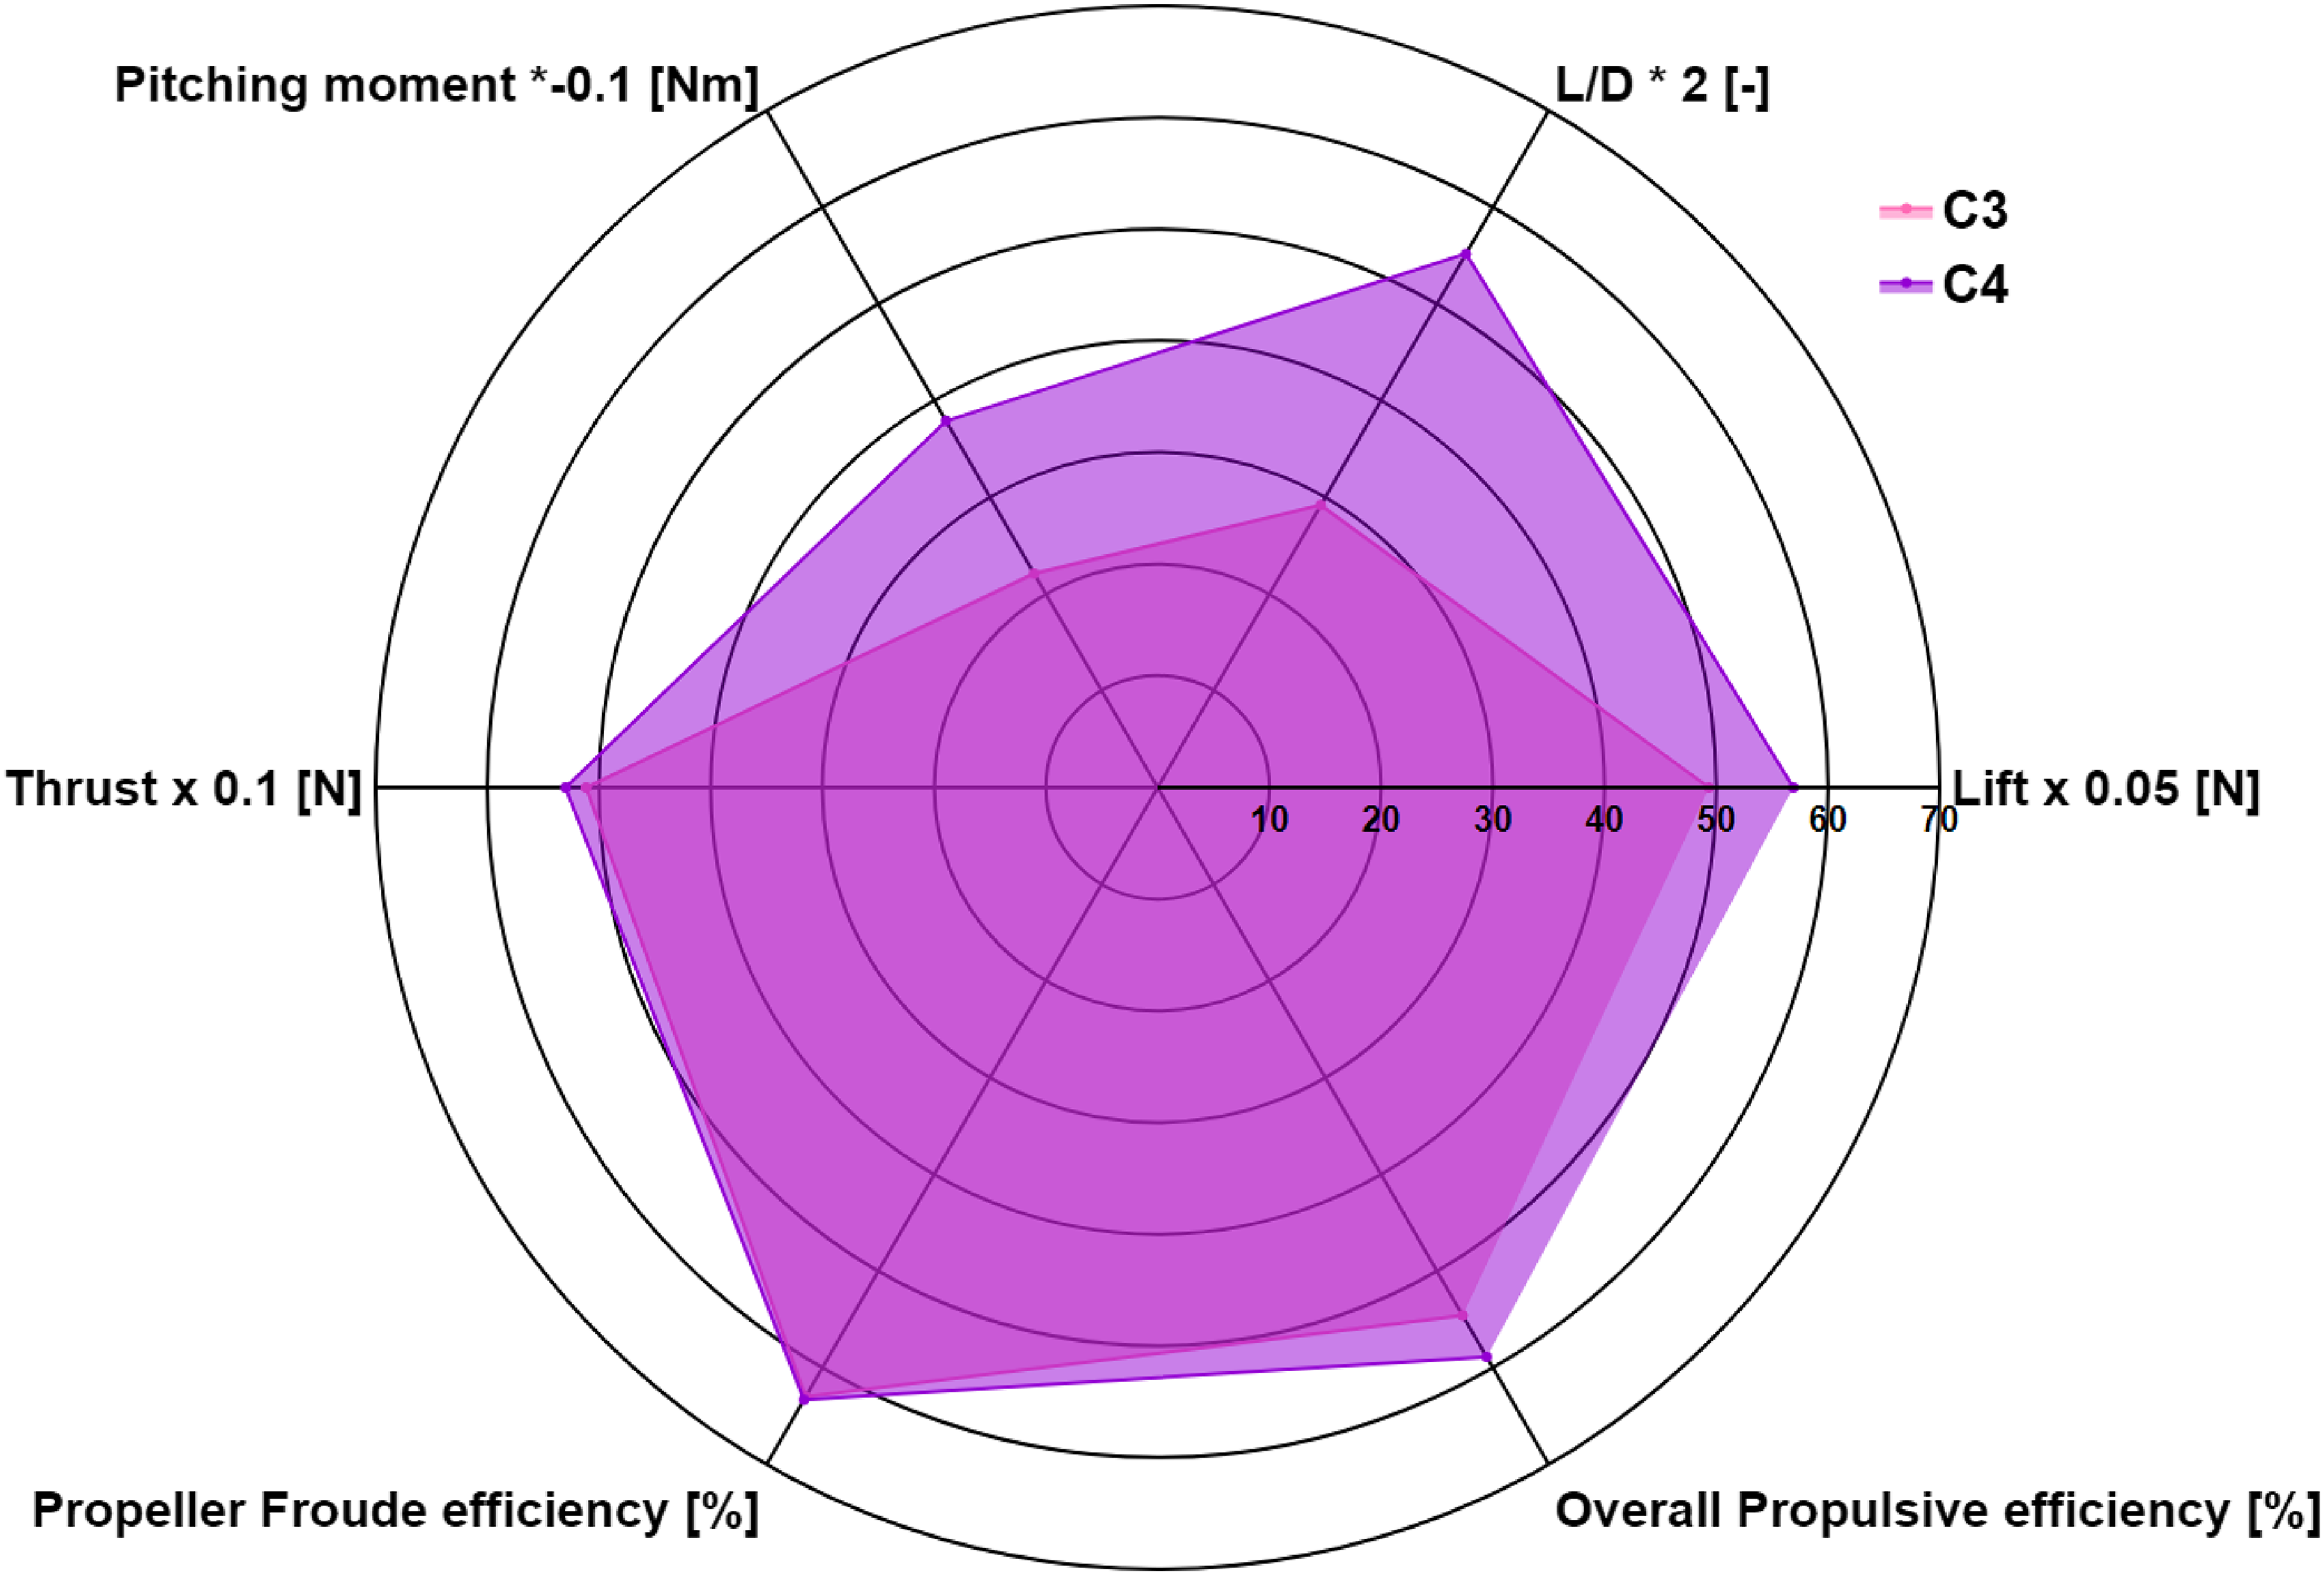
Comparing thrust-trimmed data between the TMP-only and TMP-DP systems in the C3 and C4 configurations, the installed propellers generate similar thrust levels. The overall propeller efficiency is comparable between these two configurations, with the exception of the C1 configuration, where the TMP demonstrates superior efficiency at lower advance ratios.
Crucially, the data indicate that increasing the thrust setting in the TMP-only configuration enhances the overall propulsive efficiency. The introduction of the OTW-DP system was further beneficial to the overall efficiency, approaching nearly $60{\rm{\% }}$
, with a substantial improvement in wing lift generation. As a result, the integrated TMPDP system performs better than the other configurations.
$60{\rm{\% }}$
, with a substantial improvement in wing lift generation. As a result, the integrated TMPDP system performs better than the other configurations.
6.0 Conclusions and future work
In advanced propulsion system design for flying vehicles, existing configurations must be re-thought due to the increased flexibility offered by hybrid/electric powertrain systems. This suggests a need for reserve, particularly regarding aero-propulsive synergistic effects. This study presents four propulsion systems using state-of-the-art modeling approaches, each aimed at enhancing performance. Current work covers aerodynamic performance, interactional effects, and configuration design in detail. The results demonstrate that the analysed configuration can significantly improve overall propulsive efficiency and lift generation.
The study found that the placement of tip-mounted and distributed propulsion systems created an aerodynamic interference region with the wing. In the higher tip-speed case from configuration C3, this interference was more intense, reducing suction pressure near the leading edge and mid-chord region while increasing pressure at the leading and trailing edges on the pressure side due to wake-washing effects. The propeller-wing interaction caused thrust fluctuations as the propeller blades swept through the interference region, though the mean thrust was only slightly impacted, particularly in the lower tip-speed case from configuration C1.
Similar benefits, such as reduced pressure region, were observed in the OTW installed HLP in configuration C2. This benefit was even more pronounced in the distributed propulsion system of configuration C4, likely due to the cooperative effect. In the proposed TMP-DP configuration, no significant thrust loss was observed when transitioning from single to distributed propellers. However, the TMP in configuration C4 exhibited thrust fluctuations similar to those in C1, indicating that TMP-DP-wing interactions have minimal impact on propeller performance within the TMP and DP systems.
The propellers within the DP system experienced similar sinusoidal variations in thrust, with the collective output of the TMP and three OTW propellers resulting in greater overall thrust fluctuations compared to the C3 configuration. The lift force distribution along the wingspan revealed a significant spike near the wingtip in the C3 configuration, which was substantially reduced in the C4 configuration. The increased lift generation near the most inboard OTW propeller may be attributed to the increased wing chord length. For the propellers, the TMP with higher speed experience expanded thrust loss due to the installation, hence a better efficiency with a lower RPM case. The installation of the DP system caused a slight reduction in the thrust of the TMP while passing through the wing suction side. At the same time, the cooperative effect of the DP slightly reduces the propeller performance while the propeller passes the wing and the adjacent propellers. However, the wing performance is much improved.
The structure of the vortex system in all configurations is affected by interactional effects due to the propeller installation, resulting in an asymmetric vortex system. In the TMP-only configuration, which provides equivalent propulsion force, the vortex generated is significantly stronger. The main deformed vortex tends to rise upward and propagate downstream and inboard. In configuration C4, there is a more rapid destruction of tip vortices and faster wake dissipation observed behind the TMP. The vortex system in the DP configuration introduces additional interference with the wing system. This interference shapes the wakes from the HLPs and the wing, with the middle HLPs exhibiting enhanced wake dissipation due to the anticlockwise vortex from the adjacent propeller blades.
In terms of performance, configuration C4 generated 3.5 ${\rm{\% }}$
more thrust with improved efficiency. The enhanced wing performance resulted in nearly 15
${\rm{\% }}$
more thrust with improved efficiency. The enhanced wing performance resulted in nearly 15 ${\rm{\% }}$
more lift, and the overall propulsive efficiency gained 8
${\rm{\% }}$
more lift, and the overall propulsive efficiency gained 8 ${\rm{\% }}$
. The pitching moment was also analysed, while the wing produced a similar pitching moment between C3 and C4, the DP system in C4 contributed to a significantly higher pitching moment.
${\rm{\% }}$
. The pitching moment was also analysed, while the wing produced a similar pitching moment between C3 and C4, the DP system in C4 contributed to a significantly higher pitching moment.
Future work is going to focus on the configuration optimisation (e.g. pusher configuration), near-field, far-field noise investigation, and noise reduction using synchrophasing.
Acknowledgments
The use of the EPSRC-funded ARCHIE-WeSt High-Performance Computer (www.archie-west.ac.uk) is gratefully acknowledged. Support via the Bill Nicol Engineering Scholarship, James Watt School of Engineering, University of Glasgow and Greener Aviation with Advanced Propulsion Systems (GAAPS) EP/W010119/1 is gratefully acknowledged.


 Open access

