

Up to 20% of individuals attending primary care are affected by anxiety disorders. Reference Kroenke, Spitzer, Williams, Monahan and Lowe1,Reference Wittchen2 As anxiety disorders are often associated with medically unexplained physical symptoms Reference Simon and VonKorff3 many people do not receive accurate diagnosis or adequate treatment in primary care Reference Stein, Sherbourne, Craske, Means-Christensen, Bystritsky and Katon4 and this results in high medical costs Reference Konnopka, Leichsenring, Leibing and König5 due to costly medical testing Reference Katon6 or the use of inappropriate and expensive emergency services. Reference Kolbasovsky, Reich, Futterman and Meyerkopf7 Even when diagnosed accurately, only a few receive guideline-level pharmacotherapy or psychotherapy. Reference Stein, Sherbourne, Craske, Means-Christensen, Bystritsky and Katon4,Reference Beesdo, Krause, Höfler and Wittchen8,Reference Roy-Byrne, Stein, Russo, Mercier, Thomas and McQuaid9 Although in Germany people have direct access to office-based psychiatrists and psychotherapists and do not need a referral, a large proportion of individuals with anxiety disorders are managed solely in primary care. Reference Wittchen, Hoyer, Höfler and Krause10
So far only two randomised controlled trials (RCTs) showed that early diagnosis and subsequent adequate treatment of anxiety disorders in primary care may increase the cost-effectiveness of care. Reference Katon, Russo, Sherbourne, Stein, Craske and Fan11,Reference Katon, Roy-Byrne, Russo and Cowley12 Unlike these studies where interventions were primarily targeted directly at people affected by anxiety disorders, the present study analysed an optimised care model for anxiety disorders in primary care that consisted of an intervention primarily targeted at primary care physicians (general practitioners, GPs). This intervention, which was composed of specific training combined with the offer of a psychiatric consultation–liaison service for GPs, might be comparatively easy to implement in the healthcare system as training courses are very common in continuing medical education. Reference Marinopoulos, Dorman, Ratanawongsa, Wilson, Ashar and Magaziner13 The purpose of this study was to analyse the cost-effectiveness of this optimised care model from a societal perspective.
Method
Sample
Primary care practices and screened individuals
All 315 GP practices in the city area of Leipzig, Germany, were informed about the study by mail, of which 54 volunteered to participate. All participating GP practices were run by a single GP, the most common practice type in Germany. In these practices, 8605 consecutive patients aged 18 to 65 were screened for anxiety disorders using the German version of the Patient Health Questionnaire (PHQ–D) Reference Löwe, Spitzer, Zipfel and Herzog14,Reference Spitzer, Kroenke and Williams15 from August to November 2005. General practitioners and their assistants had no specific psychiatric skills. Terminally ill or suicidal individuals, people with cognitive impairment as well as those with insufficient command of the German language were excluded from screening. Three hundred and sixty-two people returned incomplete questionnaires, resulting in 8243 PHQ–D questionnaires available for analysis. Of these, 629 (7.6%) screened positive for anxiety disorders. General practitioners were not informed about the screening results. In four GP practices no individuals screened positive as a result of a lack of adherence to the study protocol. These practices were excluded from further analysis.
Study participants
Of the 629 individuals who screened positive, 389 (61.8%) participated in the baseline data collection after providing informed consent. Reasons for non-participation in the study were: withdrawal of study participation by four GPs (4.3% of positively screened individuals), no postal/telephone contact possible (7.6%), no interest/no time (6.2%), distrust (1.7%), severe illness (0.5%), no response at baseline despite consent (4.9%), unknown reason (13.0%). There were no significant differences between participants and non-participants with respect to type of anxiety disorder, age, gender, living situation and employment.
Cluster randomisation
After grouping GP practices into four strata according to the quartiles of the number of positively screened people, GP practices (clusters) were randomly allocated within each stratum to an intervention group or a control group, following the design of a cluster randomised controlled trial. Stratified randomisation was carried out by an individual outside the research team using a computer generated program and resulted in 23 GP practices in the intervention group and 23 in the control group. The number of participants at baseline was n = 201 in the intervention group and n = 188 in the control group. The research team and GP practices remained masked to randomisation until after baseline data had been collected. After baseline, the research assistant could not be kept masked to allocation of GPs as she organised the intervention and liaised with practice receptionists. However, to avoid systematic bias only self-reported outcome measures for participants were used. Participants were not informed whether their GP was allocated to the intervention group or the control group. There were no significant differences between participants in the intervention group and the control group with respect to sociodemographic characteristics and type of anxiety disorder at baseline (online Table DS1). Figure 1 shows a CONSORT diagram outlining the flow of clusters and participants through the trial. Reference Campbell, Elbourne and Altman16
Intervention
The intervention consisted of specific training for GPs combined with the offer of a psychiatric consultation–liaison service in treating anxiety disorders. The intervention aimed at improving GPs' diagnostic and therapeutic knowledge and skills through a cognitive–behavioural therapy (CBT) approach as used in psychiatry. The theoretical background of training and consultation was based on current guidelines for the treatment of anxiety disorders 17,18 and drew on a graduated scheme for diagnosis and treatment designed by the German Society of Psychiatry, Psychotherapy and Nervous Diseases (DGPPN). Reference Dengler and Selbmann19

Fig. 1 CONSORT diagram showing the flow of clusters and participants through the trial.
The 10 h training, split across two afternoons within 2 weeks, included three sessions covering: clinical diagnostics and differential diagnosis of anxiety disorders; guidelines for efficient pharmacotherapy; and the cognitive–behavioural concept of anxiety development. Two further sessions were used for role play training of non-medical techniques such as key counselling skills, information for the patient about a psychiatric diagnosis as well as psychological and psychiatric treatment options, and guidance for the patient about exposition or relaxation treatment. Limits of medical treatment in GP practice were also discussed. Thus, both knowledge transfer of the guidelines for management of anxiety disorders and basic training in using CBT techniques were included in the training. Multiple methods of instruction, including discussion, tutorial, video and exercise, were applied to ensure task relevance, high learner involvement in setting educational goals and skill practice. Reference Laidley and Braddock20 Discussion and exercise were case based and derived from GPs' clinical practice. Physician behaviour was discussed after role playing.
Additionally, a flexible psychiatric consultation–liaison service was offered to GPs that included assessment of specific patients with anxiety disorders, advice to GPs and GP training in CBT if required. Reference Wittmund, Wilms, Bull and Angermeyer21 This service was offered to GPs for a period of 6 months starting after the training had been completed (intervention period). Reference Wittmund, Wilms, Bull and Angermeyer21 It sought to foster the acquired diagnostic and therapeutic knowledge and to enhance the collaboration among health service providers. The consultation–liaison service was highly flexible, offered at GPs' practices to lower the access barrier for psychiatric services or at the cooperating psychiatric hospital out-patient department at short notice, and were thus superior to standard care.
All GPs in the intervention group received the same training and had the same chance to use the consultation–liaison service. Training and consultations were conducted by a clinical psychologist and a psychiatrist specialised in treatment of anxiety disorders. General practitioners in the control group provided usual care. The training part of the intervention was offered to the participating GPs of the control group at the end of the study's follow-up period for ethical reasons.
Data collection and measures
All 389 participants received a set of questionnaires by mail at baseline (T 0, January to March 2006), at the end of the 6-month intervention period (T 1, November 2006) as well as 3 months after the end of the intervention phase (T 2, February 2007). For completing the questionnaires, respondents received an allowance of €20 at T 0, and €10 each at T 1 and T 2. Non-responders were contacted by telephone once after 4 weeks and were asked to return the completed questionnaires. Drop-out rates were relatively low, resulting in 335 (86.1%) participating patients at T 1 (intervention group: n = 172; control group: n = 163) and 327 (84.1%) patients at T 2 (intervention group: n = 169; control group: n = 158). Whereas the PHQ–D was used for screening, data collection at T 0, T 1, and T 2 included the Beck Anxiety Inventory (BAI), Beck Depression Inventory (BDI–II), the EQ–5D as well as a questionnaire of service utilisation and costs.
PHQ–D
Modules three, four and five of the German long version of the PHQ Reference Löwe, Spitzer, Zipfel and Herzog14 were used to screen primary care patients for symptoms of anxiety disorders according to ICD–10 criteria 22 for panic disorder (F41.0), panic disorder with agoraphobia (F40.01), generalised anxiety disorder (F41.1) or unspecified anxiety disorder (F41.9). The PHQ is a clinically efficient self-administered screening tool for common mental health disorders. It contains 22 items specifically measuring anxiety symptoms that are rated for presence and extent of symptoms. An anxiety disorder is diagnosed above a score of five symptoms present according to the algorithms provided by the manual. Reference Löwe, Spitzer, Zipfel and Herzog14 Patient Health Questionnaire anxiety diagnoses showed good concordance with those of independent health professionals (kappa 0.65, sensitivity 63%, specificity 97%, overall accuracy 91%) Reference Spitzer, Kroenke and Williams15 and a high positive predictive value. Reference Löwe, Gräfe, Zipfel, Spitzer, Herrmann-Lingen and Witte23
BAI
The BAI is a 21-item measure designed to assess the severity of self-reported anxiety. Reference Beck, Epstein, Brown and Steer24 Responses on each item range from 0 (not at all bothered) to 3 (severely bothered), resulting in a possible total score range from 0 to 63. Higher scores indicate higher levels of anxiousness.
BDI–II
The BDI–II is a 21-item self-report depression screening measure. Reference Beck, Steer, Ball and Ranieri25 The items ask respondents to endorse statements characterising how they have been feeling throughout the past week. Thereby each item is rated on a scale ranging from 0 to 3, with a possible range of total scores from 0 to 63. Higher scores represent a higher intensity of depression.
EQ–5D
The EQ–5D is a generic health-related quality of life questionnaire that comprises five questions (items) relating to current problems in the dimensions: mobility; self-care; usual activities; pain/discomfort; and anxiety/depression. 26 Responses in each dimension are divided into three ordinal levels coded: 1, no problems; 2, moderate problems; 3, extreme problems. Theoretically, 35 = 243 different health states can be defined by the EQ–5D descriptive system. The EQ–5D also includes a visual analogue scale (EQ–VAS), similar to a thermometer, ranging from 0 (worst imaginable health state) to 100 (best imaginable health state) which records the respondent's self-rated valuation of health state (EQ–VAS score). Furthermore, according to a particular set of societal preference values derived from surveys of the general population, an index score (EQ–5D index) for each of the 243 EQ–5D health states is available for various countries, with the best state (perfect health) and ‘death’ being assigned values of one and zero, respectively. In the present study EQ–5D index scores from the UK Reference Dolan27 were used that were derived from a large general population sample (n = 2997) and have been used in numerous international studies, including the field of mental health. Reference Sapin, Fantino, Nowicki and Kind28 Accordingly, to each participant's health status on the descriptive system of the EQ–5D, an EQ–5D index score was assigned.
Questionnaire of service utilisation and costs
Medical and non-medical resource utilisation was assessed by a questionnaire of service utilisation and costs that was based on questionnaires used in earlier studies Reference Luppa, Heinrich, Matschinger, Sandholzer, Angermeyer and König29–Reference Roick, Kilian, Matschinger, Bernert, Mory and Angermeyer31 and adapted to the purposes of the present study. For a retrospective period of 3 months, the questionnaire covered in-patient care, medical rehabilitation, out-patient physician and non-physician services, medical supply and dentures, pharmaceuticals, transportation, home care, as well as productivity loss due to work loss days (indirect costs). Depending on the service, type, quantity of use or duration were recorded (see Appendix). The instrument is available from the authors. As recommended by German guidelines on health economic evaluation, Reference Graf von der Schulenburg, Greiner, Jost, Klusen, Kubin and Leidl32 costs were measured from a societal perspective in order to measure the impact of the intervention on the welfare of the society as a whole.
Unit costs
For monetary valuation of resource utilisation, unit costs were determined for all services used and for all medical goods prescribed or privately purchased at 2006 price levels. If cost data were available only for earlier years, costs were inflated to the year 2006 using the consumer price index. 33 Detailed information regarding monetary valuation is shown in the Appendix. Most unit costs were obtained from a recent guideline for cost calculation in health economic evaluation in Germany. Reference Krauth, Hessel, Hansmeier, Wasem, Seitz and Schweikert34 Costs for medical supply and dentures were calculated using market prices. Pharmaceutical costs were calculated using prices from the German catalogue of drugs. 35 Costs for travel on public transport or in taxis were calculated according to patients' specifications. Costs of car travel were calculated according to the number of kilometres travelled multiplied by a flat rate of €0.30 per kilometre (according to the tax-deductible rate allowed for trips to and from work in Germany). Informal care provided by relatives and friends was valued by the mean net income per h (€18.30) in Germany, corresponding to an opportunity cost approach as recommended by the guideline Reference Krauth, Hessel, Hansmeier, Wasem, Seitz and Schweikert34 mentioned above. Intervention costs were calculated using market prices. Productivity loss (indirect costs) was quantified based on the human capital approach, valuing illness-related work loss days by the mean labour costs per work day (€169) in Germany as recommended by the above mentioned guideline. Reference Krauth, Hessel, Hansmeier, Wasem, Seitz and Schweikert34
Intervention costs
Intervention costs consisted of costs for the specific GP training and costs for consultation–liaison. For GP training, 20 work hours of a psychologist and 10 work hours of a psychiatrist were used, which were monetarily valued at €28 per h according to labour costs in tariff class IIa of the German Federal Employee Tariff (Bundesangestelltentarif – BAT) which applied to salaried psychiatrists and physicians working in the public health sector in the year 2006. Costs for the room rent (€200) and printed materials (€20) were also considered. In total, 31 consultations were conducted by the psychologist, lasting on average 1.5 h each, which were also valued at €28 per h. Thus, total intervention costs added up to €2362, or €11.75 per participant in the intervention group.
Data analysis
Incremental cost-effectiveness ratio
The economic analysis aimed at estimating the incremental cost-effectiveness ratio (ICER), i.e. the ratio of the differences in mean costs C and mean health effects E between the intervention group and the control group during the follow-up period lasting from T 0 to T 2:
For estimating mean costs during the follow-up period, individual costs C were calculated for each participant using linear extrapolation between measurement points, taking into account the individual observation time by using the following equation:
where C T1 and C T2 are the 3-month costs measured at T 1 and T 2, respectively, and days(T 0;T 1) and days(T 1;T 2) are the number of days between the measurement points for the individual patient. Patients were excluded if no information about costs was available at T 1 and T 2. If one of the two values (at T 1 or T 2) was missing it was replaced by the actually existing value. If the individual observation time was missing, the average number of days was employed to compute costs.
Following the concept of cost-utility analysis, quality-adjusted life-years (QALYs) were used as the measure of health effects. Reference Drummond, Sculpher, Torrance, O'Brien and Stoddart36 Quality-adjusted life-years were calculated by weighting the duration of health states by the EQ–5D index. For calculation of mean QALYs during the follow-up period, individual QALYs were calculated for each participant using linear interpolation between measurement points and taking into account the individual observation time, using the following equation:

where index T0, index T1 and index T2 are the EQ–5D index scores measured at T 0, T 1 and T 2. The procedure to treat missing information described above for costs was also used for the computation of QALYs.
Statistical analysis
The study was powered to detect a moderate effect size of d = 0.4 (90% power, 5% significance level; two-tailed t-test) in the primary clinical outcome measure BAI score. Effect size was assumed to be somewhat smaller than reported for CBT in individuals with anxiety disorders (d = 0.5). Reference Erickson, Janeck and Tallman37 Sample-size calculation took into account the design effect (cluster inflation factor), Reference Campbell, Mollison and Grimshaw38 assuming an average cluster size of 10 and an intracluster correlation coefficient (ICC) of 0.05, a magnitude frequently reported for outcome variables. Reference Campbell, Grimshaw and Steen39 Sample-size calculation resulted in 19 clusters with 190 people each in the intervention group and control group, which was approximately achieved in the study. Based on this sample size, an ICC of 0.10 would have reduced the study's power to 80%, with all other parameters kept constant.
All statistical analysis was carried out on an intention-to-treat basis using the software package STATA for Windows, Release 10 (STATA Corp., College Station, Texas, USA) and the suite ‘bsceaprog.do’ for STATA. Reference Glick, Doshi, Sonnad and Polsky40 For the analysis of differences in means (costs, scores of outcome measures) and for uncertainty analysis of the ICERs, the non-parametric bootstrap procedure (4000 replications) was applied taking into account the cluster design and stratification used in the study. In order to visualise statistical uncertainty of the ICER, cost-effectiveness acceptability curves Reference Briggs, O'Brien and Blackhouse41 were constructed. The level of significance was set at 5%.
Sensitivity analysis
To analyse the impact of various assumptions made when calculating QALYs and costs, univariate sensitivity analysis was performed by varying the following parameters: instead of the British EQ–5D index scores, EQ–5D index scores derived from a much smaller sample of the German general population (n = 334) Reference Greiner, Claes, Busschbach and Graf von der Schulenburg42 and, alternatively, EQ–VAS scores (divided by 100 for transformation to a 0–1 scale) were used as QALY weights. Instead of the human capital approach, the friction costs approach was used to calculate indirect costs, using a friction period of 49 work days. Reference Krauth, Hessel, Hansmeier, Wasem, Seitz and Schweikert34 Intervention costs were varied by plus and minus 100%. Finally, the ICER was calculated including only complete cases with no missing values.
Ethics
The research protocol of the study was reviewed and approved by the Committee of Research Ethics at the Medical Faculty of the University of Leipzig.
Results
Outcome measures
Table 1 shows the mean scores of outcome measures in the intervention group and the control group at T 0, T 1 and T 2. At baseline (T 0), the scores of all outcome measures were similar in both groups, with no significant differences. The mean BAI score was 21.25 in the intervention group and 19.51 in the control group.
Table 1 Scores of outcome measures in intervention and control group at T 0, T 1 and T 2

| Intervention group | Control group | Intracluster correlation coefficient | ||||||
|---|---|---|---|---|---|---|---|---|
| Outcome measure | n | Mean (s.d.) | n | Mean (s.d.) | P a | |||
| Beck Anxiety Inventory | ||||||||
| T 0 | 169 | 21.25 (11.85) | 157 | 19.51 (11.62) | 0.26 | 0.09 | ||
| T 1 | 144 | 19.71 (11.58) | 140 | 16.91 (10.33) | 0.05 | 0.07 | ||
| T 2 | 150 | 18.18 (12.17) | 145 | 16.72 (10.34) | 0.34 | 0.07 | ||
| Beck Depression Inventory | ||||||||
| T 0 | 177 | 16.29 (9.73) | 167 | 16.61 (10.54) | 0.73 | 0.00 | ||
| T 1 | 156 | 15.95 (10.59) | 150 | 14.03 (10.33) | 0.15 | 0.05 | ||
| T 2 | 153 | 15.17 (11.15) | 142 | 13.93 (9.74) | 0.35 | 0.03 | ||
| EQ—VAS (visual analogue scale) | ||||||||
| T 0 | 198 | 64.83 (20.07) | 184 | 62.60 (21.64) | 0.30 | 0.04 | ||
| T 1 | 169 | 65.03 (19.79) | 161 | 65.85 (19.69) | 0.74 | 0.06 | ||
| T 2 | 163 | 65.83 (20.39) | 157 | 63.99 (19.98) | 0.42 | 0.02 | ||
| EQ—5D index | ||||||||
| T 0 | 193 | 0.66 (0.27) | 179 | 0.66 (0.27) | 0.93 | 0.04 | ||
| T 1 | 165 | 0.67 (0.28) | 159 | 0.69 (0.24) | 0.47 | 0.11 | ||
| T 2 | 168 | 0.69 (0.28) | 154 | 0.68 (0.23) | 0.84 | 0.11 | ||
a. P for test of difference in mean scores between intervention and control group based on non-parametric bootstrapping with 4000 replications taking into account clusters and strata.
During follow-up (T 1 and T 2) the scores of most outcome measures tended to improve slightly, with no significant differences between intervention group and control group in scores measured at T 1 or at T 2. At T 2 the mean BAI score was 18.18 in the intervention group and 16.72 in the control group. The ICCs ranged between 0 and 0.11. In complete cases v. cases lost due to drop-out at T 1 or T 2, there were no significant differences in any of the outcome measures.
Costs
Online Table DS2 presents mean direct and indirect costs in the intervention group and the control group during the 3-month periods preceding T 0, T 1 and T 2.
During the 3-month period preceding baseline (T 0), mean direct costs were €1285 in the intervention group and €1228 in the control group, with no significant difference between groups. Approximately a third of respondents in both groups (intervention group: 33.8%; control group: 31.9%) had used any mental health services, including psychiatric hospital care, out-patient psychiatrists and psychologists, resulting in mean costs per respondent of €466 (intervention group) and €409 (control group). The sum of direct and indirect costs (total costs) was €2042 in the intervention group and €2082 in the control group with no significant difference between groups.
During follow-up, costs in most categories tended to be lower in the control group, especially costs of in-patient care, resulting in significantly lower direct costs in the control group at T 1 (P = 0.02). The proportion of respondents using mental health services was similar in the intervention group and control group during follow-up, with 31.4% (intervention group) and 33.1% (control group) using any service at T 1, and 33.1% (intervention group) and 32.9% (control group) at T 2. Yet, mean costs of mental health services per respondent tended to be lower in the control group at T 1 (intervention group: €379; control group: €139) and T 2 (intervention group: €353; control group: €158). These non-significant differences were mainly caused by a few more costly users of psychiatric in-patient hospital care in the intervention group than in the control group at T 1 (intervention group: 3; control group: 1) and T 2 (intervention group: 4, control group: 2).
During the complete follow-up period mean direct costs calculated according to Equation 2 were €3394 in the intervention group and €2151 in the control group. Mean indirect costs due to illness-related work loss days were €1517 in the intervention group and €1302 in the control group. Thus, mean total costs were €4911 in the intervention group and €3453 in the control group. Differences in direct, indirect and total costs between groups were not significant (Table 2).
Table 2 Mean costs, mean quality-adjusted life-years (QALYs) and incremental cost-effectiveness ratios (ICERs) during follow-up

| Intervention group, n = 182 a Mean (s.d.) | Control group, n = 165 b Mean (s.d.) | Difference Mean (s.e.)c | P c | Point estimate | |
|---|---|---|---|---|---|
| Costs, € | |||||
| Direct costs | 3394 (7635) | 2151 (3867) | 1243 (674) | 0.07 | |
| Total costs | 4911 (9638) | 3453 (5612) | 1459 (849) | 0.09 | |
| QALYS | 0.5507 (0.2344) | 0.5549 (0.2073) | -0.0042 (0.0296) | 0.89 | |
| ICER of intervention | |||||
| Based on direct costs | Dominated d | ||||
| Based on total costs (direct and indirect) | Dominated d |
a. Differences from n = 201 owing to missing values for cost data during follow-up.
b. Differences from n = 188 owing to missing values for cost data during follow-up
c. Standard error (s.e.) and P for test of difference in means between intervention and control group are based on non-parametric bootstrapping with 4000 replications taking into account clusters and strata.
d. Intervention group was dominated by control group, i.e. the intervention was associated with higher mean costs and fewer mean QALYs.
QALYs
The mean duration of follow-up between T 0 and T 2 was 290.4 days (s.d. = 25.1 days) in the intervention group and 285.8 days (s.d. = 19.3 days) in the control group, corresponding to 0.80 years (s.d. = 0.07 years) and 0.78 years (s.d. = 0.05 years), respectively. Mean QALYs calculated according to Equation 3 were 0.5507 in the intervention group and 0.5549 in the control group, with no significant differences between intervention group and control group.
Incremental cost-effectiveness ratios
Mean incremental direct costs during follow-up were €1243 (95% CI −79 to 2564), and mean incremental total costs were €1459 (95% CI −205 to 3122). Mean incremental QALYs were −0.0042 (95% CI −0.0622 to 0.0538). Thus, point estimates for the ICER showed dominance of the control group, which was associated with lower mean direct costs as well as total costs, and more mean QALYs.
Non-parametric bootstrapping of the distributions of incremental costs and incremental effects resulted in joint densities (Fig. 2) from which cost-effectiveness acceptability curves (Fig. 3) could be derived. For example the probability of an ICER <50 000 €/QALY was 3% when only direct costs were considered and 2% when total costs were considered.
Sensitivity analysis
Using German EQ–5D index scores or transformed EQ–VAS scores to value health states resulted in incremental QALYs of −0.0012 (95% CI −0.0507 to 0.0484) and 0.0058 (95% CI −0.0382 to 0.0497), respectively. Based on German EQ–5D index scores, the point estimates of the ICER showed dominance of the control group; based on EQ–VAS scores the ICER was 215 299 €/QALY for direct costs and 252 691 €/QALY for total costs, with the probability of an ICER <50 000 €/QALY always being below 10%. Using the friction costs approach to calculate indirect costs slightly decreased mean incremental total costs to 1352 (95% CI −19 to 2723), still resulting in dominance of the control group. Assuming zero or doubled intervention costs hardly changed results, resulting in mean incremental direct and total costs of €1231 (95% CI −60 to 2522) and €1447 (95% CI −246 to 3140) or €1255 (95% CI −47 to 2556) and €1470 (95% CI −242 to 3183), respectively; the respective point estimates for the ICER all showed dominance of the control group. Including only complete cases in the analysis (intervention group n = 159; control group n = 152) resulted in slightly lower mean incremental direct costs (€1169, 95% CI −310 to 2648) and total costs (€1313, 95% CI −572 to 3198), similar mean incremental QALYs (0.0069, 95% CI −0.0071 to 0.0576) and dominance of the control group.

Fig. 2 Joint distribution of incremental (a) direct costs and (b) total costs and incremental quality-adjusted life-years (QALYs) of the optimised care model plotted in the cost-effectiveness plane. Results of non-parametric bootstrapping with 4000 replications taking into account clusters and strata.
Discussion
The analysed care model for patients with anxiety disorders consisting of a specific training for GPs combined with the offer of a psychiatric consultation-liaison service did not prove to be cost-effective. During the 9 month follow-up period, neither anxiety symptoms nor health-related quality of life improved significantly more in participants whose GPs received the intervention than in the control group. Direct healthcare costs tended to be higher in participants in the intervention group, resulting in a very low probability of the care model being cost-effective. For example, taking a frequently cited threshold of around 50 000 €/QALY for healthcare interventions to be considered cost-effective, Reference Hirth, Chernew, Miller, Fendrick and Weissert43 the probability of the care model being cost-effective was only 2% if total costs and societal preference values were used for calculating the ICER. Variation of several assumptions made when calculating costs and QALYs in the sensitivity analysis had hardly any impact on the ICER.
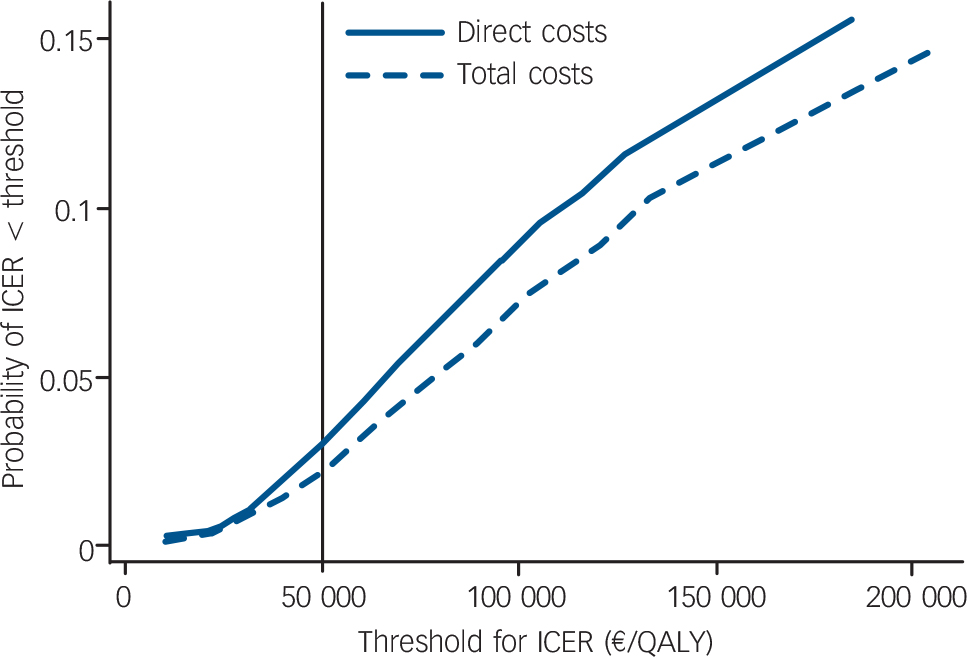
Fig. 3 Cost-effectiveness acceptability curves of the optimised care model taking into account direct costs only or total costs. ICER, incremental cost-effectiveness ratio.
Possible explanations for lack of success
There are various possible reasons for this care model not being effective. First of all, it is possible that the knowledge and skills acquired by GPs during the training sessions were not sufficient to have a significant impact on diagnostic and therapeutic behaviour and, consequently, on patient outcomes. This is in line with the results of other cluster RCTs that showed that the effectiveness of educational interventions targeted at GPs in the field of mental health tends to be weak. Reference King, Davidson, Taylor, Haines, Sharp and Turner44–Reference Morriss, Dowrick, Salmon, Peters, Dunn and Rogers46 Consisting of 10 hours, the training was probably more profound than in other optimised primary care models for anxiety patients, Reference Katon, Russo, Sherbourne, Stein, Craske and Fan11,Reference Katon, Roy-Byrne, Russo and Cowley12 and evaluation of the training by participating GPs conducted at the end of the last session was excellent (for instance, the mean rating score for the training was 1.04 on a scale ranging from 1, excellent to 6, insufficient, and more than 90% of participating GPs indicated that they had acquired new knowledge). However, GPs seem to need more support to acquire complex mental healthcare skills, such as in CBT, Reference King, Davidson, Taylor, Haines, Sharp and Turner44 and more intense practice of these skills, regular reinforcement and auditing may be necessary. In addition to training of GPs, interventions such as the delivery of behavioural and educational self-help materials may be useful to improve the outcomes of individuals with anxiety disorders in primary care, as has been shown for people with depression. Reference Robinson, Katon, Von Korff, Bush, Simon and Lin47
Second, it seems as if the intervention could not sufficiently motivate GPs to use the specific consultation–liaison service or to refer individuals to mental healthcare providers. During the 6-month intervention period only 31 specific consultations were requested by GPs, and the proportion of patients using mental health services did not increase. As GPs in Germany are remunerated according to a fee-for-service system and individuals are free in choosing their physicians, possible reasons may be fears of GPs loosing patients to other providers, which would be associated with a loss of income. It is possible that GPs working in other healthcare systems with different financial incentives may be more motivated to refer individuals to specialists, which limits the generalisabilty of the results reported here.
The cost-effectiveness of this care model targeting patients with anxiety in primary care only indirectly through GPs seems to be much weaker than that of care models that make sure that patients receive at least a basic package of specialised mental health services. In a cost-effectiveness analysis of an RCT, Katon et al Reference Katon, Roy-Byrne, Russo and Cowley12 showed that a collaborative care intervention for people with panic disorder consisting of enhanced patient education and two to three psychiatry visits integrated into primary care was associated with a high probability of lower total ambulatory (out-patient) costs and a higher degree of clinical effectiveness compared with usual care. In another cost-effectiveness analysis, also based on an RCT, Katon et al Reference Katon, Russo, Sherbourne, Stein, Craske and Fan11 showed that a combined CBT and pharmacotherapy intervention for patients with panic disorder in primary care delivered by a mental health therapist was associated with a moderate increase in ambulatory costs and robust clinical improvement compared with usual care.
Limitations
This study aimed to analyse the cost-effectiveness of the optimised care model under ‘real world’ conditions. Thus, the design of the study was supposed to represent both the intervention as well as usual care close to what could be achieved under routine care conditions, trying to interfere with real world conditions as little as possible. In other words, this study's design was supposed to analyse effectiveness rather than efficacy. Reference Gray48 Consequently, the study had several limitations.
Patients were included in the study based on the results of a screening instrument (PHQ–D) and not on formal diagnosis of an anxiety disorder. As the PHQ has a high specificity (97%), Reference Spitzer, Kroenke and Williams15 probably most of the study participants met formal criteria for anxiety disorders. The mean score of the BAI at baseline was similar to mean BAI scores found in other samples of out-patients with anxiety disorders. Reference Beck, Epstein, Brown and Steer24,Reference Fydrich, Dowdall and Chambless49 On the other hand, the comparatively low sensitivity of the PHQ (67%) Reference Spitzer, Kroenke and Williams15 resulted in approximately a third of individuals with anxiety disorders being missed, which corresponds to the prevalence of 7.6% found in our primary care sample as opposed to higher prevalence rates of anxiety found in other primary care samples. Reference Kroenke, Spitzer, Williams, Monahan and Lowe1 Furthermore, following the ‘real world’ approach, people who had already used mental healthcare services were not excluded from the study. This might have ‘diluted’ the effects of the intervention since these individuals may have already received optimal care. However, excluding these people from the analysis did not change the effectiveness nor cost-effectiveness of the care model.
Primary care practices were recruited for the study on a voluntary basis as participation in the optimised care model in the ‘real world’ would most likely be voluntary too. Thus participating GP practices may not be representative of all GP practices. Of all the patients who screened positive, 62% participated in the study. This participation rate was comparable with other community-based studies, and comparison of participants and non-participants with respect to sociodemographic variables and type of anxiety disorder did not suggest participation bias. However, participation bias with respect to variables not measured at screening cannot be ruled out, but should be similar in both the intervention group and the control group because of randomisation. Of all participating patients, 86% responded at T 1 and 84% at T 2. Instead of restricting calculation of the ICER to complete cases, all participants for whom cost data and EQ–5D scores were available at T 1 or T 2 were considered, resulting in the ICER being calculated based on 89% of participants. Thus, only approximately 3% of variable values missing at T 1 and 5% at T 2 were replaced by the corresponding values measured at T 2 or T 1 respectively, which is unlikely to have biased the results. No multiple imputation procedure was adopted since missing values cannot be considered ignorable or missing at random (MAR) Reference Harel and Zhou50,Reference Tang, Song, Belin and Unutzer51 and the overall loss was only about 10%. Including only complete cases changed results only marginally, as shown in the sensitivity analysis.
As anxiety disorders have been reported to be associated with increased non-psychiatric medical treatment costs as well as reduced productivity, Reference Andlin-Sobocki and Wittchen52 this study tried to assess all medical and non-medical direct costs as well as indirect costs. Because in Germany no routine database covering all these cost categories exists, costs were calculated based on self-reported data of service use and work loss days, as has been done in many other cost-effectiveness analyses. In order to keep recall bias low, Reference Johnston, Buxton, Jones and Fitzpatrick53 the period covered by the questionnaire of service utilisation was restricted to 3 months, which meant that costs of the intervention period had to be extrapolated. Whereas recall bias probably leads to underestimation of costs, extrapolation of costs may either overestimate or underestimate costs: overestimation will occur if a high-cost contact occurs during the questionnaire period, because it will be multiplied over the follow-up period; underestimation will occur if a high-cost contact occurs outside the questionnaire period. However, as both the intervention group and the control group were possibly affected by this bias, its effect on the ICER was probably small as the ICER was calculated from differences between intervention group and control group.
Intervention costs per study participant may be overestimated because benefits of the training programme were intended to last longer than the study period and patients not participating in the study may also benefit, which would decrease the costs of the training programme per patient. However, assuming the extreme value of zero intervention costs hardly changed the results, as shown in the sensitivity analysis.
For the cost-effectiveness analysis, QALYs were used as the main measure of health effects, following the concept of cost-utility analysis, as predominantly recommended by health economists. Reference Drummond, Sculpher, Torrance, O'Brien and Stoddart36,Reference Gold, Siegel, Russel and Weinstein54 In the sensitivity analysis, QALYs were calculated using health state valuations derived from the EQ–5D, using social preference values (EQ–5D index), as recommended by health economists, Reference Drummond, Sculpher, Torrance, O'Brien and Stoddart36,Reference Gold, Siegel, Russel and Weinstein54 as well as participant preferences (EQ–VAS). The EQ–5D is the most frequently used instrument to calculate QALYs in economic evaluation of healthcare, Reference Rasanen, Roine, Sintonen, Semberg-Konttinen, Ryynanen and Roine55 and has repeatedly been used in the field of mental health. Reference Sapin, Fantino, Nowicki and Kind28,Reference König, Roick and Angermeyer56 However, being a generic health status measure, the responsiveness of the EQ–5D to changes in health status of individuals with anxiety disorders may be limited, precluding the detection of small changes. Yet, scores of the disease-specific BAI, which was also used in this study, were not different between the intervention group and the control group either.
Clinical implications
In conclusion, the care model did not prove to be cost-effective. Knowledge acquired by GPs during the training and/or motivation to refer patients to mental healthcare professionals may have been insufficient to improve diagnosis and treatment of anxiety disorders or reduce costs. Participants in both the intervention group and control group remained persistently symptomatic on the BAI, which highlights the poor prognosis for this disease group. Care models which include at least a basic package of specialised mental health services for people with anxiety disorders in primary care seem more likely to be cost-effective.
Appendix Resources, units and monetary valuation used for calculation of costs
| Sector | Providers/services/goods | Units | Monetary valuation (unit costs) | Source of unit costs |
|---|---|---|---|---|
| In-patient care | General hospitals, specialised hospitals for psychiatric and neurological care | Days | Mean costs per day in Germany, by hospital type | Krauth et al (2005) a ,Reference Krauth, Hessel, Hansmeier, Wasem, Seitz and Schweikert34 |
| Rehabilitation | Rehabilitation hospitals | Days | Mean costs per day in Germany | Krauth et al (2005) a ,Reference Krauth, Hessel, Hansmeier, Wasem, Seitz and Schweikert34 |
| Out-patient physician services | General practitioners, physician specialists, psychologists and out-patient clinics | Contacts | Mean costs per contact in Germany, by specialty | Krauth et al (2005) a ,Reference Krauth, Hessel, Hansmeier, Wasem, Seitz and Schweikert34 |
| Out-patient non-physician services | For example: physiotherapy, massage, lymph drainage, ergotherapy | Contacts | Mean costs per contact in Germany, by type of service | Krauth et al (2005) a ,Reference Krauth, Hessel, Hansmeier, Wasem, Seitz and Schweikert34 list of fees paid by AOK |
| Medical supplies and dentures | Products (e.g. compression stockings, walking frames) | Quantity | Market prices | Survey of healthcare equipment suppliers |
| Pharmaceuticals | Products | Quantity | Market prices | Rote Liste Service GmbH 2006 35 |
| Transportation | Transportation by car, public transport, taxi or ambulance to medical visits or treatment | km, quantity | €0.30/km for car driving, market prices for other types of transport | German tax law, costs reported by respondents |
| Home care | Care provided at home by home help, relatives or friends | Hours | Mean labour costs for home help/mean net income per h for relatives and friends | Krauth et al (2005) a ,Reference Krauth, Hessel, Hansmeier, Wasem, Seitz and Schweikert34 |
| Intervention costs | Psychologist, psychiatrist, room rent, print materials | See methods section | Market prices | Own calculations |
| Indirect costs | Work loss days due to illness | Days | Mean labour costs per day in Germany | Krauth et al (2005) a ,Reference Krauth, Hessel, Hansmeier, Wasem, Seitz and Schweikert34 |
AOK, Allgemeine Ortskrankenkasse (largest German sickness fund).
a. Inflated to the year 2006.
Funding
This study was funded by the German Federal Ministry of Education and Research (grant number 01GL0502).


eLetters
No eLetters have been published for this article.