


Introduction
The preparation of graphite from carbon-containing samples is an essential step in radiocarbon dating performed using accelerator mass spectrometry (AMS). Historically, graphite production relies on reduction methods using hydrogen or zinc as reductants (Orsovszki and Rinyu Reference Orsovszki and Rinyu2015; Vogel et al. Reference Vogel, Southon, Nelson and Brown1984; Xu et al. Reference Xu, Trumbore, Zheng, Southon, McDuffee, Luttgen and Liu2007). Number of manual and semi-automatic systems have been developed that require technical gases, liquid nitrogen or both for their operation (D’Elia et al. Reference D’Elia, Calcagnile, Quarta, Sanapo, Laudisa, Toma and Rizzo2004; Ertunç et al. Reference Ertunç, Xu, Bryant, Maden, Murray, Currie and Freeman2005; Fedi et al. Reference Fedi, Bernardoni, Caforio, Calzolai, Carraresi, Manetti, Taccetti and Mandò2013; Genberg et al. Reference Genberg, Stenström, Elfman and Olsson2010; Hua et al. Reference Hua, Jacobsen, Zoppi, Lawson, Williams, Smith and McGann2001; Krajcar Bronić et al. Reference Krajcar Bronić, Horvatinčić, Sironić, Obelić, Barešić and Felja2010; Macario et al. Reference Macario, Oliveira, Carvalho, Santos, Xu, Chanca, Alves, Jou, Oliveira, Pereira, Moreira, Muniz, Linares, Gomes, Dos Anjos, Castro, Dos Anjos, Marques and Rodrigues2015; Pigati et al. Reference Pigati, Quade, Wilson, Jull and Lifton2007; Rinyu et al. Reference Rinyu, Molnár, Major, Nagy, Veres, Kimák, Wacker and Synal2013; Seiler et al. Reference Seiler, Grootes, Haarsaker, Lélu, Rzadeczka-Juga, Stene, Svarva, Thun, Værnes and Nadeau2019; Steier et al. Reference Steier, Liebl, Kutschera, Wild and Golser2017; Wacker et al. Reference Wacker, Němec and Bourquin2010b).
In this work, we present the performance of a novel fully automatic, easy-to-maintain graphitization line named μGRAPHILINE. This system aims to streamline this process by removing the requirement for reaction gases (oxygen, helium, and hydrogen) and LN2 through a controlled dual-zone combustion approach, dedicated gas transfer system, and zinc-iron CO2 reduction, thus removing operations, reducing risks, and enhancing throughput.
Methods
System overview
μGRAPHILINE features a modular design, comprising units that can independently handle combustion and graphitization of up to 32 samples simultaneously. Each module includes four sectors for combustion and graphitization, allowing flexible and efficient laboratory workflows (Figure 1).
The μGRAPHILINE system—configuration with four modules containing 16 parallel combustion and graphitization sectors in total.

A block diagram of the μGRAPHILINE line, including its main connections, gas port, and functional modules, is presented in Figure 2.
Schematic diagram of a μGRAPHILINE system. The bracket represents one combustion and graphitization sector, which can be connected in series (1–32) to the vacuum pump. Valves are pneumatic; pneumatic and electrical connections are omitted for clarity.

Combustion
The μGRAPHILINE system employs a novel two-stage combustion chamber that is described in more detail in Polish Patent Office application number P.448293 (Tudyka et al. Reference Tudyka, Kłosok, Jędrzejowski, Rakowski, Miłosz and Kolarczyk2024). The heater can set two different temperatures from 200–1050 °C in two different zones in a quartz glass tube (outer diameter 6 mm and length ca. 190 mm). Heating rates, end temperatures, combustion duration are either specified by the user or processed with default settings. Thermocouple is mounted in the combustion oven and measures the temperature at the bottom of the quartz tube.
In the quartz glass tube Copper(II) oxide (CuO) and a sample in the silver capsule is placed in two heating zones respectively. The combustion process involves two steps. The first step is the creation of oxygen through the reaction 2CuO → 2Cu + O2, where CuO is reduced to copper and oxygen. The second step involves the oxidation of carbon from the sample Csample + O2 → CO2, where carbon from the sample is converted to carbon dioxide. Since during combustion of organic material containing hydrogen, water will be produced a Peltier thermoelectric cooler is used to condense and freeze the produced water from the sample. Pressure is continuously monitored throughout the process. Additionally, silver is used to remove trace sulfur contamination (Koarashi et al. Reference Koarashi, Takeuchi, Saito-Kokubu and Atarashi-Andoh2025; Santos and Xu Reference Santos and Xu2017) to avoid any interaction with the subsequent graphitization step. The default values of heating rate, cooling rate, combustion time (at maximal temperature) are empirically set in order to find a compromise between fast combustion, and limit thermal shock applied to quartz glass tubes.
The μGRAPHILINE system is equipped with an interface port for direct connection with either Positive Ion Mass Spectrometer (PIMS) or Elemental Analyzer (EA) or Isotope Ratio Mass Spectrometry (IRMS) system. The port may serve both as an inlet or outlet. The possible application varies but are outside of the scope of this paper.
CO2 transport
The μGRAPHILINE system contains a custom made gas transportation system described in more detail in Polish Patent Office applications numbers P.448291 (Jędrzejowski et al. Reference Jędrzejowski, Kłosok, Tudyka, Rakowski, Miłosz and Kolarczyk2024), modified recently in order to minimize dead volume of the system (see P.452255; Kłosok et al. Reference Kłosok, Jędrzejowski, Kolarczyk, Gosek and Tudyka2025). The system does not require LN2 and in contrast to solutions based on molecular sieves it does not require helium. Each μGRAPHILINE sector contains a dedicated CO2 transport system, therefore each combustion and graphitization sector is independent and there is no risk of cross contamination. The gas transfer efficiency from the combustion to graphitization quartz tube is 90%. In our test, the gas pressure can be repeatedly set from 100 to 2000 mbars, which allows for preparing graphite targets with uniform mass, in our case mostly 1 mg C.
Graphitization
The graphitization sector in μGRAPHILINE can have a compact reaction volume from 1.25 up to 2.5 mL. In this study, we used reactors with a 2.5 mL volume, capable of producing graphite samples containing 0.12–2.4 mg C. Such a volume is particularly advantageous for the routine preparation of 1 mg carbon targets, with real-time monitoring of graphitization progress provided by an integrated pressure transducer. Upon completion, the system automatically calculates the graphitization efficiency based on the observed pressure change and reports the final graphite mass. The graphitization section is based on a Polish patent application P.448290 (Kłosok et al. Reference Kłosok, Tudyka, Jędrzejowski, Rakowski, Miłosz and Kolarczyk2024).
The graphitization process involves a two-step procedure. In the first step, a reduction process occurs Zn + CO2 → ZnO + CO. During this step, carbon dioxide is reduced to carbon monoxide, utilizing a zinc catalyst. This step is performed with a reactor containing 40 mg of zinc powder at temperatures ranging from 450 °C to 800 °C. In the second step, carbon monoxide is further reduced to form graphite on an iron catalyst in a reaction 2CO → CO2 + C(gr). This step is performed with a reactor containing 5 mg iron powder at temperatures ranging from 500 °C to 800 °C.
Software
The μGRAPHILINE system is equipped with fully automated software that manages both combustion and graphitization processes using a modular monolithic architecture. The block diagram and modular architecture of the software are illustrated in Figure 3. Software written in Python allows task parallelism across multiple combustion/graphitization units, the software uses dependency injection, a CQRS bus, and event-driven to ensure flexibility, scalability, and robust performance. Core libraries include pandas, matplotlib, taskflow, and dependency-injector.
Block diagram of the μGRAPHILINE software.

The graphical user interface, illustrated in Figure 4, makes operation straightforward: the user selects a module, enters the sample name, and chooses a preset program. Under the hood, the software automates all essential procedures, from data collection to real-time status displays. Automated calibration and safety protocols are integrated to detect issues like insufficient sample weight, abnormal pressure and temperatures, or leaks thereby minimizing risk and maintaining precision.
User interface of the μGRAPHILINE software.

Data from the whole process as well as sample information is recorded and saved to the database. Moreover, the software is designed with an emphasis on simplicity and processing large numbers of samples while maintaining simple adjusting of altering parameters for non routine samples.
Performance verification
Standards and reference materials
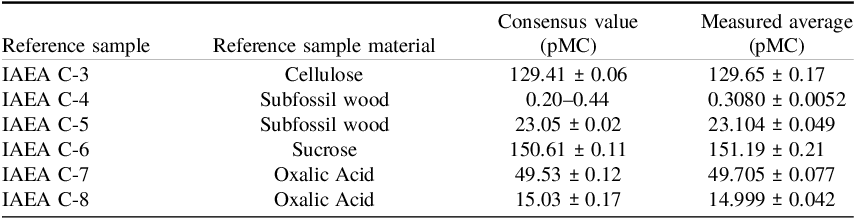
As a normalization standard we used the Oxalic Acid II (NIST SRM 4990C) (Mann Reference Mann1983). The blank 14C was produced from Phthalic Anhydride (PhA). In addition, reference materials from the International Atomic Energy Agency (IAEA) (Clercq et al. Reference Clercq, Van Der Plicht and Gröning1997; Rozanski et al. Reference Rozanski, Stichler, Gonfiantini, Scott, Beukens, Kromer and van der Plicht1992) were used as secondary standards. This includes IAEA C-3 cellulose, IAEA C-4 and IAEA C-5 which are both subfossil wood, IAEA C-6, also known as ANU Sucrose, IAEA C-7 and IAEA C-8 which both are Oxalic Acids.
Combustion
All standards and reference materials were placed in silver capsules. Firstly, CuO was heated to produce oxygen. Secondly, each sample was combusted under an automated program. Samples were typically combusted at a temperature of 950 °C. Figure 5 illustrates the pressure and temperature records for normalization standard (OxII), secondary standards (from IAEA C-3 to C-8), background (PhA), and an exemplary sample. The program performed the procedure automatically and adjusted the combustion time based on real-time pressure increases. Therefore, for some materials such as oxalic acids (Figure 5 OxII, C-7, C-8), combustion occurred much faster, and the program terminated the heating before it reached 950 °C, as decomposition for oxalic acid starts around 120 °C.
Pressure and temperature records for combusted standards and reference materials.

Graphitization
Obtained CO2 from the described materials was converted to graphite. Similarly, the pressure, and temperature on both reactors are adjusted to maintain high graphitization rates. Figure 6 presents the graphitization pressure records for tested samples that were performed during system tests conducted on one of the combustion and graphitization sector.
Graphitization pressure records for standards and reference materials.

AMS measurements
AMS measurements were performed on the MICADAS spectrometer at the Gliwice Radiocarbon and Mass Spectrometry Laboratory (Ustrzycka et al. Reference Ustrzycka, Piotrowska, Kłusek, Pawełczyk, Michczyńska, Michczyński, Kozioł and Jędrzejowski2025). Results were analyzed with the BATS software (Wacker et al. Reference Wacker, Christl and Synal2010a). In addition, some of the samples were sent to the University of Georgia, USA, for the measurements on the CAIS 0.5 MeV accelerator mass spectrometer (Cherkinsky et al. Reference Cherkinsky, Culp, Dvoracek and Noakes2010).
Results
During the tests over 180 graphite targets from various standards and reference materials were graphitized for performance verification. Graphitization pressure records from standards and reference materials are shown in Figure 6. For most samples, the graphitization process was completed within 150 minutes, allowing for combustion and graphitization within 3.5 hours.
Results for two series are presented in Figure 7. The series shown in Figure 7a illustrates measurements performed using the MICADAS system at the Silesian University of Technology. The slope of the linear regression is 1.00210 ± 0.00097, indicating good agreement between the expected and measured values. The series shown in Figure 7b illustrates measurements performed using the CAIS 0.5 MeV accelerator mass spectrometer at the University of Georgia. The slope of the linear regression is 1.0049 ± 0.0023, again showing good agreement between the expected and measured values. These coefficients were derived from samples from the single magazine. Numerical comparison between average values and consensus values is presented in Table 1.
System performance tests with IAEA reference materials: a) on the MICADAS system at the Silesian University of Technology. Measured in a single magazine. b) on the CAIS 0.5 MeV accelerator mass spectrometer at the University of Georgia. Measured in a single batch.

Performance of the μGRAPHILINE system on IAEA reference materials (Clercq et al. Reference Clercq, Van Der Plicht and Gröning1997; Rozanski et al. Reference Rozanski, Stichler, Gonfiantini, Scott, Beukens, Kromer and van der Plicht1992). Table presents the measured percent modern carbon (pMC) compared with their consensus values

Using the MICADAS system that operates in Gliwice, the average background level of the μGRAPHILINE PhA background is 0.238 ± 0.025 pMC, which corresponds to 48,500 BP.
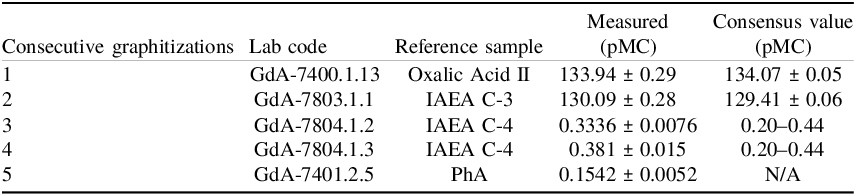
The sample-to-sample memory effect was evaluated using an IAEA C-3 standard followed by two IAEA C-4 standards (Table 2). These results indicate that the observed memory effect was very low and remained within the accepted limits for reliable radiocarbon measurements.
Memory effect test series measured on the MICADAS AMS system at the Silesian University of Technology

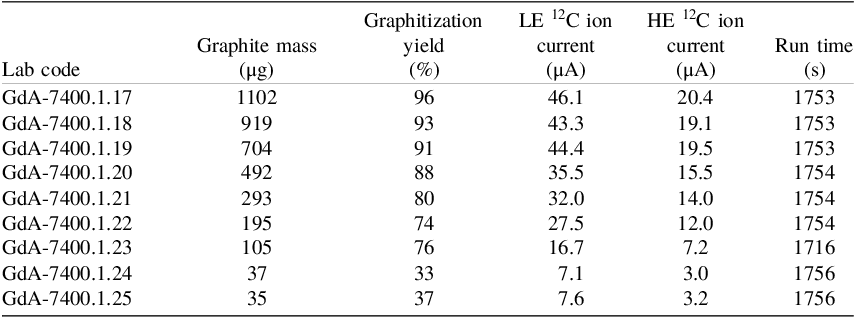
Regarding the graphitization of smaller samples, pressure records from the graphitization process are shown in Figure 8, with the carbon mass indicated. Measurements of those samples were conducted with the MICADAS system in Gliwice. Brief overview of numerical data, including initial pressure, graphitization yield, target mass after graphitization, MICADAS low energy (LE) 12C ion current, and run time are summarized in Table 3.
Graphitization pressure records for Oxalic Acid II, with various initial mass. Values above pressure records indicate the carbon mass.

Graphitization and ion currents on the Gliwice MICADAS for Oxalic Acid II

The LE 12C ion current for OxII normalization standard, depending on sample size, is shown in Figure 9. Each point on the plot represents a cycle, and the dashed line indicates the end of a pass. As shown, a sufficient current is obtained for samples of approximately 0.2 mg of carbon. All samples were measured in a single magazine under the same conditions.
Low energy 12C ion current on MICADAS from Oxalic Acid II graphite targets containing various carbon masses vs measurement time.

Conclusions
The μGRAPHILINE system was designed to reduce the dependence of conventional graphitization setups on liquid nitrogen and high-purity carrier gases. Tests on over 180 standards and reference materials showed excellent agreement with consensus values, with stable background levels of ∼0.24 pMC (equivalent to ∼48,500 BP). The system routinely achieved graphitization yields above 90% and produced graphite suitable for AMS analysis within ∼3.5 hours per sample. Reliable performance was observed across a wide range of sample sizes, from routine 1 mg C targets down to ∼0.2 mg C, with ion currents sufficient for precise AMS measurement. The sample-to-sample memory effect remained low and within accepted limits.
Automation of combustion and graphitization, together with a modular design enabling parallel operation, represents a potential advantage for laboratory throughput and operator efficiency. Nonetheless, independent interlaboratory validation will be necessary to confirm reproducibility under varied operating conditions.
Taken together, these results indicate that μGRAPHILINE can provide a robust and efficient approach to radiocarbon sample preparation, with possible applications extending from conventional dating to compound-specific and isotope analyses.
Acknowledgments
Authors KK and MJ contributed equally to this work. KT, MJ and AU were supported under the Excellence Initiative – Research University programme implemented at the Silesian University of Technology, in the academic year 2024/2025. We sincerely thank Grzegorz Poręba for his numerous comments during the project. The authors would like to thank the Centre for Incubation and Technology Transfer at the Silesian University of Technology for support and pro-innovation consultancy services. The work was partially financed by the Polish Ministry of Science and Higher Education within the ”Incubator of Innovation 4.0” program in the framework of the Smart Growth Operational Programme, Action 4.4 Potential increase of human resources of the R&D sector. This work was partly supported by the National Science Centre, Poland, grant UMO-2022/45/B/ST10/02095.
Conflicts of the interest
The authors declare the following financial interests/personal relationships which may be considered as potential competing interests: Kłosok et al. has patent applications at Polish Patent Office P.448290 and P.452255 (pending). Jędrzejowski et al. has a patent application at Polish Patent Office P.448291 (pending). Tudyka et al. has a patent application at Polish Patent Office P.448293 (pending).


 Open access