In 2016, some of Donald Trump’s armed supporters were observed “menacing” a Democratic Party campaign office; during the same election, a Republican campaign office was firebombed (Rosza Reference Rosza2016). Though rare today, electoral violence was once widespread in the United States, and remains so in a number of democracies.Footnote 1 Attempts to restrict voting are not unusual, but in consolidated democracies voter suppression is seldom violent. Why? We examine why approaches to voter suppression vary, and why it appears to evolve from violent to non-violent. To illustrate our arguments, we examine a critical transitional period in voter suppression in the post-Reconstruction American South: the shift from decentralized violence and intimidation to institutionalized means of disenfranchising blacks. We also place recent suppression efforts into this broader historical and theoretical context.
Fundamentally, political competition—in modern democracies this almost always means party competition—drives voter suppression. Yet suppression is not ubiquitous, reflecting its varying costs and benefits. Similarly, the form that suppression takes (our main focus) varies considerably. We argue that when suppression is desired, but would-be suppressors are unable to enact and implement laws to accomplish this from a lack of political and state capacity or from external actors making the enactment of suppression laws prohibitively costly, then we will see ad hoc, decentralized, and sometimes violent voter suppression. But decentralized violence has high reputational costs, is less effective, and can itself undermine state power. Therefore, as political and state capacity increase and external constraints recede, voter suppression will generally shift from being decentralized, ad hoc, and sometimes violent to centralized, (mostly) non-violent approaches.
Our arguments are general to democracies, but we illustrate and test our argument with qualitative and quantitative analysis of the suppression of black voting in the post-Reconstruction American South. The intense party competition of the era led to voter suppression by state political parties and governments on both sides of the Mason-Dixon line, and calculations about electoral outcomes shaped the willingness of federal Republicans to intervene in defense of black voting rights. In the South, voter suppression was driven by the fact that blacks were numerous enough to threaten white, Democratic control of government … if they voted. Initially, however, Southern Democrats lacked the internal capacity to enact and implement voter suppression policies and, even after this capacity was achieved, federal (Republican) intervention—or the threat thereof—protected black suffrage. Therefore, voter suppression was decentralized, ad hoc and violent, directed by elites within the Democratic Party, and carried out by elites and the rank and file.Footnote 2 After Democrats consolidated control over state governments, state capacity increased, and federal Republicans largely abandoned black voting rights, Southern states shifted to using laws to suppress black voting, due to the reputational costs and relative ineffectiveness of violence. We examine whether law (largely) replaced violence to suppress voting during this period.
Systematically measuring electoral violence is difficult, but reliable data on lynchings exists. The social science literature is skeptical on whether lynchings were used to suppress voting, but astute contemporary observers noted this link (Johnson Reference Johnson1924; Wells 1900; see also Ortiz Reference Ortiz2006). Here, we take advantage of a larger dataset and finer-grained temporal variation in the “threat” of black voting, and importance of violence to suppress it, to examine the link between lynchings (which we view also as a proxy for more common forms of electoral violence) and voter suppression. We find that before Jim Crow disenfranchisement more lynchings occurred in areas of Populist Party strength and as elections approached. Under Jim Crow, lynchings declined overall and the link between electoral factors and lynchings was severed. Centralized law mostly replaced decentralized violence.
Understanding voter suppression’s evolution during this period is important in its own right. The roll back of black (male) voting rights is one of the largest disenfranchisement of voters in history (Gibson Reference Gibson2013), with effects—both domestic and international—that reverberated for over a century, shaping the American state’s development and policy outcomes for decades and contributing to the creation of the “Solid South” (Borstelmann Reference Borstelmann2009; Francis Reference Francis2014; Katznelson, Geiger, and Kryder Reference Katznelson, Geiger and Kryder1993; Rohde Reference Rohde1991). But our framework also helps us understand current attempts to restrict voting. Due to earlier federal interventions, the forms of legalized suppression used after Reconstruction are no longer permissible. Yet in recent years we see growing attempts to restrict voting by blacks and other groups (e.g. college students, immigrants). We place these attempts in broader historical and theoretical context using our framework.
The Whys and Hows of Voter Suppression
Political elites engage in many types of electoral manipulation (Svolik and Chernykh Reference Svolik and Chernykh2014). One approach is to interfere with the exercise of the legal right to vote. Though possible in non-party systems because parties are central to political competition in modern democracies, in practice party competition drives voter suppression. Parties value holding office for its own sake, but also to achieve other material and policy goals (Aldrich Reference Aldrich1995). This desire to hold office leads parties to mobilize their supporters, and sometimes demobilize their opponents.
Not all parties attempt to restrict voting, reflecting suppression’s varying costs and benefits. If parties believe they will easily win free and fair elections, there is no reason to suppress the vote, especially since keeping electoral practices clean has benefits in terms of perceived legitimacy (Hafner-Burton, Hyde, and Jablonski Reference Hafner-Burton, Hyde and Jablonski2014; Rozenas Reference Rozenas2016). The “legitimacy cost” of voter suppression is problematic if internal opposition groups are strong enough to capitalize on it, or if elites are reliant on external actors for support. While state governments have primary responsibility for determining voting procedures in the United States, the federal government nonetheless acts as an external constraint, via the creation and enforcement of laws related to voting rights. Therefore, the federal stance toward voting rights is important. In most countries—even many federal states—there is no similar system, but external entities (e.g., the European Union) can potentially impose constraints.
Voter suppression is sometimes pursued despite these potential costs and constraints, because suppression has large potential benefits. Numerically larger out-groups present larger threats, since voting systems provide more power to larger groups, but if elections are closely divided, then suppressing the vote of smaller groups becomes attractive (Blalock Reference Blalock1967). Voter suppression will also be more likely when groups competing for power have large policy preference gaps because this raises the benefits (costs) of winning (losing) elections.Footnote 3
Our focus is on understanding why parties choose among different means of voter suppression. For our purposes, suppression can be placed into two categories: ad-hoc, extra-legal, and decentralized versus institutionalized, legal, and centralized. The former is more likely to employ intimidation and violence (e.g., contemporary terror attacks at polling places). Jim Crow voting restrictions are paradigmatic examples of the centralized, institutionalized approach. Why do actors choose among different approaches to suppression? Centralized, institutionalized approaches require law-making majorities in favor of suppression, which we call political capacity. Centralized suppression also requires a relatively knowledgeable and well-developed bureaucracy—state capacity—to craft and implement effective laws (Skocpol and Finegold Reference Skocpol and Finegold1982). For instance, using poll taxes to suppress only certain voters requires information on who can pay and institutions capable of record-keeping and processing payments. Thus, only parties with reasonable political and state capacity can engage in institutionalized, centralized suppression.Footnote 4
Especially in a federal system like the United States, external constraints also matter. Enacting formal laws repealing voting rights can invite external intervention. Nation-states may face similar constraints to the degree that they are part of supra- or international organizations or are reliant on outside actors for resources. These internal and external constraints interact, and internal actors actively attempt to influence external actors to use their power to allow or prevent voter suppression as they desire. Thus, due to internal and external constraints, not all elites are capable of creating and implementing effective legislative, bureaucratically-implemented voter suppression schemes. Where suppression has substantial benefits to a party or faction it may still occur, but it will necessarily be ad hoc and decentralized.
One benefit of decentralized suppression is plausible deniability, minimizing reputational costs. However, even ad hoc approaches often convey to observers which groups are responsible for suppression, since political opponents, journalists, and NGOs monitor elections for precisely these types of activities. Furthermore, if extra-legal suppression becomes violent there are substantial reputational risks for suppressors, increasing the costs of suppression. In addition, extra-legal approaches to suppression are less predictably effective since they rely on semi-autonomous actors for implementation, who must overcome both collective action costs to organize and transaction costs related to information, monitoring, and sanctioning. Decentralized ad hoc suppression, especially if it turns violent, also risks further undermining the power of the state by demonstrating its inability to maintain order (Johnson Reference Johnson2010).
Institutionalized forms of voter suppression have several benefits opposite the aforementioned costs of extra-legal suppression. First, people are generally compliant with laws benefiting their group, even those imposing costs, if they expect compliance by others (Levi Reference Levi1997). Not only do laws induce cooperation by threatening sanctions for their violation, they further induce cooperation by affecting expectations about others’ behaviors and the pay-offs of different strategies (McAdams Reference McAdams2000). Second, though even voting laws implemented by formal bureaucracies leave some room for discretion in enforcement, formal laws are more predictably implemented and therefore have more predictable effects (Bishop Reference Bishop1892; Atkeson et al. Reference Atkeson, Bryant, Hall, Saunders and Alvarez2010). Being able to reasonably predict the extent of voter suppression is important for politicians strategic about where to campaign and direct their resources. Third, legal restrictions are less likely to produce violence, which imposes reputational costs on regimes. Finally, once it is harder for certain groups to vote, opposition parties that might find a natural constituency in marginalized groups will spend less time appealing to and mobilizing these groups’ members.Footnote 5 Formalized policies thus have characteristics of self-enforcing institutions, which ad hoc voter suppression lacks.
There are downsides to using formal laws to suppress voting. As Perman (2003) notes, formal laws tie the violation of democratic norms and rights very directly to a particular regime, damaging its reputation. Elites attempt to avoid this by writing restrictions to appear neutral to different groups and in the service of acceptable goals, like preventing voter fraud. Furthermore, to the extent that internal and external audiences are unconcerned, legitimacy costs are minimized. Overall, then, institutionalized voter suppression is generally preferable. This means that when internal political and state capacity increase and external constraints decrease we should see a shift from ad hoc, decentralized, and violent voter suppression to centralized, non-violent approaches, which we discuss further in the context of the U.S. South.
Evolving Voter Suppression in the South after Reconstruction
To be readmitted to the Union, Southern states had to rewrite their constitutions and ensure the rights guaranteed to blacks in the U.S. Constitution and federal enforcement statues, including suffrage for black males. White Democratic Party leaders in the South wanted to reinstitute control over black citizens. But this would require substantial policy changes from the Reconstruction-era status quo, and was virtually impossible as long as many blacks voted because, even in areas lacking black majorities, blacks could be pivotal to election outcomes (Foner Reference Foner1993; Perman 2003).
Almost immediately after blacks won the right to vote, white Southern Democrats began trying to reverse black suffrage (Redding Reference Redding2010). There was nothing unique about the South that led to voter suppression in this era. Due to intense party competition governments throughout the country engaged in suppression, and federal officials weighing intervention considered how voter suppression in the states would affect their electoral fortunes, as we will discuss. Republicans wanted to expand voting by their supporters, including Southern blacks, but many Republican-controlled state governments in the North enacted laws like literacy tests and poll taxes, aimed at recent immigrants who supported the Democratic Party (Keyssar Reference Keyssar2009).Footnote 6 Party competition can drive both expansions of voting and voter suppression (Ansell and Samuels Reference Ansell and Samuels2014; Valelly Reference Valelly1993).
In contrast with the North, however, violence was central to suppressing black voting in the South. As Key (1949, 536) notes, “force and the threat of force had put the whites in power.” What can explain the use of violence in the South, rather than the institutionalized approaches in the North? Though some argue that a particularly violent culture led to the use of violence (Cash et al. Reference Cash1941), rapid changes in levels of violence over short periods of time cast doubt on this.Footnote 7 A violent culture may facilitate, but variation in the use of violence, both in the South compared to the North and in the South over time, is better explained by our internal and external constraints framework.
In the late 1860s some Southern states did attempt to enact laws restricting black suffrage, but these were overturned by federal legislation and enforcement of voting rights because Republicans controlling the federal government wanted to develop a national party to consolidate the political victories of the Civil War; this would require black votes in the South (Valelly 2009a). While Republicans wanted to compete in the South and stationed federal troops there to enforce voting rights, Southern states could not implement legal, institutionalized forms of suppression (Perman 2003). Internal factors also limited the enactment of voter suppression laws. Because of the Republican Party’s efforts (both via official government institutions and party organization), many blacks and white Republicans supportive of black suffrage held power in Southern governments, limiting the political capacity of Democrats to enact laws (Foner Reference Foner1993). Second, even once Democrats regained control of government, implementing effective laws was difficult due to the relative lack of state capacity after the Civil War (Herron Reference Herron2017; Hyman Reference Hyman1989).
Given these constraints, decentralized violence and intimidation quickly became the preferred means of voter suppression, often initiated by Democratic Party leaders, with the support of average white Southerners (Brundage Reference Brundage1993; Foner 2014; Mickey Reference Mickey2015). For example, the “Edgefield Plan” in South Carolina, written by former Confederate General Martin W. Gary, laid out a scheme to organize citizen militias to ensure white Democrats suppressed black participation. Decentralized and violent, it read, in part: “Every Democrat must feel honor bound to control the vote of at least one negro, by intimidation, purchase, keeping him away or as each individual may determine, how he may best accomplish it.”Footnote 8
Though the Democrats had generally regained power in Southern governments by 1877, concerns that white competitors and blacks could ally and threaten their control remained (Perman Reference Perman1985). Thus, violence was used to suppress black voting and drive Republicans from office (Gibson Reference Gibson2013; Rushdy Reference Rushdy2012). Voter turnout declined dramatically for whites and blacks over two decades, but Redding and James (Reference Redding and James2001) show that black turnout declined much more dramatically than white. Nevertheless, violence was only partly effective in suppressing black voting. In 1892, fifteen years after federal troops largely left the South, the black turnout rate remained roughly 50% in some Southern states. As Redding (Reference Redding2010) notes when comparing North Carolina to the rest of the South, “violence and fraud had turned out to be effective elsewhere, but involved collective action mobilization and tended to only work as a temporary fix.” Relying on whites to feel “honor bound” to suppress black voting and decentralized actors to coordinate voter suppression was never going to be entirely effective, particularly as long as some blacks heroically risked life and limb to continue to vote (Kousser Reference Morgan1974, 14). As John Lynch, the last black Congressman from Mississippi until the 1980s, told the House in 1882, black voters in the South “have bravely refused to surrender their honest convictions, even upon the altar of their personal necessities.”Footnote 9
Furthermore, violence—especially lynchings—troubled some Southern and many Northern elites (Francis Reference Francis2014; Kato Reference Kato2015; Mickey Reference Mickey2015). The inability to prevent “excessive” violence resulted from and vividly highlighted the weak state capacity of the South (Johnson Reference Johnson2010). While violence persisted, Southern leaders feared that the federal government might reoccupy the South to monitor elections (Valelly 2009a; Gibson Reference Gibson2013). In sum, ad hoc violent voter suppression was used due to internal and external constraints on “legal” approaches, but was only partly effective and had serious reputational costs. This led Southern Democrats to search for a centralized, institutionalized, and non-violent means of suppression (Kousser 1999). For example, at the Alabama Democratic convention in 1900, one delegate stated that “we have disfranchised the African in the past by doubtful methods, but in the future we’ll disfranchise them by law.”Footnote 10 The pursuit of legalized voter suppression by Southern Democrats only became possible once violence had been successful enough to put Democrats back in power, Southern state governments (re)developed electoral institutions, and national Republicans abandoned black voters (Brandwein Reference Brandwein2011; Mickey Reference Mickey2015; Kato 2016). Internal capacities and external constraints interacted to shape the form of suppression, and the ensuing shift toward law made possible by the removal of internal and external constraints.
The suppression of Republican voting and the removal of a sufficient number of black and white Republicans from office through violence and intimidation meant that white Democratic “Redeemers” controlled law-making institutions in most Southern states by the late 1870s. Despite this, Southern states did not necessarily have the capacity to implement voter suppression laws. Herron (Reference Herron2017) details how a primary goal of Redeemer governments upon assuming power was cutting funding for or eliminating institutions created or expanded by Republican governments.Footnote 11 This state retrenchment limited state capacity. Furthermore, before they could effectively disenfranchise blacks, election oversight institutions also needed to be reconfigured along the lines of Democratic preferences after being controlled by Republicans during Reconstruction.Footnote 12 Over time, state capacity and control over election administration institutions increased, and Southern Democratic governments had a growing ability to create and implement effective voter suppression laws (Key Reference Key1949; Johnson Reference Johnson2010).
Yet, as long as Republicans attempted to compete in the South, which required black votes, federal intervention in Southern elections was a possibility (Brandwein Reference Brandwein2011).Footnote 13 Records from post-Reconstruction state constitutional conventions illustrate that Southern governments were concerned about federal intervention if legal disenfranchisement was aggressively pursued (Brandwein Reference Brandwein2011; Herron Reference Herron2017). The defeat of the Lodge Elections Bill in 1890, which would have allowed for federal judicial oversight of registration and voting in congressional elections, was a sign of wavering Republican commitment to black voting rights. But this bill did not fail due to an opposition to black voting rights per se, and in the next couple of election cycles some leaders of the Republican Party thought that competing in the South remained important (Valelly 2009b).
This commitment to competing in the South and black voting rights did not last too much longer, however. Due to significant defeats in the 1890 and 1892 elections, along with deaths and retirements, very few Republicans who had engaged in the early fights over suffrage and were committed to building the party in the South remained in Congress. As Kousser (Reference Morgan1974, 31) notes, the “old guard” was replaced by “younger men to whom abolition and Reconstruction seemed irrelevant, merely picturesque, or even evil.” The electorate had tired of sectional fights by the 1890s and new Republican leaders were more committed to the promotion of business as a way to build a national party (Brandwein Reference Brandwein2011). And once this approach was at least partly vindicated by winning unified government in the election of 1896 without being competitive in the South, black voting rights were abandoned (Gibson Reference Gibson2013; Valelly 2009a). Indeed, in 1894 Republicans won one of the then-largest Congressional victories in history, taking over 70% of the House and more than doubling their previous seat share; in 1896 Republican McKinley won the presidency in a landslide. These overwhelming Republican majorities did not attempt to reverse the Democrats’ 1894 undoing of some federal election statutes, and in 1896 the GOP removed from its platform a plank calling for free and fair elections in the South (Kousser Reference Morgan1974; Mickey Reference Mickey2015).
The first laws limiting black voting had a limited reach, for instance disenfranchising those convicted of a crime. As Valelly (2009a, 130) explains, legal disenfranchisement was “a process … its backers could not and did not do all of what they wanted right away.”Footnote 14 Once it became clear that the federal government would not intervene in Southern elections, however, broader laws eliminating black suffrage were enacted (Kousser Reference Morgan1974; Brandwein Reference Brandwein2011). Compared to decentralized violence, these broader suffrage restrictions were very effective. In Louisiana in 1896, over 130,000 blacks were registered to vote; by 1904, after the enactment of several restrictions on voting, only 1,342 black voters were registered. A contemporary Congressional report stated that violence was “no longer necessary because the laws are so framed that the Democrats can keep themselves in possession of the governments in every Southern State.”Footnote 15
Analyzing the Evolution from Violence to Law
Violent voter suppression did not disappear entirely even after Jim Crow’s enactment; activists registering black voters in the South were murdered as late as the 1960s. But if Jim Crow laws actually served as a change in the tactics of suppression, we should see declining violence to suppress black voting once in place. One difficulty with testing this argument is that reliable measures of the myriad types of violence are lacking. However, there are reliable data on the notorious lynchings widespread across the South during this period. While it is agreed that violence and intimidation were used to suppress black voting, it is not clear that lynchings, specifically, served this purpose.
Perhaps the dominant interpretation of lynchings is that they were largely a response to economic threats posed by newly-freed black laborers (Beck and Tolnay 1992; Soule Reference Soule1992; Tolnay and Beck 1995). Beck and Tolnay (Reference Beck and Tolnay1990), for example, find that—along with the black percentage of the population—inflation and low cotton prices were associated with more lynchings. Other scholars argue that lynchings were aimed at maintaining white racial solidarity in a general sense (Johnson Reference Johnson2010; Smångs Reference Smångs2016). It is also argued that lynchings were essentially a form of localized, ad hoc law enforcement and that once state capacity increased, lynchings declined (Clarke Reference Clarke1998).Footnote 16 It is true that most lynchings involved some criminal accusation.Footnote 17 But sometimes the “crimes” involved little more than blacks asserting their political rights. Even in instances where victims were accused of crimes, in some cases the root cause was political conflict.Footnote 18
While a number of factors drove lynchings, Ida B. Wells (1900)—writing near the height of lynching activity—observed that the desire to suppress black suffrage was central to lynching’s emergence:
in support of its plans [to nullify black voting rights] the Ku-Klux Klans, the “red-shirt” and similar organizations proceeded to beat, exile, and kill negroes until the purpose of their organization was accomplished and the supremacy of the “unwritten law” was effected. Thus lynchings began in the South, rapidly spreading into the various States until the national law [ensuring black voting rights] was nullified.”
Writing during this era, Tourgée (1879, 229) noted that violence was an expression of “an ineradicable sentiment of hostility to the negro as a political integer.” A couple of decades later James Weldon Johnson (Reference Johnson1924) agreed, noting that lynching was an “instrument for terrorizing Negroes, keeping them from voting.” Contemporary whites also noted this aspect of lynching. Ortiz (Reference Ortiz2006) quotes a Florida Times Union editorial from 1904 that read: “In the South, the negro in politics is not tolerated … there are lynchings so nearly everywhere that the rule is established.”Footnote 19
Though commonly understood as highly public spectacles, many lynchings were done in relative secret (Smångs Reference Smångs2016). These secret, targeted assassinations of black office holders or activists could have tangible consequences on black mobilization, and were critical to Democrats regaining power in the South (Gibson Reference Gibson2013). Highly public lynchings were more akin to terrorism (Wood Reference Wood2011), creating a spectacle designed to reinforce group boundaries and strengthen white racial solidarity, including identification with the “white man’s” Democratic Party, according to Smångs (2006).Footnote 20
If lynchings were used to suppress black political mobilization, we should observe more of them where such mobilization was a greater threat. Sociologists analyze how the Populist challenge to Democratic power in the 1880s and 1890s may have fueled lynchings, and historians document the use of violence to suppress “opposition” (non-Democratic) voting during this era, including targeted violence (including murder) prior to elections and on Election Day itself.Footnote 21 The Populist Party threatened white supremacy and Democratic hegemony because in some states it was explicitly biracial; even where this wasn’t the case, though, once party competition existed there would always be the temptation to mobilize blacks and poor whites to win (Key Reference Key1949; Kousser Reference Morgan1974; Valelly 2009a).Footnote 22 In addition, party competition would be likely to lead to policy appeals to whites and poor blacks that the land owning-elites who ran the Democratic Party feared, e.g., expanding social services and taxation (Aldrich and Griffin Reference Aldrich and Griffin2018; Key Reference Key1949). In a national-level analysis from 1882–1941, Olzak (Reference Olzak1990) finds that lynchings did increase following elections in which the Populists ran a candidate in the presidential election; Soule (Reference Soule1992), however, fails to find that lynchings were higher in Georgia counties where Populists received greater shares of the vote in the 1892, 1894, and 1896 elections.
While suggestive, existing studies are generally limited to a small number of years or states, and further fail to account for changing legal/institutional environments.Footnote 23 In examining whether law supplanted violence, we put forward three expectations regarding the timing and incidence of lynchings (which we think are a reasonable proxy for other harder to measure forms of violence). First, we expect more lynchings in areas of Populist Party strength. Second, if lynchings were used to suppress black voting, we should observe that lynchings increase as elections approach. To our knowledge, no research has examined this latter possibility. Third, if law supplanted violence, we expect these two relationships only before the enactment of Jim Crow voter suppression laws. Lynchings, of course, continued for other reasons even after “the political excuse was no longer necessary,” as Wells (1900) put it. But after Jim Crow laws are in place, we expect to observe a decline in the total number of lynchings and that Populist strength and the time to an election are no longer significant predictors of lynchings.
Because collecting data even for this most notorious form of violence against blacks is very burdensome, most studies focus on one or a small number of states. Seminal studies by Tolnay and Beck (Reference Tolnay and Beck1992, 1995) are notable exceptions, and we use these data, which Cook (Reference Cook2012) argues are the most comprehensive data on lynchings in the South and the best for academic study. We analyze eleven Southern states that experienced more than one lynching event between 1876 and 1952, using county-month as the unit of analysis. We examine counties because they were critical units of government in the era, and the threat of black political participation varied within states (Redding Reference Redding2010).Footnote 24 This comprehensive database of numerous states is essential for adequately testing our arguments because lynching was a relatively rare activity. The outcome variable presented in our primary analyses is whether a given county experienced a lynching event in a given month.
To identify the institutionalization of voter suppression via Jim Crow, we consider nine distinct laws identified by Kousser (Reference Morgan1974): poll taxes, registration requirements, multiple-box voting, secret ballots, literacy tests, property tests, understanding clauses, grandfather clauses, and the white primary. Valelly (2009a) shows that legal disenfranchisement was a process, and that these laws took time to eliminate black suffrage. We therefore make the conservative decision of classifying a state as having institutionalized voter suppression after the second such law was adopted, the years of which are reported in Table 1.
Jim Crow law adoption by year
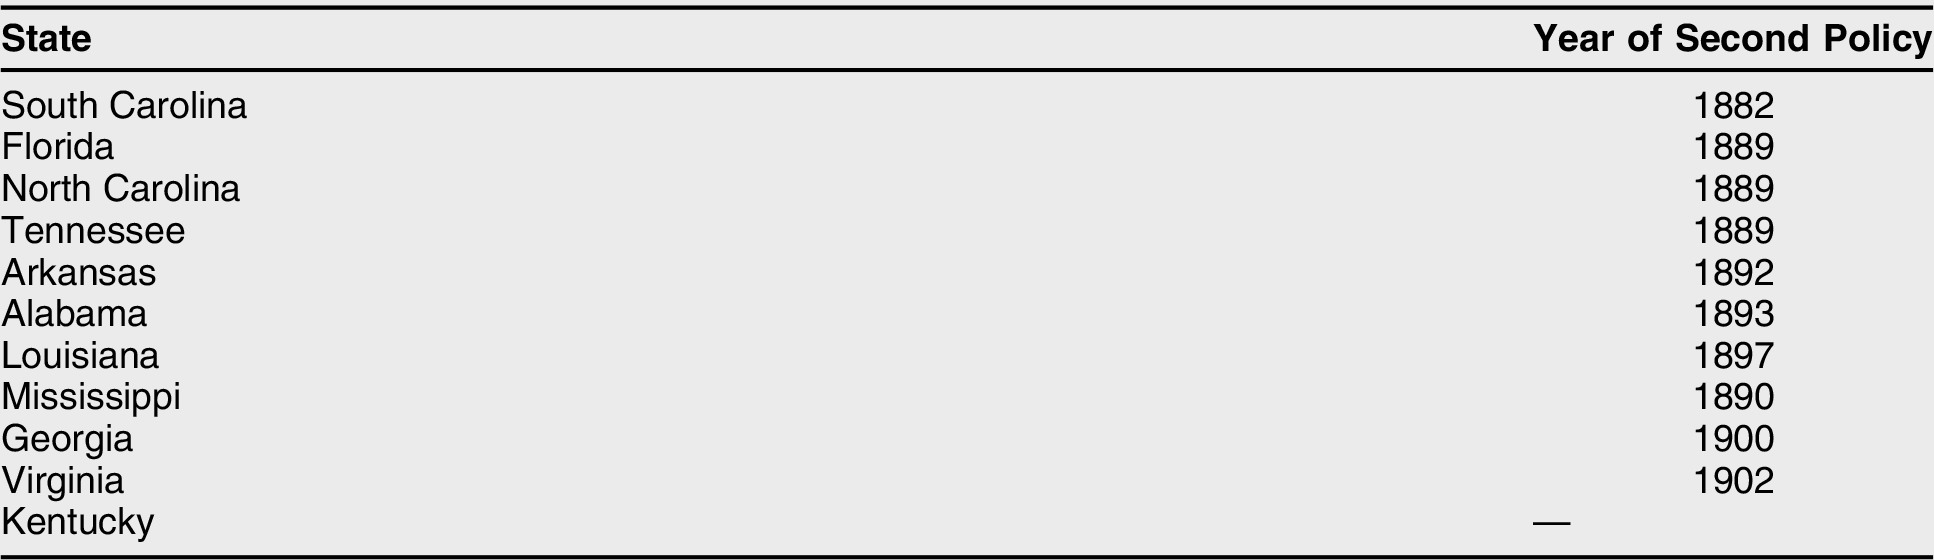
Notes: The year in each state the second Jim Crow voter suppression law was adopted. Although Kentucky adopted a poll tax in 1891, it never adopted a second such law.
A key variable is the number of days until the next Congressional election (for election timing, see Davenport Reference Davenport1997), assigning to each month the date of the 15th.Footnote 25 For instance, if the county-month were the October just prior to a Congressional election on November 5, this variable would take on the value of 21. If legal suppression replaced lynchings, we should observe that prior to Jim Crow this variable is associated with lynchings, but that after Jim Crow this relationship disappears (note that due to the fixed electoral calendar the timing of elections is exogenous to contemporary political mobilization, ensuring it is not endogenous to outbreaks of political violence). The days to election variable is correlated with seasonal patterns in lynchings observed in prior research (because elections are held in the autumn), but analyses show that prior to Jim Crow the days to election variable fits the data much better than a simple seasonal dummy (refer to the online appendix). To measure Populist threat, we use the county-level Populist vote share in the previous Congressional election.
We also include controls to generate more accurate estimates. Because the threat of black voting is greatest where blacks are more numerous, we include a county’s black population (%) and its square, which enables us to determine if the relationship between the black population percentage is curvilinear. Based on previous research we expect Republican electoral support in a county is actually associated with fewer lynchings, since the Republican Party was not generally a realistic electoral threat and areas with more Republicans were more supportive of black rights (Blalock Reference Blalock1967; Corzine, Creech, and Corzine Reference Corzine, James and Lin1983). We also include dependence on cotton, the most commonly-used economic covariate, to proxy for economic motivations for lynchings. Following Hagen, Makovi, and Bearman (Reference Hagen, Makovi and Bearman2013), we measure a given county’s dependence on cotton as the ratio of acreage of farmland devoted to cotton production and total agricultural acreage (from U.S. Agricultural Censuses). Finally, we include a time covariate to capture any potential trend in the occurrence of lynchings not captured by our variables of interest.
While included covariates account for county-level factors, unobserved state-level political factors likely affect lynchings and therefore we estimate both logistic regression models with state fixed effects and hierarchical models with state-varying intercepts. The supplemental analyses examine robustness to our classification of both lynching events and the institutionalization of Jim Crow.
Law Replacing Violence in the South
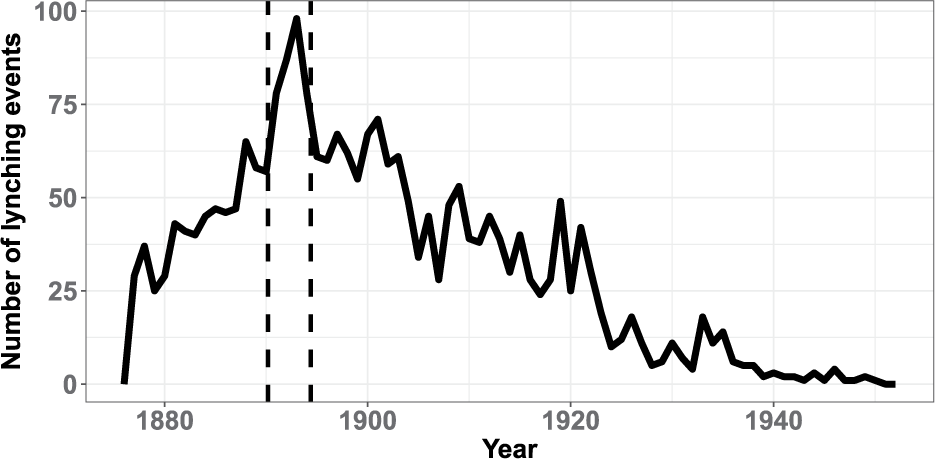
A simple yearly time series of lynching events aggregated across counties during the period discussed can serve as a first, crude test of our arguments. Figure 1 plots the yearly number of lynching events in the eleven states, and is annotated with two vertical dashed lines. The first is in 1889, the year the first Jim Crow voter suppression law was introduced, the second 1894, when two such laws were in effect (both averaging across the eleven states, as plotting nearly two dozen lines would be illegible; refer to the online appendix for dates of adoption of each law in each state). At least three notable things stand out looking at figure 1. First, the number of lynchings rose dramatically the moment Reconstruction ended and federal troops left the South; from 1877, we see an increase until violence reaches its apex in 1893, when lynchings were recorded in 118 counties. Second, the period when Jim Crow laws were being debated and adopted in Southern legislatures saw the highest levels of lynchings, peaking just before the second Jim Crow law was put in place in most Southern states. Third, a multi-decade decline follows almost immediately after Southern states begin to enact multiple Jim Crow laws to more fully disenfranchise blacks. The descriptive statistics presented in figure 1 are broadly consistent with our argument, but it is necessary to examine the changing relationship between black political threats and lynchings before and during Jim Crow to adequately investigate our argument.
Lynchings over time
Notes: Historical trend of number of lynching events per county-month by year in the eleven states examined. The first dashed vertical line is 1889, the year after the first Jim Crow voter suppression laws were introduced (averaged across these states), the second is 1894, the year after two such laws were in effect.

The results of models 1 and 2 in table 2 show that before Jim Crow, when elections are more proximate and when and where Populists present a greater threat, lynchings are more likely. The coefficients for the control variables for all models are in the expected direction and significant, and the time trend coefficient is also significant. Models 3 and 4 illustrate that days to election and the Populist threat are irrelevant to the number of lynchings once Jim Crow is in place: the magnitude of the coefficient for Populist threat falls by a quarter and does not approach significance, and the estimated effect of days to election is zero. As crucial is the fact that the economic factor associated with lynching does not become irrelevant after Jim Crow is in place, suggesting that legal disenfranchisement disrupted the existing political equilibrium of violence while leaving the economic forces driving lynching untouched.
Lynching before Jim Crow
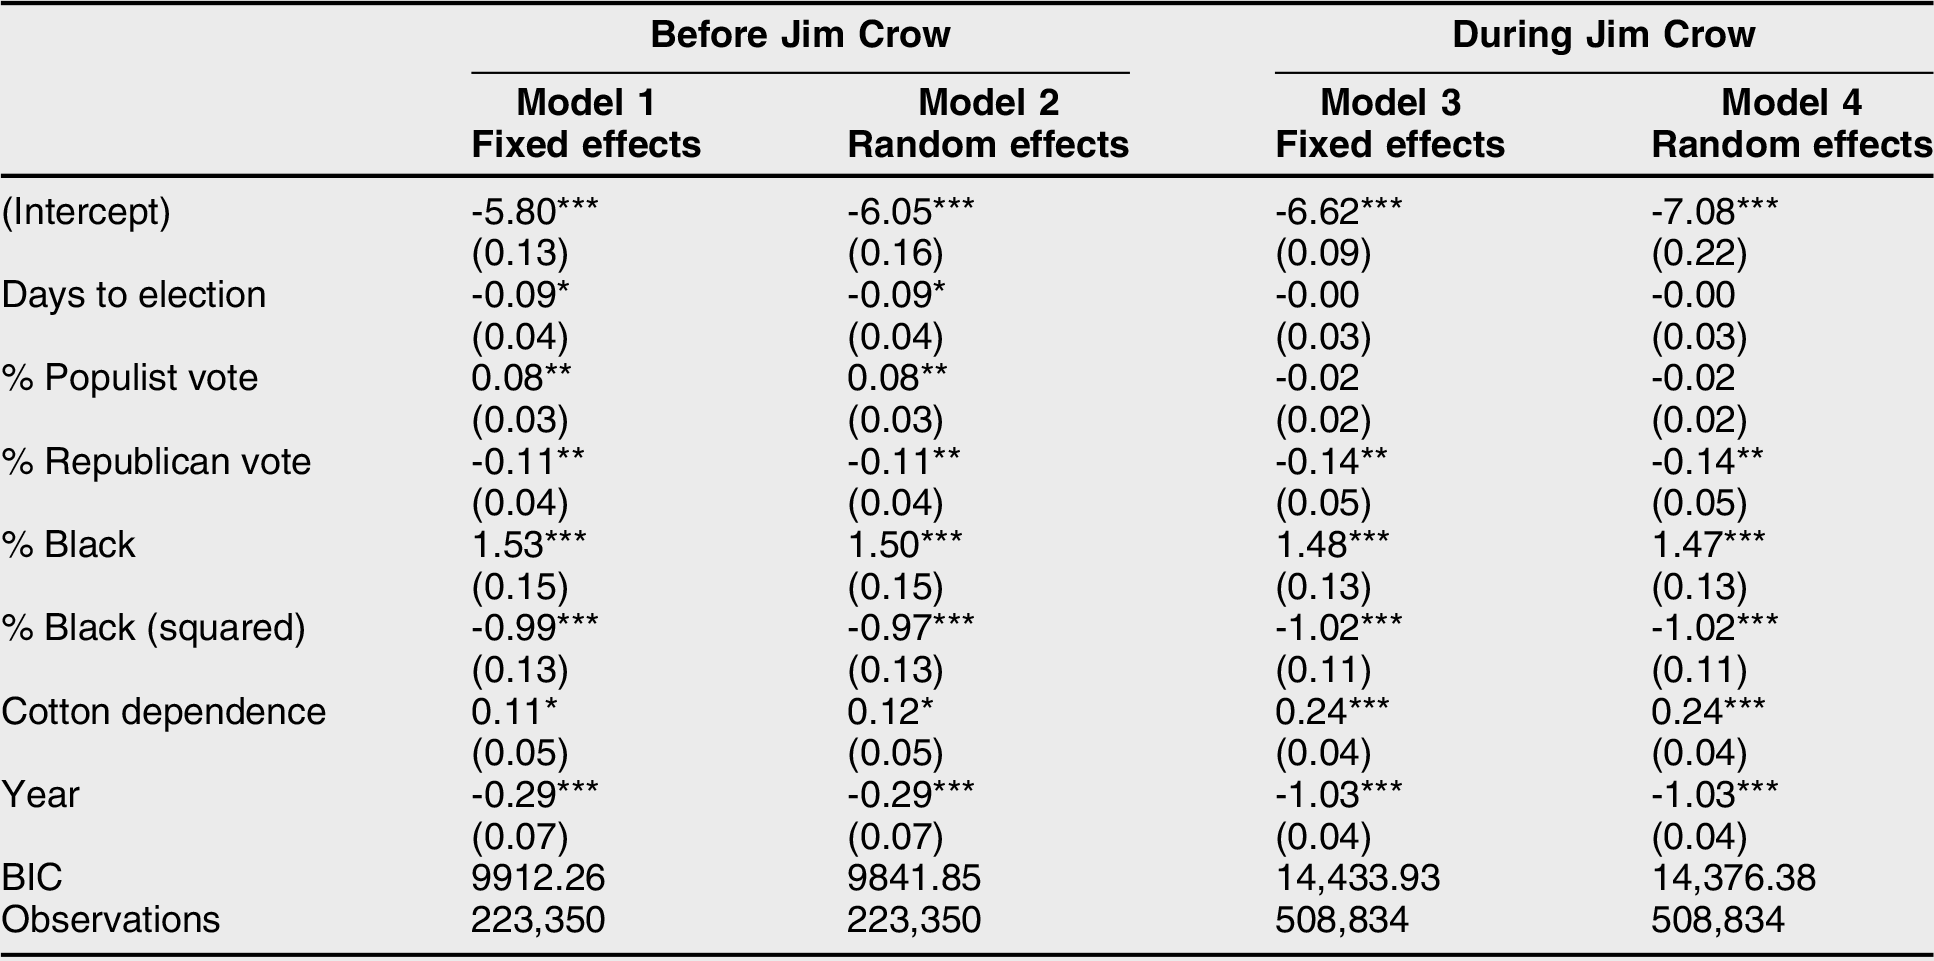
Note: Logistic regression models of lynching by county-month in eleven Southern states in the post-Reconstruction, pre-Jim Crow era.
Figure 2 shows the degree to which law replaced violence by plotting the predicted probabilities (with 95% confidence intervals) of the political threat covariates across the two eras. Each plot shows the expected probability of lynching when days to election (plot a) and Populist vote share (plot b) vary from their minimum to maximum observed values, with all other covariates held constant at their means; black lines show predictions for the pre-Jim Crow-era, gray show Jim Crow-era data. Electoral factors cease to be important determinants of lynching once Jim Crow is firmly in place.
Predicted probabilities
Notes: The predicted probability of lynching in a given county-month across levels of the listed covariate when all other covariates are held at mean values. Black lines show the post-Reconstruction, pre-Jim Crow era (Model 1), while gray lines show predicted probabilities during Jim Crow (Model 3).
Plots (a) and (b) have different axes.

Sporadic violence to discourage black political participation persisted as late as the 1960s and lynching continued to be a tool to limit black civil rights, repress black labor, reinforce white racial solidarity, and punish blacks for alleged crimes for many years (Smångs Reference Smångs2016; Wood Reference Wood2009). Indeed, the coefficient for the cotton dependence variable is about twice as large after Jim Crow laws are enacted, indicating that economic factors were more closely tied to lynchings, which is what we would anticipate if politics declined in importance as a cause of lynching (Kousser 1999). The reputational costs of lynchings led many Southern states to enact their own anti-lynching laws and take other steps to limit lynchings in the following decades (Johnson Reference Johnson2010; Rable 1985). But lynchings did decline considerably after the introduction of Jim Crow voting restrictions, demonstrating an evolution of suppression.
Jim Crow 2.0 and the Continuing Evolution of Suppression
Bentele and O’Brien (Reference Bentele and O’Brien.2013) refer to recent attempts to restrict voting as “Jim Crow 2.0.” Using seemingly neutral policies such as voter identification laws to discriminate against minorities, the poor, and the young is certainly consistent with the original Jim Crow laws. In light of our arguments and findings, why are these laws being enacted now and why are they taking the form that they are?
As before, the desire to win elections by political party organizations motivates attempts to restrict the vote. Voter restrictions are increasing as partisan control of Congress (and the presidency) is more variable than it has been for decades. And of course state-level electoral calculations matter: research shows that restrictive voting laws are most likely when control of government has recently shifted to the Republican Party, indicating that these states were competitive in the recent past (Biggers and Hanmer Reference Biggers and Hanmer2017; McKee Reference McKee2015; Rocha and Matsubayashi Reference Rocha and Matsubayashi.2014). Despite long having large minority populations, voting restrictions have expanded recently in many Southern states because Republicans gained unified control of state government for the first time in decades in the early 2000s.Footnote 26 As in 1890, state governments are using law to suppress voting to consolidate their control after obtaining power.
As with Jim Crow 1.0, these laws target minorities (Bentele and O’Brien Reference Bentele and O’Brien.2013). Though technically neutral with regard to race/ethnicity, class, and age there is little doubt about the intended targets. One former Republican staffer in Wisconsin described legislators as “giddy” at the prospect of disenfranchising youth and minority voters, and Pennsylvania’s House majority leader said his state’s identification law would ensure Romney’s victory in the state in 2012 (Wines Reference Wines2016). The high degree of capacity that exists in all U.S. states at this time allows policymakers to very effectively target minorities for suppression. For example, detailed data collection enabled North Carolina Republicans to restrict voting in the times, places, and manner most likely to be utilized by African Americans (Ingraham Reference Ingraham2016). It is attractive for the Republican Party to suppress minority voting because minorities’ growing loyalty to the Democratic Party. As during Reconstruction, black voters demonstrate tremendous loyalty to one party, and Latinos have shifted strongly toward the Democratic Party in recent years (Lopez et al. Reference Lopez, Gonzalez-Barrera, Krogstadt and Lopez2014). In contrast, in states where they hold power, Democrats draw support from a more diverse coalition, making targeting particular voters for suppression unattractive.Footnote 27
External constraints on the states have also recently decreased. Republicans in Washington, D.C., are more willing to allow states to restrict the voting of Democratic constituencies so that Republicans will win. With Republican judges in place and more frequent control of the institutions of government, federal Republicans can prevent Democrats from taking steps to ensure voting rights. Republican appointees to the Supreme Court weakened and then struck down key portions of the Voting Rights Act, making it is easier for states to restrict voting because new voting laws no longer needed preclearance by federal judges (Liptak Reference Liptak2013, McCrary Reference McCrary, Seaman and Valelly2005). In the wake of this decision, several Republican-controlled states promptly enacted restrictive voting laws, and Republican Congresses have refused to enact a revised Voting Rights Act. Thus, with the combination of internal capacities and lack of external constraints we can see why, despite occasional invocations otherwise, we continue to see the overwhelming use of institutionalized rather than decentralized, ad hoc approaches to voter suppression, and electoral violence is exceedingly rare.
Conclusion
Driven by a fundamental desire to win elections, the same basic considerations of costs and benefits shape decisions by competing elites regarding suppression now as in previous eras. How suppression occurs depends on internal conditions and external constraints. Ad hoc and often violent suppression is more likely when internal political or state capacity to implement formal legal techniques is lacking, and when external actors present constraints. When internal capacities increase and external constraints decrease, elites will choose legislative, centralized, typically non-violent approaches to suppression.
Thus, in affluent democracies like the United States we have seen a shift from ad hoc, decentralized, and often violent voter suppression toward centralized, legal, and non-violent approaches. We illustrate this shift with the use, and then relative abandonment, of one form of violence—lynching—in the suppression of black voting after Reconstruction. Immediately after federal troops left the South, lynching and other forms of violence were tools in the widespread suppression of black political participation. The use of violence reflected both a lack of political and state capacity and the federal stance as guarantor of black voting rights. Once internal capacities were present and external constraints were removed, Southern Democrats shifted to centralized, bureaucratically-implemented voter suppression, which reduced political lynchings. We showed that our arguments can adequately describe the evolution of voter suppression in the post-Reconstruction South, but we also think that our arguments would apply in other systems and at other times and places in the United States. Of course, further research should examine this directly.
Our argument and findings also illuminate current attempts to restrict the vote. Due to earlier federal interventions, the sweeping disenfranchisement of Jim Crow is no longer permissible. Nonetheless, attempts to restrict voting by blacks and other groups have increased in recent years. Like the post-Reconstruction South, partisan calculations about how voting by different groups affects election victories drive attempts at suppression. Approaches have been institutionalized because modern U.S. state governments have significant state capacity, thus where Republicans have the political capacity they have often enacted restrictive voting laws. The national Republican Party is content to allow more voter suppression because the targeted groups support the Democratic Party. Despite occasional calls to violence and intimidation, even by some prominent candidates, in general there has been no return of widespread electoral violence accompanying the new round of voter restrictions. This does not mean that the return of widespread violence is impossible, but it does seem highly unlikely based on the historical trajectory of voter suppression toward centralized, institutionalized approaches.
One major difference with the post-Reconstruction era is that, given the Voting Rights Act and other federal laws that are weakened but still in place, these recent restrictions on voting are neither as extreme nor as effective in suppressing voting. In fact, it remains unclear whether they effectively reduce voting at all (Rocha and Matsubayashi Reference Rocha and Matsubayashi.2014; Hajnal, Lajevardi, and Nielson Reference Hajnal, Lajevardi and Nielson2017). Even their critics must acknowledge that laws like voter identification requirements have limited potential for suppression due to the simple fact that the vast majority of all Americans have identification. Yet it remains unclear the degree to which such requirements interact with restrictions on registration and early and absentee voting, and it should not be assumed that more egregious attempts to deny the voting rights of larger numbers of people will not be pursued by states in the future. Perhaps it is the case that the widespread disenfranchisement of certain groups of Americans via law is no longer possible. Yet Jim Crow 1.0 started with relatively modest laws, designed to appear neutral, that restricted the voting of relatively few individuals, which then expanded to disenfranchise larger numbers of voters. Even though it is unlikely that modern states, with their considerable political and state capacity, would need to use violence to restrict voting, is it impossible to imagine that broader laws disenfranchising more voters will be enacted?
Supplemental Materials
Descriptive Statistics
Voter Disenfranchisement Laws
Probable versus Confirmed Lynchings
Alternative Operationalizations of Jim Crow
The “Era of Lynching”
Count Models
Rare Events Logit
State Fixed Effects
The Use of a Seasonal Dummy
Democratic Control of States after Reconstruction
To view supplementary material for this article, please visit https://doi.org/10.1017/S1537592718003584