

Introduction
The Arctic is undergoing rapid changes in terms of climate, economic and social change, and the pace of industrial development is unprecedented. Understanding these socio-economic changes requires reliable data on demography, society and economy. Several reports have addressed this issue, e.g. Economy of the North on the pan-Arctic scale (Glomsrød, Duhaime, & Aslaksen, Reference Glomsrød, Duhaime and Aslaksen2021) and Business Index North (Middleton et al., Reference Middleton, Hersinger, Bryksenkov, Mineev, Dybtsyna, Bullvåg and Ovesen2019) focusing on the Nordic Arctic countries and South-West Russian Arctic regions. However, the lack of comparable socio-economic and demographic data on Svalbard inhibits scientific research, community and business development.
Svalbard, an archipelago in the Arctic Ocean which is part of the Kingdom of Norway (without the status of county or municipality) and regulated under the terms of the Svalbard Treaty of 1920 with 47 signatures (Wither, Reference Wither2018), exemplifies a site of rapid transformation in the Arctic. Initially developed for mining by Norway and Russia in the 19th century, in the 2010s the main island of Spitsbergen ceased to depend on mining production. While the Svalbard Treaty has 47 signatures, Norway and Russia predominate on the archipelago due to past mining activities. The Mining Ordinance, laid down by Royal Decree in 1925 in accordance with the Svalbard Treaty, facilitates Russian mining operations in Svalbard (Pedersen, Reference Pedersen2006). In the last decade, Svalbard has been transforming with an increasing number of tourism and research activities as the main industrial drivers (Hovelsrud, Kaltenborn, & Olsen, Reference Hovelsrud, Kaltenborn and Olsen2020).
The archipelago attracts many researchers in natural sciences. Research in Svalbard (RiS) is a portal for registration of various scientific projects in Svalbard (Research in Svalbard, 2021). In December 2020, it contained 3,116 research projects on terrestrial and marine biology, cryosphere, etc., with only 3% (103) devoted to social sciences. The scholarly literature on Svalbard focuses on the natural sciences, including geology, climate change, fauna evolution, sea-level, soil and glacier evolution with very little research on economic development (Nyman, Galvao, Mileski, & Tiller, Reference Nyman, Galvao, Mileski and Tiller2020). While Svalbard can serve as a natural laboratory to observe people adapting to life in the Arctic, developing economic activities and infrastructure appropriate to the Arctic, very little research has been conducted on these aspects. Recent publications include a study on the community viability of Barentsburg and Longyearbyen in socio-economic transitions (Olsen, Vlakhov, & Wigger, Reference Olsen, Vlakhov and Wigger2022) and an analysis of socio-economic change and its implications for local populations on Svalbard (Sokolickova, Meyer, & Vlakhov, Reference Sokolickova, Meyer and Vlakhov2022). Anecdotally, a scientific literature search on demography on Svalbard is more likely to yield publications on the arctic fox, reindeer and moss demography than on humans.
While some studies address the changes at the Norwegian settlement (Longyearbyen) on Svalbard (Hovelsrud et al., Reference Hovelsrud, Kaltenborn and Olsen2020), very little is known about socio-economic and demographic transformation in the Russian settlements. Zimbalista, Persson, Svendsen, & Reventlow (2021) analyse Russia’s economic and geopolitical activities on the archipelago as a strategic outpost, as well as the international legal framework under which Russia operates. Schennerlein (Reference Schennerlein2021) used survey data to examine the prevailing socio-economic status and challenges to future development in the Russian settlements on Spitsbergen. However, studies using statistical data on the Russian settlements on Svalbard are very limited (Sokolickova et al., Reference Sokolickova, Meyer and Vlakhov2022). This article contrasts the development paths of the Norwegian (Longyearbyen and Ny-Ålesund) and Russian settlements (Barentsburg and Pyramida) on Spitsbergen. The article reviews the strategic documents produced by the Norwegian and Russian governments on their vision of Svalbard development that may reflect future priorities for socio-economic development. The analysis of the development builds on demographic and socio-economic data until 2022 when available. The data were collected by directly contacting national statistical bureaus, agencies and institutions. For its supplementary data, the study uses archival data and media publications.
While human presence on Svalbard dates back over 400 years, the research on historical human presence remains biased and fragmentary (Kruse, Reference Kruse2016). This study responds to the call to develop an improved knowledge base for the management of social science data and better mechanisms for integrating science into policy-making and decision-making (Kaltenborn, Østreng, & Hovelsrud, Reference Kaltenborn, Østreng and Hovelsrud2020) and to expand the exclusive focus on natural and physical sciences in Svalbard research (Saville, Reference Saville2019). Additionally, this study contributes to the Svalbard Social Science Initiative (SSSI, 2022) a platform for coordinating research activities and facilitating communication with local communities and other scientists.
Data and inquiry process
The article first reviews several strategic documents produced by the Norwegian and Russian governments in relation to their visions for Svalbard development, the emphasis being on those indicative of future priorities for socio-economic development. Qualitative content analysis is used to summarise the documents selected in order to understand how socio-economic and demographic development manifests in these documents.
For a comprehensive overview of socio-economic and demographic changes on Svalbard in the historical perspective, statistical data were collected from diversified sources to identify trends and patterns in a selected number of indicators related to demographics (changes in population, population by age group, male-female gender ratio in the population, proportion of foreign nationals). Comparing findings in strategic documents and the results of data analysis made it possible to assess if the chosen development path was indeed reflected in the data. The analysis of socio-economic development included data collection on employment by industry, changes in the number of businesses, subsidies and investments. When possible, time series of data were collected to ascertain how certain indicators have developed over time.
The data were requested from Statistics Norway, Russian Federal State Statistics Service (Rosstat), Consulate General of Russia in Barentsburg, the Norwegian Tax Administration and Russian coal mining unitary enterprise Trust Arktikugol. The organisations contacted and data availability are summarised in Table 1.
Organisations contacted and data availability.

Statistics Norway collects freely available detailed and comprehensive data on demographics and economic development on Svalbard. The data provided by Statistics Norway concern only Norwegian settlements, except for limited demographic data on the number of people in the Russian settlements. While demographic data on Norwegian settlements include age and sex and nationality, the data on the Russian settlements only include the number of residents. Hence, the societal structure, the proportion of women, children and elderly people in society in the Russian settlements are unknown.
The Russian Federal State Statistics Service (Rosstat) was contacted with a data inquiry request on the Russian settlements in Svalbard. Rosstat replied with an official statement that Rosstat collects data on the Arctic Territories of the Russian Federation in accordance with the Decree of the President of the Russian Federation of 2 May 2014 “On the Land Territories of the Arctic Zone of the Russian Federation.” Thus, Rosstat engages in no collection of official statistical information on Arctic territories under foreign jurisdiction and this applies to Barentsburg, Spitsbergen. The Consulate General of Russia in Barentsburg likewise replied that it collects no statistical data. The Norwegian Tax Administration was contacted in a search for data on Russian nationals in the Norwegian settlements, and this was provided on the number of Russian nationals in Norwegian settlements for the last ten years. The Russian coal mining unitary enterprise Trust Arktikugol provided basic data on the number of workers and average worker age for the last ten years without specification by age group or gender.
Moreover, no statistical data were available for economic indicators in the Russian settlements. Some financial indicators on Trust Arktikugol activities were found in publicly available financial statements and reports of interviews with managers. Given the lack of demographic and socio-economic data, especially on Russian settlements on Svalbard, data sources were complemented by data found in scientific publications and in various media publications.
History of socio-economic development on Svalbard
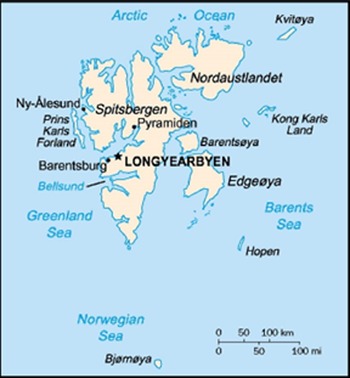
Svalbard has hosted several economic activities since first mention by Willem Barents in 1596. First, in the 17th century economic activity was dominated by whaling, followed by hunting and scientific expeditions in the 18th century and from the 20th century predominantly by mining (Grydehøj, Grydehøj & Ackrén, Reference Grydehøj, Grydehøj and Ackrén2012). In the 20th century, mining grew into a major commercial activity on Svalbard practised by Norwegian and Russian companies: Norwegian mining run by the Store Norske company in Longyearbyen, Ny-Ålesund and Sveagruva, and Russian mining run by the state-owned Trust Arktikugol in Barentsburg and Pyramida (Grydehøj et al., Reference Grydehøj, Grydehøj and Ackrén2012). For the location of these settlements, see Fig. 1. Both Store Norske and Trust Arktikugol depended on state subsidies to continue operations. Even though unprofitable, mining continued on Svalbard mostly for the purpose of securing territorial claims. Since the 1990s, both companies have decreased the number of employees significantly and tourism has become an important economic activity in both Norwegian and Russian settlements.
Map of Svalbard. Source: CIA.

General demographic trends
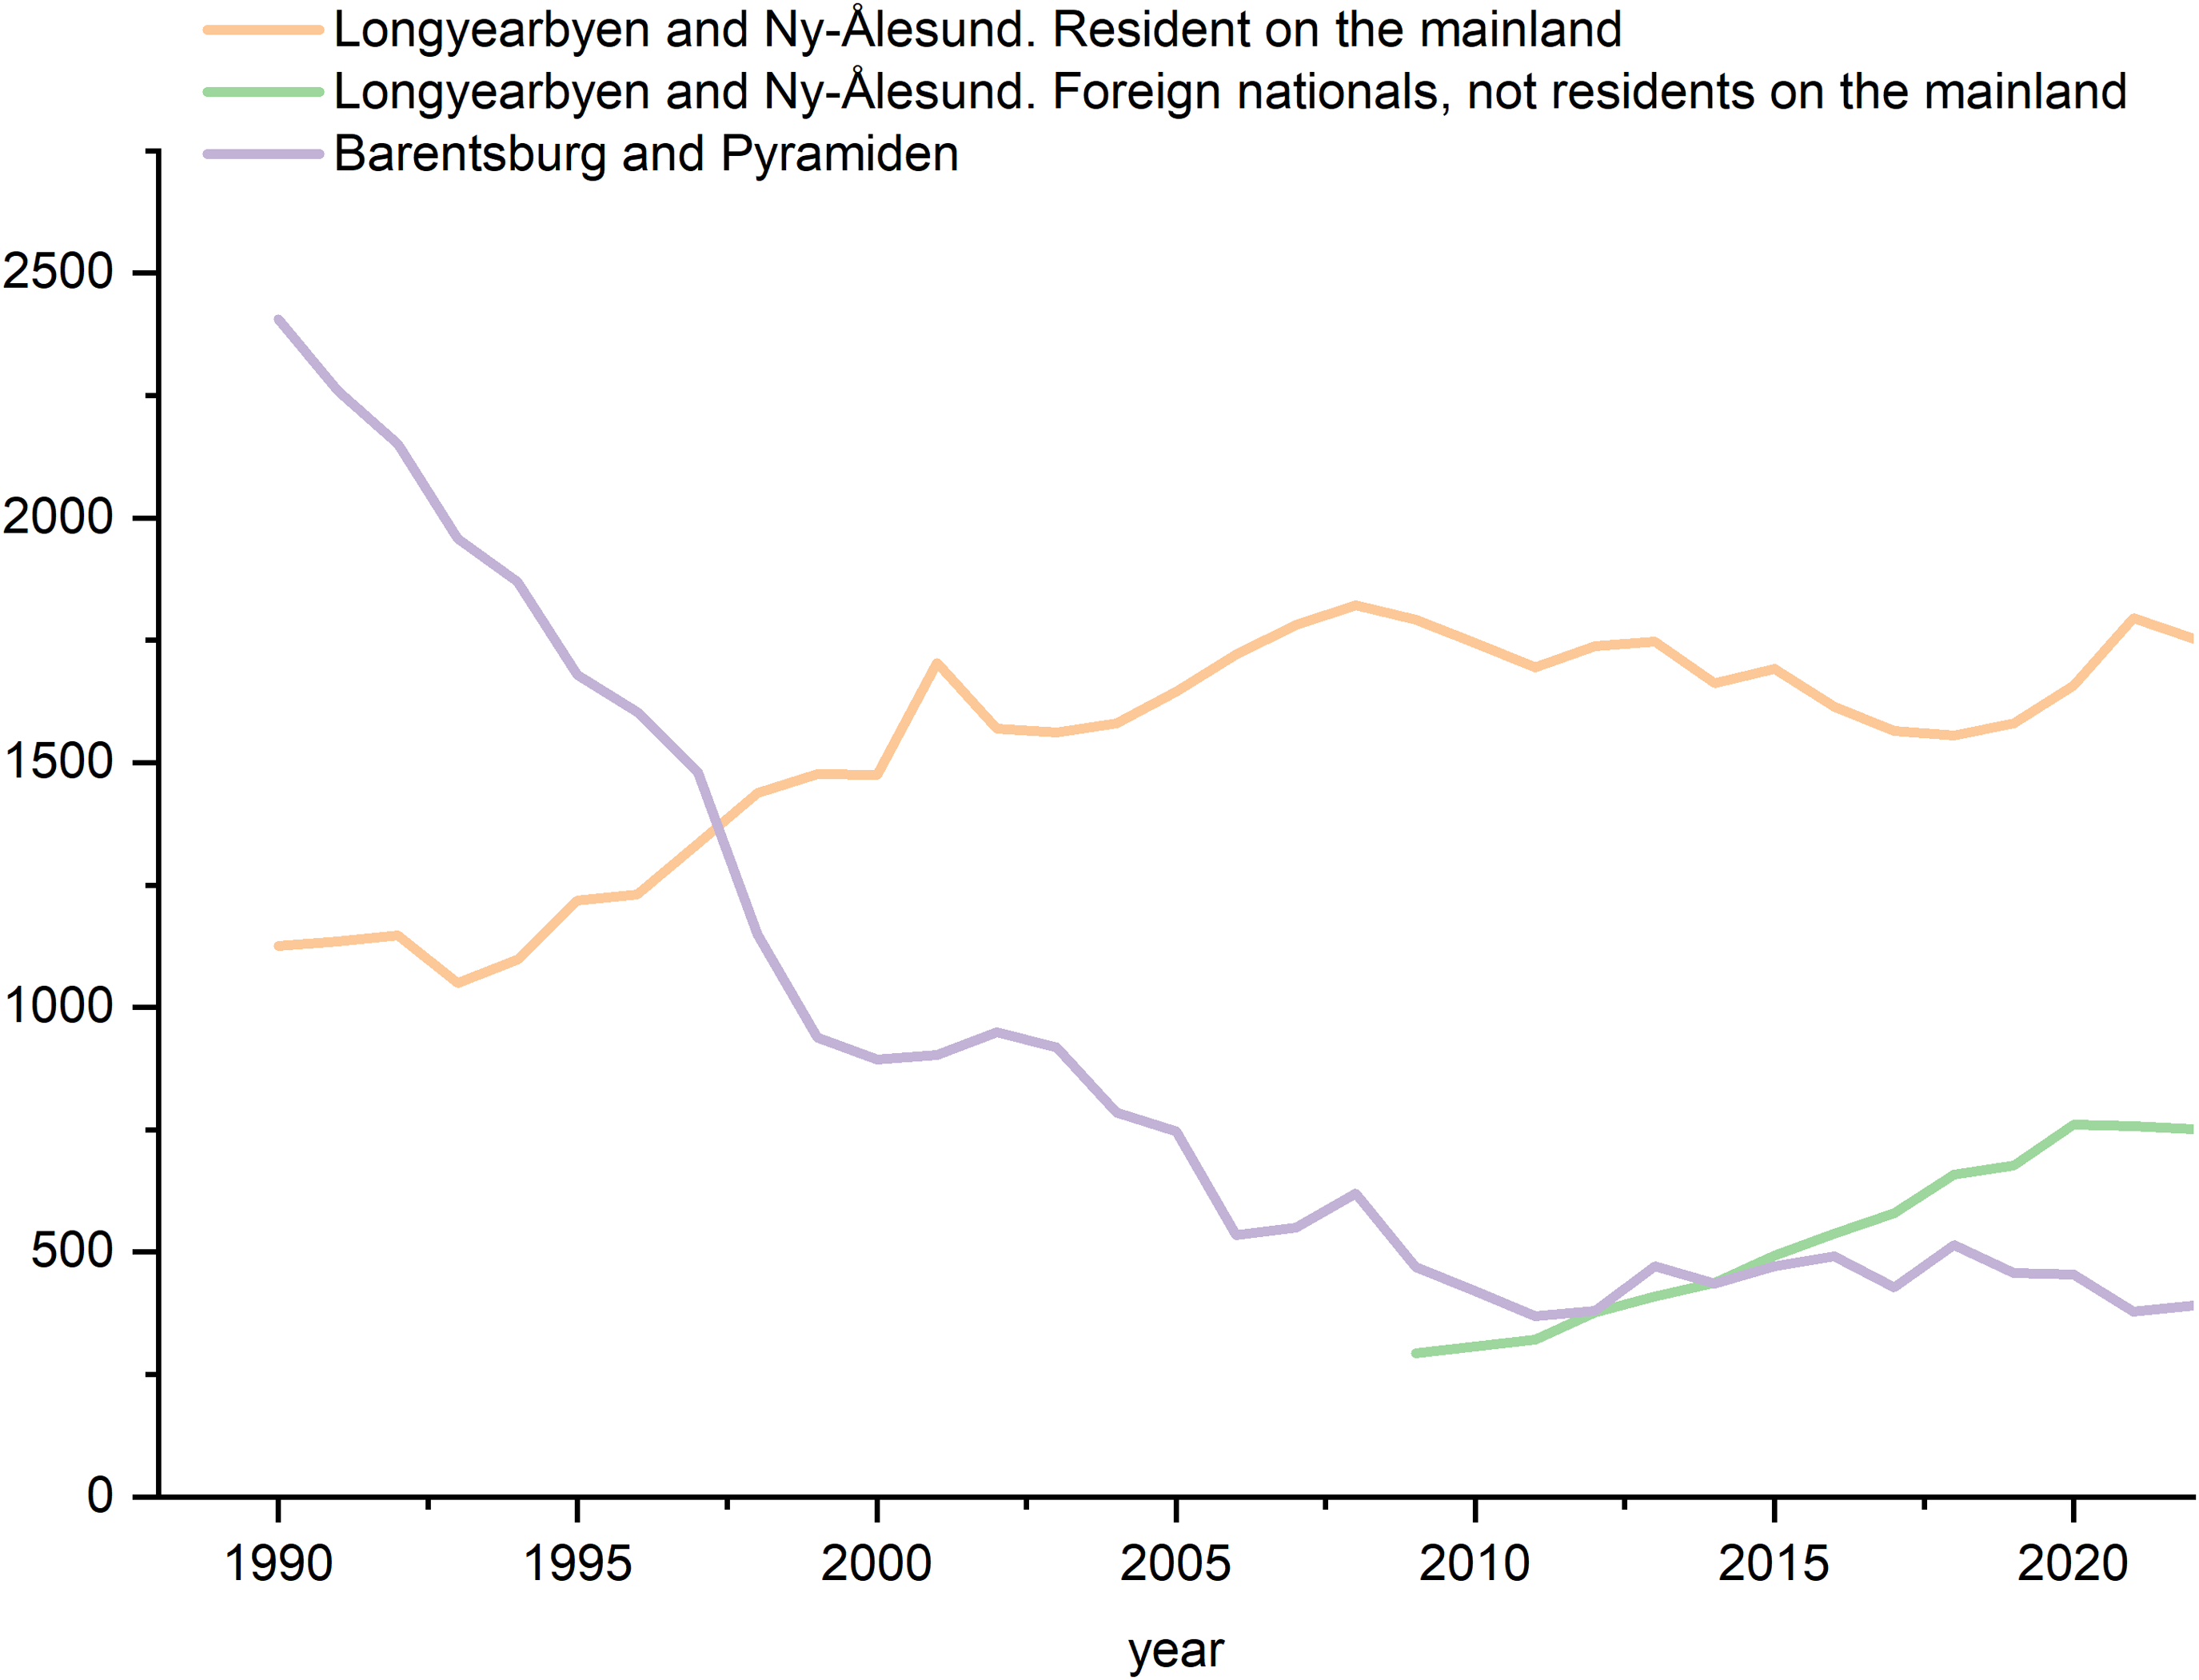
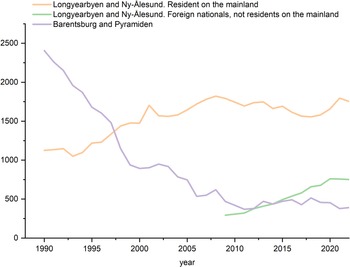
The population of Svalbard decreased during the last 30 years from 3,532 in 1990 to 2,895 in 2022 (See Fig. 2), the decrease being more marked in the Russian settlements. In 1990, of the whole population, 68% (2,407 people) resided in Russian Svalbard settlements. By 2022, Russian settlements accounted for only 16% (391 people) of the population of Svalbard. At the same time, the Norwegian settlements grew, more than doubling their population from 1,125 in 1990 to 2,504 in 2022. Another change is the increasing number of non-Norwegians in the Norwegian settlements. In 2009, foreign nationals accounted for 16% of the population in Longyearbyen and Ny-Ålesund and in 2022 for 43% (in total 751 foreign nationals in 2022). Rapid structural changes and a multicultural environment with over 42 nationalities represented make Svalbard a unique case for investigating the effect of demographic shifts in community life and adaptation patterns.
Demographic trends on Svalbard, 1990−2022. Source: SSB, compiled by the author.
The special legal status of Svalbard renders demographic statistics challenging. The right to reside in Svalbard is subject to a means test. Those living in the archipelago and intending to stay there for more than six months are classed as residents. These requirements apply to both foreigners and Norwegian citizens, and the Governor of Svalbard may deny residence to those who do not meet the requirements. Therefore, those planning to come to the archipelago are advised to obtain work and housing before they arrive. Svalbard has its own tax code (Svalbardskatteloven, 2021); all tax revenue is utilised within the archipelago. Tax rates are lower than on the Norwegian mainland (Norden, 2022). There are two tax systems: a resident may be liable to ordinary tax or enjoy limited tax liability. Employers domiciled on Svalbard are exempt from national insurance contributions when the work is performed on Svalbard. The corporate tax rate is 22% on Svalbard, the same as on mainland Norway. Svalbard is a VAT-free zone with an environment conducive to setting up in business.
According to the 2016 statistics, duration of residence in Norwegian settlements varies widely. At the beginning of 2016, nearly one-quarter of the population had moved to Svalbard more than ten years ago. Local administration workers stay longer, students, tourism workers and government workers have much shorter stays (Statistics Norway, 2016). For foreign residents, there is neither a route to obtaining residency on the mainland nor to Norwegian citizenship since the Norwegian Immigration Act does not apply to Svalbard. Residence on Svalbard does not automatically qualify for residence permits on the Norwegian mainland, even after residing on Svalbard for several years (Norden, 2022; Governor of Svalbard, 2022). Svalbard residents are not covered by the Norwegian Social Welfare Act and thus do not qualify for financial assistance with living expenses or housing. As a result, residents who have special needs due to illness, disability or advanced age are not entitled to practical assistance.
Diminishing significance of mining activity
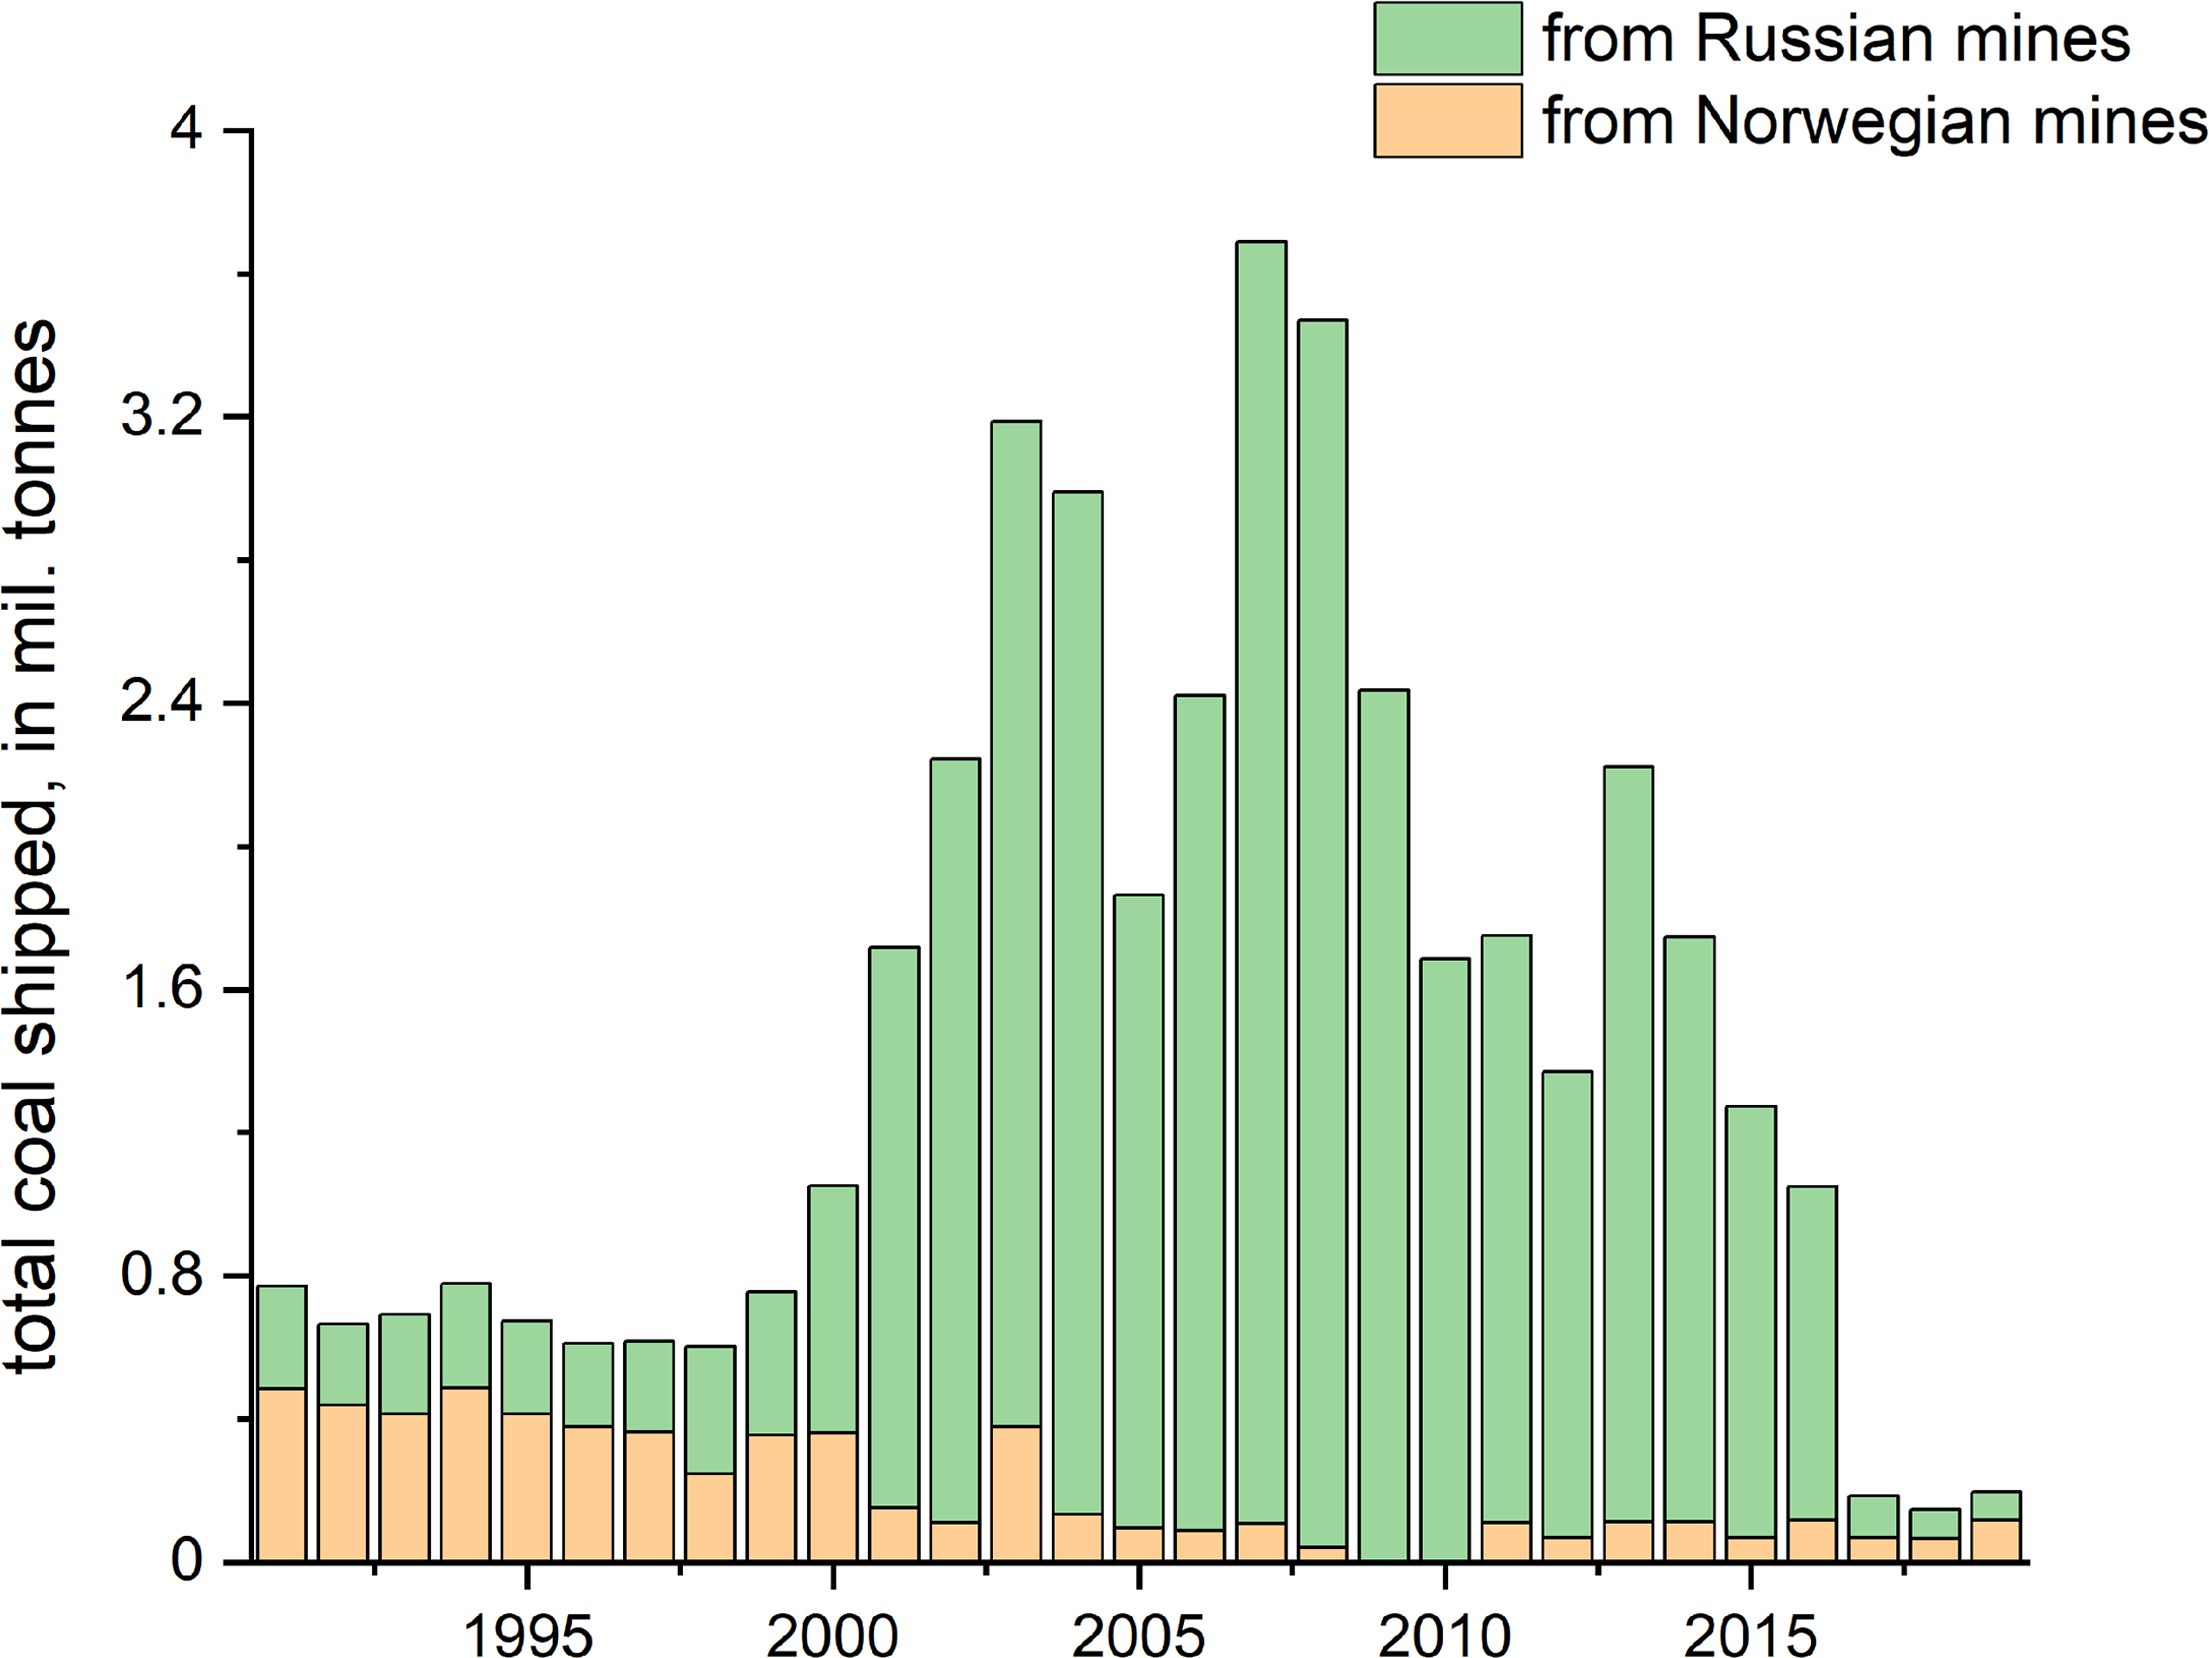
The amounts of coal shipped from Svalbard reflect the diminishing role of coal mining (see Fig. 3). During the last 30 years, a total of 42.9 million tonnes of coal was shipped from Svalbard. During the 1990s, the Russian settlements produced more coal than the Norwegian settlements. In the 2000s, Russian coal production shrunk considerably due to the collapse of the Soviet Union while Norwegian coal production continued to produce nearly 90% of all coal shipped from Svalbard. Since 2016, both Norwegian and Russian mines have produced fewer than 0.1 million tonnes per year.
Total coal shipped from Svalbard, 1991–2019. Source: SSB, compiled by the author.
Store Norske
The Norwegian company Store Norske is entirely state-owned. The state’s rationale for owning Store Norske is to have a company in Svalbard that, through the Mine 7, development and management of housing and other activities, helps to maintain and develop the local community in Longyearbyen in a way that supports the overall objectives of Norway’s Svalbard policy (Meld. St. 8, (2019–2020)). Due to falling global coal prices and years of negative revenue, the company went through a series of personnel lay-offs, e.g. 100 people out of 340 lost their jobs in 2014. Apart from affecting mining activity directly, these lay-offs had an impact on companies in the service sector, suppliers and public sector workers (Leiendecker, 2014). In 2017, the Norwegian Government decided to close mines in Svea and Lunckefjell and allocated funding for clean-up activities (The Government of Norway, 2017). Nowadays, Store Norske has a diversified portfolio of operations, with activities in mining, real estate, logistics, energy and infrastructure, cultural monuments and tourism. In addition, the company is responsible for carrying out the clean-up after mining in Svea. According to its financial reporting of 2018, Store Norske had 127 employees (Meld. St. 8, (2019–2020)). Negative book equity of NOK − 2.2 billion (USD 270 million) is related to the environmental clean-up project in Svea and Lunckefjell. Operating revenues in 2018 were NOK 383 million (USD 46 million). The last operating mine (Mine 7) faces probable closure in 2025 (Moore, Reference Moore2022).
Trust Arktikugol
In 1931–1932, the USSR Trust Arktikugol received a coal mining licence in Grumantbyen and Barentsburg, marking the beginning of the Soviet Union’s permanent presence on the archipelago. Trust Arktikugol originally had three mines (Grumant, Pyramida and Barentsburg) in operation employing in its heyday 3,100 people. A major supplier of coal to the Kola Peninsula and surrounding northern regions until the start of WWI, Trust Arktikugol also supplied the icebreaker fleet plying the Northern Sea Route (Nabok, Reference Nabok2013a). After 1961, the two main mines Barentsburg and Pyramida (also rendered as Pyramiden) continued to operate with the closure of Pyramida in 1998 due to depleted coal reserves and the plane accident in which 141 miners and their family died (Kavan & Halašková, Reference Kavan and Halašková2022). The extraction of coal in the remaining Barentsburg mine is limited to 120 thousand tonnes per year, while to break even the Russian Ministry of Energy calculated that at least 350 thousand tonnes need to be extracted. Such production would, however, require the opening of a new mine. Mining activity in the Russian settlement continued to run at a loss. According to the CEO of Trust Arkrukugol, Alexander Veselov, the amount of state subsidies has decreased by 40% since 2009 (Arctic.ru, 2015). In 2020, the company employed around 400 people full-time with an additional 50 seasonal workers.
Socio-economic development in Norwegian settlements on Svalbard
Strategic outlook
In the last ten years, Norway has produced several strategic papers outlining the outlook for the future development of social and economic activities on Svalbard. The main findings are summarised below.
Diversified business community
In the White Paper on Svalbard by the Norwegian Ministry of Justice and Public Security to the Norwegian Parliament, the major change is identified as a shifting industrial structure comprising tourism, research, construction, services and public sector activity (Meld. St. 32, (2015–2016)). Svalbard). Concerning the future prospects, the White paper from 2015 envisages Svalbard as:
“A community with a heterogeneous business structure … less vulnerable to changes in markets, individual industries and individual companies. Developing the breadth and complexity of Svalbard’s business community is therefore desirable.” (Meld. St. 32, (2015–2016)). Svalbard, p. 84)
At the same time, the White Paper advises caution regarding the pace of development; the Norwegian Government does not “wish to facilitate a form of growth that quickly triggers a need for heavy investment in new infrastructure such as water supply and heat and electric power production” (Meld. St. 32, (2015–2016)). Svalbard, p. 40).
In 2019, the Norwegian state announced a strategy for Svalbard Innovation and Business Development (Innovasjon og næringsutvikling på Svalbard, 2019) aimed at developing knowledge-based and sustainable business industry, while at the same time restraining uncontrolled growth in business activities.
Strategy for research and higher education in Svalbard
Since the 1990s, the Norwegian state has assumed a leading role in coordinating research activities on Svalbard. In 1998, the Norwegian authorities set up the Svalbard Science Forum (SSF) to increase cooperation, coordination and information sharing between all the research sites on Svalbard (Longyearbyen, Ny-Ålesund, Barentsburg and Hornsund) and also to strengthen cooperation between individual researchers and research institutions on Svalbard, both Norwegian and international. The Norwegian Research Council heads SSF and operates the secretariat.
In 2018, the Norwegian Ministry of Education and Research launched a new strategy for research and higher education on Svalbard (Strategy for Research and Higher Education in Svalbard, 2018) that supports the White Paper on Svalbard (2015) (Meld. St. 32, (2015–2016)). Svalbard). This strategy provides a long-term platform that determines the frameworks and principles for research and higher education on Svalbard. The strategy contributes to a clearer role for Norway as a host and encourages collaborative research activities on Svalbard while at the same time defining what the Norwegian authorities expect of knowledge communities in Svalbard. In 2019, the Ny-Ålesund Research Station for Arctic natural sciences monitoring of environmental change published its own Research Strategy (Ny-Ålesund Research Station Research Strategy, 2019). The objectives of the strategy are to promote world-class science, sustainable research production and open access to data. More and more countries have opened their own research facilities in Ny-Ålesund with eleven institutions from ten countries (China, Germany, Great Britain, France, India, Japan, Korea, Norway and the Netherlands) three of which are permanently manned (Paglia, Reference Paglia2020).
In addition, several more institutions and nations come regularly to Ny-Ålesund to carry out fieldwork. The University Centre in Svalbard (UNIS) is the world’s northernmost university located in Longyearbyen offering bachelor’s and master’s degrees and postgraduate studies in Arctic biology, geology, geophysics and Arctic technology. UNIS was founded in 1993 to provide university-level Arctic studies, conduct high-quality research and help Svalbard to become an international research platform. UNIS’ location allows students and teachers to use nature as a laboratory, observation and data gathering site. UNIS had 743 students from 43 countries in 2019. UNIS has about 50% domestic and 50% international students, and English is the official language at UNIS. The UNIS teaching staff is 50% Norwegian and 50% international, with some 12 full professors, 51 associate professors and 160 Arctic-focused visiting scholars. UNIS published a strategy for the period 2019–2025 aspiring to be the world leader in research-based field education in high Arctic science and technology (The University Centre in Svalbard Strategy 2025, 2019).
Demographic and socio-economic trends in the Norwegian settlements
Analysis of demographic indicators
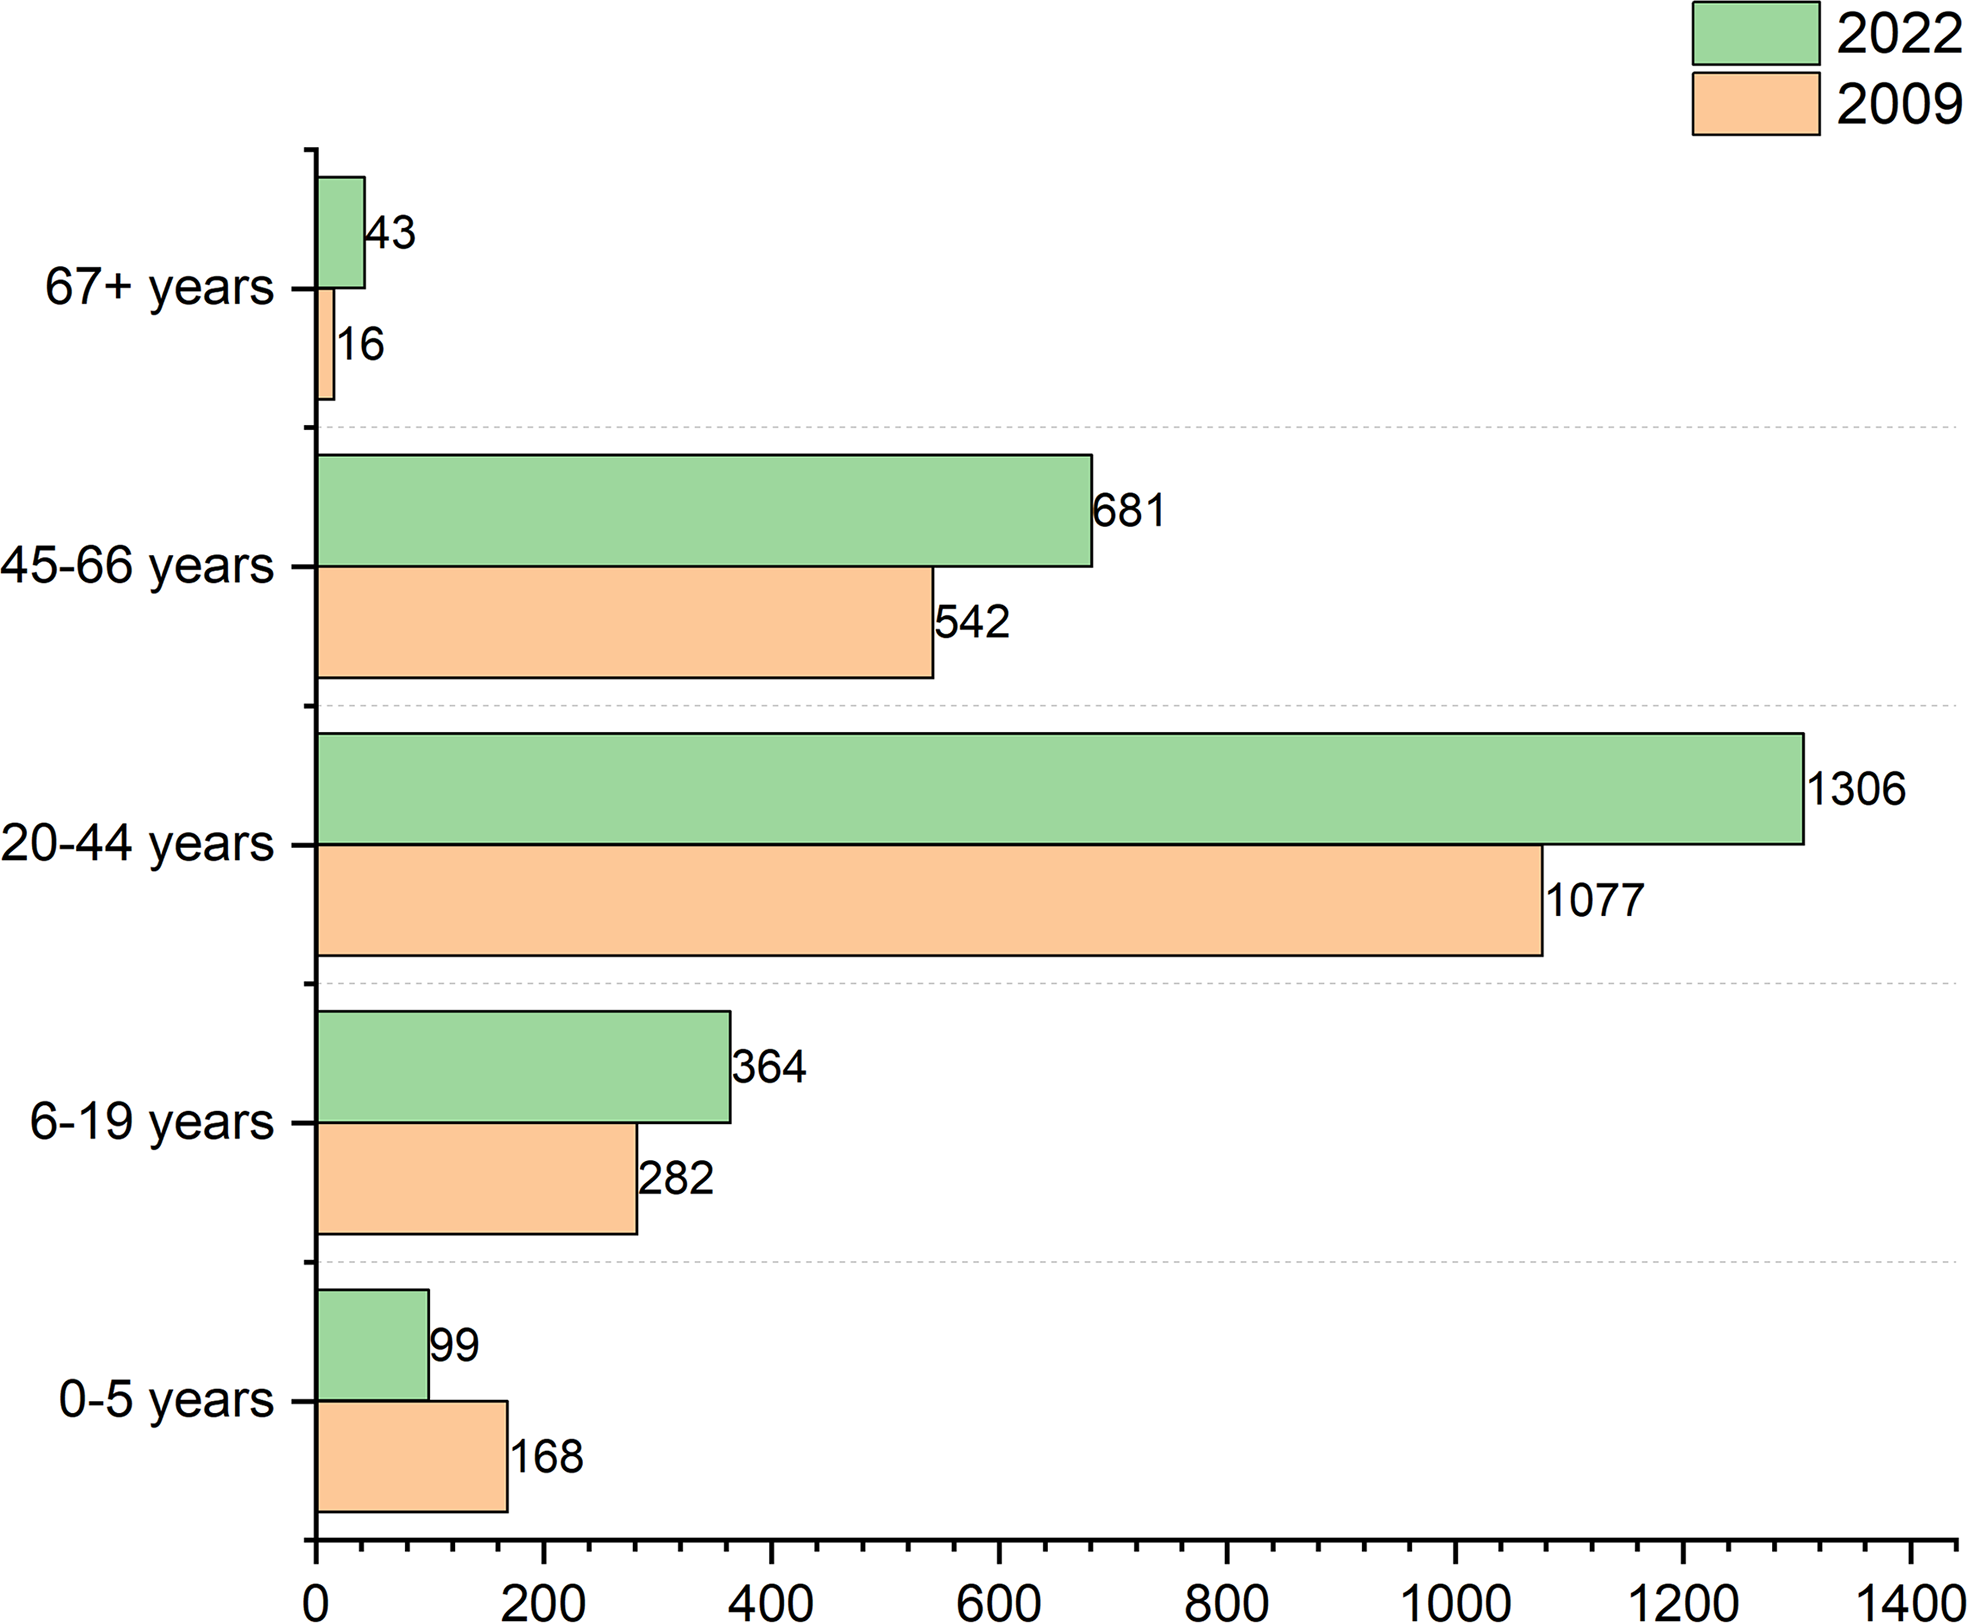
Since everyone arriving in Svalbard is expected to provide for themselves, the population structure is dominated by active working population aged 20–44, which grew by 21% from 2009 to 2022 (see Fig. 4). The population of 45–66-year-olds contributing to economic activities also increased by 25%. The population of children aged 0–5 decreased from 168 people in 2009 to 99 in 2022. The biggest growth occurred in the age group 67+, from 16 to 43 in 2022.
Population structure by age-group in Norwegian settlements on Svalbard, 2009 and 2022. Source: SSB, compiled by the author.
Sex ratio measures the proportion of males relative to females in a population. Natural population sex ratios exceeding 105 males per 100 females are considered skewed (Hesketh & Xing, Reference Hesketh and Xing2006). In 2009, the population on Svalbard was male-dominated with a sex ratio of 138 males per 100 females. As a result of diversifying economic activity, the sex ratio reached 116 in 2022, signifying a shift towards a more balanced population structure, but still with the underrepresentation of females. Of all residents, 40% had higher education, compared to 32% in the rest of the country (Statistics Norway, 2016).
The data from the Norwegian Tax Administration registering everyone intending to stay on Svalbard for over six months showed that the number of Russian citizens in the Norwegian settlements increased by 62.5% from 32 in 2010 to 52 in 2020. Of the Russian population in the Norwegian settlements in 2010, 63% were female in 2020 the share of females equalled 56%. More attractive earning potential is likely among the pull factors. However, the data do not show if these people moved from the Russian settlements or came to the Norwegian settlements from elsewhere.
Statistics Norway provides some data on population movement. According to the 2016 estimates, nearly one-quarter had moved to Svalbard more than ten years ago. The average stay varies from one to seven years, depending on the nature of the work. People in mining and local administration tend to stay longer, while employees at higher education institutions, in tourism and government institutions have far shorter periods of residency (Statistics Norway, 2016). The White Papers states that:
Just as the Norwegian authorities do not wish to facilitate life-long residence for Norwegians in Svalbard, it is not up to the Norwegian authorities to facilitate life-long residence for foreign nationals who choose to stay in Svalbard (Meld. St. 32, (2015–2016)). Svalbard, p.53).
This explains the limited social and medical services such as long-term medical care (Grydehøj et al., Reference Grydehøj, Grydehøj and Ackrén2012).
The demographic profile of the Norwegian settlements on Svalbard hence demonstrates several trends: growth in population, increasing number of foreign nationals and an increasing population in the age groups 20–44 and a decreasing population of children and young people. The decrease in the number of children and young people may be due to trends in the Nordics with falling birth rates and rising age of first-time parents (Norden, 2020). Overall, the population in the Norwegian settlements on Svalbard reflects work-based residency.
Socio-economic development
Statistics Norway (SSB) conducts a national survey on Quality of Life but the results are not available on the regional level. Some studies, such as that by Timlina, Meyer, Nordström, & Rautio (2022), use survey data to access the quality of life in the Norwegian settlements on Svalbard. Despite the small sample size, the results suggest overall that people enjoy good health, well-being, quality of life and life satisfaction in Longyearbyen, Svalbard (Timlina et al., 2022).
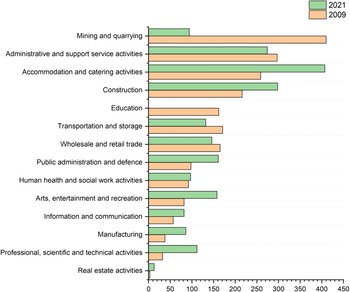
The breakdown of employment by industry in 2008 and 2021 shows that Norwegian settlements on Svalbard transitioned from being mining communities to communities dominated by accommodation and catering services accounting for 20% of all employment in 2021 (see Fig. 5). The role of mining and quarrying in employment decreased from 410 jobs in 2009 to 94 jobs in 2021. The community on Svalbard relies on functioning public administration and support services making up 13% of jobs in 2021. Collectively, accommodation and hospitality services, administration and construction accounted for 47% of all employment in 2021. While small in absolute numbers, the biggest growth occurred in real estate activities from three people in 2008 to 13 in 2021. Professional, scientific and technical activities saw an increase of 250% from 32 people in 2008 to 132 in 2021, followed by an increase of 92% in arts, entertainment and recreation from 82 people in 2008 to 158 people in 2021. In 2008, 162 people were employed in education. The data for 2021 are not available due to confidentiality. Statistics Norway does not publish figures to avoid identifying persons or companies. Diversification in the employment structure explains the increased population diversity in the Norwegian settlements on Svalbard. Growth in professional, scientific and technical activities shows that the strategic goals outlined in the White Paper and in the strategic documents of the research institutions have started to materialise.
Employment by industry in Norwegian settlements on Svalbard, 2008 and 2021 Source: SSB, compiled by the author.

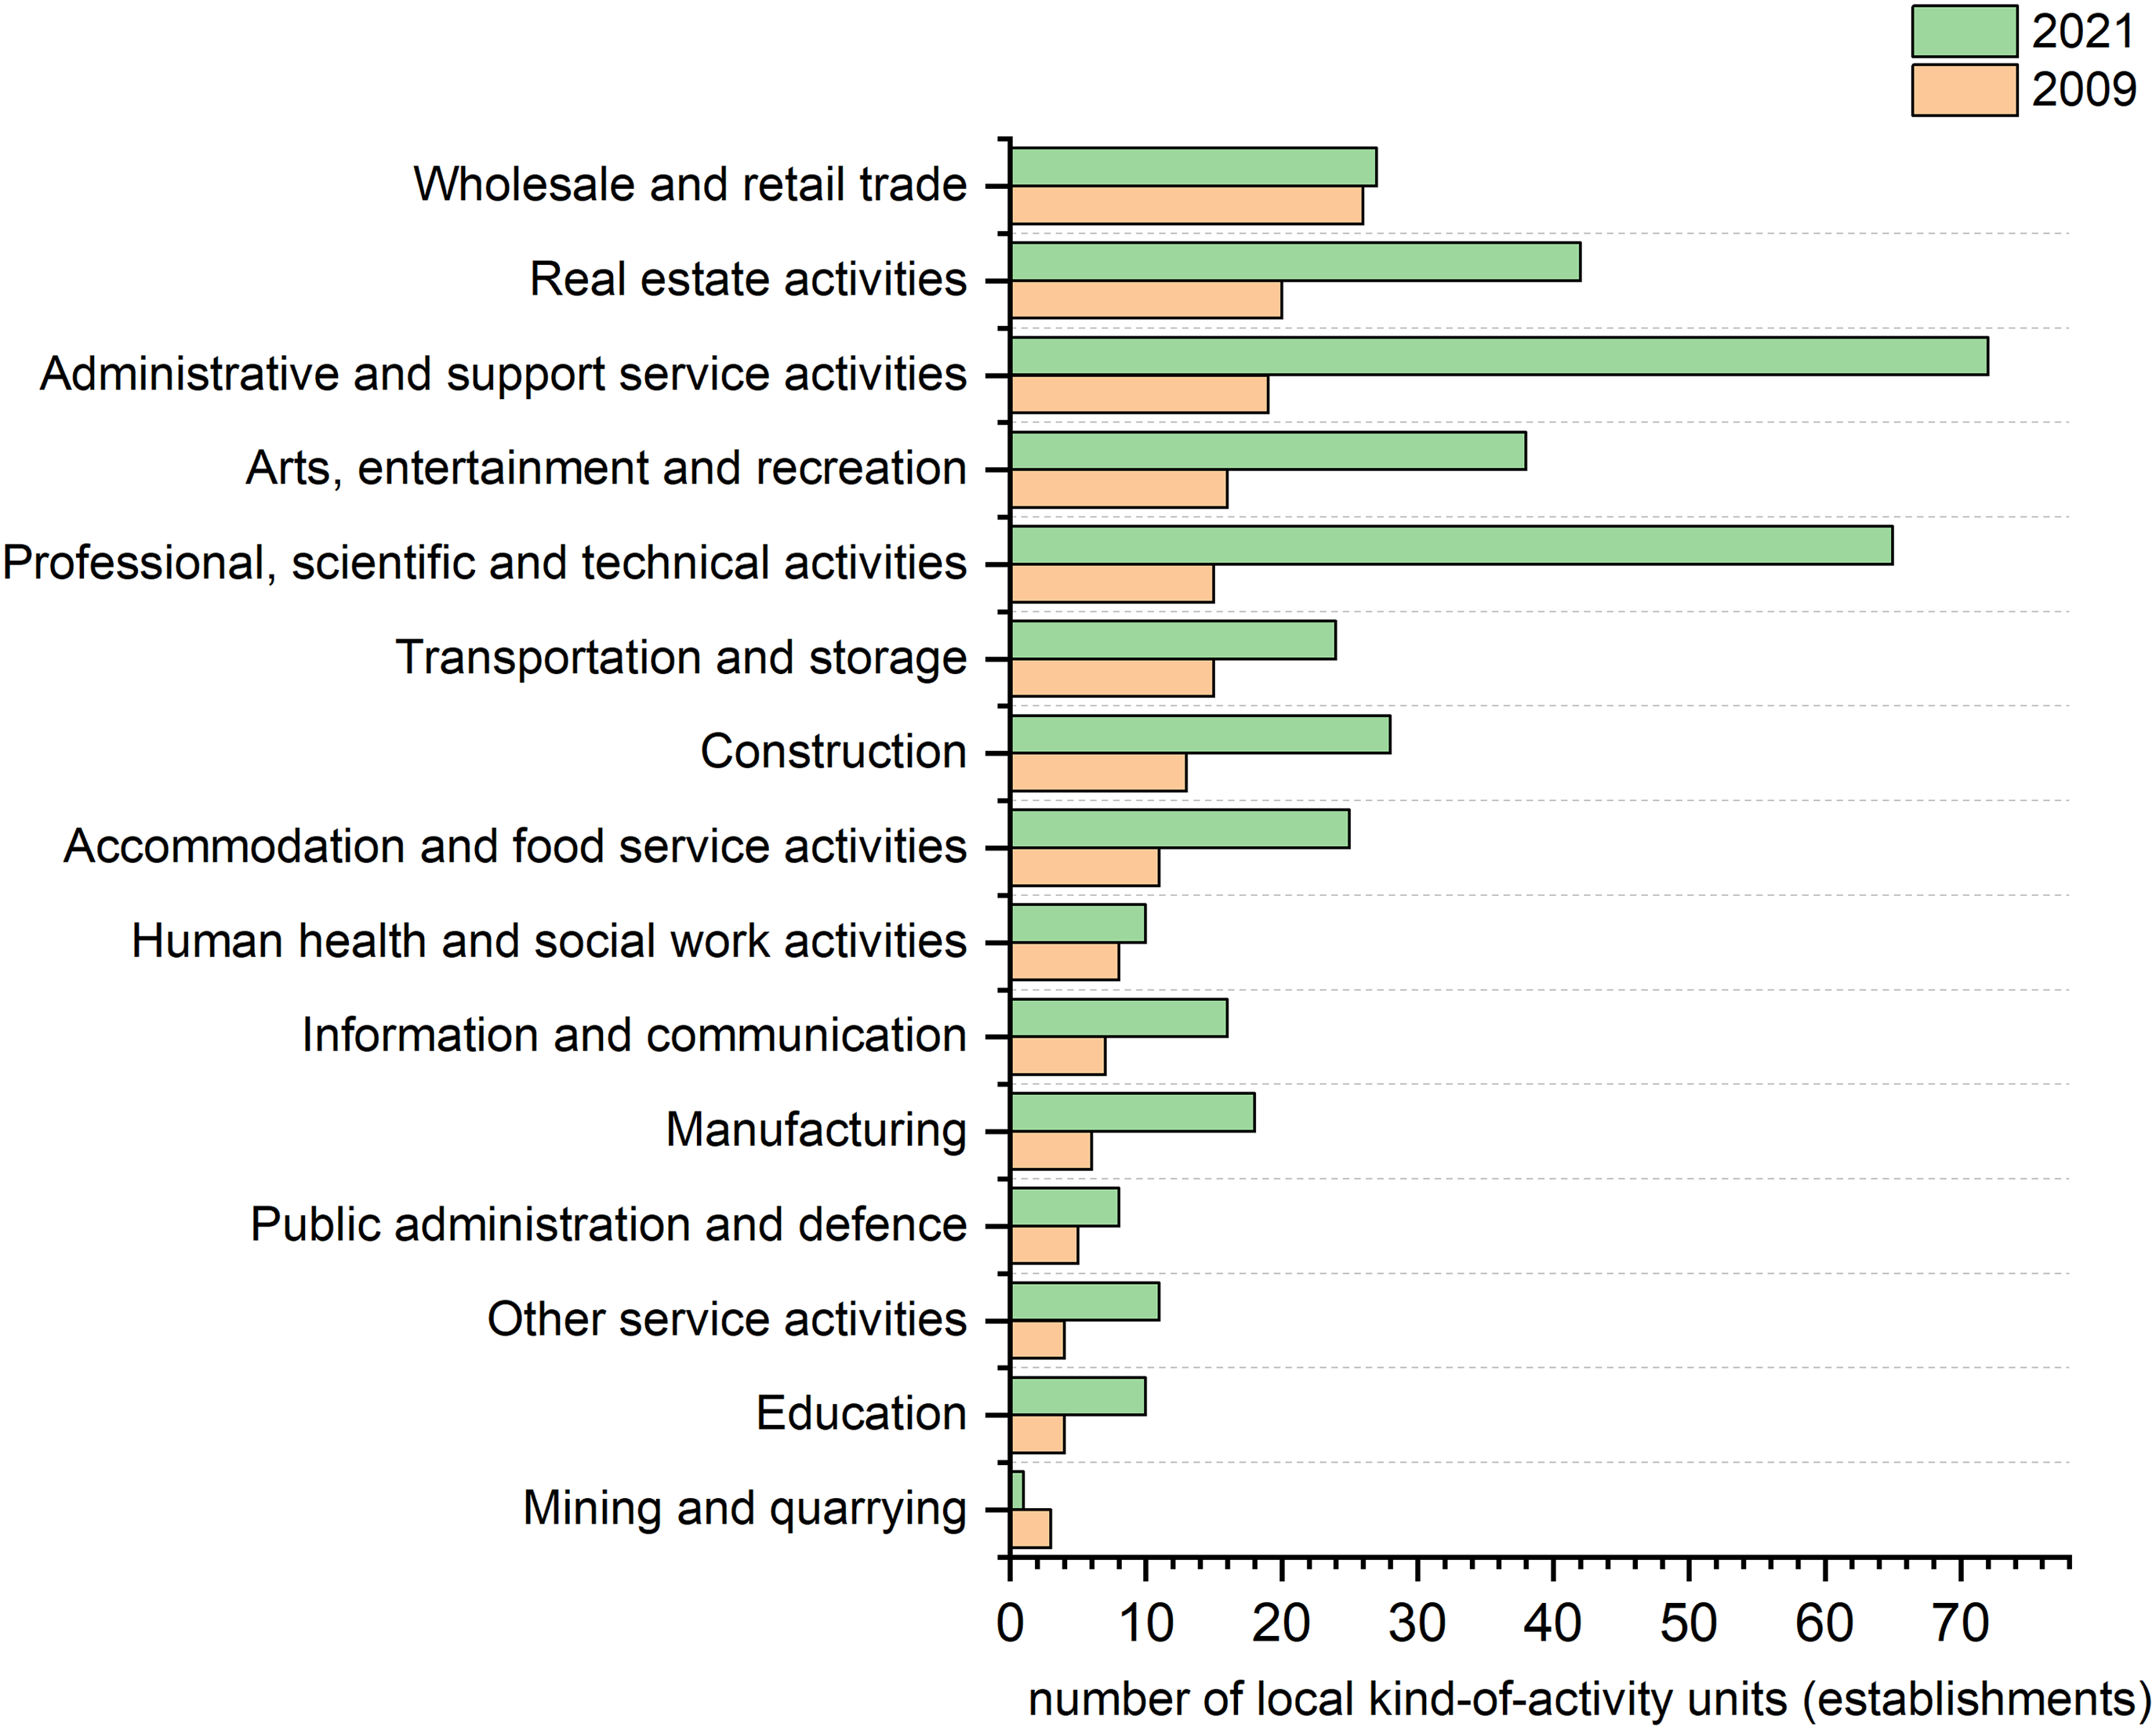
The achievement of the goals of the White Paper on Svalbard for diversified economic activity on Svalbard can be evaluated by analysing business activity. The Standard Industrial Classification (SIC2007) defines a local kind-of-activity unit (establishment) as a locally defined functional unit whose main activities fall within a specific industrial classification. A legal entity may engage in one or more lines of local kind-of-activity. From 2008 to 2021, the number of such establishments more than doubled from 172 to 395 (see Fig. 6). The impact of a well-articulated science policy on Svalbard is reflected in an increase in businesses specialising in professional, scientific and technical activities with an increase from 15 in 2008 to 65 in 2021. The greatest growth is seen in administrative and support service activities with 53 more business establishments in 2021 than in 2008. The growth is moreover apparent in the construction and hospitality industries and in the arts, entertainment and recreation.
Local kind-of-activity units (establishments) in Norwegian settlements on Svalbard, 2008 and 2021. Source: SSB, compiled by the author.
Subsidies and investments
Subsidies and investments serve to increase productivity through governmental or private sources. Public subsidies apply to allocations by the national or local government and other public bodies to support operations and investment in Longyearbyen (e.g. Innovation Norway). Investments here refer to those lasting more than a year, including those in new and used capital goods and extensions, alterations, improvements and repairs that prolong the lifetime of the capital goods or increase their production capacity. Costs for design, transportation and installation are also included.
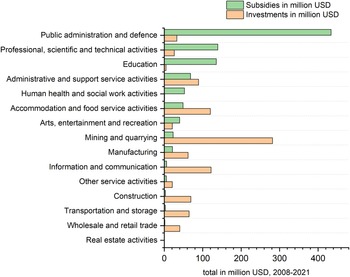
During the period 2008–2021, Svalbard received USD 1,133 million in state subsidies and USD 1,065 million in investments (see Fig. 7). The main recipient was public administration and defence, with subsidies totalling USD 434.1 million accounting for 38% of all subsidies during 2008–2021. Professional, scientific and technical activities received USD 139 million and education USD 135 million, each of these therefore accounting for 12% of total subsidies. Health and social care received USD 52 million or 5% of total subsidies during 2008–2021, while mining and quarrying received 2% of total subsidies amounting to USD 23 million. Industries receiving no state subsidies included real estate activities, transportation and storage, wholesale and retail trade, repair of motor vehicles and motorcycles.
Subsidies to and investments in Norwegian settlements on Svalbard by industry, cumulative figures in million USD 2008–2021. Source: SSB, compiled by the author. Note: converted from NOK to USD using Bank of Norway historical exchange rates.

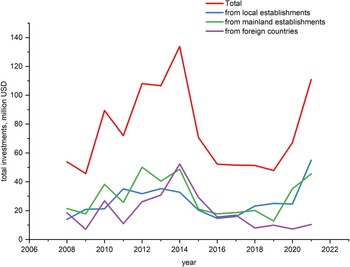
During the period 2008–2021, Norwegian settlements on Svalbard received USD 1,065 million in investments, the peak years being 2012–2013, when over USD 100 million was invested. The industries receiving most investments were mining and quarrying, accounting for a third of all investments. Growth in investments in information and communication, real estate activities and construction activities was attributable to the growing hospitality sector. Investments in Svalbard increased significantly during the period 2011–2014, with a rather sharp decrease after 2015 (see Fig. 8). During the period 2008–2021, local businesses invested altogether USD 370 million (33%), investments from mainland businesses accounted for USD 414 million (39%) of investments, foreign countries invested USD 270 million (26%). Only gross data on investments from foreign countries are available with no breakdown of the investments by country of origin.
Investments in Norwegian settlements on Svalbard by source, in million USD 2008–2021. Source: SSB, compiled by the author. Note: converted from NOK to USD using Bank of Norway historical exchange rates.

Socio-economic development in the Russian settlements
Strategic overview
Russian strategic presence on Svalbard was found in several strategic documents. Svalbard was included in the Russian Government Order on Activities in Hydrometeorology and Related Fields up to 2030 including climate change (Russian Government Order, 2010). The purpose of the strategic activities was to restore the number of hydrometeorological observation points using, e.g. unmanned meteorological stations. In 2015, the Russian State approved the concept of the Federal Targeted Programme “World Ocean” for the period 2016–2031 (Russian Government Order, 2015). The goal of the Programme is to intensify the use of the resources and spatial potential of the seas of Russia and ensure the presence of Russia in key regions of the world oceans and Antarctica, as well as the implementation of strategic tasks for scientific and information support for the development of maritime activities. Svalbard is included in the part of the World Ocean Programme for the purpose of conducting scientific research on the archipelago as a means of consolidating the Russian presence there.
The Russian Federation established the Government Commission for Ensuring the Russian Presence in the Spitsbergen Archipelago in 2007. The Commission is a permanent coordinating body between federal executive agencies and Russian organisations that implement the Russian presence on the Spitsbergen archipelago. The Commission is responsible for strategy formulation. The strategy of the Russian presence in the Spitsbergen archipelago until 2020 was approved in 2014 underlining the need for the optimisation and diversification of Russian activities in Spitsbergen. The strategy focused on basic and applied scientific research with the organisation of the Russian Scientific Center using the infrastructure of the Barentsburg and Pyramida settlements (Russian Government Order, 2014).
The new strategy for a Russian presence on the Svalbard archipelago until 2030 was introduced in 2020 (Government Commission for Ensuring the Russian Presence in the Spitsbergen Archipelago, 2020). The strategy’s objectives are directly related to the work of Trust Arktikugol, the primary Russian organisation conducting economic activities on the Svalbard archipelago. It included support for the trust’s current activities combined with efforts to attract qualified personnel and enhancements of the social and living conditions of the enterprise’s employees. The formation of a long-term development plan for Trust Arktikugol was considered in order to ensure Russia’s presence on Svalbard.
In October 2020, the Russian Federation published a Strategy for the Development of the Arctic Zone of the Russian Federation and ensuring national security for the period up to 2035 (Presidential Decree, 2020). Within this strategy, the Russian presence on the Svalbard archipelago will be ensured on terms of equal and mutually beneficial cooperation with Norway and other states party to the Svalbard Treaty of 9 February 1920. The analysis of Russian strategic documents showed that the emphasis was on scientific research and preserving presence on the archipelago. The strategic documents examined made no mention of demographic and business activity development goals for Russian settlements on Svalbard.
Demographic and socio-economic trends in the Russian settlements
The Russian presence on Svalbard is concentrated in Barentsburg, which is home to about 500 people and in Pyramida, a former mine now used for tourist activities (Vlakhov, Reference Vlakhov2019). Based on an extensive data search and numerous requests to organisations (see Table 1) possibly compiling demographic and socio-economic data, it appeared that there was no systematic and coordinated data collection in the Russian settlements. Judging from the data availability, one might conclude that it would be easier to find historical data from the Soviet era in scientific publications than in any more recent demographic or economic sources. The collection and storing of such data are usually entrusted to national statistical bureaus. Since the Norwegian statistical bureau did not collect this data, there was not a single organisation to fulfil the role of data collector.
Analysis of demographic indicators
The population in the Russian settlements during the Soviet Union period was 1,230 as of 1937. On average, and prior to WWI from 1,500 to 2,000 Soviet citizens lived and worked in the Russian settlements (Portsel, Reference Portsel2019). Foreign visitors to Soviet settlements were surprised by the number of children. Many of these were born on the archipelago; others were brought by their parents, hence creating a need for nurseries, kindergartens and schools. There were even times when pre-school facilities were overcrowded (Portsel, Reference Portsel2019). During WW2, in 1941 the population of the Russian settlements was evacuated. The Barentsburg, Grumant and Pyramida mines were restored after 1946. The Russian settlements had 2,900 residents in 1958 (Portsel, Reference Portsel2019). The population shrank after the Grumant mine closed in 1961. In 1990, Svalbard had over 2,400 Soviet residents. During perestroika, the number of children decreased as many miners moved to the Russian mainland. Due to financial constraints, Trust Arktikugol had to abandon the school and kindergarten in 1995. Five years later, funding of the children’s institutions resumed. In mid-2018, 75 families with 53 children were living in the Russian settlements on Svalbard (Portsel, Reference Portsel2019). In 1992, there were 223 children in Barentsburg; in 2019, there were 60 children in day care and school in Barentsburg (Russkiy Vestnik Shpitsbergena, 2019).
According to Statistics Norway data for the first half of 2022, the population of Barentsburg and Pyramida was 391. The Russian settlements on Svalbard can be categorised as urban settlements with developed infrastructure built around the industrial enterprise at the heart of the conurbation. Trust Arktikugol is the main provider of social and community services in the Russian settlements; these include housing, a hospital, a cultural and sports complex and a kindergarten. The data received from Trust Arktikugol showed that there were 401 workers as of 1 January 2020. During the period 2010–2020, the average number of workers at Trust Arktikugol was 391, the average age being 40.1 years. Most Russians fly to Svalbard to work under a contract. The standard contract lasts no more than three to four years but some people try to extend it and have been living in Barentsburg for more than 10–20 years (Rjabikova, 2021).
The data available on the Norwegian and Russian settlements showed that for the Russian settlements, there were no data divided by age groups and gender. Data on children were gathered from articles based on archival research and from local newspapers. The lack of demographic data on the Russian settlements posed a challenge in interpreting social changes and transitions in the Russian settlements on Svalbard. Nevertheless, the general trend reflected a decreasing population and a decreasing population of children.
Socio-economic development
Schennerlein (Reference Schennerlein2021) studied the social situation in the Russian settlements focusing on satisfaction with material living conditions, satisfaction with cultural and social life, satisfaction with educational opportunities and satisfaction with health care. Of the miners, only 18% of respondents were happy with their salaries, while tourism workers were generally more content. According to the survey, most people (around 77%) were satisfied with their living conditions with the availability of Internet, mobile communication and digital television. Respondents were generally satisfied with cultural and social life, education opportunities for children (except for a lack of further education opportunities for young people), and with the basic medical care.
Some financial data are available on the activities of Trust Arktikugol. The enterprise has been running at a loss for the last ten years. The Trust diversified its activities into tourism in 2011. Fig. 9 presents a summary of the financial results of Trust Arktikugol for the period 2012–2021. The revenue during 2012–2019 averaged at USD 7 million per year, still resulting in a negative net financial result in the range of USD –2.4 million in 2020 and USD –0.2 million in 2022. Trust Arktikugol main activity is coal mining, but it operates in 37 auxiliary activities, e.g. beer brewing and book publishing. Apart from financial reporting statements, no other data were available on economic activities and the number of organisations or local kind-of-activity units (establishments) in the Russian settlements.
Selected financial indicators from Trust Arktikugol financial reporting, 2012–2021. Source: Kontragent database. Note: Converted from RUB to USD using the Russian Central Bank historical exchange rates.

The growing importance of tourism is supported by an increase in the number of tourists visiting Russian settlements: from 13,000 in 2014 to 37,000 in 2019. The former Director of Tourism at Trust Arktikugol and at the Arctic Travel Company Grumant, Mr. Rogozhin commented that the number of tourists was expected to reach 100,000 in the long term (High North News, 2020). These estimates need to be revised as a result of COVID-19 and the changing geopolitical environment.
Subsidies
The data on subsidies granted to organisations with activities related to Svalbard (including those located on Svalbard) were obtained from the State Expenditures project, a technological project of the Accounts Chamber of the Russian Federation (The State Expenditures Project, 2020). Data on subsidies were in open access and intended to provide a tool for public control and to ensure maximum accessibility of primary, processed and analytical data. The database search yielded 140 contracts on subsidies granted related to Svalbard during the period 2010–2020. Fig. 10 demonstrates that the number of subsidies decreased from USD 4 million in 2010 to USD 1.6 in 2020. Altogether 21 organisations received subsidies during this period.
Federal budget subsidies to organizations with activities related to Svalbard, 2010–2020. Source: The State Expenditure Project, compiled by author. Note: converted from RUB to USD using Russian Central Bank historical exchange rate.

Next, all recipients were categorised by their type of activities (see Fig. 11). The data show that various research institutes received 29.2% of all subsidies followed by the Murmansk Department for Hydrometeorology and Environmental Monitoring (25.5%), the Federal Agency of Communications received 15.8% and Trust Arktikugol 15.5% of all subsidies during the period 2010–2020.
Distribution of subsidies to organizations with activities related to Svalbard, 2010–2020. Source: The State Expenditure Project, compiled by author.

The distribution of subsidies reflects an emphasis on preserving the activities of Trust Arktikugol. At the same time, a significant amount of subsidies was allocated to research and scientific activities, hence supporting the increased role of scientific research as outlined in the Russian strategic documents.
Discussion
Based on the review of strategic documents produced by both Norwegian and Russian actors, it is evident that Svalbard is relinquishing mining in favour of a research and science-oriented community with a diversified service and professional activities sector. The Norwegian strategic documents encouraged diversified economic activities while conveying a message of caution towards uncontrolled growth with vast cost consequences for infrastructure development to be paid from the state budget. The Norwegian documents were vague about demographic policy except that the long-term residency on Svalbard was not facilitated by the Norwegian state. The data analysed made clear that the Norwegian and Russian settlements on Svalbard have their own separate development paths. In the Norwegian settlements, the path was towards balancing state and private capital inflows supporting development, whereas the Russian settlements were set to continue to rely upon state support around the urban settlement-forming enterprise Trust Arktikugol. In both the Norwegian and the Russian settlements, tourism and related industries were increasing in importance for employment until 2020. The effect of COVID-19 and the rapidly changing geopolitical environment calls for a re-evaluation of major industries and employment opportunity growth sectors on Svalbard.
The aim of diversifying economic activities enshrined in the Norwegian strategic documents was reflected in the data. Analysis of economic activities in Norwegian settlements showed diversified employment. The amount of subsidies and investments in Svalbard grew rapidly over the last ten-year period. Subsidies and investments resulted in the formation of an additional 223 local kind-of-activity units (establishments) in the Norwegian settlements during 2008–2021. Overall, total state subsidies of USD 1,133 million exceeded private investments (USD 1,065 million) during the period 2008–2021. Demographic indicators in the Norwegian settlements reflected population growth, notably in the working-aged cohort (20–66-year-olds) and a greater proportion of foreign nationals in the Norwegian settlements. Economic diversification brought increased business activity and facilitated rapid demographic shifts in the Norwegian settlements, where the majority of the population was employed in accommodation and hospitality, administrative and support service activities.
Development in the Russian settlements centred around the state-subsidised enterprise Trust Arktikugol, which traditionally focused on mining activities but also embarked on tourism operations in 2011. Mining activities remained unprofitable with tourism bringing financial inflows to Trust Arktikugol. The population in the Russian settlements averaged in the region of 440 during 2012–2022. There were no data on investments and numbers of business establishments in the Russian settlements. Openly available data on the Russian state subsidies showed that the focus was on supporting Trust Arktikugol and research institutes with activities related to Svalbard. Subsidies by the Russian state amounted to USD 30 million during the period 2010–2020.
The demographic and economic data on the Norwegian settlements were fairly comprehensive, but still are not comparable to those for mainland Norway, e.g. there were no comprehensive data on educational attainment, income per household and population forecasts. The Norwegian data nevertheless enabled us to analyse population structure by age group and gender. Demographic data on the Russian settlements were not compiled by any of the organisations and institutions identified. Only very limited data were available on the population in the Russian settlements.
Conclusions
The findings provide evidence of different developmental paths in the Norwegian and Russian settlements on Svalbard and confirm the need for systematic socio-economic data collection on Svalbard. It is impossible to form a holistic picture without comprehensive data on both Norwegian and Russian settlements. In future, the forecasting and analysis of various adverse events, such as the COVID-19 pandemic, will depend on the availability of such data. While Svalbard serves as a beacon of data sharing and transparency in natural sciences, the same level of data availability and transparency is needed for demographic and socio-economic indicators. Cooperation between the organisations identified in this article can serve as a first step to define roles and responsibilities in data collection and sharing. The unstable geopolitical situation makes cooperation between Russia and Norway challenging and may result in a reluctance to cooperate and share data. Norway, as the guarantor of economic and scientific rights for the countries of the Svalbard Treaty (Nabok, Reference Nabok2013b), can act as facilitator in demographic and socio-economic data sharing among all countries with settlements and conducting scientific research on Svalbard.
Furthermore, data collection, its storage and utilisation should be built to accommodate emerging security risks and complement the achievement of the United Nations Sustainable Development Goals (UN SDGs). The UN SDGs call for the building of partnerships in order, among others, to significantly increase the availability of high-quality, timely and reliable data disaggregated by income, gender, age, race, ethnicity, migratory status, disability, geographic location and other characteristics relevant in national contexts. Reliable data collection in both Norwegian and Russian settlements is relevant in achieving all UN SDGs instrumental to gender equality, combating climate change and ensuring health and well-being. Because of the effects of COVID-19 and the fast-shifting geopolitical climate with increasing tensions in the Arctic (Gricius & Fitz, Reference Gricius and Fitz2022), it is necessary to conduct a reassessment of Svalbard’s demographic, socio-economic trends and job opportunity growth areas post-2021.
Financial support
This study received no specific grant from any public funding agency, commercial or not-for-profit sectors.
Conflict of interest
The author declares no conflict of interest


 Open access