


1. Introduction
Ice core chronology is an initial and essential step for the interpretation of the past records of climate, environment and atmospheric circulation from polar ice cores (Legrand and Mayewski, Reference Legrand and Mayewski1997; Traversi and others, Reference Traversi2004; Sinclair and others, Reference Sinclair, Bertler and Trompetter2010; Furukawa and others, Reference Furukawa2017). A precise chronology provides an accurate quantification of snow accumulation rate in sub-annual and annual scales which is an important measure to surface mass-balance studies (Frezzotti and others, Reference Frezzotti, Urbini, Proposito, Scarchilli and Gandolfi2007; Rignot and others, Reference Rignot, Velicogna, van den Broeke, Monaghan and Lenaerts2011). Associated to the large spatial variability in Antarctic snowfall (Anschütz and others, Reference Anschütz2011), the local estimation of snow accumulation rate is vital for the coastal Antarctic mass balance (Krinner and others, Reference Krinner, Magand, Simmonds, Genthon and Dufresne2007), assessment of climate models, satellite measurements (Stenni and others, Reference Stenni2000; Goursaud and others, Reference Goursaud2017) and the response of climate and environmental changes on polar ice sheet (Stenni and others, Reference Stenni2000; Sinclair and others, Reference Sinclair, Bertler and Trompetter2010; Kwak and others, Reference Kwak2015).
Age dating of firn cores has commonly been done by counting the seasonal signals of its stable water isotopic compositions (δ18O and δD) and ionic species (e.g. Udisti, Reference Udisti1996; Wagenbach and others, Reference Wagenbach, Legrand, Fischer, Pichlmayer and Wolff1998; Kreutz and others, Reference Kreutz and Mayewski1999; Udisti and others, Reference Udisti1999; Delmotte and others, Reference Delmotte, Masson, Jouzel and Morgan2000; Stenni and others, Reference Stenni2000; Rhodes and others, Reference Rhodes2012; Markle and others, Reference Markle, Bertler, Sinclair and Sneed2012; Caiazzo and others, Reference Caiazzo2016; Goursaud and others, Reference Goursaud2019). In coastal Antarctica, distinguishable seasonal signal of isotopic composition is trapped in snow layers and can be interpreted based on the conventional correlation of δ18O (or δD) and air temperature (e.g. Dansgaard, Reference Dansgaard1964; Jouzel and others, Reference Jouzel1997), coupled with the seasonal changes of sea-ice extent (SIE) (Bromwich and Weaver, Reference Bromwich and Weaver1983; Noone and Simmonds, Reference Noone and Simmonds2004; Rhodes and others, Reference Rhodes2012; Tuohy and others, Reference Tuohy2015; Holloway and others, Reference Holloway, Sime and Singarayer2016). Moreover, the peak values of CH3SO3– (methanesulfonic acid [MSA]) and non-sea-salt sulfate (nssSO42–) illustrate noticeable peaks during spring and summer in the northern Victoria Land (e.g. Udisti and others, Reference Udisti, Traversi, Becagli and Piccardi1998; Rhodes and others, Reference Rhodes2012; Becagli and others, Reference Becagli2016).
Due to the short-term and sparse instrumental data (e.g. Stenni and others, Reference Stenni2000; Tuohy and others, Reference Tuohy2015, Jones and others, Reference Jones2016), trying to capture the high-spatial variability of the vast Antarctic continent (Masson-Delmotte and others, Reference Masson-Delmotte2008), more proxy records with sufficient resolution are still necessary to be reconstructed (Goursaud and others, Reference Goursaud2019). Particularly at coastal sites, there is a need to improve the interpretation of past environmental and climate records (Dansgaard, Reference Dansgaard1964; Stenni and others, Reference Stenni2000, Reference Stenni2017; Krinner and others, Reference Krinner, Magand, Simmonds, Genthon and Dufresne2007; Jouzel and Masson-Delmotte, Reference Jouzel and Masson-Delmotte2010; Tuohy and others, Reference Tuohy2015; Goursaud and others, Reference Goursaud2019). Accordingly, the northern Victoria Land is characterized by less available data and large variability in temperature (Yang and others, Reference Yang2018). The combination of the high-altitude Transantarctic Mountains and the low-altitude coastal areas means that this site is a potential location for the study of air mass transport at both the regional and global scale (Udisti and others, Reference Udisti, Traversi, Becagli and Piccardi1998). Moreover, a strong influence from marine sources also enhances the particular interest to investigate the variability of SIE (Drewry and others, Reference Drewry, Jordan and Jankowski1982; Han and others, Reference Han2015; Kwak and others, Reference Kwak2015; Thomas and others, Reference Thomas2019). In addition, the previous studies showed a relatively higher accumulation that ranged from 203 to 226 kg m–2 a–1 in Styx Glacier (Stenni and others, Reference Stenni2000; Kwak and others, Reference Kwak2015), thus, the site is assumed to provide better annual signals of proxy records with negligible effects of post-deposition noise (Maggi and others, Reference Maggi1998; Frezzotti and others, Reference Frezzotti, Urbini, Proposito, Scarchilli and Gandolfi2007; Goursaud and others, Reference Goursaud2019).
As a part of the ongoing research at Jang Bogo Korean research station focused on reconstructing past climate with a focus on changes in SIE, two cores (210.5 and 8.84 m long) were obtained from the Styx Glacier during 2014–15 austral summer. The 210.5 m long ice core (Styx-M) is approximately estimated to cover the time period back to >2 ka (Han and others, Reference Han2015; Yang and others, Reference Yang2018). To interpret the long ice core (Styx-M) and for accurate dating, the isotopic and ionic composition of the less consolidated snow layers in the firn core (Styx-B) are important. In this study, the chronological characteristics of 8.84 m long firn core (Styx-B) was discussed by evaluating the seasonal variations of the isotopes (δ18O and δD) and major ionic species (Na+, K+, Mg2+, Ca2+, MSA, Cl– and SO42–). The correlation and principal component analyses were applied to characterize the record of isotopes and ionic species. The seasonal signals of the δ18O and δD, nssSO42− and MSA were detected as already done in earlier studies (e.g. Udisti, Reference Udisti1996; Udisti and others, Reference Udisti, Traversi, Becagli and Piccardi1998; Stenni and others, Reference Stenni2000; Kwak and others, Reference Kwak2015; Caiazzo and others, Reference Caiazzo2016) and the annual mean snow accumulation rates were estimated. The mean accumulation rate was compared with the estimation by firn densification models (Herron and Langway, Reference Herron and Langway1980; Morris, Reference Morris2018). More reliably interpreting this core is made possible by comparison with instrumental data and the known climate events in recent years. This study will extend the previous records in this site (Udisti and others, Reference Udisti, Traversi, Becagli and Piccardi1998; Stenni and others, Reference Stenni2000; Traversi and others, Reference Traversi2004) and will be useful for the interpretation of the long ice core drilled at same site to represent the historical changes of oceanic (e.g. sea ice) and atmospheric environment in this region.
2. Materials and methods
2.1. Study area
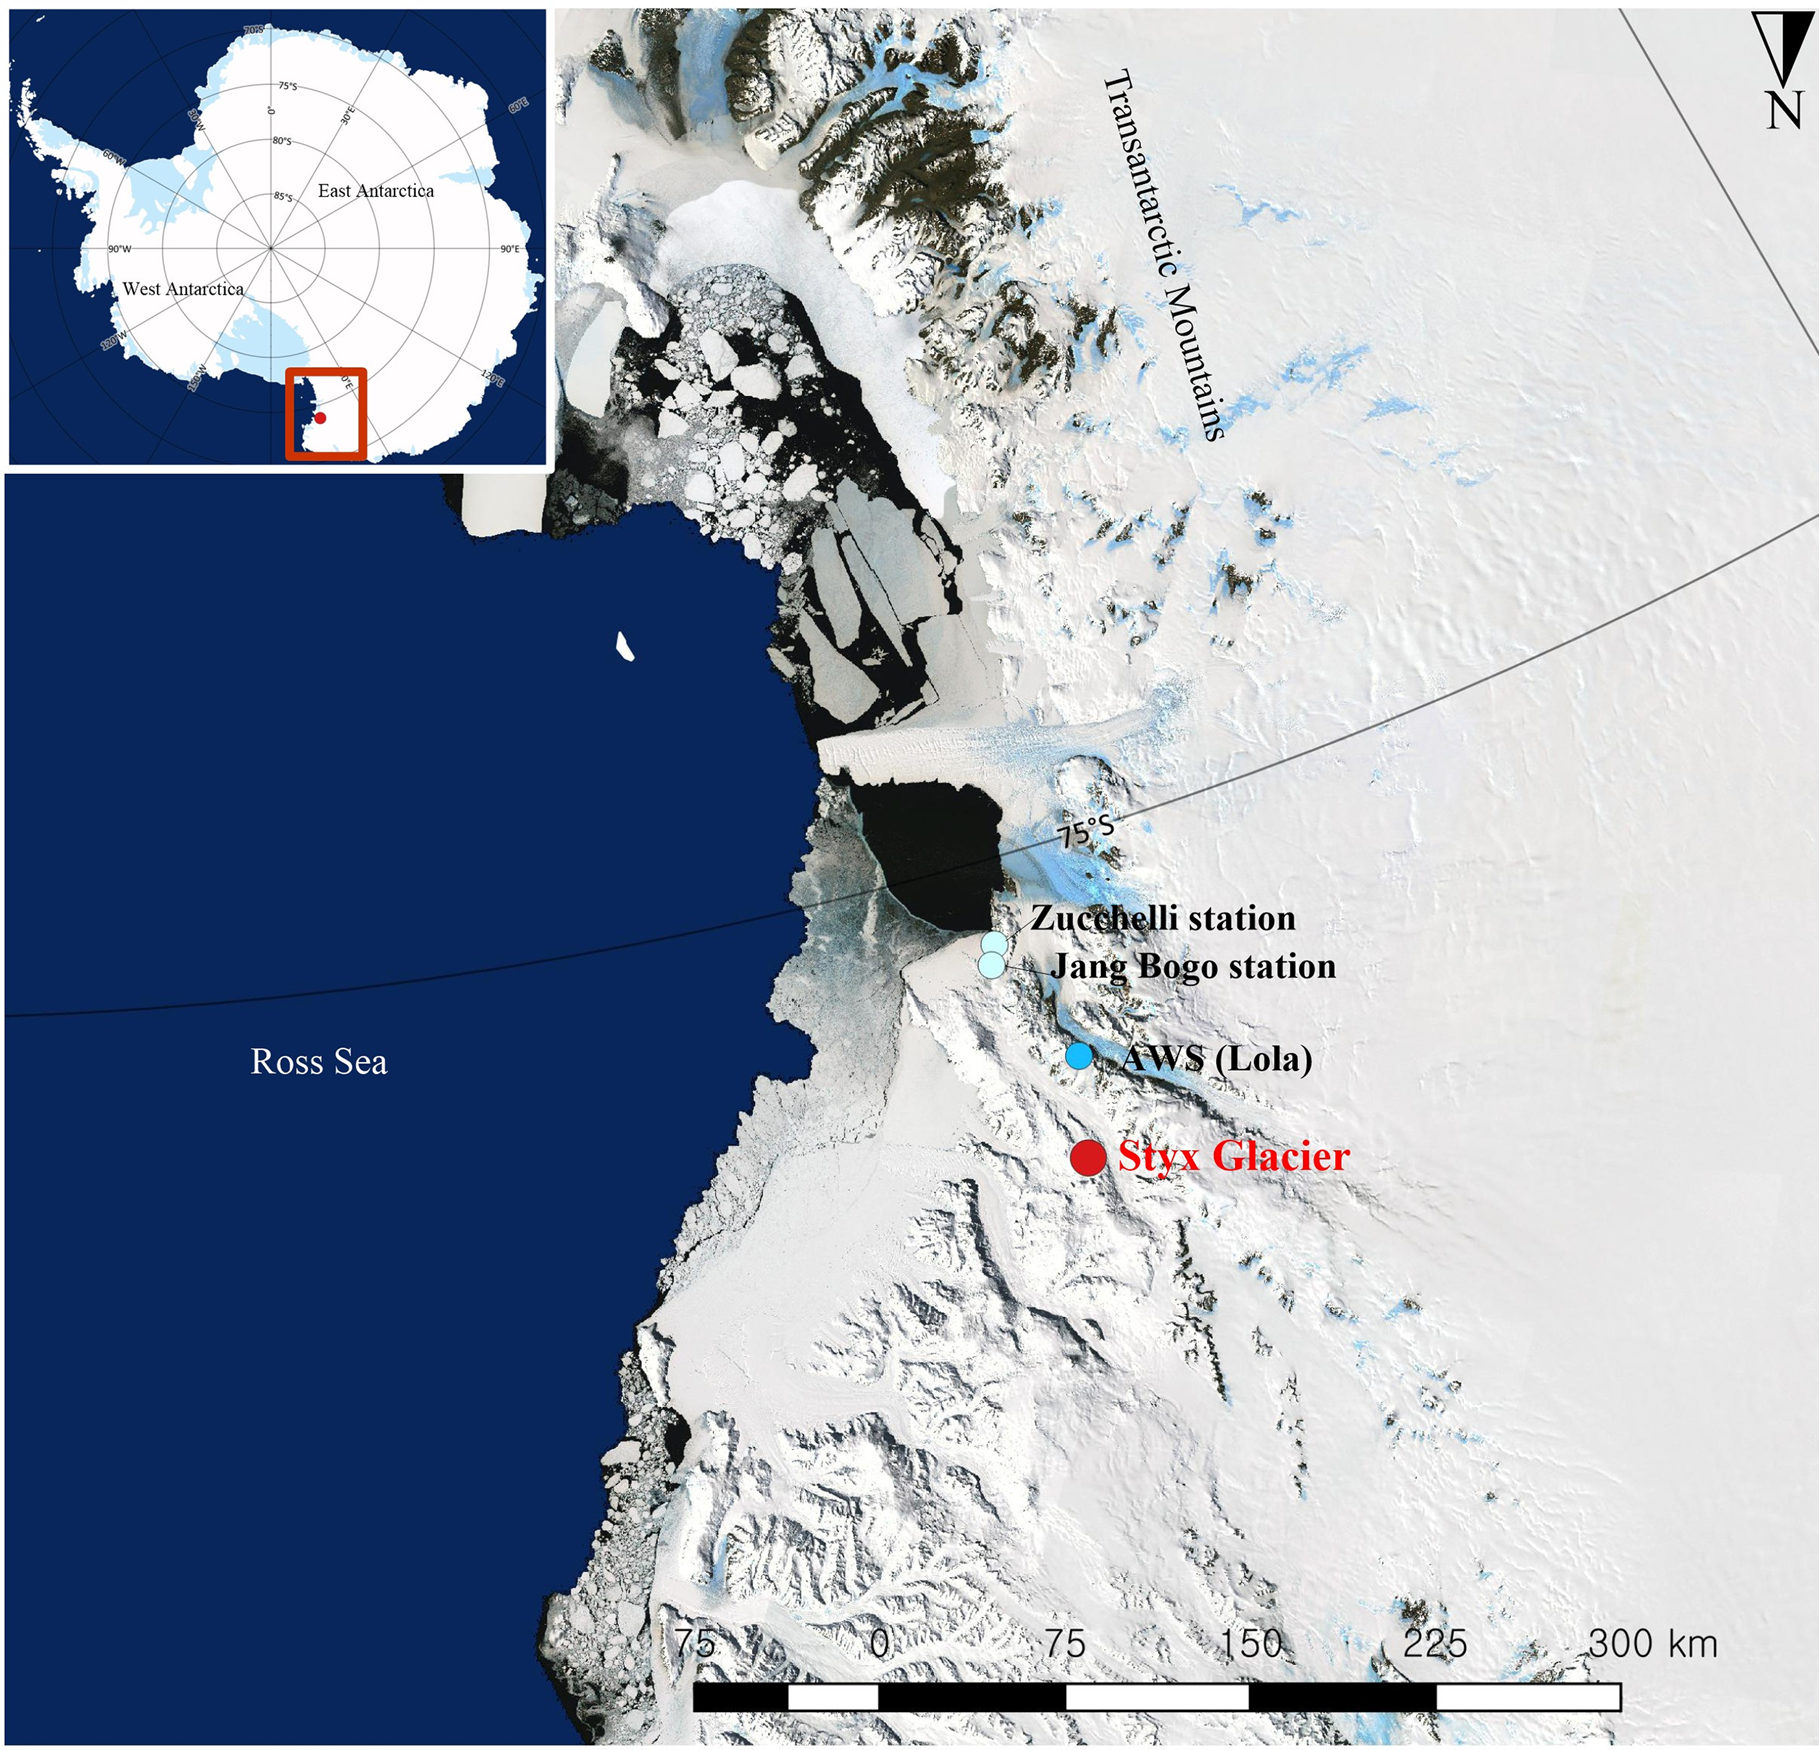
The drilling site (73°50.975′ S, 163°41.640′ E; 1623 m a.s.l.) is situated on the Styx Glacier (150 km2 plateau area) in the northern Victoria Land, East Antarctica, which is 85 km north of the Jang Bogo Station and ~60 km from the western coast of the Ross Sea (Fig. 1). During the Korean ice core drilling program (2014–15), the firn core (Styx-B) was drilled from the adjacent position (at a distance of ~100 m) of the longer ice core (Styx-M) by Korea Polar Research Institute (KOPRI). The annual mean temperature was −32.5°C, based on the 15 m depth borehole temperature measurement (Yang and others, Reference Yang2018) and a horizontal ice flow was estimated to be ~0.9 m a–1, and an ice thickness was determined to be 550 m by using a ground-penetrating radar (Hur, Reference Hur2013).
The location of drilling site on Styx Glacier with South Korean Jang Bogo Research Station, Italian Mario Zucchelli Station and the nearest AWS (Lola) in Northern Victoria Land, East Antarctica.
Air mass mainly originates from the low-pressure center locally formed over the Ross Sea (Drewry and others, Reference Drewry, Jordan and Jankowski1982; Scarchilli and others, Reference Scarchilli, Frezzotti and Ruti2011; Sinclair and others, Reference Sinclair, Bertler and van Ommen2012) with the prevailing southerly and southwesterly wind in this region (Udisti and others, Reference Udisti1999). During the period of 1980–2010, the sources from oceanic/West Antarctic (57.4%) and continental/East Antarctic (42.6%) were suggested as the dominant source to Ross Sea region (Markle and others, Reference Markle, Bertler, Sinclair and Sneed2012). Stenni and others (Reference Stenni2000) indicated that this region is a flat area with well-preserved snow layers, accompanying by a minimal effect from katabatic wind/existence of modest snowdrifts and absence of melting of ice layers (Udisti and others, Reference Udisti, Traversi, Becagli and Piccardi1998). Moreover, the accumulation rate is relatively high in this region (Stenni and others, Reference Stenni2000; Han and others, Reference Han2015) with respect to other inland Antarctic sites (e.g. Wagnon and others, Reference Wagnon, Delmas and Legrand1999; Traversi and others, Reference Traversi, Becagli, Castellano, Largiuni, Udisti, Colacino and Giovannelli2000). These features support the correct detection of the seasonal signals, because the high thickness of the annual snow layer prevents the uncertain stratum of snow that may result from the diffusion of isotopic components (Hoshina and others, Reference Hoshina, Fujita, Iizuka and Motoyama2016).
2.2. Sampling and analysis
The firn core with an average diameter of 0.09 m (ranged from 0.092 to 0.096 m) was collected in 18 runs by a drilling system by Geo Tecs Co., Ltd, Japan (Han and others, Reference Han2015). The average length for each run was 0.51 m (ranged between 0.25 and 0.84 m). During sampling, the density was estimated by measuring the mass and dimensions of the firn core subsections. The samples were kept frozen in polyethylene plastic bags and transported to KOPRI in Korea. The samples were stored under −20°C temperature in a cold room prior to the isotopic and ionic analysis.
Inside the cold room, the external thin layers were removed and cut with an average length of 0.04 m for isotopic analysis. The subsampled ice samples were melted at room temperature (~20°C) in a clean room and filtered by a 0.45-μm PVDF syringe filter (Merck Millipore, USA) before being decanted into 2-mL glass vials (dried for over 72 h at 50°C). Isotopic measurements were performed on 227 samples by a cavity ring-down spectroscopy (L1102-i, L2130-i, L2140-i, Picarro Inc., USA) and calibrated by International Atomic Energy Agency standards including Vienna Standard Mean Ocean Water (VSMOW), Greenland Ice Sheet Precipitation and Standard Light Antarctic Precipitation. Moreover, an in-house reference standard (with the isotopic composition of −34.6 ± 0.07‰ for δ18O and −272.4 ± 0.6‰ for δD, respectively), prepared by Antarctic snowmelt was measured in every ten samples to monitor the operation of the analyzer. Isotopic ratios were expressed by the comparison with the VSMOW standard in delta notation (δ18O and δD) with the unit of per mil (‰) as described in the following equation:

where R represents the ratio of heavy to light isotopes (18O/16O and D/H) in the sample and VSMOW standard. Analytical reproducibility was better than 0.1 and 1‰ for δ18O and δD, respectively. The deuterium excess (d-excess), which represents the deviation of the distribution of isotopic composition from the global meteoric waterline (GMWL), was estimated by using the equation: d-excess = δD − 8 × δ18O (Dansgaard, Reference Dansgaard1964).
Ionic species (Na+, K+, Mg2+, Ca2+, MSA, Cl– and SO42–) were simultaneously measured with an average depth resolution of 0.045 m (in 197 samples) by the two-channel ion chromatography system (ICS-200 and ICS-2100; Thermo Fisher Scientific Inc., USA) at KOPRI. Anions (MSA, Cl– and SO42–) were measured using a Dionex model ICS-2000 with an IonPac AS15 column and KOH eluent (6–55 mM). For the cation analysis (Na+, Ca2+, Mg2+ and K+), a Dionex model ICS-2100 with an IonPac CS12A column and MSA eluent (20 mM) were used. The analytical detection limit, reproducibility and accuracy were 0.01–0.26 μg L–1, 0.4–17.4% and 4.5–12.0% for cations and 0.02–0.26 μg L–1, 0.1–27.6% and 1.3–5.6% for anions, respectively (Hong and others, Reference Hong2012). The non-sea-salt (nss) proportion of the ions including K+, Mg2+, Ca2+, Cl– and SO42– were calculated to disentangle the input from the sea salt (ss) aerosol by Eqn (2). The theoretical ratio of certain ions and Na+ in sea water were used (Pilson, Reference Pilson2013). In this equation, Na+ was considered to be solely supplied from a sea spray (Kuramoto and others, Reference Kuramoto2011):

where X is the ion species and (X/Na+)sw is the ratio of the certain ion and Na+ in sea water. Similarly, the enrichment factor of SO42– was estimated by dividing the ratio (SO42–/Na+)sample in the sample to the theoretical ratio in sea water (SO42–/Na+)sw (Pilson, Reference Pilson2013).
2.3. Age–depth determination
Principal component analysis (PCA), the multivariate statistical technique, is applicable to classify the large dataset (e.g. Lee and others, Reference Lee, Ko, Kim and Chang2008). Several studies have applied PCA to measure proxies for past atmospheric conditions from ice core records (e.g. Knüsel and others, Reference Knüsel, Brütsch, Henderson, Palmer and Schwikowski2005) and snow pits (Kwak and others, Reference Kwak2015). It was utilized to emphasize the dominant characteristics of isotopic and ionic values in same depth resolution of the firn core (n = 197) using JMP® statistical software. The inter-correlated variation, which represents the same atmospheric sources and common transport path (Knüsel and others, Reference Knüsel, Brütsch, Henderson, Palmer and Schwikowski2005; Kwak and others, Reference Kwak2015), is shown (Fig. 2) and assist the visual interpretation of the temporal signals by detecting the seasonal tendency.
Annual layer counting of the isotopic and ionic species with PC 1 and PC 2 scores, starting from the year of drilling (2014). The Cl–, Mg2+ and K+ are not shown in the figure because these are similar to Na+ (r > 0.99), but the ratio of Cl–/Na+ is shown. Non-sea-salt portions are indicated for Ca2+. The raw values (wide line) of δ18O, δD and MSA shown with standardized profile in thin line. Enrichment factor (EF) of nssSO42– was shown in black line and horizontal red line indicates the average nssSO42–. Brown shading represents depth range to increased nssSO42– which indicate the period of Pinatubo and Cerro Hudson volcanic signals.

The age determination was based on the seasonal peaks of δ18O (δ18O preferred and the correlation to δD is 0.99) with MSA and nssSO42– (e.g. Udisti and others, Reference Udisti1996; Kwak and others, Reference Kwak2015; Caiazzo and others, Reference Caiazzo2016), starting from the year of the drilling. The elevated values of δ18O identified as midsummer (1 January) (e.g. Markle and others, Reference Markle, Bertler, Sinclair and Sneed2012; Rhodes and others, Reference Rhodes2012; Tuohy and others, Reference Tuohy2015). Also, the age scale was adjusted with nssSO42 signal of Pinatubo and Cerro Hudson volcanic eruption. The age for each sample was determined by the linear interpolation between subsequent two peaks. The number of samples per year ranged between 4 and 14 (averagely nine samples) and the annual accumulation rate was estimated in adjusted water-equivalent by multiplying its density.
Three stages of densification have been identified which reach 550, 820–840 and 917 kg m−3 in the first, second and third stages, respectively (Benson, Reference Benson1962; Anderson and Benson, Reference Anderson and Benson1963; Herron and Langway, Reference Herron and Langway1980). The density of the firn core (<500 kg m−3) is lower than the critical density of 550 kg m–3, thus only the first stage of the densification was considered. Within this stage, the firn becomes denser rapidly by the processes of grain-boundary sliding and grain growth due to the overlying weight of snow layers and the changes in temperature affects the densification rate (Herron and Langway, Reference Herron and Langway1980). In the firn densification model 1 (M1) (Herron and Langway, Reference Herron and Langway1980) and model 2 (M2) (Morris, Reference Morris2018), the annual mean temperature of −32.5°C at 15 m borehole measurement was used (Yang and others, Reference Yang2018). Age–depth calculation was performed with the mean accumulation rate of 150 kg m–2 a–1 which can be averaged from our annual layer counting (excluded a low value in 2014). The M2 used the different transition density and scaling factor from the M1, which allowed modeling a smooth transition between the densification stages 1 and 2. The age scale by the annual layer counting was compared to the model results.
The forecast data (hourly average) of the precipitation (precipitation = total precipitation − evaporation) by the ERA-Interim reanalysis dataset produced by the European Centre for Medium-Range Weather Forecasts (ECMWF) in the nearest (~4 km) gridpoint (73°52.30′ S, 163°37.30′ E) to the study area were selected and compared to our estimated snow accumulation rates (Dee and others, Reference Dee2011). We also compared the annual mean isotopic composition (δ18O) with the instrumental temperature record from automatic weather station (Lola AWS), which locates ~40 km south of the site (http://www.climantartide.it) and 2–m temperature data from ERA-Interim reanalysis (Dee and others, Reference Dee2011), and SIE (Parkinson and Cavalieri, Reference Parkinson and Cavalieri2012; Data archive at National Snow and Ice Data Center).
3. Results and discussion
3.1. Temporal variations of the isotopes and ionic species
The fluctuations in the concentrations of the ionic species with depth (depth is in snow depth) (Fig. 2) and the descriptive statistical parameters are displayed (Table 1). Strong positive correlations (r) were observed between Na+ and other ionic species (r > 0.9 for K+, Mg2+, Cl–, SO42–, and r = 0.5 for Ca2+, n = 197, p < 0.001). These species are the main components of sea-salt aerosols, which originated from the surrounding oceanic source (Piccardi and others, Reference Piccardi, Udisti and Casella1994; Traversi and others, Reference Traversi2004). The mean values of nss fractions of ionic species, including K+ (19.2%), Mg2+ (19.1%) and Cl– (25.1%) were lower than the Ca2+ (74.0%) and SO42– (65.5%) (Table 1). The ion distributions were roughly right-skewed, related to the inconsistent increased sea-salt aerosols. An abrupt increase was noticed in the ionic concentrations, including Na+, K+, Mg2+, Ca2+, Cl– and SO42–, at a depth of 6.47 m. The highest fraction of sea-sourced Ca2+ (~99.9%) and the ratio of Cl– to Na+ (1.86), which is similar to the theoretical ratio of sea water (Pilson), observed at this depth, indicating the abnormal sea-salt aerosol input.
Summary of statistics of water stable isotopes in ‰ (n = 227) and chemical species in μg L–1 (n = 197) in the firn core

a Assumed to be solely originated from sea spray.
PCA was performed on the isotopic (δ18O, δD and d-excess) and ionic (Na+, K+, Mg2+, Ca2+, MSA, Cl–, ssSO42– and nssSO42–) values for same depth resolution of the firn core (n = 197). Principal component (PC) 1 explained 49.52% of the total variance with the strong loadings of the positively correlated sea-salt ions including Na+, K+, Mg2+, Ca2+, Cl– and ssSO42– (Table 2). This result highlights the dominant contribution of the oceanic source in line with other studies (Kwak and others, Reference Kwak2015). The second principal component (PC 2) has high loadings of δ18O, δD, nssSO42– and MSA, accounting for 23.14% of the total variance and indicates the identical seasonal nature of these variables. PC 1, PC 2 and PC 3 captured 81.52% of the total variance (Table 2), including 8.86% from PC 3 with high loading of d-excess. PCA classified the variables into species representing an input of sea-salt aerosol (PC 1) and species signing the seasonal cycle, related to the high temperature (PC 2). PC 2 score suggests the potential seasonal markers including δ18O, δD, nssSO42– and MSA (e.g. Stenni and others, Reference Stenni2000; Kwak and others, Reference Kwak2015).
Loadings of 11 variables for first three principal components (PC) in the firn core with larger values highlighted in bold

3.1.1. Temporal variations of stable isotopic composition
The δ18O, δD and d-excess with the increasing depth were presented in Figure 2. The δ18O (δD) values (n = 227) ranged from −43.13‰ (−340.6‰) to −26.70‰ (−205.2‰), with a mean value of −34.92‰ (−273.1‰), which were analogous to other records on the Styx Glacier (Stenni and others, Reference Stenni1999; Kwak and others, Reference Kwak2015). Moreover, mean δ18O averaged from database, compiled in Masson-Delmotte and others (Reference Masson-Delmotte2008), showed similar values of −30.19‰ in the coastal Antarctic sites (~40–80 km from coast) and −30.91‰ in the sites, located in the elevation range between 1400 and 1800 m a.s.l. The isotopic compositions revealed maximum (summer) and minimum (winter) values with a distinct seasonal bias. Summer peak values (assumed as January) of δ18O (δD) ranged between −36.50‰ (−287.2‰) and −27.22‰ (−210.9‰), respectively. There was not a clear increasing or decreasing trend in δ18O (δD) in the whole record down to 8.84 m (Fig. 2). The seasonal pattern of δ18O (δD) was used for stratigraphic dating with the assumption of less post-depositional effects due to the relatively high accumulation rate (e.g. Stenni and others, Reference Stenni2000; Kwak and others, Reference Kwak2015; Furukawa and others, Reference Furukawa2017).
The linear relationship between δ18O and δD appeared with a slope of 8.06 (δD = 8.06 × δ18O + 8.56, R 2 = 0.99, n = 227, p < 0.001), which is fairly consistent with the GMWL (δD = 8 × δ18O + 10) (Dansgaard, Reference Dansgaard1964). Masson-Delmotte and others (Reference Masson-Delmotte2008) reported a meteoric waterline (δD = 7.75 × δ18O − 4.93, R 2 = 0.98, n = 789) at the continental scale, which is slightly different to our estimate. This negligible alteration of the slope leads us to assume that the accumulated snow layers are fairly well preserving the precipitation isotopic content with less influences by post-depositional processes, including temperature gradient metamorphism (Lee and others, Reference Lee2010), diffusion process (Johnsen and others, Reference Johnsen2000) and sublimation (e.g. Steen-Larsen and others, Reference Steen-Larsen2014).
The slope in summer (8.91) was larger with higher d-excess values than those in a winter period (7.99). Moreover, the less variation in the seasonal cycle of d-excess (mean value of 6.28 ± 1.77‰) values signify the dominant moisture transport from the neighboring stationary ocean source (e.g. Jouzel and Merlivat, Reference Jouzel and Merlivat1984; Jouzel and others, Reference Jouzel2007; Fujita and Abe, Reference Fujita and Abe2006). Although the distribution of d-excess differed from the oscillations of δ18O and δD, the relative consistency in the variation is likely to be linked to the dominant contribution of the steady marine source and local transport of the precipitation (Delmotte and others, Reference Delmotte, Masson, Jouzel and Morgan2000). It is because the variation of the sea surface temperature, relative humidity and wind speed at the moisture source region strongly control the variations of d-excess (Merlivat and Jouzel, Reference Merlivat and Jouzel1979). Stenni and others (Reference Stenni2000) suggested the main influences are originated from the Pacific Ocean sector and the Ross Sea.
3.1.2. Temporal variations of ionic compositions
The sea-salt (process of bubble bursting and wind blowing on the wave crests on open-water and ice-covered area) and oceanic biogenic activities are considered as two major sources of ionic species in the coastal Antarctic firn cores (e.g. Delmas and others, Reference Delmas, Kirchner, Palais and Petit1992; Wagenbach and others, Reference Wagenbach, Legrand, Fischer, Pichlmayer and Wolff1998; Kreutz and Mayewski, Reference Kreutz and Mayewski1999; Benassai and others, Reference Benassai2005). Higher concentrations of sea-salt aerosols (e.g. Na+, Mg2+, K+, Ca2+, Cl– and ssSO42–) are observed in the winter layer, related to the thin layer of sea-salt-enriched crystal formed above sea ice and its movement with blowing snow (Rankin and other, Reference Rankin, Auld and Wolff2000; Abram and others, Reference Abram, Mulvaney, Wolff and Mudelsee2007; Jiayue and others, Reference Jiayue and Lyatt2017; Vega and others, Reference Vega2018), which is larger than those transported from open sea during warm periods. Coupled with high cyclonic activities in the Ross Sea, mineral dusts (partial of K+, Mg2+ and Ca2+) showed an enhancement in spring and summer in northern Victoria Land (e.g. Caiazzo and others, Reference Caiazzo2017). This relates to the input from local ice-free areas as well as long-range transport from South America (Kreutz and others, Reference Kreutz and Mayewski1999). Na+ is a more reliable proxy for sea-spray aerosol due to the absence of extra sources, particularly in coastal regions, and the steady concentration during transport and preservation without fractionation (Traversi and others, Reference Traversi2004).
In the firn core, Na+ show increase in some winter period which may be associated with the high concentrations of sea-salt aerosols induced by the changes in sea ice and the intensive winter storm events, moving sea-salt aerosols (Brimblecombe, Reference Brimblecombe1996; Udisti and others, Reference Udisti, Traversi, Becagli and Piccardi1998; Rankin and others, Reference Rankin, Auld and Wolff2000; Stenni and others, Reference Stenni2000). According to the wind data from the Lola AWS (1990–2014), the higher velocities >30 m s−1 were observed mostly in late autumn to early spring (69% of total counts) and highest frequencies occurred in winter (between June and September) with 50.4% of the total counts. Moreover, the western and southwestern winds were dominant in these data, suggesting the air masses originated from ocean. However, the Na+ concentration peaks as well as K+ and Mg2+ were not consistent with all case in winter values (Fig. 2). It may indicate the event-based distribution relating to variability of atmospheric pressure pattern (e.g. Tuohy and others, Reference Tuohy2015). The slope between the Na+ and Cl– ([Cl–] = 1.846 × [Na+] + 23.47, R 2 = 0.99, n = 197, p < 0.001) was similar to the ratio in sea water (1.81), which represents the dominant contribution of the oceanic source (Traversi and others, Reference Traversi2004). However, with this intercept of 23.47 and the Cl–/Na+ ratio for each sample for each depth was larger than the sea-water ratio of 1.81 indicate the additional source for Cl– (Benassai and others, Reference Benassai2005). Due to this inconsistent distribution trend of the sea-salt aerosols, we were not able to use them as time markers for age dating.
Shifts in the distribution of Ca2+ ions suggest contribution from various sources in this area. The average value of the nss fraction of Ca2+ is 74.0%, indicating the less dominantly sourced from sea spray. Other sources are considered as a crustal dust input to the total budget of Ca2+ (Fig. 2). Although, the high concentration of nssCa2+ could indicate the spring and summer season due to the mesoscale cyclonic activities (Caiazzo and others, Reference Caiazzo2017) and generally lithophile elements are influenced by the wind events in the Ross Sea region (Rhodes and others, Reference Rhodes2012). Our result shows no distinguishable seasonal pattern for Ca2+, which thus cannot be used for age determination of the firn core.
Because the site is near to coast, nssSO42– is mainly derived from the marine biogenic activity (oxidation of dimethylsulfide [DMS] emitted from marine algae and phytoplankton) and partially from crustal erosion, and volcanic emissions (Handler, Reference Handler1989; Delmas and others, Reference Delmas, Kirchner, Palais and Petit1992). Moreover, the spikes in nssSO42– indicate the timing of volcanic eruption in polar ice cores (e.g. Legrand and Mayewski, Reference Legrand and Mayewski1997; Cole-Dai and others, Reference Cole-Dai, Mosley-Thompson and Qin1999). Together with the increased MSA, which was solely from marine biogenic activity, the values of nssSO42– and MSA illustrate noticeable signal of spring and summer snow layers in the northern Victoria Land (e.g. Legrand and others, Reference Legrand, Feniet-Saigne, Saltzman and Germain1992; Udisti and others, Reference Udisti, Traversi, Becagli and Piccardi1998; Saltzman and others, Reference Saltzman, Dioumaeva and Finley2006; Rhodes and others, Reference Rhodes2012; Becagli and others, Reference Becagli2016). The MSA and nssSO42– are observed with a similar concentration range to other studies (Stenni and others, Reference Stenni2000) and the maximum values are slightly differed from each other (Fig. 2). This discrepancy is likely to be linked to the distinct characteristic of the photochemical oxidation rate (Preunkert and others, Reference Preunkert2008) and difference in the size and movement trajectory of them even both enhanced during the spring/summer period (Becagli and others, Reference Becagli2012). The MSA record reveals the weak correlation with nssSO42– (r = 0.34, p < 0.001, n = 197). The culmination values of nssSO42– and MSA were detected mostly in the late spring/summer before the summer maximum of δ18O associated with the enrichment of marine biogenic activity with a presence of open-water area (Fig. 2) (e.g. Udisti and others, Reference Udisti, Traversi, Becagli and Piccardi1998; Reference Udisti1999; Stenni and others, Reference Stenni2000; Kwak and others, Reference Kwak2015). The spring/summer elevated values matched with the earlier studies (e.g. Whitlow and others, Reference Whitlow, Mayewski and Dibb1992; Stenni and others, Reference Stenni2000; Caiazzo and others, Reference Caiazzo2016).
The negative values of nssSO42–, which are principally observed in coastal/low-latitude areas and detected at depths of 6.29 and 8.52 m in the firn core, is likely to be the winter high sea-spray content (Piccardi and others, Reference Piccardi, Becagli, Traversi and Udisti1996; Udisti and others, Reference Udisti, Traversi, Becagli and Piccardi1998). The nssSO42– concentration reached a maximum value of 523.0 μg L–1 at a depth of 8.04 m with relatively higher concentrations at the subsequent depth intervals (8.07–8.15 m), compared to the mean concentration of 48.5 μg L–1. Moreover, this increasing trend with double peaks continues to the depth of 7.17 m with a relatively higher concentration of nssSO42– and the higher enrichment factor of SO42– (Fig. 2).
We have assumed that the peak values at this depth range to be sourced from a volcanic eruption that occurred in 1991 (Stenni and others, Reference Stenni2002; Karlöf and others, Reference Karlöf2005; Nardin and others, Reference Nardin2020). The Pinatubo eruption (June 1991, Philippines, 15°08′ N, 73°00′ E) released 18 ± 2 Mt SO2 (Cole-Dai and others, Reference Cole-Dai, Mosley-Thompson and Qin1999) and Cerro Hudson eruption (August 1991, Chile, 45°55′ S, 73°00′ W) (Legrand and Wagenbach, Reference Legrand and Wagenbach1999) injected 2 Mt of SO2 into the atmosphere (Doiron and others, Reference Doiron, Bluth, Schnetzler, Krueger and Walter1991). In the previous studies, the Cerro Hudson plume was centered over the South pole in September 1991 and Pinatubo plume was indicated in November 1991 (Cacciani and others, Reference Cacciani, Girolamo, di Sarra, Fiocco and Fu1993; Saxena and others, Reference Saxena, Anderson and Lin1995). The annual layer counting revealed that the depth of the higher concentrations of nssSO42– (particularly at 7.61–7.84 m) corresponds to late-1992 to early-1994. This is sufficiently consistent with other studies, showing that the aerosol mass of Pinatubo spread in mid-1992 and late-August or early-September of 1992 (Trepte and others, Reference Trepte, Veiga and McCormick1993; Hitchman and others, Reference Hitchman, McKay and Trepte1994; Cole-Dai and others, Reference Cole-Dai, Mosley-Thompson and Qin1999; Severi and others, Reference Severi2009). Meanwhile, the depth range of 8.04–8.15 m with the sharp sulfate peak (late-1991 to early-1992) is likely to represent the volcanic aerosol input from the Cerro Hudson with the early detection associated with the relatively near distance to the site (e.g. Cole-Dai and others, Reference Cole-Dai, Mosley-Thompson and Qin1999; Karlöf and others, Reference Karlöf2005). This separate detection of two volcanic events was also observed in other sites (Cole-Dai and others, Reference Cole-Dai, Mosley-Thompson and Qin1999; Stenni and others, Reference Stenni2002; Karlöf and others, Reference Karlöf2005; Nardin and others, Reference Nardin2020) however there are some cases of single detection of only Pinatubo eruption (smooth peak) even in the site from northern Victoria Land (e.g. Severi and others, Reference Severi2009). Thus, this result suggests the potential of the firn cores in this site to recover high-resolution records. Despite the potential local inputs from Mount Erebus (>300 km far from the Styx Glacier) and Mount Melbourne volcano (~40 km distance from the Styx Glacier), from this point of view, our findings confirm the notable nssSO42– value indicate volcanic signals as well as a seasonal indicator (spring/summer) with MSA for dating purposes.
3.4. Dating and accumulation rate
The annual signals of peak values (δ18O) with MSA and nssSO42– were observed in every 0.34 m (averagely eight samples per year for isotopic profile) in snow depth and suggest a 25-year record (1990–2014). The nssSO42– of the volcanic events (Pinatubo and Cerro Hudson) in 1991 was recognized in the time period between 1991 and 1994 in the dating scale. The dating difference is due to the transportation time of the volcanic gas to the high latitude sites in Antarctica (Legrand and Mayewski, Reference Legrand and Mayewski1997).
The density of the firn core ranged between 330 and 500 kg m–3 with increasing trend as depth increases. The annual mean accumulation rate was calculated by multiplying the snow density and was estimated to be 146 ± 60 kg m–2 a–1 (mean value ± std dev.) during the period of 1990 to 2014. The depth–age relationship by the layer counting method was plotted together with the densification model results in Figure 3. To compare the age by annual layering method with the densification model, the depth values of the annual layering was converted to the same values of the models. Our estimate of annual mean accumulation rate is reasonable because there was an average value of 1.6- and 0.8-years difference with M1 and M2 (n = 22), respectively. Our estimate on annual mean snow accumulation is closer to the model-based estimation of 130 kg m–2 a–1 (Han and others, Reference Han2015) and comparable to other quantities of accumulation rate on Styx Glacier having values of 160, 203 and 226 kg m–2 a–1 (Udisti, Reference Udisti1996; Stenni and others, Reference Stenni2000; Kwak and others, Reference Kwak2015) (Table 3). Although the mean precipitation rate from ERA-Interim reanalysis (154 ± 37 kg m–2 a–1) is similar to our estimated value (local estimate), the temporal variation of snow accumulation during the corresponding period was different (Fig. 4). This inconsistency in the annual accumulation rate can be resulted by the post-depositional effects, including mainly by the wind-driven snow redistribution and partially by the no existence of precipitation, surface and snowdrift sublimation in snow layers (Fig. 4) (e.g. Frezzotti and others, Reference Frezzotti2004; Karlöf and others, Reference Karlöf2005; Sinclair and others, Reference Sinclair, Bertler and Trompetter2010; Rhodes and others, Reference Rhodes2012), and the influence by the temperature change, regime of precipitation and changes in cyclonic systems (e.g. frequency, path, timing and strength) (Kreutz and others, Reference Kreutz2000; Goodwin and others, Reference Goodwin, de Angelis, Pook and Young2003; Kaspari and others, Reference Kaspari2004). Jang and others (Reference Jang2019) have mentioned that the strong wind effect (as blizzards) could have induced the large variation in density of snow in the Styx Glacier.
The comparison of the depth–age relationship of the annual layer counting and the firn densification models.

Comparison of annual accumulation rate (Styx-B firn core, ERA-Interim, Stenni and others, Reference Stenni2000), annual mean δ18O, standardized annual flux of MSA and nssSO42−, SIE during cold period (JJASON) and temperature record from Lola AWS and ERA-Interim reanalysis data. The linear trendlines shown for annual accumulation rate (Styx-B firn core for the period of 1990–2014 together with Stenni and others (Reference Stenni2000) up to 1971 from 1990) and trend of SIE between 1979 and 2014.

Mean accumulation rates estimated near to the Styx Glacier for comparison to the firn core

Stenni and others (Reference Stenni2000) reported the annual accumulation range of 111–335 kg m–2 a–1 for the period between 1971 and 1990 and this estimation is plotted together with the firn core (Fig. 4). There is an overall decreasing trend in accumulation rate in our estimate (r = −0.53, p < 0.001, n = 25). The accumulation profile was expanded with Stenni and others (Reference Stenni2000) (r = −0.56, p < 0.001, n = 45). The highest (>200 kg m–2 a–1) annual accumulation rate was observed in years 1992, 1995, 1996, 1999, 2002 to 2004, while the three lowest annual accumulation rates occurred during 2012–2014. Stenni and others (Reference Stenni2000) highlighted that there was an important role of the Ross Sea SIE on the snow precipitation in northern Victoria Land. The mean SIE in the Ross Sea region during cold period (months between June and November [JJASON]) shows a weak negative correlation with both the snow accumulation rate (r = –0.41, p < 0.01, n = 25) and an annual mean δ18O (r = −0.32, p < 0.05, n = 25) of the firn core.
A negative correlation between d-excess and SIE was observed with a correlation coefficient of −0.53 between d-excess record of the WhiteHall Glacier site and SIE of the Ross Sea (Sinclair and others, Reference Sinclair, Bertler, Bowen and Arrigo2014). However, we find a weaker correlation between our d-excess and the SIE (r = −0.21, p < 0.01, n = 25) as well as a weak negative correlation of SIE with the annual flux of MSA (r = −0.51, p < 0.01, n = 25) and nssSO42– (r = −0.39, p < 0.01, n = 25), while the annual flux of Na+ does not show significant correlation (Fig. 4). It can be explained by single strong source of open-water area for the emission of DMS to the concentrations of MSA and nssSO42– (e.g. Rhodes and others, Reference Rhodes2009; Sinclair and others, Reference Sinclair, Bertler, Bowen and Arrigo2014). While several enhancing factors (may likely to individual storm events) rather than only SIE was assumed for the Na+ concentration in the firn core. The increasing (trend) of SIE during the period of 1990 to 2014 in the Ross sea region and evidence in ice core from WhiteHall Glacier (Sinclair and others, Reference Sinclair, Bertler, Bowen and Arrigo2014) and decreasing precipitation from the firn core is likely to be coupled with the positive trend of Southern Annular Mode (Marshall and others, Reference Marshall2018) and deepening of Amundsen Sea Low pressure and its location (Hosking and others, Reference Hosking, Orr, Marshall, Turner and Phillips2013; Sinclair and others, Reference Sinclair, Bertler, Bowen and Arrigo2014), which enhances westerly winds and the cooling of air temperature (−0.55 ± 0.97°C/100 a–1) in the northern Victoria Land coast (Stenni and others, Reference Stenni2017; Yang and others, Reference Yang2018).
With respect to the conventional correlation of annual mean values of isotopic ratio and air temperature (T − δ18O) (Dansgaard, Reference Dansgaard1964; Petit and others, Reference Petit1999), the isotopic composition of the firn core does not quantitatively represent this relationship with temperature record of both Lola AWS and ERA-Interim due to the alteration of seasonality of δ18O with increasing depth and coupled influencing factors (Fig. 4). Annual mean δ18O (δD) fluctuated between −40.65‰ (−320.9‰) and −30.24‰ (−236.1‰) with a mean of −34.96‰ (−273.6‰) and std dev. of 2.17‰ (17.68‰), while the atmospheric temperature measured at the nearest Lola AWS was less variated (ranged between −23.41 and −18.83°C with the mean of −22.44°C and std dev. of 1.02°C). Stenni and others (Reference Stenni2000) compiled the annual mean temperature (both AWS and borehole temperature measurement) and mean δ18O values from other firn cores in northern Victoria Land and suggests a slope of 0.81‰ °C–1 (r = 0.9). Slightly different slopes of 0.44‰ °C–1 (van Ommen and Morgan, Reference van Ommen and Morgan1997), 0.60‰ °C–1 (Stenni and others, Reference Stenni2002) and 0.62‰ °C–1 (Sinclair and others, Reference Sinclair, Bertler and van Ommen2012) were reported in East Antarctic sites. Moreover, Stenni and others (Reference Stenni2017) reported a slope of 1.05‰ °C–1 in East Antarctic Plateau and 1.21‰ °C–1 in Victoria Land coast by model simulation.
In our study, the gradients of 1.07 and 1.20‰ °C–1 were found by comparing mean δ18O value (−34.96‰) with borehole temperature (−32.5°C) and mean annual temperature from ERA-Interim (−29.07°C), respectively. Large difference in mean temperature recorded in the Lola AWS (−22.44°C) compared to the estimates in borehole and ERA-Interim suggests the importance of a reliable instrumental records. The various factors including changes in evaporation conditions, transport pathway, and changes in precipitation seasonality (Werner and others, Reference Werner, Jouzel, Masson-Delmotte and Lohmann2018) and post-depositional processes (Sinclair and others, Reference Sinclair, Bertler and Trompetter2010; Rhodes and others, Reference Rhodes2012; Goursaud and others, Reference Goursaud2017; Casado and others, Reference Casado2018) need to be considered to this high-resolution firn core record. Moreover, there are studies that reported a weak or no correlation between annual mean temperature and δ18O in the coastal Antarctic sites (Bertler and others, Reference Bertler, Mayewski and Carter2011, Reference Bertler2018; Goursaud and others, Reference Goursaud2019). Goursaud and others (Reference Goursaud, Masson-Delmotte, Favier, Orsi and Werner2018) suggested challenges to obtain a correlation between annual mean temperature and δ18O by the ECHAM5-wiso simulation during the period between 1979 and 2013. With the consideration of short-temporal data for comparison, at this stage the isotopic and ionic species (MSA and nssSO42–) of the firn core are likely to preserve the sign of oceanic environment. This study can be applied for the interpretation of the longer ice core drilled at the same site which is being in analysis.
4. Summary
The chronology of the firn core from Styx Glacier in northern Victoria Land, Antarctica was studied through the temporal variations of its isotopic and ionic compositions to estimate the snow accumulation rate. The seasonal variations of δ18O, MSA and nssSO42– which represent the ocean-sourced precipitation and reference horizon of volcanic sulfate signal were used to identify the age of the firn core. The 25 annual signals spanning back from 1990 to 2014 were measured with a mean accumulation rate of 146 ± 60 kg m−2 a−1. A decreasing trend of the accumulation was observed through the profile. The annual mean accumulation rate and δ18O, flux of MSA and nssSO42– were shown to be correlated with sea-ice extent (JJASON) in the Ross Sea region. Although the records are short, at this stage this site is likely to preserve the changes in oceanic environment which also can be confirmed in the long ice core. This study will be useful for the interpretation of long ice core drilled at the same site.
Acknowledgements
This study was supported by the Basic Science Research Program through the National Research Foundation of Korea (NRF) funded by the Ministry of Education (2017R1D1A1A09000732) and KOPRI research grant (PE20190). We thank Dr. Elizabeth Morris for sharing the results of firn densification models and comments on the manuscript. We are also grateful to the Italian PNRA (Programma Nazionale di Ricerche in Antartide) project for providing meteorological data from Lola AWS (http://www.climantartide.it) and the ERA-Interim dataset from the ECMWF. We appreciate the scientific editor and two anonymous reviewers, whose comments led to significant improvements.


 Open access