


1. Introduction
Continental crust has evolved in space and time through magmatic emplacement under different tectonic settings. The subduction of the oceanic lithospheric plate below a continental or oceanic lithosphere produces a great quantity of magma at continental or oceanic-arc tectonic settings. Continuous subduction of the oceanic plate leads to the collision between island-arc and continent or between continent and continent, and the subsequent thickening of crust. The resulting sutures are characterized by abundant intrusion of granitoid magma. The syn-collisional tectonic setting is characterized by folding–thrusting and thickening of the sediment pile in a compressional regime due to the subduction of the lithospheric plate. According to England & Thompson (Reference England and Thompson1984), crustal thickening during the collisional stage does not supply the appropriate amount of heat for widespread melting and generation of granitoid rocks. During the post-collisional stage, the profuse melting of crustal material is possible due to thermal relaxation (England & Richardson, Reference England and Richardson1977). As a result, temporal changes in composition and characters of the granitoid rocks are noticed from subduction-related granitoids to post-collisional granitoids. While subduction-related and syn-collisional granitoids are predominantly represented by large calc-alkaline tonalitic to granodioritic batholiths, post-collisional granitoids are dominantly alkaline monzogranite to granodiorite, typically smaller in size and linear in shape, and generally emplaced along ductile shear zones.
The Satpura Orogenic Belt in Central India (Holmes, Reference Holmes1955; Krishnan, Reference Krishnan1961) is c. 1500 km long, nearly E–W- to ENE–WSW–trending, and comprises three domains, that is, the composite Mahakoshal and Sausar Mobile Belts to the west, the composite North Singhbhum Mobile Belt (NSMB) and Chhotanagpur Gneissic Complex (CGC) in the central part, and the Shillong Plateau Gneissic Complex (SPGC) to the east (Fig. 1a). The Satpura Orogenic Belt is interpreted as a collisional orogen marking the Grenvillian amalgamation of the South and North Indian blocks (e.g. Radhakrishna, Reference Radhakrishna1989; Acharyya, Reference Acharyya2003; Naganjaneyulu & Santosh, Reference Naganjaneyulu and Santosh2010; Bhowmik et al. Reference Bhowmik, Wilde, Bhandari, Pal and Pant2012; Goswami & Bhattacharyya, Reference Goswami and Bhattacharyya2014).
(a) The disposition of the major cratonic blocks and tectonic elements within Peninsular India are shown (modified after Naganjaneyulu & Santosh, Reference Naganjaneyulu and Santosh2010). AFB – Aravalli Fold Belt; BBG – Bhandara–Balaghat granulite; CGC – Chhotanagpur Gneissic Complex; EGB – Eastern Ghats Belt; NSMB – North Singhbhum Mobile Belt; SPGC – Shillong Plateau Gneissic Complex. Archaean cratons: BK – Bundelkhand; BS – Bhandara; KR – Karnataka, SB – Singhbhum. (b) Geological map of the Chhotanagpur Gneissic complex (modified after Mazumdar, Reference Mazumdar and Mukhopadhyay1988) with the study area at Jhalida (marked by the yellow rectangle) in the eastern part. SNNF – Son-Narmada North Fault; SNSF – Son-Narmada South Fault; BTF – Balarampur–Tattapani Fault; DVFS – Damodor Valley South Fault; SPSZ – South Purulia Shear Zone; SSZ – Singhbhum Shear Zone; EITZ – East Indian Tectonic Zone. (c) Geological map of a part of the North Purulia Shear Zone in the NW Purulia district (modified after GSI). The studied area is highlighted by the black rectangle. (d) Geological map in and around Jhalida, Purulia district, West Bengal, India.

Many late Grenvillian (1.1–0.9 Ga) elongated plutons of porphyritic granitoids occur parallel to the southern margin of the CGC (Fig. 1b). The extensive occurrences of potassic porphyritic granitoids within the migmatitic complex of the CGC attracted the attention of many workers, and suggested their late tectonic emplacement (Sen, Reference Sen1956; Sengupta & Sarkar, Reference Sengupta and Sarkar1964, Reference Sengupta and Sarkar1968; Mazumdar, Reference Mazumdar and Mukhopadhyay1988; Goswami & Bhattacharyya, Reference Goswami and Bhattacharyya2014). Recently, Goswami et al. (Reference Goswami, Roy, Basak, Das and Bhattacharyya2018) discussed the physicochemical conditions of crystallization of four calc-alkaline plutons, all lying on the EW- to ENE–WSW-trending North Purulia Shear Zone (NPSZ) in Purulia district, West Bengal. Among these plutons, the porphyritic granitoid batholith of Raghunathpur is well-studied and is suggested to be emplaced in a post-collisional tectonic setting (Goswami & Bhattacharyya, Reference Goswami and Bhattacharyya2014) at c. 998 ± 10 Ma (Reference Chakraborty, Ray, Chatterjee, Deb and DasChakraborty et al. 2019a). A suite of mafic and ultramafic rocks occurring as mafic magmatic xenoliths, sills and dykes are related spatially and temporally to the host porphyritic granitoids of Raghunathpur (Das et al. Reference Das, Goswami and Bhattacharyya2020). The post-collisional granitoids are principally crustal-derived, with or without contributions from mantle melt (Winter, Reference Winter2001; Wang et al. Reference Wang, Chen, Xu and Wang2014), particularly incompatible elements enriched sub-continental lithospheric mantle-derived melts (Goodenough et al. Reference Goodenough, Thomas, De Waele, Key, Schofield, Bauer, Tucker, Rafahatelo, Rabarimanana, Ralison and Randriamananjara2010). Nevertheless, the petrogenetic modelling of granitoids in post-collisional settings is challenging because these rocks originated through complex thermal and magmatic processes and were emplaced within a highly deformed and compositionally diverse continental crust.
The Jhalida granitoid pluton lying in the western part of NPSZ (Fig. 1c, d) is a porphyritic granititoid that has been emplaced late-tectonically with respect to the regional deformation (Sengupta & Sarkar, Reference Sengupta and Sarkar1968). Although texturally the porphyritic granitoids of Jhalida and that of Raghunathpur are very similar, the latter contains numerous mafic microgranular enclaves and coeval mafic and ultramafic igneous intrusions (Das et al. Reference Das, Goswami and Bhattacharyya2020). In contrast, Jhalida pluton contains numerous xenoliths, including metasomatically altered mafic schists. The objectives of this study are to describe the petrography, mineral chemistry and petrochemistry of Jhalida porphyritic granitoid pluton, and hence draw conclusions on the petrogenetic evolution and tectonic setting of emplacement. Our study will help to understand the lithospheric evolution of the CGC during the later stages of the Satpura Orogeny.
2. Geological setting
The Proterozoic CGC, which is regarded as part of the Satpura Orogenic Belt (Holmes, Reference Holmes1955), is an E–W-trending belt covering about 100 000 km2 in the eastern Indian shield (Fig. 1a, b). The Proterozoic NSMB borders the southern margin of the CGC along a tectonic boundary designated as the South Purulia Shear Zone. The Gondwana Supergroup separates the western boundary of the CGC from the Sausar Mobile Belt of Central India. The CGC is dominantly composed of migmatites and granitoid gneisses, with enclaves of high-grade metamorphic rocks and younger felsic to mafic and ultramafic intrusive bodies.
The NPSZ, a major lineament of the CGC, can be traced from Saltora (West Bengal) in the east of CGC by about 370 km SW to Kunkuri, Chattisgarh (Fig. 1b; also see the sketch map of Acharyya, Reference Acharyya2003). In West Bengal near Jhalida the width of the shear zone is about 10 km, and extends to 30 km near Saltora. The rocks within the NPSZ comprise mylonitic biotite granite with xenoliths of metasedimentary rocks (quartz-mica phyllonite, phyllonitic mica schist, calc-silicate gneiss, etc.) and metabasic rocks all belonging to the amphibolite- to granulite-facies. The porphyritic granitoids of Jhalida (8 × 3 km dimension) and other porphyritic granitoids within the shear zone (e.g. Goswami & Bhattacharyya, Reference Goswami and Bhattacharyya2014) show a textural gradation from the least-deformed porphyritic texture at the centre, through augen-bearing protomylonite and mylonite towards the periphery. The grade of metamorphism of rocks of this sinistral shear zone increases from amphibolite facies near Jhalida to granulite facies near Raghunathpur, located about 50 km ENE of Jhalida. Occasionally centimetre- to metre-scale veins of porphyritic granite is noticed within the country rocks. Moreover, large concordant xenoliths (40 × 5 m) of migmatitic biotite granite gneiss and amphibolites occur within the porphyritic granites. The broadly E–W elongation of the Jhalida pluton parallel to the trend of the NPSZ suggests control of this shear zone during emplacement (D’Lemos et al. Reference D’Lemos, Brown and Strachan1992; Goswami & Bhattacharyya, Reference Goswami and Bhattacharyya2014).
Three generations of deformations and related planar or linear fabrics have been recorded within the metasediments around Jhalida (Sengupta & Sarkar, Reference Sengupta and Sarkar1964, Reference Sengupta and Sarkar1968). The rootless first-generation (D1-folds) are tight to isoclinal and show axial planes, parallel to the regional E–W foliation (S1). Tight, overturned (overturned southern limb) and nearly non-plunging D2-folds have been formed by folding of the dominant and/or regional foliation (S1). The axial planar cleavage of D2-folds (S2) shows E–W to ENE–WSW strike with a moderate to high dip (45–80°) towards the north. The third phase of deformation (D3) has produced an E–W- to ENE–WSW-trending steeply dipping NPSZ. Baidya et al. (Reference Baidya, Chakraborty, Drubetskoy and Khilatova1987) determined the age of biotite as 870 ± 40 Ma from Jhalida porphyritic granitoids by the K–Ar method. Post-collisional Raghunathpur porphyritic granitoid batholith (Goswami & Bhattacharyya, Reference Goswami and Bhattacharyya2014) lying on the NPSZ is dated as 998 ± 10 Ma (U–Pb method of zircon; Chakrabarty et al. 2019a).
3. Materials and methods
We have collected samples from bald-headed domes and tors and flat-topped peneplaned exposures. The locations of samples selected for modal, chemical and electron-probe microanalyses (EPMA) are shown in Figure 1d. A total of 50 granitoids and 10 xenolith rock samples weighing a minimum of 5 kg each were collected from the Jhalida pluton. Out of these hand samples, thin-sections were prepared from 30 porphyritic granitoids, both undeformed and deformed, and 10 xenolith rocks. Modal analyses of 15 representative undeformed porphyritic granitoids and three representative xenolith samples were performed. Eight undeformed porphyritic granitoids and three xenolith rocks were sent for chemical analyses. Six samples of porphyritic granite and one sample of xenolith were chosen for EPMA.
3.a. Thin-section preparation and optical petrography
Billets of approximate size 25 × 45 × 15 mm were cut from fresh unweathered parts of the samples, using a water-cooled diamond blade. Billets were polished using 1000 mesh carborundum slurry and mounted with Araldite epoxy on a 27 × 47 mm standard petrographic glass slide. Excess sample material was removed using a thinner diamond blade, leaving < 1 mm on the glass slide, and mounted sections were lapped down to c. 35 µm thickness using a series of ever-finer carborundum and alundum slurry up to 2000 mesh. Section surfaces were finally polished with diamond pastes on cloth.
Prepared thin-sections were studied in a NIKON LV100 POL optical petrographic microscope using incident and transmitted plane- and cross-polarized light. Inclusion-free locations with pristine polish and perpendicular grain boundaries were identified for subsequent examination by EPMA.
Modal mineralogy was determined by point counting in thin-sections. A total of 1200 points arranged in a square imaginary grid were counted per section. Analytical uncertainty varies with relative abundance, from ±3 vol% for observed abundances below 50 vol% (i.e. 6%-relative) to 3 vol% for observed abundances below 5 vol%. Results given in Table 1 are rounded to the nearest integer. Mineral names are abbreviated after Whitney & Evans (Reference Whitney and Evans2010).
Mineral modes (vol%) for the porphyritic granitoids and xenolith suite of Jhalida pluton. Xenoliths: Type-a – Plagioclase–hornblende schist with minor biotite; Type-b – plagioclase–quartz–biotite schist with minor hornblende; Type-c – Plagioclase–quartz–biotite schist with no hornblende.

3.b. Mineral analyses by EPMA
Before the in situ assessment of mineral compositions by EPMA, polished sections were covered with c. 20 nm of coating of conductive carbon to reduce charging under the electron beam. EPMA of the representative minerals of six samples of porphyritic biotite granitoids was performed using a CAMECA SX Five instrument at the Department of Science and Technology, Science and Engineering Research Board National Facility, Department of Geology (Centre for Advanced Study), Institute of Science, Banaras Hindu University. Polished thin-sections are coated with a 20 nm layer of carbon for the analyses. The instrument was operated in high vacuum (< 5 × 10⁻⁶ Torr) at 15 kV and 10 nA, with beam diameter set to 1.0 μm. Natural and synthetic standards supplied by CAMECA-AMETEK were used.
Major-element oxide contents in wt% were recast into mineral compositions in atoms per formula unit (apfu) based on the number of oxygen atoms, following recommendations of Papike (Reference Papike1987, Reference Papike1988).
3.c. Whole-rock analysis
About 5 kg of sample material was comminuted in a steel-lined jawbreaker to < 0.5 mm. A subsample of < 50 g was obtained by manual cone-and-quartering of the crushed material, which was then pulverized in an agate-lined ring-and-puck swing mill to 200 mesh size. Next, powdered sample material was pressed into tablets using collapsible aluminum SPEC cap 031 mm placed in an evacuable steel pellet die, filled with wax with 8 ± 0.0001 g of rock powder evenly spread on top. The mixture was then placed into a pressing die and the sample was pressed at a pressure of 20 Torr for 20 seconds. The resulting pellet was then ready for X-ray fluorescence (XRF) analysis. Major-element concentrations for eight representative samples were determined by XRF at Presidency University, Kolkata using AXIOS of PANalytical Wavelength Dispersive X-ray fluorescence instrument with a flow scintillation detector. International certified reference material JG1a was run as an internal check standard. Analytical uncertainties were < 5%.
Major and trace elements of three more samples of the basic xenolith rocks are analysed with a WDXRF S8 Tiger (4 kW) from Bruker-AXS, Germany in the department of Earth Sciences, IISER, Kolkata. Elements were determined in pressed pellets. For pressed pellets, a mixture of sample and boric acid at a ratio of 1:4 was kept in an aluminium cup and a 15-ton pressure imposed for 20 seconds by hydrulic press. Certified reference material BHVO-2 was used to validate results. The error in major- and trace–element analysis by XRF was estimated as < 2% and 5%, respectively.
The concentrations of trace elements including rare earth elements (REE) of these eight representative samples were calculated by high-resolution inductively coupled plasma mass spectrometry (HR-ICP-MS) using a Perkin Elmer SCIEX ELAN DRC II instrument at the National Geophysical Research Institute, Hyderabad. The trace elements (including REE) were analysed by dissolving the sample powders followed by a closed vessel digestion method. For trace-element analyses, 0.05 g of fine powder sample (200 mesh) mixed with 10 mL of an acid mixture (7% HF: 3% HNO3) was taken in clean savillex and kept in a hot plate at about 150°C for not less than 48 hours. Following this, the savillex was opened and one drop of HClO4 was added. The savillex was then kept on the hot plate for evaporation at about 150°C for 1 hour until almost dry. The remaining residue was dissolved by adding 10 mL 1:1 HNO3. This solution was kept on a hot plate for 30–40 minutes at c. 80°C to dissolve all the suspended particles. Following this, the solution was transferred into a 250 mL flask and 10 mL 1:1 HNO3 and Rhodium were added. 103Rh was used as an internal standard. Millipore water was then added to top the volume up to 250 mL. Finally, the solution was stored in a polyethylene bottle. A 5 mL sample of this final solution was then taken and the volume was made up to 50 mL using Millipore water. This solution was stored in a clean Eppendorf tube for HR-ICP-MS analysis. International certified reference material JG1a was run as an internal check standard. The relative deviations were < 10%.
4. Results
4.a. Field relationships
The porphyritic granitoids of Jhalida pluton are coarse-grained and pink-coloured with strong preferred orientation of alkali feldspar megacrysts (Fig. 2a). The magmatic flow fabric in the porphyritic granitoids is also E–W-aligned. A gradual change from non-mylonitic rocks to intensely foliated mylonitized rocks with significant grain size reduction has been noticed in the shear zone (the NPSZ; Fig. 2b). However, rotations of porphyroclasts, pinch-and-swell structures and rare mantled porphyroclasts (Fig. 2c) have also been noticed in the shear zone. Deflections of magmatic foliation around the lenticular xenoliths suggest the flow of magma around solid objects (Fig. 2d). Random orientations of the megacrysts of feldspar are noticed frequently (Fig. 2e). The contacts between the porphyritic granitoids and the dark-coloured mafic xenoliths are irregular to cuspate. Neither the porphyritic granitoids nor the mafic xenoliths in contact show any chilled margin. The mafic xenoliths may be invaded by granite granitic material along the schistosity, giving rise to a gneissic look of the former. Gradually the dark amphibolite xenoliths are transformed into granitic rocks and the remnant of parent materials are preserved only as thin elongated strips, disappearing along their strike, and occur irregularly as trails of patches (Fig. 2d, e). A close examination of the contact region between the porphyritic granitoids and amphibolites shows the interfingering between them. Further, very near to the contact, the porphyritic granitoid is enriched with biotites; the enrichment of biotite defines the foliation trend. This suggests that at least some biotites in porphyritic granitoids have been derived from the highly biotitized mafic xenoliths. Veins of pink-coloured porphyritic granitoids frequently cross-cut the mafic xenoliths (Fig. 2f). The parent rock of the mafic xenolith is schistose amphibolite that has suffered a variable degree of K-metasomatism, leading to biotitization of the hornblendes and culminating in quartz-feldspar biotite schist. Such mafic xenoliths are metasomatized by the introduction of granitic material from the surrounding porphyritic granite, leading to the development of euhedral to subhedral grains of feldspar arranged in a criss-cross fashion (Fig. 2g). Sporadic megacrysts of K-feldspars may be noticed within the biotite-rich mafic xenoliths. In places, pegmatites occur as concordant or discordant veins in porphyritic granitoids (Fig. 2d). The presence of both magmatic and solid-state deformation features in porphyritic granitoids suggests that shearing was active during the emplacement of magma and overlasted the solidification of the magma.
Representative field photographs of the investigated Jhalida porphyritic granitoids. (a) The strong preferred orientation of the alkali feldspar megacrysts in the porphyritic granitoids. Note the presence of lensoid, rectangular (idiomorphic) and stressed elongate felsic minerals. Some of the alkali feldspar megacrysts in the upper part of the photograph show random orientation (see arrow) concerning the dominant foliation. (b) The gradual transition of mylonitized porphyritic granite to non-mylonitic porphyritic granite. Note that the mylonitic folia asymptotically meet at the boundary of the shear zone. (c) Medium-grade mylonite derived from porphyritic granite due to ductile shear. Note the strong preferred orientation of the porphyroclasts of feldspar. Also, note the mantled porphyroclast indicating the sinistral sense of shear. (d) The xenolith of partly biotitized schistose amphibolite in the porphyritic granitoids. Note the deflection of magmatic flow foliation of porphyritic granitoids around the xenolith. Also, note that a pegmatite vein occurs along the foliation. (e) The mafic xenolith of biotitized schistose amphibolite within pink-coloured porphyritic granitoids showing the cross-cutting relationship of the veins of surrounding granitic rocks in the mafic xenoliths. Note the incorporation of some megacrysts of feldspar within the dark xenoliths, but also the incorporation of thin xenolith layers within the porphyritic granitoids near the boundary region of the former. (f) The lenticular mafic xenolith of biotitized schistose amphibolite within pink-coloured porphyritic granitoids. Note the haphazard orientation of feldspar megacrysts. The thin branches of mafic xenolith into the porphyritic granitoid represent the undigested remnants. (g) Mafic lensoid xenolith in leucocratic porphyritic biotite granitoids. Note the criss-cross arrangement of euhedral to subhedral grains of feldspar within the mafic xenolith due to K-metasomatism (inset).

4.b. Petrography
4.b.1. Porphyritic granitoids
Most of the samples (n = 9) of Jhalida porphyritic granitoids (JPG) plot within the monzogranite field of the quartz – alkali feldspar – plagioclase (QAP) diagram, whereas three samples fall within in the syenogranite field and two in the granodiorite field (Fig. 3; Table 1).
Plots of mineral modal compositions (vol%) for the porphyritic granitoids of the Jhalida pluton in the QAP diagram (after Streckeisen, Reference Streckeisen1976).

A magmatic fabric is the characteristic of porphyritic granitoids that intensifies into a mylonitic fabric approaching the shear zone. The magmatic fabric in porphyritic granitoids is defined by the strong orientation of the elongation of rectangular feldspar megacrysts (Fig. 2a). The megacrysts are commonly microclines and less commonly plagioclase. The megacrysts of microcline are rarely microperthitic and may contain inclusions of finer grains of subhedral and sub-rounded slightly altered plagioclase (Fig. 4a). Plagioclases are invariably characterized by alteration to a greyish mass containing sericite needles, whereas microcline is relatively fresh. Apart from occurring as individual aggregates associated with microclines, plagioclase is present as inclusions of sub-rounded, much smaller grains within microcline commonly showing albite rims. Myrmekite has frequently developed at the contact between microcline and plagioclase. In places, thin lenticels of myrmekite have developed at the long contact of the two adjacent megacrysts of microcline (Fig. 4b). Occasionally thin vein-like myrmekite runs along the contact of coarse microclines. Tabular plagioclase in the groundmass is occasionally idiomorphic. Coarse anhedral quartz, generally mildly deformed, may contain inclusions of both subhedral microcline and sub-rounded plagioclase. In the groundmass, quartz occurs generally as both coarse and medium-sized anhedral grains and as rounded inclusion in feldspars. Biotites (pleochroic from straw yellow to dark brown) occur as thin impersistent layers, commonly forming clusters, and frequently diverge and converge around megacrysts of feldspars as already mentioned. Symplectitic intergrowth of thin to very thin lenticular quartz with coarse flakes of biotite may be present. Clusters of biotite, most of which are subparallel, warp around megacrystic feldspar (Fig. 4d). Accessory minerals such as fine-grained epidote-zoisite, apatite, and medium- to fine-grained sphene, allanite and opaque minerals are typically restricted to biotite-rich layers (Fig. 4e) with the occasional presence of fine-grained xenomorphic quartz within the clusters of biotite laths. This suggests a probability of formation of at least some biotites from Ca–Al-bearing ferromagnesian silicates, such as hornblende, by K-metasomatism related to the intrusion of porphyritic granitoid magma in the schistose amphibolite country rock (Fig. 2e, g). Sphene (weak but distinctly pleochroic from reddish-brown to almost colourless) occurs as aggregates of subhedral fine grains forming corona around magnetite (Fig. 4f), and is very commonly associated with plagioclase–biotite-rich layers in the rock. It occurs also as coarse, skeletal elongate grains which may contain poikilitic inclusions of plagioclase and quartz. The intimately associated sphene-biotite and opaque minerals frequently show general dimensional parallelism defining the foliation trend (Fig. 4g, h). Allanite (weakly pleochroic in shades of yellow and brown; the outer margin of the grain is always browner than the yellowish inner part) occurs as coarse subhedral to fine, equant grains closely associated with magnetite. Around allanite, the quartzo-feldspathic grains show radial cracks. It may also occur as coarse, triangular, subhedral grains in the interspaces of biotite and quartzofeldspathic mass. Zircon occurs as squarish and rectangular medium-sized grains in the interspaces of plagioclase and sphene (Fig. 4i), as fine elongate subhedral to idiomorphic grains in the interspaces of other minerals and as inclusions in plagioclase. Opaque minerals (magnetite) occur as coarse- to fine-sized, rectangular, squarish and rhomboid grains within both plagioclase and the plagioclase–microcline interface.
Representative photomicrographs of the investigated Jhalida porphyritic granitoids (JPG) and xenolith suites. (a) Inclusions of plagioclase (antiperthite) within microcline megacryst in Jhalida porphyritic granitoid. Note the formation of smaller tabular felsic crystals along the marginal part of the microcline megacryst formed as a result of brittle deformation. Altered plagioclase, microcline and elongate quartz layers are arranged following the outline of the augen (crossed polars). (b) Thin myrmekite lens at the long contact of two megacrysts of microcline in JPG (crossed polars). (c) Coarse lenticular quartz running parallel to the foliation within recrystallized feldspar in JPG (crossed polars). (d) Subparallel biotites show wrapping around megacrystic feldspar in JPG (plane-polarized light). (e) The haphazard orientation of biotite laths in JPG. Note the intimate association of allanite, sphene and magnetite with biotite (crossed polars). (f) Corona of sphene around rhombohedral magnetite in JPG. (g) Thin stringer of sphene–biotite–magnetite assemblage showing general dimensional parallelism with the foliation trend of the JPG. (h) The intimate association of clusters of flecks and criss-cross laths of biotite with sphene in JPG; note the quartz of varied shape and size intimately associated with flaky biotite clusters at the central part. (i) Rhombohedral and tiny elongate/euhedral zircon in the interspaces of feldspars with sphene in JPG. (j) Plagioclase–hornblende schist with partial biotitization (Type-a xenolith). (k) Plagioclase–quartz–biotite (with minor hornblende) schist (Type-b xenolith). (l) Plagioclase–quartz–biotite schist (no hornblende) frequently with medium- to fine-sized quartz (Type-c xenolith).

In the deformation zones, the most conspicuous fabric of the porphyritic granitoids is gneissic, defined by the preferred alignment of ellipsoidal and augen-shaped feldspar megacrysts and stretched felsic layers, along with the finer centimetre-thick impersistent layers of mafic (mainly biotite) quartzofeldspathic minerals defining the foliation trend (Fig. 2c). The stretched felsic layers are composed of aggregates of finer subhedral microcline, plagioclase and quartz. Stretching (and granulation) of the feldspar megacrysts into thin elongate augens running parallel to the gneissosity suggest the continuity of the shearing movement even after the consolidation of the porphyritic granitoid magma. The biotite-bearing groundmass layers show divergence and convergence at the ends of augens of felsic megacrysts. In places, the augens are composed mainly of aggregates of quartz and feldspar instead of feldspar only. The augen-shaped megacrysts of microcline have, in places, developed aggregates of smaller tabular crystals along the marginal part due to brittle deformation. Where the shearing effect is intense, many groundmass feldspars have been elongated parallel to the foliation trend and, in places, show marginal granulation. In high-grade sheared rocks, lenticular coarse quartz runs parallel to the foliation trend and, together with other groundmass minerals, wraps around the elliptical or eye-shaped megacrysts of feldspars, mainly microcline (Fig. 4c). Biotites (pleochroic from straw yellow to dark brown) frequently diverge and converge around augens of feldspars. The secondary epidotization, muscovitization and chloritization are more restricted in the highly deformed samples. Secondary muscovite laths, occasionally present with altered (sericitized) plagioclase, replace biotite in places. Epidote occurs as aggregates of subhedral to anhedral grains; it is an alteration product of plagioclase, commonly in contact with biotite laths. Chlorite occurs as medium-sized laths, simulating the shape of the biotite that it replaces.
4.b.2. Generic interpretation of fabric of porphyritic granitoids
The presence of porphyritic texture, subidiomorphic microcline and plagioclase grains, euhedral zircon, euhedral sphene, magnetite/ilmenite, etc. all suggest a magmatic origin. The preferred E–W orientation of the K-feldspar megacrysts, ferromagnesian minerals such as biotite and opaques, and bending of the (flow) foliation of the porphyritic granitoids around the xenoliths are interpreted as a result of the magmatic flowage. The occasional presence of large ribbon or lenticular quartz grains or augen-shaped feldspar indicates that these have been deformed by shearing under sub-solidus conditions. The preferred orientation of feldspars and biotite is largely a result of magmatic flowage. Moreover, stronger preferred orientation of the microcline megacrysts and their augens or large ribbon or lenticular quartz grains are the result of shear strain. It appears that the magmatic fabric becomes much more intense approaching the shear zone, which is highly consistent with emplacement while the shear zone was active.
4.b.3. Mafic xenolithic suite
Mafic xenoliths present in porphyritic granitoids are classified into three distinct types based on mineral assemblages and texture: Type-a, plagioclase–hornblende schist with minor biotite; Type-b, plagioclase–quartz–biotite schist with minor hornblende; and Type-c, plagioclase–quartz–biotite schist with no hornblende.
Type-a xenoliths are coarse-grained schistose amphibolites, composed dominantly of hornblende and plagioclase with subordinate biotite and accessory quartz, epidote, allanite, apatite and rare opaque minerals. Schistosity is defined by the subparallel orientation of hornblende and plagioclase along a particular direction (Fig. 4g). The schistosity is accentuated by the presence of laths or clusters of laths of biotite. Hornblende occurs mostly as coarse, prismatic and also platy grains forming clusters in the interspaces of plagioclase. Poikiloblastic hornblendes contain inclusions of one or more of the following fine-grained minerals: quartz, plagioclase, epidotes, sphene and opaque minerals. Plagioclase occurs as coarse, subidioblastic elongate grains running parallel to the schistosity, and also as aggregates of medium to coarse, subidioblastic grains in the interspaces of hornblendes. In places, plagioclase has been mylonitized to aggregates of fine-sized subidiomorphic grains. Myrmekite is rarely present. Biotite (yellow to dark brown) occurs as coarse, occasionally unusually elongate laths, both parallel and transverse to hornblende schistosity. It replaces hornblende, releasing fine xenomorphic quartz as a by-product. It also occurs as clusters of laths at the marginal parts of hornblendes in contact with plagioclase. Minor quartz occurs generally as medium to fine, xenoblastic grains in the interspaces of plagioclase, hornblende–biotite and hornblende–biotite–plagioclase. Epidote occurs as fine-grained aggregates, intimately associated with hornblende–hornblende, hornblende–plagioclase and occasionally hornblende–biotite contacts. It also occurs as fine-grained inclusions in hornblende. Allanite occurs as coarse- and medium-sized, subidiomorphic yellow-brown grains with radiating cracks in the surrounding plagioclase and hornblende. Yellow-brown subidiomorphic allanite is surrounded by radial growth of epidotes in contact with surrounding plagioclase. Such epidotes show radial cracks originating from allanite. Apatite and sphene are present as medium to fine subidiomorphic grains, both stumpy and elongate as well as equant grains in the interspaces of plagioclase, ferromagnesian minerals and as inclusions in hornblende and biotite. Opaque minerals occur as xenomorphic grains associated with both biotite and hornblende.
The following petrographic changes have been noted from Type-a→ Type-b→Type-c mafic xenolith suites.
-
(i) Type-a xenolith is characterized by the first appearance of biotite in a minor amount in coarse-grained schistose amphibolite protolith, now represented by hornblende–plagioclase–biotite accessory quartz–epidote–allanite–apatite opaques.
-
(ii) Type-b and Type-c xenoliths are characterized by a gradual increase in the amount of biotite with a decrease of hornblende. In type-b xenoliths, quartz, apart for forming aggregates of fine-grained granoblasts with plagioclase, also occurs as sporadic coarse- to medium-sized lenticles running parallel to the schistosity. In Type-c xenoliths, it is significant to note that both quartz and plagioclase, and also opaques, show general elongation parallel to the trend of schistosity.
-
(iii) An increase of opaques, sphene and apatite from Type-a→ Type-b→ Type-c is observed.
-
(iv) The more frequently preferred orientation of finer plagioclase, quartz and biotite gives rise to stronger schistosity.
4.c. Mineral chemistry
4.c.1. Feldspar
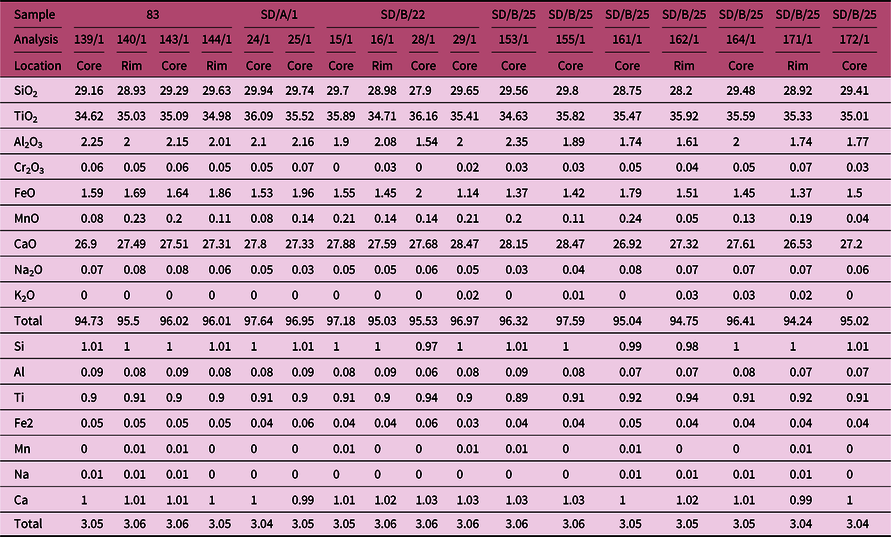
Representative EPMA of plagioclase and alkali feldspar from porphyritic granitoid rocks and plagioclase from plagioclase–quartz–biotite schist (mafic xenolith suite Type-c) and cationic proportions are given in Tables 2 and 3, respectively. In the unaltered megacrystic plagioclase of JPG, the An content in the core and the rim ranges from 26.90 to 21.90 wt% and 26.10 to 18.30 wt%, respectively (Fig. 5). The An content of plagioclase from plagioclase–quartz–biotite schist in the core and rim ranges from 38.70 to 34.10 wt% and 32.50 to 29.70 wt%, respectively (Fig. 5).
Classification of feldspars (after Deer et al. Reference Deer, Howie and Zussman1992) from porphyritic granitoids and plagioclase–quartz–biotite schists (Type-c xenolith).

Electron probe microanalyses of plagioclase and cationic calculation on the basis of 32 oxygen from porphyritic granitoids and biotite schist (Type-c xenolith). Ab – albite mol%; An – anorthite mol%; Or – orthoclase mol%.

EPMA of microcline and cationic calculation on the basis of 32 oxygen from porphyritic granitoids.

Microcline crystals from the JPG have Or contents in the core and rim ranging between 92.40 and 85.80 wt% and 96.80 and 92.40 wt% (Fig. 5).
4.c.2. Biotite
Representative EPMA of biotite from porphyritic granitoids and plagioclase–quartz–biotite schist (mafic xenolith suite Type-c) and cationic proportions are given in Table 4.
Electron Probe Microanalyses of biotite and cationic calculation on the basis of 22 oxygen from porphyritic granitoids and biotite schist (Type-c xenolith).

According to the classification scheme of Deer et al. (Reference Deer, Howie and Zussman1992), the analytical data plot within the biotite field for both porphyritic granitoids and plagioclase–quartz–biotite schist (Fig. 6a). TiO2 content in the plagioclase–quartz–biotite schist (mafic xenolith suite Type-c) ranges from 3.56 wt% (core) to 3.41 wt% (rim), while TiO2 concentrations in biotites in the porphyritic granitoids are slightly lower than those in the xenoliths, ranging over 3.11–1.95 wt% (core) and 3.11–1.86 wt% (rim). Similarly, Fe2+/(Fe2++Mg) ratios in biotite from the plagioclase–quartz–biotite schist (xenolith) are higher (average 0.6) than those from the porphyritic granitoids (average 0.53).
(a) Classification of biotites from porphyritic granitoids and plagioclase–quartz–biotite schist (Type-c xenolith) in Fe/(Fe+Mg) versus AlIV diagram (after Deer et al. Reference Deer, Howie and Zussman1992). (b) Plots of biotite compositions of the porphyritic granitoids of Jhalida in the MgO–FeO–Al2O3 discrimination diagram (after Abdel-Rahman, Reference Abdel-Rahman1994). (c) Plots of biotite compositions of the porphyritic granitoids of Jhalida in the Mg (pfu) versus Al (total) discrimination diagram (after Nachit et al. Reference Nachit, Razafimahefa, Stussi and Carron1985). Symbols: as in Figure 5.
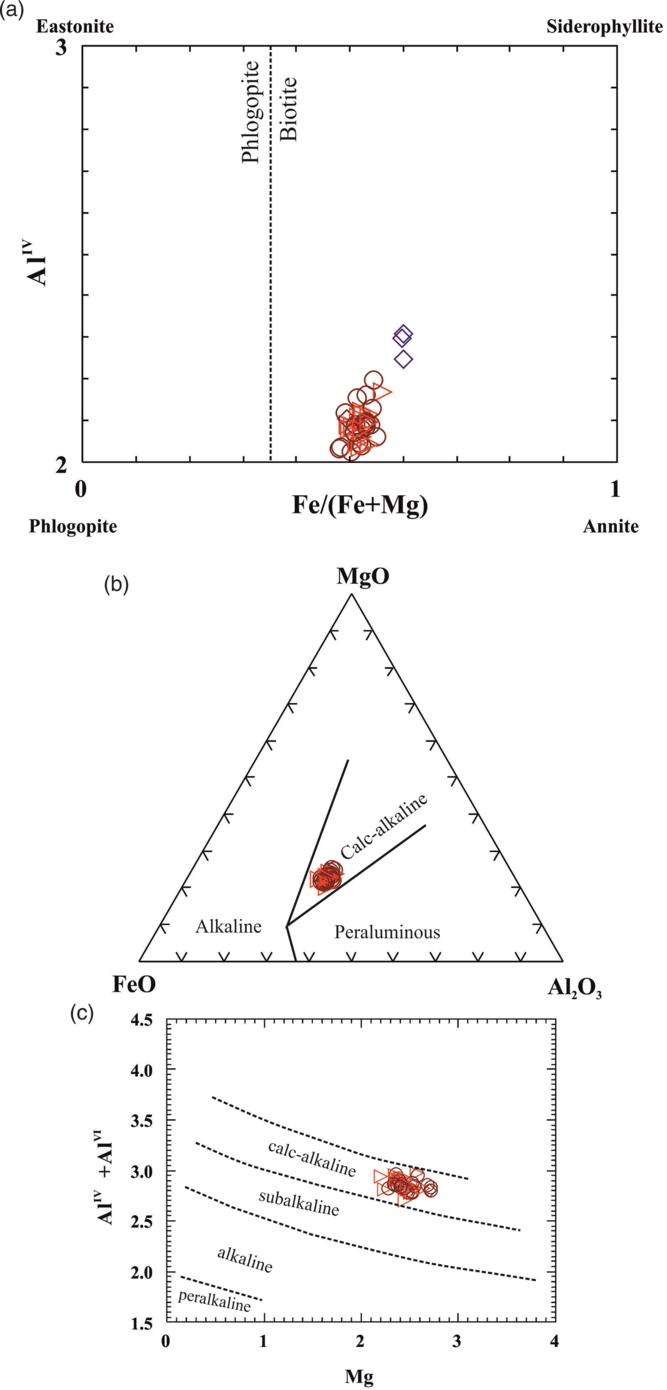
Biotites of Jhalida granitoid pluton are aluminous (Total Al = 2.70–2.98 apfu) and plot in the calc-alkaline field in the MgO–FeO–Al2O3 triangular diagram (after Abdel-Rahman, Reference Abdel-Rahman1994) (Fig. 6b). The plots of biotites in the Mg (apfu) versus AlT (apfu) diagram proposed by Nachit et al. (Reference Nachit, Razafimahefa, Stussi and Carron1985) also lie in the calc-alkaline field (Fig. 6c).
4.c.3. Magnetite
Representative EPMA of magnetite from porphyritic granitoid rocks and plagioclase–quartz–biotite schist (mafic xenolith suite Type-c) and cationic proportions are given in Table 5. Magnetites from both the porphyritic granitoids and plagioclase–quartz–biotite schist (mafic xenolith suite Type-c) are nearly pure.
EPMA of magnetite and cationic calculation on the basis of 4 oxygen from porphyritic granitoids and biotite schist (Type-c xenolith).

4.c.4. Sphene
Representative EPMA of sphene from porphyritic granitoid rocks and cationic proportions are given in Table 6. The Ti content in the core and rim of sphene from the porphyritic granitoids is in the range of 0.89–0.0.94 apfu (5 oxygen basis), while Ca content ranges between 1.03 (core) and 0.99 (rim) apfu. Al concentration is also low (0.09–0.07 apfu), which is consistent with the typical magmatic nature of the sphene (< 0.28 apfu when total cation = 3) in granitoids (Enami et al. Reference Enami, Suzuki, Liou and Bird1993).
EPMA of sphene and cationic calculation on the basis of 5 oxygen from porphyritic granitoids
4.d. Whole-rock geochemistry
Major- and trace-element data for eight representative granitoid samples of Jhalida porphyritic granitoid pluton together with one analysis from published literature (Sample no 4/GIS from Sarkar et al. Reference Sarkar, Banerjee, Singh, Lahiri, Sarkar and Ghosh1998) and three xenolith rock samples are given in Tables 7 and 8, respectively.
Major- and trace-element concentrations for the porphyritic granitoid rocks of Jhalida

Data source: Sl. 1–8, present study; Sl. 9 from GSI Report by Sarkar et al. (Reference Sarkar, Banerjee, Singh, Lahiri, Sarkar and Ghosh1998)
Mg no. = {(MgO/40.31)/[MgO/40.31 + (Fe2O3(t)×0.8998/71.85×0.85)]}×100
A/CNK = (Al2O3/101.96)/[(CaO/56.08)+(Na2O/61.98)+(K2O/94.20)]
A/NK = (Al2O3/101.96)/[(Na2O/61.98)+(K2O/94.20)]
NK/A = [(Na2O/61.98)+(K2O/94.20)]/(Al2O3/101.96)
(Nb/Zr)N = (Nb/0.56)/(Zr/8.3), where N refers to normalized abundance
Eu* = (Eu/0.058)/√[(Sm/0.153)×(Gd/0.2055)]
(La/Yb)N = (La/0.687)/(Yb/0.493), normalized value of primitive mantle (Sun & McDonough, 1989)
Major- and trace-element concentrations for the xenolith rocks of Jhalida Pluton

4.d.1. Porphyritic granitoids
SiO2 contents of the porphyritic granitoids range over 66.16–75.62 wt%. The Na2O+K2O values of these granitoids range over 8.21–10.4 wt%. In a SiO2 versus (Na2O+K2O) diagram (after Cox et al. Reference Cox, Bell and Pankhurst1979), the studied JPG samples are plotted in the granite, alkali granite and syenite fields and the three xenolith samples are plotted in the gabbro field (Fig. 7a). In the SiO2 versus K2O diagram (after Peccerillo & Taylor, Reference Peccerillo and Taylor1976), five samples fall in the field of shoshonite series while only four samples fall in the field of high-K calc-alkaline series (Fig. 7b). In the Na2O–K2O diagram (after Turner et al. Reference Turner, Amand, Rogers, Hawkesworth, Harris, Kelley, Calsteren and Deng1996), four samples of Jhalida granitoids are classified as shoshonitic, four samples plot within the ultra-potassic series and one sample plots at the boundary of the shoshonitic–ultrapotassic series (Fig. 7c). The K2O/Na2O ratios of these granitoids range over 1.14–2.43. These granitoids are metaluminous to weakly peraluminous (Fig. 7 d), with A/CNK values ranging over 0.96–1.13. The agpaitic index (AI = molar (Na2O + K2O)/Al2O3) of these granitoids ranges over 0.73–0.89 (Table 7).
Plots of porphyritic granitoids and three xenolith rock samples from this study in the classification diagrams: (a) total alkali versus silica diagram of Cox et al. (Reference Cox, Bell and Pankhurst1979); (b) SiO2–K2O diagram (after Peccerillo & Taylor, Reference Peccerillo and Taylor1976); (c) Na2O versus K2O diagram (after Turner et al. Reference Turner, Amand, Rogers, Hawkesworth, Harris, Kelley, Calsteren and Deng1996); (d) Shand’s Index diagram (after Maniar & Piccoli, Reference Maniar and Piccoli1989); A/NK = mol Al2O3/(Na2O+K2O); A/CNK = mol Al2O3/(CaO+Na2O+K2O); (e) SiO2 versus MALI (modified alkali lime index; Na2O+K2O–CaO) (after Frost et al. Reference Frost, Barmes, Collins, Arcutus, Ellis and Frost2001); (f) SiO2 versus Fe* number [FeO(t)/(FeO(t)+MgO)] diagram (after Frost et al. Reference Frost, Barmes, Collins, Arcutus, Ellis and Frost2001); (g) Ta/Yb versus Ce/Yb diagram of Pearce (Reference Pearce and Thorp1982); (h) Ba–Rb–Sr triangular plot of Tarney & Jones (Reference Tarney and Jones1994).

In the SiO2 (wt%) versus MALI (modified alkali lime index, (Na2O+K2O−CaO) wt%) diagram (after Frost et al. Reference Frost, Barmes, Collins, Arcutus, Ellis and Frost2001) the porphyritic granitoid samples are spread over the calc-alkalic, alkali-calcic and alkalic fields (Fig. 7e). In the SiO2 versus Fe-number diagram of Frost et al. (Reference Frost, Barmes, Collins, Arcutus, Ellis and Frost2001), six samples plot in the magnesian field and three samples plot within the ferroan field (Fig. 7f). In the Ta/Yb versus Ce/Yb diagram of Pearce (Reference Pearce and Thorp1982), two samples of the porphyritic granitoids fall in the field of shoshonitic series and other samples plot close to the field of shoshonitic series (Fig. 7g). These granitoids are characterized by high concentrations of Ba (936.82–2045.4 ppm) and Sr (325.35–654.06 ppm) and relatively low concentrations of Rb (105.43–210.9 ppm); hence most of them lie in the high Ba–Sr (Ba > 500 ppm, Sr > 300 ppm) field in the ternary Rb–Sr–Ba diagram (Fig. 7h) of Tarney & Jones (Reference Tarney and Jones1994).
On the Harker variation diagrams (Fig. 8a–p), the general decrease of MgO, TiO2, Fe2O3(t) and Al2O3 values with increasing SiO2 indicates the fractional crystallization of biotite, Fe–Ti oxides and sphene. The general decreasing trend of CaO and Al2O3 with increasing SiO2 indicates plagioclase fractionation. The CaO and TiO2 values show a distinctly positive correlation in these granitoids, which supports sphene fractionation. P2O5 content of the samples decreases with increasing SiO2, which suggests apatite fractionation, a diagnostic character of I-type granitoids (Chappell, Reference Chappell1999). When plotted in the Rb/Sr versus Sr logarithmic diagram (Fig. 8l), porphyritic granitoid samples define trends with a negative covariation, suggesting K-feldspar accumulation. The high total alkali (K2O+Na2O = 8.21 to 10.4 wt%), intermediate to high SiO2 (66.16–75.62%) and high FeO(t)/MgO ratios (1.8–7.4), together with the almost complete absence of amphibole, suggests a significant role of fractional crystallization in the evolution of Jhalida granitoids.
Plots of compositions of porphyritic granitoid samples and three xenolith rock samples of Jhalida pluton in Harker variation diagrams. Experimentally determined isotherms for apatite saturation temperature (Green & Watson, Reference Green and Watson1982) are also shown in the SiO2 versus P2O5 diagram.

In the primitive-mantle-normalized spidergrams (Fig. 9a), most of the Jhalida samples show enrichment in Rb, Ba and Zr, which may be related to the accumulation of biotite, and zircon, sphene and allanite. However, one sample (SD/A/4) shows troughs in Th and Zr that are to the result of the removal of Zr. All the Jhalida samples show more prominent negative Nb, Ti, P and Sr anomalies. Negative Nb and Ti anomalies are characteristics of magmatism of convergent plate margins, and negative P is to the result of the removal of apatite during fractional crystallization.
(a) MORB-normalized (normalization values after Pearce, Reference Pearce, Hawkesworth and Norry1983) spider diagram and (b) MORB-normalized (normalization values after Pearce, Reference Pearce, Hawkesworth and Norry1983) spider diagram xenolith rocks of Jhalida pluton. (c) chondrite-normalized REE diagram (normalization values after McDonough & Sun, Reference McDonough and Sun1995) for the porphyritic granitoid samples.

All the samples of Jhalida granitoid show high REE abundances (Table 7). In the chondrite-normalized REE diagram (Fig. 9b), these granitoids show fractionated light (LREE) and heavy rare earth element (HREE) patterns, with (La/Yb)N ratios varying over 31.38–216.06. Nine samples show moderately negative to slightly negative Eu anomalies (Eu* = 0.18–0.39; Table 7 and Fig. 9b). Only one sample (sample 83) shows no Eu-anomaly.
4.d.2. Mafic xenolith
In general, the mafic xenoliths have lower SiO2, Na2O and K2O and higher TiO2, FeO(t), MgO, MnO, CaO and P2O5 than the porphyritic granitoids (Table 8; Fig. 8).
Some of the elements behave compatibly in basic rocks, while some other concentrate in granitoid rocks. It is therefore convenient to divide the trace elements into three groups when comparing xenoliths and porphyritic granitoids. Group 1 (Cr, Co, Ni, V and Sc) consists of compatible elements that tend to be present at higher concentrations in mafic xenoliths than in porphyritic granites. Concentrations of Group 2 elements (Ba, Ta, Th and Zr) should be present in higher concentrations in granitoids; however, these elements occur in higher concentrations in the xenoliths than in the porphyritic granitoids. Group 3 elements (Nb, Y and U) includes high-field-strength elements (HFSE) that should occur at higher levels in the granitoids, but show higher concentrations in xenoliths (Tables 7, 8; Fig. 8).
K/Rb ratios in the xenoliths are lower than in the porphyritic granitoid (Tables 7, 8), which is consistent with the higher presence of modal biotites in the xenoliths than the porphyritic granitoids (Table 1) (e.g. Barbey & Cuney, Reference Barbey and Cuney1982).
Ba is most concentrated in K-feldspar of granitic rocks, whereas the K/Ba ratio is approximately half that of coexisting biotite (e.g. Barbey & Cuney, Reference Barbey and Cuney1982). Variable K/Ba ratios (17.8–97.5) in xenolith rocks are consistent with the abundance of modal biotite in them.
In the mid-ocean-ridge-basalt-normalized (N-MORB) multicationic spider diagram, both the three xenolith samples and porphyritic granitoids show more or less the same patterns (Fig. 9a, b). Significantly, both the xenoliths and porphyritic granitoids show a strong negative Ta–Nb anomaly, characteristic of subduction zone magma and continental crust. Although both have negative Nb–Ta anomalies, the Nb/Ta ratios are notably different. Whereas Nb/Ta ratios in porphyritic granitoids range over 1.36–29 (average 8.17), these ratios are higher in the xenolithic rocks (53–150). These geochemical features suggest that the sources of the porphyritic granite are significantly different from the mafic xenoliths occurring within them. At the same time, xenolith rocks do not any show negative P and Ti anomalies that are very prominent in granitoids (Fig. 9). Higher P and Ti contents of the xenoliths are consistent with the higher modal abundances of apatite and opaques and sphene in them.
4.e. Physicochemical parameters of crystallization
The mineralogical assemblage of Qtz–Kfs–Pl–Bt±Spn–Mag and/or Ilm of Jhalida porphyritic granitoids suggests that these are calc-alkaline in nature (Speer, Reference Speer1987; Wones, Reference Wones1989; Vyhnal et al. Reference Vyhnal, McSween and Speer1991). The compositions of biotites and hornblendes in calc-alkaline magma are responsive to temperature, pressure, oxygen fugacity and H2O content of the magma (e.g. Wones & Eugster, Reference Wones and Eugster1965; Hammarstrom & Zen, Reference Hammarstrom and Zen1986; Holland & Blundy, Reference Holland and Blundy1994; Ridolfi et al. Reference Ridolfi, Renzulli and Puerini2010). Assemblage and morphology of accessory minerals in calc-alkaline rocks can indicate oxygen fugacity conditions during crystallization (e.g. Wones, Reference Wones1989; Enami et al. Reference Enami, Suzuki, Liou and Bird1993). Early crystallization of euhedral sphene and magnetite, magmatic allanite and assemblage of Kfs–Bt–Mag–Spn in granitoids indicate high oxygen fugacity during crystallization (Chesner & Ettlinger, Reference Chesner and Ettlinger1989; Enami et al. Reference Enami, Suzuki, Liou and Bird1993).
4.e.1. Temperature
From high-temperature experimental studies, Watson & Harrison (Reference Watson and Harrison1983) obtained the following equation for Zr-saturation temperature (T Zr):
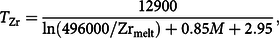 $${T_{{\rm{Zr}}}} = {\rm{ }}{{12900{\rm{ }}} \over {\ln {\rm{(}}496000{\rm{ }}496000{\rm{Z}}{{\rm{r}}_{{\rm{melt}}}}{\rm{Z}}{{\rm{r}}_{{\rm{melt}}}}{\rm{)}} + 0.85M + 2.95}},$$
where M = (2Ca+K+Na)/(Al×Si) and whole-rock Zr content approximates the Zr content in the melt.
The Zr-saturation temperatures for Jhalida granitoids range between 798 and 891°C (Table 9). Since most of the zircons of Jhalida pluton are euhedral and magmatic, and interpreted to be early crystallizing, the Zr-saturation temperature can be interpreted as the near-liquidus temperature of the magma.
Estimated physicochemical parameters of crystallization for the Jhalida porphyritic granitoids

Apatite saturation temperature can be calculated using the equation of Harrison & Watson (Reference Harrison and Watson1984):
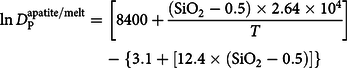 $$\ln D_{\rm{P}}^{{\rm{apatite/melt}}} = \left[ {8400 + {{({\rm{Si}}{{\rm{O}}_2} - 0.5) \times 2.64 \times {{10}^4}} \over T}} \right] - \left\{ {3.1 + \left[ {12.4 \times ({\rm{Si}}{{\rm{O}}_2} - 0.5)} \right]} \right\}$$
where SiO2 is the weight fraction of silica in the melt and T is the absolute temperature. The results obtained for Jhalida granitoids are represented graphically in Fig. 8f. Whole-rock apatite saturation temperatures in the Jhalida granitoids vary from c. 800°C to > 950°C.
According to Jung & Pfänder (Reference Jung and Pfaänder2007), Al2O3/TiO2 ratios of orogenic granitoid rocks can be used to estimate liquidus temperature using the following equation:
 $$T = {{309901} \over {\left( {{{{\rm{A}}{{\rm{l}}_2}{{\rm{O}}_3}} \mathord{\left/ {\vphantom {{{\rm{A}}{{\rm{l}}_2}{{\rm{O}}_3}} {{\rm{Ti}}{{\rm{O}}_2}}}} \right. {{\rm{Ti}}{{\rm{O}}_2}}}} \right) + 309}}.$$
Using this linear equation and assuming an igneous source composition, Jhalida granitoids yield a temperature range of 797–920°C. This temperature range is quite consistent with the zircon-saturation temperature (798–891°C) obtained from these rocks. The zircon- and apatite-saturation temperatures suggest that these temperatures are around normal for granitic magmas, not notably high, which further indicates their crustal origin.
4.e.2. Pressure
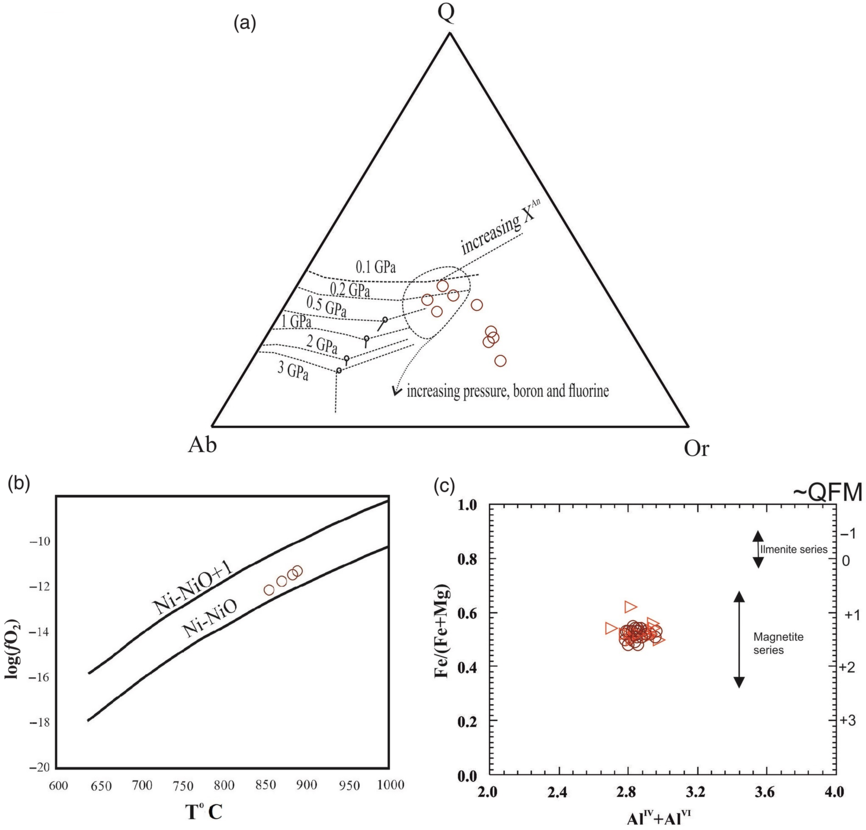
In the Q–Ab–Or diagram (for hydrous granitic system), samples of Jhalida porphyritic granitoids plot close to the minima on the quartz–feldspar cotectic for pressures of c. 2 kbar (Fig. 10b).
(a) Normative Q–Ab–Or plot. Ternary cotectic curves and eutectic minima are after Winter (Reference Winter2001). (b) Temperature versus log(fO2) diagram. Methods for determination of the temperature and oxygen fugacity values are described in the text. The NNO and NNO+2 curves are taken from O’Neill & Pownceby (Reference O’Neill and Pownceby1993). (c) Plots of biotite compositions in the AlVI+AlIV versus Fe/(Fe+Mg) diagram of Anderson et al. (Reference Anderson, Barth, Wooden and Mazdab2008).
4.e.3. Oxygen fugacity
The assemblage Mag–Spn–Aln in Jhalida porphyritic granitoids suggests high oxygen fugacity (above quartz–fayalite–magnetite (QFM) buffer) of the melt (Wones, Reference Wones1989; Chesner & Ettlinger, Reference Chesner and Ettlinger1989). Enami et al. (Reference Enami, Suzuki, Liou and Bird1993) suggested that the occurrences of euhedral magnetite as an early crystallizing phase suggest high oxygen fugacity conditions. Magnetite-bearing granitoids (‘magnetite series’ of Ishihara, Reference Ishihara1977) crystallize under high oxygen fugacity.
Czamanske & Wones (Reference Czamanske and Wones1973) showed that the Mg/(Mg+Fe) ratios of mafic silicates can indicate the redox conditions of the magmatic system. The opaques in the Jhalida granitoids are exclusively magnetite, which suggests the I-type nature of the magma (Chappell & White, Reference Chappell and White1992; Ishihara, Reference Ishihara1977). Moreover, the presence of sphene and magnetite, together with the presence of allanite, in Jhalida pluton suggests that the magma was relatively oxidized as expected in calc-alkaline melts (Wones, Reference Wones1989; Chesner & Ettlinger, Reference Chesner and Ettlinger1989). Wones (Reference Wones1989) gave the following equation to estimate the oxygen fugacity (log unit) for the equilibrium relationship titanite + magnetite + quartz = hedenbergite + ilmenite:
 $$\log f{{\rm{O}}_2} = - {{30939} \over T} + 14.98 + {{0.142 \times \left( {P - 1} \right)} \over T},$$
where T is temperature in degrees in Kelvin and P is pressure in bars.
Adopting zircon-saturation temperature (798–891°C) and pressure of c. 2 kbar, fO2 conditions of crystallization were estimated to be above the Ni–NiO buffer condition (about 10–11 to 10–12 bar between 798 and 891°C) (Fig. 10c).
Based on the calibration of Wones (Reference Wones1981), Anderson et al. (Reference Anderson, Barth, Wooden and Mazdab2008) plotted approximate fO2 of granitoid magma relative to the QFM buffer (assuming PH2O = Ptotal) in a binary AlIV+AlVI versus Fe/(Fe+Mg) composition diagram of biotite (Fig. 10d). Plots of the biotite composition of Jhalida samples on Anderson’s diagram show that these granites crystallized between QFM buffers of +0.8 and +1.6 (Fig. 10d), which is quite high and consistent with the calc-alkaline nature of the magma.
4.e.4. Water content
Wones (Reference Wones1981) gave the following equation relating oxygen and water fugacities and activities of annite in biotite, sanidine in K-feldspar and magnetite in opaques:
 $$\log f{{\rm{H}}_2}{\rm{O}} = {{4819} \over T} + 6.69 + 0.5\log f{{\rm{O}}_2} + \log {a_{{\rm{ann}}}} - \log {a_{{\rm{Kf}}}} - \log {a_{{\rm{mag}}}} - {{0.011\left( {P - 1} \right)} \over T},$$
where T is temperature in degrees Kelvin and activities are given as molar fractions; a ann (the activity of annite in biotite) can be calculated from different ideal activity models (after Holland & Powell, Reference Holland and Powell1990; Nash, Reference Nash1993; Patiño Douce, Reference Patiño Douce1993); a Kf can be taken as 0.6 for magmatic systems (Czamanske & Wones, Reference Czamanske and Wones1973); and a mag is c. 1.
The water activity (a H2O) of magma is defined:
 $${a_{{\rm{H}}2{\rm{O}}}} = {{f{{\rm{H}}_2}{\rm{O}}} \over {{f_0}{{\rm{H}}_2}{\rm{O}}}},$$
where f 0H2O is the standard state water fugacity.
Based on the water solubility models of Burnham (Reference Burnham and Yoder1979) and Burnham & Nekvasil (Reference Burnham and Nekvasil1986), it is possible to convert the a H2O, f H2O to X H2O, which can then be expressed in wt%. We use the experimental data of Moore et al. (Reference Moore, Vennemann and Carmichael1998) to determine the H2O (wt%) from fH2O (vapour) in magmas. This model can be applied to any natural silicate liquid at a temperature of 700–1200°C and pressure of 1–3000 bar. For the conversion of fH2O to H2O (wt%), the following regression equation is derived from the experimental data of Moore et al. (Reference Moore, Vennemann and Carmichael1998):
 $${{\rm{H}}_2}{\rm{O}}\;({\rm{wt}}\% ) = - 0.000\,000\,2{\left( {f{{\rm{H}}_2}{\rm{O}}} \right)^2} + 0.002\left( {f{{\rm{H}}_2}{\rm{O}}} \right) + 1.499.$$
The fH2O of Jhalida pluton is estimated to be c. 5347–9632 bar, corresponding to 2.2–6.5 wt% of the water in the magma (Table 9). These values are consistent with the typical values of calc-alkaline magma crystallization in an arc-related environment (Ridolfi et al. Reference Ridolfi, Renzulli and Puerini2010).
4.f. Tectonic affinity
To identify the tectonic setting of emplacement of JPG, major- and trace-element compositions are plotted in some standard tectonic discrimination diagrams.
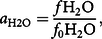
Batchelor & Bowden (Reference Batchelor and Bowden1985) used a variation diagram of de la Roche et al. (Reference de la Roche, Leterrier, Grand-Claude and Marchal1980) to identify the tectonic settings of granitoid rocks that involve two cationic functions known as R1 = 4Si–11(Na+K)–2(Fe+Ti) and R2 = Al+2Mg+6Ca. Batchelor and Bowden (Reference Batchelor and Bowden1985) differentiated the fields of mantle plagiogranite, subduction zone, late orogenic, anorogenic and crustal-melt (syn-collisional) granitoids in the R1 versus R2 variation diagram (Fig. 11a). In the R1–R2 diagram, the Jhalida granitoid rocks lie within the late orogenic and syn-collision fields (Fig. 11a). In the Y versus Sr/Y diagram of Drummond & Defants (Reference Drummond and Defants1990), the Jhalida samples fall in the field of typical arc rocks, except for one that lies in the adakite field (Fig. 11b). In trace-element discrimination diagrams proposed by Whalen & Hildebrand (Reference Whalen and Hildebrand2019), most of the JPGs plot within the slab failure field (Fig. 11c–h) in a post-collisional setting.
Plots of the Jhalida porphyritic granitoids in (a) R1 versus R2 diagram of Batchelor & Bowden (Reference Batchelor and Bowden1985); (b) Y versus Sr/Y diagram of Drummond & Defants (Reference Drummond and Defants1990); (c–h) trace-element variation diagrams to discriminate arc, slab failure and A-type granitic rocks after Whalen & Hildebrand (Reference Whalen and Hildebrand2019).
They also show very high contents of large-ion lithophile elements (LILE), such as Rb and K, and negative Nb–Ta anomalies in a multicationic spider diagram (Fig. 9a). High LILE contents (especially K), negative Nb–Ta anomalies and LREE enrichment over HREE have been observed in post-collisional granitoids of the East African Orogen and elsewhere (Goodenough et al. Reference Goodenough, Thomas, De Waele, Key, Schofield, Bauer, Tucker, Rafahatelo, Rabarimanana, Ralison and Randriamananjara2010).
The broadly E–W-trending Jhalida pluton is parallel to the NPSZ, suggesting a control of the shear zone on magma emplacement (D’Lemos et al. Reference D’Lemos, Brown and Strachan1992). The preferred orientation is largely as result of magmatic flowage. However, the much stronger preferred orientation of most of the microcline megacrysts, their augens and the large ribbon or lenticular quartz grains in porphyritic granitoids are to the result of shear strain.
4.g. Petrogenesis
4.g.1. Petrogenesis of porphyritic granitoids
The negative correlation between P2O5 and SiO2, low P2O5 content and the metaluminous to weakly peraluminous nature of most of the samples with high oxygen fugacity (ΔQFM ranging between +0.8 and +1.6) of the Jhalida granitoids suggest their I-type character.
The Jhalida porphyritic granitoid samples show highly fractionated REE patterns ((La/Yb)N > 31.4–216.1) (Fig. 9b). Strong negative Sr and Ti anomalies, but weak negative to positive Eu-anomalies (Eu/Eu* = 0.54–1,19; average 0.8; Fig. 9b) and strong positive Ba anomalies in spider diagram (Fig. 9a), suggest that hornblende and plagioclase and a Ti-rich mineral such as ilmenite or titanite fractionated while K-feldspar accumulated.
Nb/U and Ce/Pb ratios can provide information about the source of igneous melts because these ratios do not change significantly during partial melting or fractional crystallization (e.g. Hofmann, Reference Hofmann1988). However, these ratios can change during subduction dehydration and crust-mantle interaction (McCulloch & Gamble, Reference McCulloch and Gamble1991; Hofmann, Reference Hofmann2003; Kelley et al. Reference Kelley, Plank, Ludden and Staudigel2003).
The average Nb/U ratios (8.5) of Jhalida porphyritic granitoids are slightly higher than those estimated for the middle continental crust (7.7; Rudnick & Gao, Reference Rudnick, Gao, Holland and Turekian2003) and much lower than the ratios obtained from the lower continental crust (Nb/U c. 25; Rudnick & Gao, Reference Rudnick, Gao, Holland and Turekian2003) and ocean-island basalt (OIB; 47 ± 10; Hofmann et al. Reference Hofmann, Jochum, Seufert and White1986). Further, the average Ce/Pb ratio (9.0) of the Jhalida porphyritic granitoids are higher than those of lower continental crust (c. 5; Rudnick & Gao, Reference Rudnick, Gao, Holland and Turekian2003) but much lower than those of MORB and OIB (Ce/Pb = 25 ± 5; Hofmann et al. Reference Hofmann, Jochum, Seufert and White1986). The observed Nb/U and Ce/Pb ratios of the Jhalida granitoid samples therefore probably reveal the values of the source rock and, hence, crustal rocks.
Partial melting experiments have shown that granitoid magmas can be generated from a wide range of crustal rocks at geologically reasonable pressures and temperatures, and exhibit discrete chemical composition that can be used to identify the actual source rock of the magma.
Tepper et al. (Reference Tepper, Nelson, Bergantz and Irving1993), Wolf & Wyllie (Reference Wolf and Wyllie1994) and Patiño Douce (Reference Patiño Douce, Castro, Fernandez and Vigneresse1999) have experimentally shown that partial melting of crustal metabasalt can produce a variety of granitoid rocks under different water activities. The required heat for partial melting of the crust can be supplied from the underplating of basaltic magmas, or from an upwelling of the mantle (see Bonin, Reference Bonin2007).
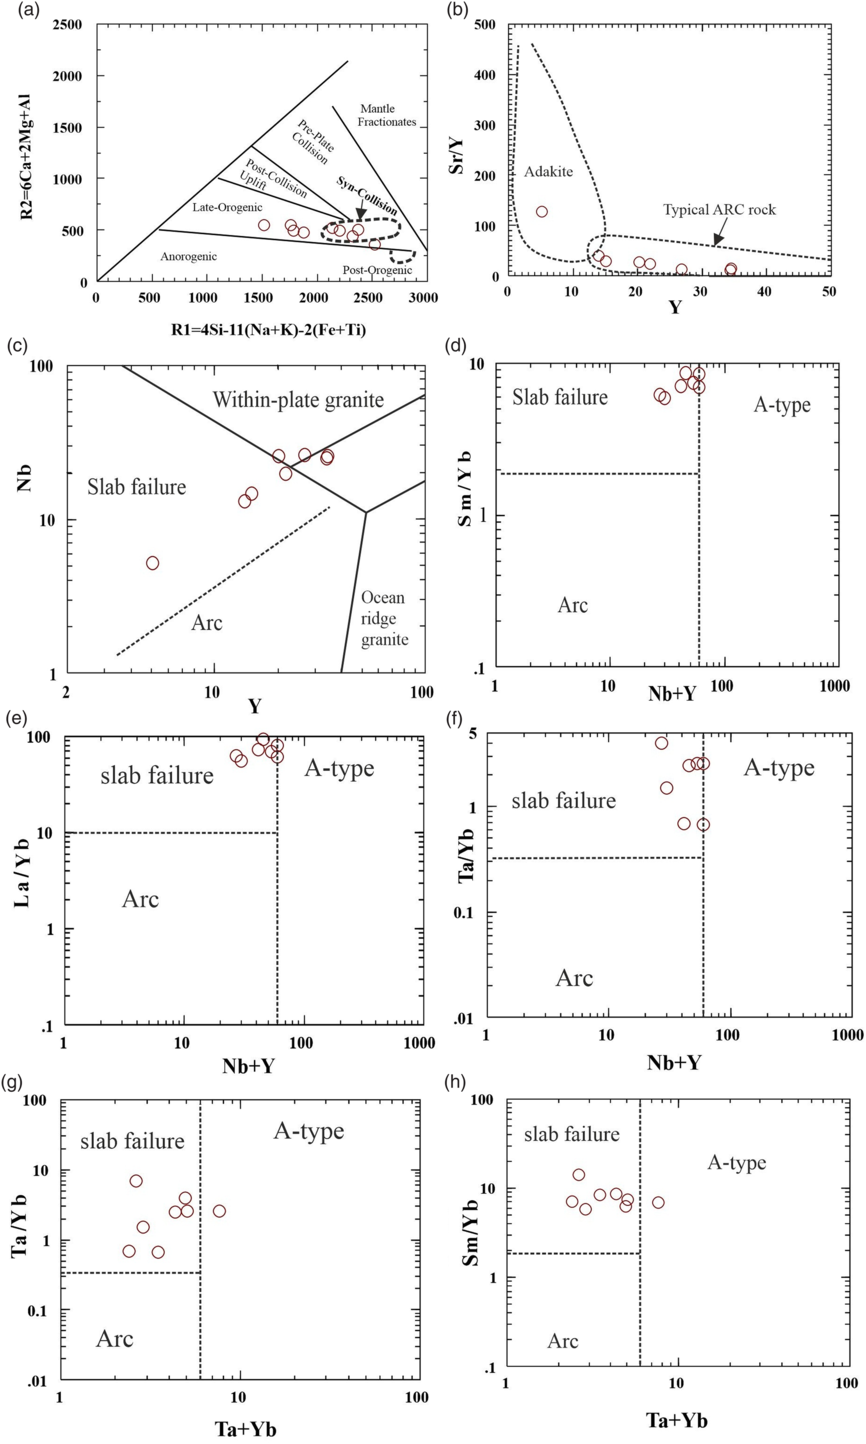
Granitic magma generated by the partial melting of the amphibolitic (basaltic) continental crust should have low Mg no. values (<40) (Rapp & Watson, Reference Rapp and Watson1995). The Mg no. values of the Jhalida porphyritic granitoids are low (average Mg no. = 15) and vary from 10 to 23. These values are consistent with their derivation from the melting of the crustal source. In the SiO2 versus Mg no. diagram compiled by Jiang et al. (Reference Jiang, Jia, Liu, Liao, Zhao and Xhou2013), the samples of Jhalida granites plot within the experimentally determined field of crustal partial melts (Fig. 12a).
Source rock of the Jhalida porphyritic granitoids. (a) SiO2 (wt%) versus Mg no. ((Mg×100)/(Mg+FeO(t))). The fields of pure crustal partial melts determined in experimental studies on dehydration melting were compiled by Jiang et al. (Reference Jiang, Jia, Liu, Liao, Zhao and Xhou2013). (b) (Al2O3+MgO+FeO(t)+TiO2) versus Al2O3/(MgO+FeO(t)+TiO2) and (c) (Na2O+K2O+FeO(t)+MgO+TiO2) versus (Na2O+K2O)/(FeO(t)+MgO+TiO2) diagrams to show the composition of Jhalida porphyritic granitoids compared with melts produced by experimental dehydration-melting of various kinds of metasediments and amphibolites. Reference fields after Patiño Douce (Reference Patiño Douce, Castro, Fernandez and Vigneresse1999). (d) SiO2 (wt%) versus K2O (wt%) and (e) SiO2 (wt%) versus Na2O (wt%) diagrams with published data for experimental melts as compiled by Chen et al. (Reference Chen, Yang, Zhang, Sun and Wilde2013) from the literature. Reference fields: amphibolites (Beard & Lofgren, Reference Beard and Lofgren1991); metabasalt (Rapp & Watson, Reference Rapp and Watson1995); quartz amphibolites and biotite gneiss (Patiño Douce & Beard, Reference Patiño Douce and Beard1995); medium- to high-K basaltic rocks (Sisson et al. Reference Sisson, Ratajeski, Hankins and Glazner2005). (f) Plots of compositions of Jhalida porphyritic granitoids in the An–Ab–Kfs normative triangle for melts produced from dehydration-melting reactions and water-present-melting reactions of distinct source rocks (diagram modified after Weinberg & Hasalova, Reference Weinberg and Hasalova2015). (g) Plots of compositions of JPG in the Q–Or–(Ab+An) diagram. Note that most of the samples of JPG plot within the field produced by the melting of high-K high-alumina basalt (amphibolite) at 7 kbar (Sisson et al. Reference Sisson, Ratajeski, Hankins and Glazner2005).
Patiño Douce (Reference Patiño Douce, Castro, Fernandez and Vigneresse1999) showed that compositional variations of magmas generated by partial melting of common crustal rocks such as amphibolites, metagreywackes and metapelites can be discriminated using major oxide ratios. He drew the fields of granitic melts generated from the partial melting of amphibolites, metagreywackes and felsic pelites in (i) (Al2O3+FeO(t)+MgO+TiO2) versus Al2O3/(FeO(t)+MgO+TiO2) and (ii) (Na2O+K2O+FeO(t)+MgO+TiO2) versus (Na2O+K2O)/(FeO(t)+MgO+TiO2) diagrams. The Jhalida porphyritic granitoids exhibit low Al2O3/(FeO(t)+MgO+TiO2) and intermediate (Na2O+K2O)/(FeO(t)+MgO+TiO2) ratios, suggesting their derivation from amphibolite and/or metagreywacke sources (Fig. 12b,c). Since the Jhalida porphyritic granitoids are metaluminous to slightly peraluminous, we can discard the pelitic rocks as their potential source.
In the SiO2 versus K2O and the SiO2 versus Na2O diagrams (compiled by Chen et al. Reference Chen, Yang, Zhang, Sun and Wilde2013), the Jhalida porphyritic granitoid samples plot well within the experimentally derived melt field, drawn from the melting of medium- to high-K high-alumina basaltic source rock, at around 7 kbar and 825–950°C (Sisson et al. Reference Sisson, Ratajeski, Hankins and Glazner2005) (Fig. 12d,e). The medium- to high-K high-alumina basalts are characteristic of subduction zone environment.
Weinberg & Hasalova (Reference Weinberg and Hasalova2015) reported that a great diversity of granitoid magma can be obtained from the melting of similar protoliths under different activity levels of water. In the normative An–Ab–Or diagram of Weinberg & Hasalova (Reference Weinberg and Hasalova2015), the samples of Jhalida porphyritic granitoids plot in the fields of dehydration melting of quartz amphibolite and biotite–gneiss and water-present melting of hornblende shoshonitic high-alumina basalt (Sisson et al. Reference Sisson, Ratajeski, Hankins and Glazner2005) (Fig. 12g). However, the metaluminous character of Jhalida porphyritic granitoids strongly supports an amphibolite (basaltic) source for these rocks.
The high estimated H2O content (2.2–6.5 wt%) together with liquidus temperature near 800°C (zircon-saturation temperature) suggests that the parental magma of Jhalida porphyritic granitoids was not produced by the melting of the dry granulitic lower crust; in contrast, dehydration melting of an amphibolite-grade middle crust is the most possible source.
Sisson et al. (Reference Sisson, Ratajeski, Hankins and Glazner2005) experimentally produced granitic melt from moderately hydrous (1.7–2.3 wt% H2O), medium-to-high K basaltic rocks at 7 kbar pressure, 825–975°C temperature and relatively high oxygen fugacity (ΔNi–NiO = –1.3 to +4). The compositional range of granitic melt derived from their study was plotted on the CIPW normative quartz (Qtz), orthoclase (Or) and albite+anorthite triangular diagram (Fig. 12h). Many of the samples of Jhalida porphyritic granitoids are plotted within the compositional field of granite melt derived in these experiments (Fig. 12h). Medium-to-high K basaltic is therefore a potential source rock for the granitoids of this study.
Further, the Jhalida porphyritic granitoids show strong REE fractionation with slightly concave intermediate REE patterns in the chondrite-normalized REE diagram (Fig. 9b), suggesting that amphibole was retained in the source as a residual phase. Moreover, depletion in Sr and Eu in the primitive-mantle-normalized spider diagram (Fig. 9a, b) of the granitoids of this study strongly suggests a source rock within the plagioclase stability field or fractionation of plagioclase. High-K basaltic source rocks which metamorphosed under amphibolite facies would therefore be a potential source rock for the generation of the Jhalida porphyritic granites. The medium- to high-K high-alumina basalt was enriched in LILE and LREEs but depleted in high-field-strength elements (HFSE), suggesting that these were emplaced during a previous subduction process and later metamorphosed under amphibolite facies.
4.g.2. Batch melting model for porphyritic granite magma
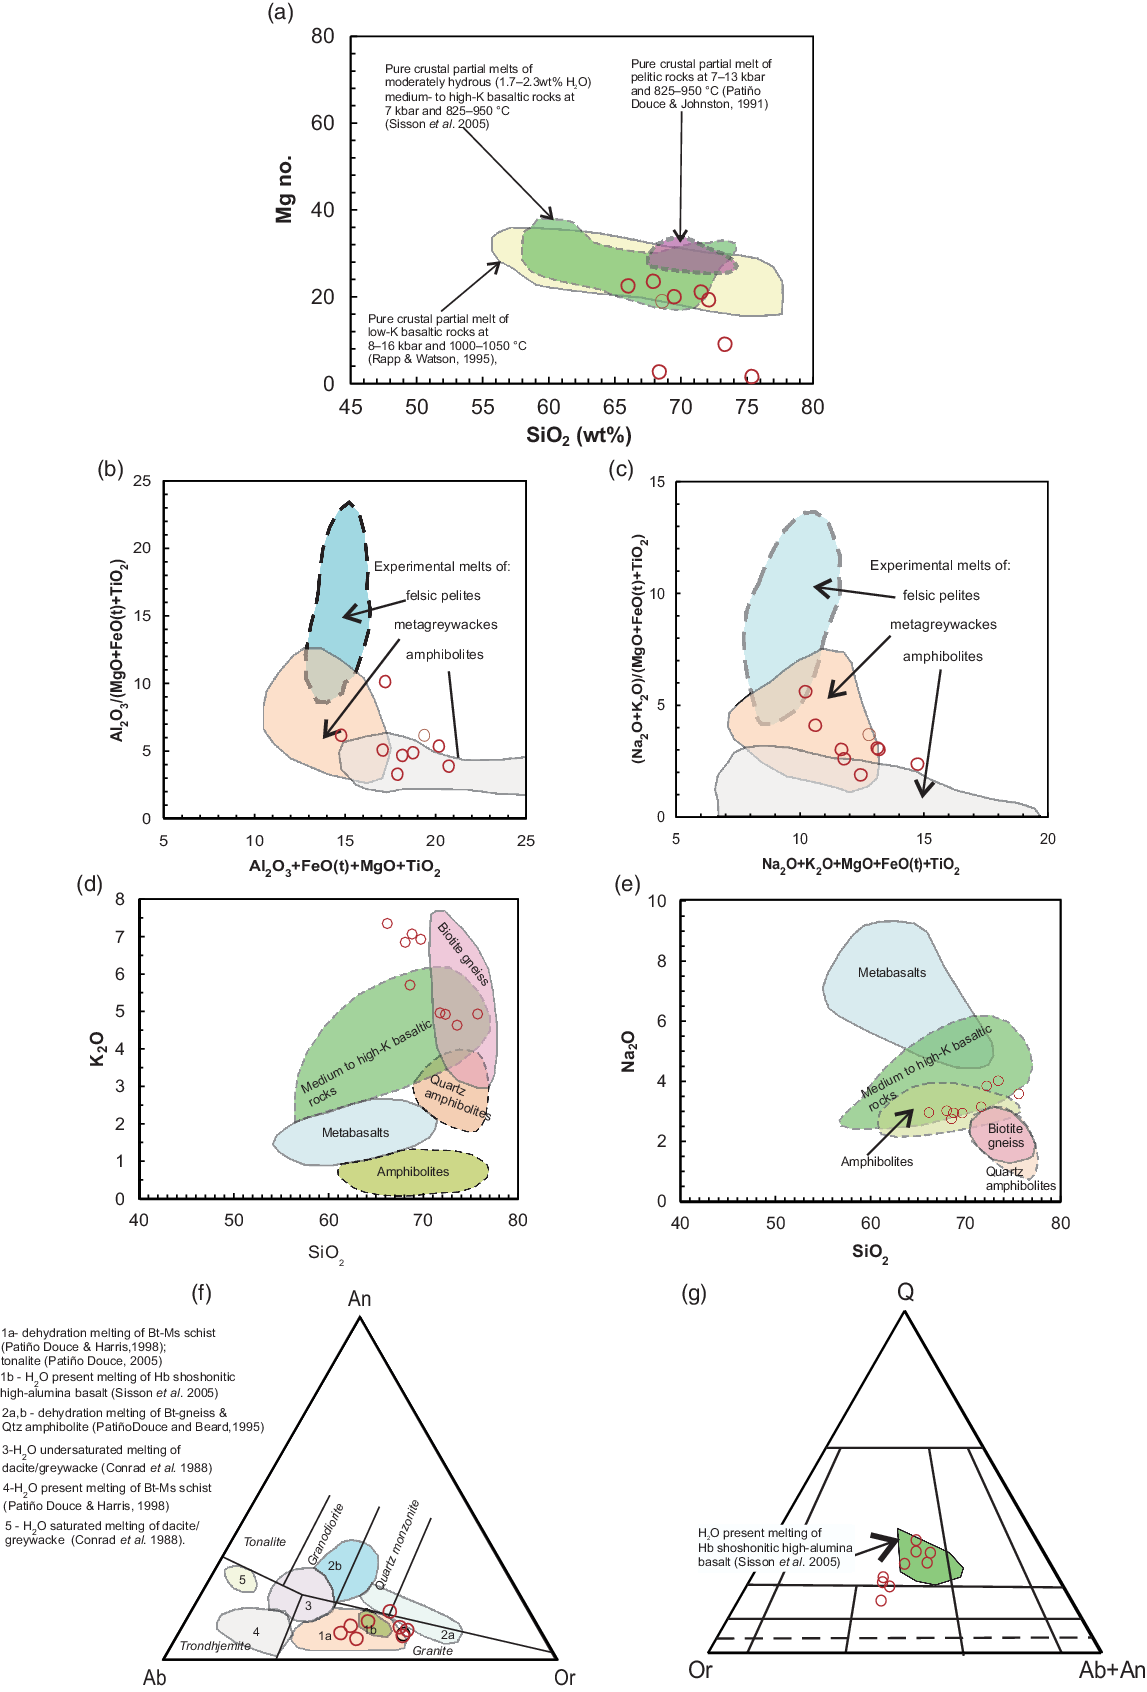
The REE patterns in the Jhalida porphyritic granite can be modelled following the experiments of Sisson et al. (Reference Sisson, Ratajeski, Hankins and Glazner2005) by assuming a high-K amphibolite parent rock had been enriched and emplaced at the middle crust during earlier subduction. In the absence of direct information on the composition of high-K amphibolite xenoliths within porphyritic granitoids, we have chosen amphibole granulites from the NPSZ as the possible source rock (detailed analyses of these amphibole granulites are given in online Supplementary Table S1, available at http://journals.cambridge.org/geo). Mineral-melt partition coefficients for andesite were used after Rollinson (Reference Rollinson1993).
It may also be mentioned that the relative enrichment in LREEs, the relatively flat HREE pattern and relative depletion of middle REEs (MREEs; Fig. 9b) can be interpreted as the result of partial melting of these amphibole granulites. Fractionation of Eu depends on the proportion of plagioclase and amphibole involved in melting. To obtain significant enrichment in LREEs, the melting of a significant amount of pyroxene is necessary.
The REE melting model suggests that the parental melt of the porphyritic granite can be produced by the 10–20% batch melting of the amphibole granulite source. The modelled proportions of minerals in Figure 13 are similar to those obtained from the average of eight hornblende granulite samples of the NPSZ.
Modelled rare earth element (REE) compositions derived from partial melting (batch melting) of enriched metabasalt. Starting material (assumed metabasalt) is an incompatible-element-enriched amphibole granulite occurring in the North Purulia Shear Zone. Mineral-melt partition coefficients from Rollinson (Reference Rollinson1993).
4.g.3. Role of migmatization–granitization in the petrogenesis of porphyritic granitoids
Saha et al. (Reference Saha, Bhattacharyya and Lakshmipathy1976) suggested that the migmatization of amphibolite by injection of granite magma near Tulin (9.2 km west of Jhalida town) has given rise to porphyritic granite gneiss locally. The injected veins of granite are generally pink-colored, coarse-grained hololeucocratic rocks. Alkali feldspar megacrysts and biotite in the locally neoformed porphyritic granite gneiss were related to K-metasomatism and transformation of hornblende into biotite.
In this work, it has been concluded that the porphyritic granite magma was generated by partial melting of high-K high-alumina amphibolites. In the present area, the field relations indicate that the porphyritic granitoids were injected into the host amphibolite and, as a result, the hornblende of the latter have been biotitized in varying degrees, culminating in biotite schist in which hornblende has completely disappeared, giving rise to an abundance of biotite with other mineralogical and textural changes. We have described in Section 4.a that at least some biotites in porphyritic granitoids have been derived from the highly biotitized mafic xenoliths. A comparison of the chemical analysis of biotite from a Type-c xenolith (SD/B/6) and those from Jhalida porphyritic granitoids (Table 4) shows that the cationic Fe2+/(Fe2++Mg) ratios of the biotites for the porphyritic granitoids (0.48–0.62) are very similar to those of the xenolith rocks (0.60). The xenocrystic mineral grains incorporated within a granitic magma will tend to change their composition as per the composition of the same minerals crystallizing at that time from the magma to attain equilibrium (Clarke, Reference Clarke2007).
4.g.4. Petrogenesis of xenolith suites
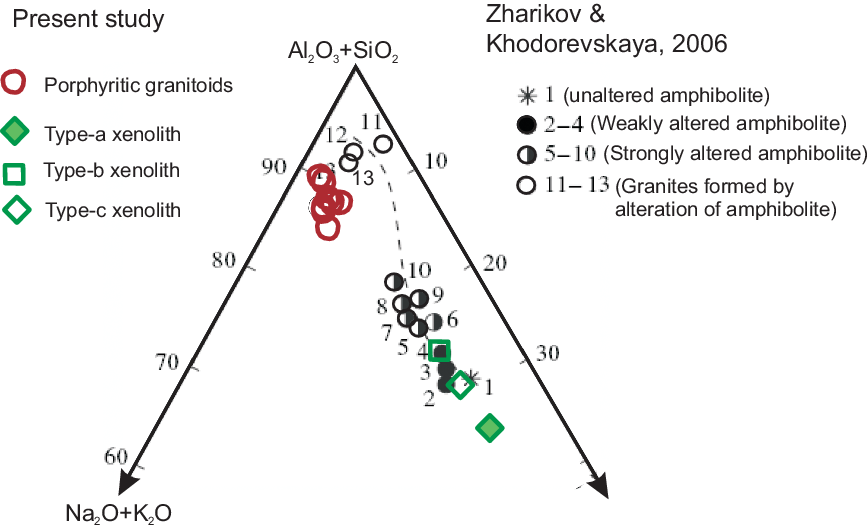
Restitic xenoliths within granitoid rocks contain refractory mineral phases (Didier & Barbarin, Reference Didier and Barbarin1991). However, xenoliths devoid of any refractory mineral are shown as restitic based on Nd-isotope studies, zircon morphology and age dating of zircon (Chen et al. Reference Chen, Song, Niu and Wei2014). We discuss the nature (restitic or not) of the xenolith suite in porphyritic granitoids in the light of the experimental work of Zharikov & Khodorevskaya (Reference Zharikov and Khodorevskaya2006).
Zharikov & Khodorevskaya (Reference Zharikov and Khodorevskaya2006) experimentally reproduced the granitization of amphibolites at 5–7 kbar fluid pressures and temperatures of 700–950°C. They showed the results of chemical changes of amphibolites in an (Al2O3+SiO2)–(Na2O+K2O)–(MgO+FeO+CaO) diagram as a result of metasomatic alteration by the infiltrating granitic melt. Zharikov & Khodorevskaya (Reference Zharikov and Khodorevskaya2006) showed in a trajectory (Fig. 14) that feldspathization and granitization are the major changes as a result of the metasomatic alteration of amphibolite protolith. All the Type-a, Type-b and Type-c amphibolites plot on the trajectory defined by Zharikov & Khodorevskaya (Reference Zharikov and Khodorevskaya2006), suggesting that the amphibolite xenoliths of this study are crustal xenoliths that have undergone metasomatic alteration during the emplacement of porphyritic granitoid magma. The amphibolite xenoliths have been incorporated into the porphyritic granitoid magma during emplacement into its current position.
Plots of chemical compositions of porphyritic granites of Jhalida and xenolithic rocks in the (Al2O3+SiO2)–(Na2O+K2O)–(MgO+FeO+CaO) diagram (after Zharikov & Khodorevskaya, Reference Zharikov and Khodorevskaya2006). Note the plots of chemical compositions of parental amphibolite and granitic melt derived by the melting of parental amphibolite in the experiments of Zharikov & Khodorevskaya (Reference Zharikov and Khodorevskaya2006). Also, note the alteration of amphibolite by invading granitic melt, as given by Zharikov & Khodorevskaya (Reference Zharikov and Khodorevskaya2006).
4.h. Tectonic implications
Standard tectonic discrimination diagrams show that the Jhalida porphyritic granitoids are slab-failure granites (Whalen & Hildebrand, Reference Whalen and Hildebrand2019) that emplaced during a post-collisional tectonic setting (Fig. 11). Structural studies reveal that this pluton emplaced late-tectonically (Sengupta & Sarkar, Reference Sengupta and Sarkar1964, Reference Sengupta and Sarkar1968). Detailed petrographic studies on the basic granulites occurring a few kilometres east of the Jhalida pluton also reveal that the area experienced a strong near-isothermal decompression from 11 to 5 kbar at c. 990–940 Ma (monazite age) (Karmakar et al. Reference Karmakar, Bose, Sarbadhikari and Das2011).
The late-tectonic emplacement of the Jhalida pluton within the NPSZ and the presence of porphyritic grading to mylonitic texture in the pluton suggest a shear-zone control emplacement of the porphyritic granitoid magma, like many other post-collisional plutons in orogenic belts elsewhere (e.g. Goodenough et al. Reference Goodenough, Thomas, De Waele, Key, Schofield, Bauer, Tucker, Rafahatelo, Rabarimanana, Ralison and Randriamananjara2010). The shearing movement persisted even after the consolidation of the porphyritic granitoid magma (see Section 4.g). The closure of the basin south of the CGC and continent–continent collision between the Singhbhum craton (belonging to the South Indian Cratonic Block) and the CGC (belonging to the North Indian Cratonic Block) took place at c. 1.0 Ga (Rekha et al. Reference Rekha, Upadhyay, Bhattacharya, Kooijman, Goon, Mahato and Pant2011; Reference Chakraborty, Upadhyay, Ranjan, Pruseth and NandaChakraborty et al. 2019b). The emplacement of post-collisional porphyritic granitoids into older migmatitic gneisses in the CGC was related to the convergence of CGC and the North Singhbhum Mobile Belt lying just south of the CGC (Fig. 1b), involving N-wards subduction of oceanic crust of the South Indian cratonic block beneath the CGC (Goswami & Bhattacharyya, Reference Goswami and Bhattacharyya2014). The post-collisional extension was caused by the delamination of the subducted slab (Black & Liégeois, Reference Black and Liégeois1993; Sylvester, Reference Sylvester1998; Jacobs et al. Reference Jacobs, Bingen, Thomas, Bauer, Wingate, Feitio, Satish-Kumar, Motoyoshi, Osanai, Hiroi and Shiraishi2008). We therefore suggest that, after c. 1.0 Ga, the delamination of the subducted slab of the South Indian Block below the CGC led to an asthenospheric upwelling. Such an upwelling caused partial melting of the lithospheric mantle, forming basaltic magma. The underplating of such basic magma or the hot, upwelled asthenosphere under the CGC triggered partial melting of the previously emplaced, incompatible-element-enriched high-K high-alumina basalts (hornblende granulite) of the middle crust, producing a silicic magma that led to the final emplacement of the porphyritic granitoids of the Jhalida.
5. Conclusion
The pink-coloured, very coarse-grained porphyritic granitoids of Jhalida are composed mainly of syenogranite, monzogranite and granodiorite. The presence of both magmatic and solid-state deformation features in porphyritic granitoids suggests that shearing was active during the emplacement of magma and outlasted the solidification of the magma.
Relatively high oxygen fugacity, as indicated by the presence of sphene, allanite and magnetite, and biotite composition suggest crystallization under high fO2 conditions (ΔQFM: +1 to +2) consistent with the I-type nature of the Jhalida granitoids. High H2O content (2.21–6.47 wt%), together with high temperature (798–891°C) and oxygen fugacity (ΔQFM: +0.8 to +1.6) of the magma are consistent with the calc-alkaline nature.
Chemically, the granitoid rocks are high-K to shoshonitic and metaluminous to weakly peraluminous in nature. On the Harker variation diagrams, a general decrease of MgO, TiO2, Fe2O3(t) and Al2O3 with increasing SiO2 indicates the fractional crystallization of amphibole, biotite, Fe–Ti oxides and sphene. The general decreasing trend of CaO and Al2O3 with increasing SiO2 indicates plagioclase/hornblende fractionation. CaO and TiO2 show distinctly positive correlation in these granitoids, which supports sphene fractionation. Moreover, the negative correlation of SiO2 with P2O5 is also a typical character of I-type granitoids. Further, high zircon saturation temperature (798–891°C) and high apatite saturation temperature (c. 800–950°C) also suggest that the porphyritic granitoid magma was not derived from a sedimentary source.
Strong fractionation of light and middle rare earth elements in porphyritic granitoids does not support the involvement of any mantle magma in their origin. The metaluminous I-type character of Jhalida granitoids, their crystallization at high pressure (c. 7 kb) and temperature (825–950°C), low Nb/U and Ce/Pb ratios, and strong fractionation of light and middle rare earth elements can be reconciled with the generation of a melt by partial melting of amphibolites. Since the granitoids are metaluminous, I-type greywacke is not considered as a protolith in the source but incompatible-element-enriched high-K amphibolites are considered as the source rock for the magma generation. Low Nb/U and Ce/Pb ratios and high zircon-saturation temperatures of these granitoids are consistent with the derivation of parental magma through amphibole-dehydration melting of the crustal source rocks. The parental magma was generated at c. 7 kbar pressure and 825–950°C. REE modelling shows that 10–20% batch melting of an amphibole–granulite source rock can yield porphyritic granitoid melt. This parental magma was metaluminous, but fractionation of early-crystallized amphibole from the magma results in the peraluminous character of the fractionated rocks. The incompatible-element-enriched amphibolite source was emplaced during a previous subduction event. The probable heat source for amphibolite melting was an upwelling of the asthenospheric mantle in the post-collisional setting as a result of slab break-off. Three distinct types of xenoliths are noted in the porphyritic granitoids, namely: Type-a (plagioclase–hornblende schist with minor biotite); Type-b (plagioclase–quartz–biotite schist with minor hornblende); and Type-c (plagioclase–quartz–biotite schist with no hornblende). Chemical characteristics of the Type-a, Type-b and Type-c xenoliths of this study suggest that these are crustal xenoliths. During emplacement, the amphibolite country rocks were incorporated as xenoliths into the porphyritic granitoid magma. The amphibolite xenoliths underwent feldspathization and granitization during the emplacement of porphyritic granitoid magma.
Acknowledgements
This study was funded by a major research project grant from the UGC (F.-43-367/2014(SR)) and a research grant from the University of Calcutta awarded to Dr Bapi Goswami. We thank Professor Chalapathy Rao, Dr Dinesh Pandit and Mr Asutosh Pandey (Department of Geology, Banaras Hindu University, India) for providing electron microprobe facilities. We also thank Professor Arijit Roy, Professor Gautam Ghosh and Mr Sujit Kumar Bhaduri, Presidency University, Kolkata, and Dr Manoj Jaiswal and Mr Biswajit Giri, Indian Institute of Science, Education and Research, Kolkata, West Bengal for arranging major- and trace-element analyses. We are also very grateful to Professor Manikyamba, Dr Ram Mohan, Dr Satyanarayanan and Mr D Linga for trace elements including REE analysis at the National Geophysical Research Institute, Hyderabad, India. We thank an anonymous reviewer and Professor Shuguang Song of Peking University for critically reviewing the manuscript and suggesting changes that upgraded the quality of the manuscript. We also thank Dr Kathryn Goodenough for editorial suggestions and thorough review.
Supplementary material
To view supplementary material for this article, please visit https://doi.org/10.1017/S0016756820000710


