


Why recycle?
The most commonly stated reason for recycling is to reduce burdens associated with the disposal of our never-ending stream of wastes. Waste disposal potentially causes air and water pollution and is costly; moreover, landfills compete with other land uses. In addition, recycling can extend our supply of materials to alleviate scarcity and to moderate rising prices of raw materials. Furthermore, recycling is often more environmentally benign than using virgin raw materials and can reduce energy use and emissions of greenhouse gases and other pollutants.
Life-cycle analysis
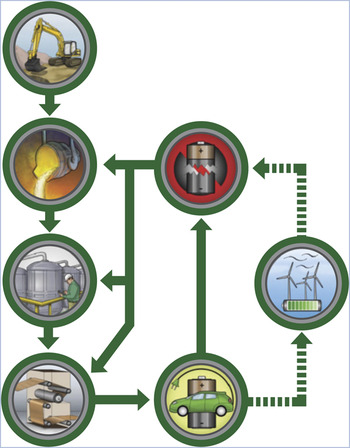
Despite these positive attributes, not all recycling processes are created equal. For example, Figure 1 shows various alternative paths that might be used to recycle car batteries. As is evident from this figure (and from the definitions in the sidebar), recycling can re-introduce materials at different stages of a production process, thereby displacing parts of the virgin-material process. Each recycling option will create its own impacts, often but not always lower, which must be taken into account as well.
Schematic of battery recycling to different manufacturing stages: This figure depicts mining of ore, primary processing, chemical conversions, and fabrication into a battery. The finished battery is then used in a vehicle and is recycled back to one of the manufacturing steps, possibly after being reused to store energy for an electric utility.
How does one identify the best options? A useful technique for comparing alternative technological options is life-cycle analysis (LCA). LCA takes a system-wide perspective, considering all stages of the life cycle of a product or service, including material production, system manufacture and assembly, service provision, maintenance and repair, and end-of-life processes. In the next section, we show how LCA compares disposition alternatives for discarded materials. The results are not always obvious, as they depend on many factors and can lead to tradeoffs among impacts. Other criteria, such as financial, institutional, or regulatory concerns, enter the picture as well.
Examples
This section provides three examples in which LCA is useful in comparing options for items that would otherwise be thrown away. The first two examples are short-lived consumer products—paper products and beverage containers—whereas the last is a complex, durable item—the battery for an electric-drive vehicle—that is expected to have a service life of about 10 years. Although this article is written from a U.S. perspective, the general principles of applying LCA to assess material disposition options are universal. The detailed conclusions for particular countries might differ, however, reflecting different prices and availability of raw and recycled materials, energy, and labor.
Paper productsReference Gaines1
Newspaper and office paper are produced differently and therefore must be discussed separately. Newsprint is an inexpensive, lightweight paper made mainly from mechanical wood pulp, engineered to be bright and opaque for the good print contrast needed by newspapers. The mechanical pulping process leaves most of the lignin in the pulp, which causes newsprint to rapidly become yellow and brittle upon exposure to air and/or sunlight. In contrast, office paper is made from chemical wood pulp obtained by a modified sulfate pulping process (called the kraft process) that removes most of the lignin but leaves the cellulose largely intact. Its natural unbleached color is brown, but it can be bleached to white. Kraft paper is used when strength and/or resistance to yellowing are important, such as in packaging, bags, envelopes, and coated paper, as well as printing and writing papers. Both types of paper can be recycled (either pre- or post-consumer) in a closed loop.
For newspapers, two dispositions that could potentially save energy are recycling to produce new newsprint and burning to displace fossil fuels in electricity generation (see Table I). Excluding the energy in the wood, the net energy difference between recycling and waste-to-energy (WTE) options for newspapers is small. However, recycling newspapers also saves the trees that would have been used to produce replacement newsprint. As a result, the total energy input, including wood, is reduced by recycling newsprint. Therefore, recycling of newspapers makes sense and should be encouraged.
Life-cycle energy required to supply one ton of paper to consumers.Reference Gaines and Stodolsky2
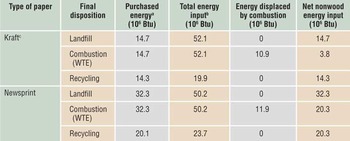
Abbreviation: WTE, waste to energy.
a Includes fuels plus electricity, with electricity converted at 10,500 Btu/kWh; values are lower if some of the electricity is cogenerated.
b Includes energy content of the wood. Wood for kraft paper includes bark used as byproduct fuel. Newsprint input excludes bark, which is generally used elsewhere in integrated mills.
c Kraft refers to printing and writing grades; other paper or cardboard types would have somewhat different energy requirements.
For office (kraft) paper, the situation is very different. In a modern kraft mill, much of the energy for primary production is supplied from byproduct fuels (e.g., the removed lignin), whereas energy for recycling must be purchased because no fuel byproducts are produced when waste paper is pulped. Because the purchased energy is generally derived from fossil fuels, combustion of waste paper in a WTE plant displaces additional fossil fuel, so the net non-wood energy use is much lower if the paper is burned (see Table I). Therefore, recycling office paper would result in increased use of nonrenewable fossil fuels in place of wood, which is renewable. Burning used kraft paper in U.S. municipal solid waste, instead of recycling it, could displace about 30 million tons of coal annually, or 3% of U.S. annual coal consumption. It would be similarly beneficial in other countries that wish to reduce both fossil fuel use and waste-disposal costs. Indeed, combustion for energy recovery is an integral part of solid-waste management strategies in many countries throughout the world.
Another factor to be considered in decisions regarding paper production and disposition is carbon dioxide emissions. Young trees grown in plantations to replace those cut for paper production take in more carbon dioxide than do slow-growing trees in old forests. One studyReference Butner, Kangas and Stapley3 estimated the effects on carbon dioxide emissions for various options for paper production and disposition. This study concluded that producing kraft paper from plantation trees and burning the waste paper for energy recovery is preferable, from the standpoint of greenhouse-gas emissions, to all other options—including recycling. Thus, burning is the preferred disposition for office paper, regardless of whether the objective is to reduce greenhouse-gas emissions, minimize fossil fuel use, or preserve old-growth forests.
Soda cans and bottles
Per pound, fabricated aluminum is about nine times as energy-intensive to produce as glass. However, aluminum cans are extremely light (typically under 0.5 oz each), with a typical single-serve 12-fl-oz can weighing one-13th as much as a 12-fl-oz glass bottle.4 As a result, the energy required to produce a single-serve container from virgin material is about 50% higher for glass bottles than for aluminum cans, as can be seen in Figure 2, which summarizes the LCA results.Reference Gaines and Mintz5
Energy per use for 12-oz. single-serving beverage containers. To compare different options, the total energy for original manufacturing and all processes involved in recycling or reuse is averaged over the number of uses.

Furthermore, little energy is saved by recycling glass bottles (although landfill volume is decreased), because of the high temperatures required to remelt glass. If the cans are recycled, processing energy per use drops by almost a factor of 4.Footnote * Of course, glass bottles could be reused at only the small extra energy cost of washing and sterilizing, although to match the energy use associated with the recycled aluminum can, a bottle must be used seven times. Moreover, this calculation assumes no breakage in the many refilling cycles, and water consumption for washing could be a constraint in drought-prone areas. In addition, refillable glass bottles have become unavailable in most areas of the world, because of higher costs and energy use and inconvenience.6 Thus, for single-serve drinks, recycling of cans appears to be preferable to reuse of glass bottles.
Note that these conclusions compare only aluminum and glass. For bottles made of the plastic poly(ethylene terephthalate) (PET), LCA indicates that reuse has the lowest energy use. Indeed, many countries have thriving refillable bottle programs for at least some beverages.
Automotive batteries
The next example considers a complex multiple-material product that is expected to last for at least 10 years. Both the complexity and the long life make appropriate disposition at the end of life much more complicated in this case.
The lead-acid batteries used to start conventional automobiles are a prime example of successful closed-loop recycling, with very high recycling rates and with most of the materials ending up back in batteries. In contrast, lithium-ion and nickel–metal hydride batteries from hybrid and electric vehicles have only recently entered the market and do not yet have an established recycling infrastructure. Several different schemes for recycling these new batteries are under development, and they differ dramatically in what is recovered, ranging from direct recycling of battery-grade materials to downcycling back to elements.
For such complex systems, to account for all of the unit processes in primary production and recycling, it is useful to employ a computer model, such as The Greenhouse Gases, Regulated Emissions, and Energy Use in Transportation (GREET) model developed at Argonne National Laboratory.Reference Burnham, Wang and Wu7 It includes both a fuel-cycle model, encompassing fuel production and vehicle operation, and a vehicle-cycle model, which evaluates the effects on energy and emissions of the vehicle itself, from material recovery and production, component fabrication, and vehicle assembly to vehicle disposal/recycling. The vehicle-cycle model (GREET 2.7) was used to estimate the impacts of battery production and recycling.Reference Burnham, Wang and Wu7
LCA of lithium-ion automotive batteries reveals that emissions of sulfur dioxide from battery material production represent a significant fraction of a vehicle’s lifetime emissions [20% for a plug-in hybrid electric vehicle with a maximum electric driving range of 20 miles (32 km) and higher percentages for vehicles with greater all-electric ranges] that can be avoided by employing any of the recycling processes being considered.Reference Gaines, Sullivan, Burnham and Belharouak8
If the battery can be used again, the energy use and emissions are shared among the number of times the battery is used. For example, there is considerable interest from utilities in repurposing automotive batteries to store energy from intermittent sources, such as wind and solar power.Reference Witkin9 Once the battery is no longer usable, it can still be recycled, although some of the materials might be more degraded after multiple uses and require more processing. The different processes have different advantages and disadvantages in terms of life-cycle energy use and emissions, resource use, and economics.
Figure 3 shows a schematic of lithium-ion battery production processes, with symbols indicating the stages to which various recycling processes return recovered materials. The more materials can be recovered and returned to forms closer to final use, the more the impacts from primary product production can be avoided.
Schematic flow chart for the production of lithium-ion cell materials. where purple ovals and light blue rectangles represent component materials and process steps, respectively.Reference Gaines10 The red, yellow, and green symbols next to various components indicate where new materials can be replaced by smelting, by the intermediate process, and by direct recovery, respectively, and the corresponding shaded outlines encompass the process steps that are avoided by each of these alternative flows.
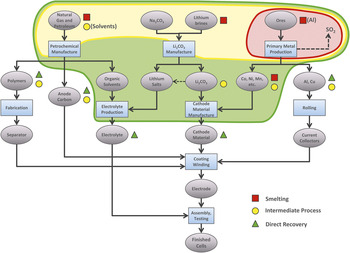
At one extreme are smelting processes (red squares) that recover some basic elements or salts. These are currently operational on a large scale and can take almost any input, including different battery chemistries (lithium-ion, nickel–metal hydride, etc.) or mixed feed. Smelting takes place at high temperatures, and organics—including the electrolyte and carbon anodes—are burned as fuel or reductants. The valuable metals (cobalt and nickel) are recovered and sent to refining so that the product is suitable for batteries (closed-loop recycling) or any other use (open-loop recycling). The other materials, including lithium and aluminum from lithium-ion batteries and metal hydrides from nickel–metal hydride batteries, are contained in the slag, which is currently used as an additive in concrete or aggregates for roadbeds (downcycled). These materials could be recovered using a hydrometallurgical process, but current lithium prices are too low to make recovery profitable. Cobalt recovery is the main economic driver for recycling lithium-ion batteries, although the use of newer cathode materials, which are displacing lithium cobalt oxide in electric vehicle batteries, would reduce the incentive to process batteries. Recycling avoids the process steps within the red shaded region in Figure 3, replacing them by the processes shown in the flow chart in Figure 4.
Flow chart for the recycling of lithium-ion batteries by smelting (data courtesy of Umicore). The blue rectangles indicate the steps in the process, whereas the green and brown circles represent material inputs and outputs, respectively. The red triangle shows an energy input of 800 MJ.

At the other extreme, direct recovery of battery-grade material (green triangles in Figure 3) for use in new batteries has also been demonstrated. This alternative approach to battery recycling is a low-temperature process with low energy requirements. The components are separated by various physical and chemical processes. Many of the process details are proprietary and thus cannot be specified here. The first process step involves breaching the cell packaging just enough to allow fluids to be exchanged. The electrolyte is extracted using supercritical carbon dioxide; it carries the salts with it and can be reused. The carbon dioxide can also be recovered. The remaining structure can then safely be chopped into small pieces that are amenable to a series of separation processes on the basis of surface properties and solubility. The active-material structures are maintained, and the materials can be used to produce new batteries with only minimal treatment. Over 80% of the material is recycled into useful products, including all active materials and metals. Only the thin plastic separator is unlikely to be usable, because its form cannot be retained. All of the steps in the green shaded region in Figure 3 are avoided (and replaced by lower-impact processes), so that almost all of the original energy and processing required to produce battery-grade material from raw materials is saved. In addition, cathode-grade material would be a valuable product even if it did not contain cobalt, so there would be a continuing economic incentive to recycle the batteries.
Advanced batteries will likely require high-grade materials for their components, so it will be important to understand the quality of the output from recycling processes. Both the purity and microstructure of the recycled materials must be proven to be suitable for reuse in batteries or other products. Excellent cycle life of a cell made with recycled material has been reported. Such processes require as uniform a feed as possible, because impurities jeopardize product quality. Mixed-chemistry input would decrease the utility of the product, so presorting might be required. Cathode materials might also be separated from a mixture at the end of this process, but this has not yet been demonstrated. Because battery chemistries are evolving rapidly, a potential drawback to the direct recycling of battery materials is that the material being recovered in 10–15 years might be obsolete and might not be able to find a market.
The U.S. Department of Energy has funded the development of a process between the two extremes (yellow circles and yellow shaded region in Figure 3) to recover lithium from spent batteries as lithium carbonate (a precursor for the cathode material). It has low energy requirements and does not require high temperatures. Although the carbonate is less valuable than the cathode material, the process can handle a feed with a mixture of cathode materials. The feed need not be as uniform as for direct recycling, but the process recovers materials farther along the chain than smelting does. Cathode materials might also be recoverable. Recycling processes for lithium-ion batteries are still under investigation.
Today’s consumer battery recyclers must deal with a highly diverse feedstock that includes numerous battery types and might even include harmful or dangerous components. Lead-acid batteries are large and easily separated, but consumer-electronics batteries are smaller and varied, so that they are more difficult to sort. However, recycling them will keep the recycling companies operating until large quantities of automotive propulsion batteries are available. When automotive batteries finally arrive, recyclers will find their job somewhat easier because the batteries will be larger and will probably come in a much smaller number of types or chemistries.
Enablers of recycling and reuse
This article has applied LCA to assess the disposition options for existing products. However, to achieve the greatest benefit, the analysis should begin at the earliest stages of the life cycle, with consideration of the final disposition of an item included even during design and development of both products and constituent materials. For example, material separation is often a stumbling block for the recovery of high-value materials. Therefore, designing products for disassembly or recycling would be beneficial. Similarly, standardization of materials would reduce the need for separation. In the absence of material standardization, product labeling would enable recyclers to sort before recycling and would help consumers determine where to put unwanted items. Standardization of product design, at least in size and shape, would foster the design of automated recycling equipment. Standardization of battery configurations and specifications would also be beneficial for reuse schemes, where cells from various sources would be tested and repackaged in compatible groups for reuse by utilities.
Conclusions
The benefits of recycling are widely accepted, but applying a single strategy based on a catchy slogan might not lead to optimal results. Recycling might work better than reuse for one product, whereas combustion might be the most beneficial alternative for a different product. The results of detailed life-cycle analysis vary somewhat for different locations, newer processes, or different electricity-generation mixes. Although different situations share common characteristics, each one is ultimately unique, and even a careful analysis of the energy use and environmental impacts of the alternatives is not always sufficient. Tradeoffs among environmental and economic benefits must be examined, and institutional constraints and consumer preferences and behaviors must be considered, before the best path forward can be determined.
Acknowledgments
This work was sponsored primarily by the U.S. Department of Energy’s Office of Vehicle Technologies. The submitted article was created by UChicago Argonne, LLC, Operator of Argonne National Laboratory (“Argonne”). Argonne, a U.S. Department of Energy Office of Science laboratory, is operated under Contract No. DE-AC02-06CH11357. The U.S. Government retains for itself, and others acting on its behalf, a paid-up nonexclusive, irrevocable worldwide license in said article to reproduce, prepare derivative works, distribute copies to the public, and perform publicly and display publicly, by or on behalf of the Government.
Definitions
A meaningful discussion of recycling requires a common vocabulary, based on clear and consistent definitions, as follows: Reduce can refer to (1) using or discarding less of a product or (2) decreasing its toxicity during production or in the waste stream. There is no obvious environmental downside to this option. A functioning item (or part thereof) can also be used again in its original form or with minimal alteration. Reuse occurs when the original function is maintained, such as a soft-drink bottle returned for refilling. Adapting an item for new use without changing its essential form or nature (e.g., use of a coffee can as a container for nuts and bolts) is called repurposing. If a product or part requires some cleaning or repair before it can be used again, it is remanufactured or refurbished. Material that can be reused is called reclaimed. Recycling is the transformation of waste (items that are unwanted or perceived as unusable and would otherwise be thrown away) into usable products or materials; it is sometimes referred to as resource recovery. A process can be considered recycling even if it recovers only one useful product from a multicomponent product. It is post-consumer recycling if the materials are generated from consumer waste and pre-consumer recycling if the materials are obtained from manufacturers.
In closed-loop recycling, recovered materials are used to replace virgin raw materials in the same product, possibly going back several steps from the finished product. A special case of closed-loop recycling is direct recycling, in which a material can be put back into the same product with minimal processing. Recycling of lead-acid batteries is an excellent example, in which all of the lead compounds are resmelted and put back in batteries. In contrast to closed-loop recycling, open-loop recycling uses material to produce a different product (e.g., plastic bottles made into drainage pipes). This could mean downcycling, which is converting waste materials into new materials or products of lesser value and reduced functionality compared to the original, or upcycling, which is converting a material into something of greater value in its second life, as in the case of a new process to convert plastic bags into carbon nanotubes.11
Several additional options are available for organic wastes. Wastes or refuse-derived fuel can be burned for energy recovery in a waste-to-energy (WTE) plant or other industrial facility. Wastes can also be burned at high temperature in an incinerator, to destroy potentially hazardous wastes, generating ash, flue gas, and heat. The heat energy can be, but is not always, recovered for useful purposes. Although many people still associate waste combustion with the highly polluting plants prevalent years ago, today’s plants remove pollutants from the flue gas before releasing it to the atmosphere. Organic matter can also be partially decomposed to a gas by digestion or to a humus-like material by composting.
Disposal is the final placement or destruction of wastes, often in landfills.



