





1. Introduction
Incentives are a core aspect of what defines the ‘economics’ part in experimental economics. The basis for incentivization lies in the idea that individuals only show their true preferences if the tasks in the experiment have clear financial implications (Harrison, Reference Harrison and Hey1994; Smith, Reference Smith1976). This idea influences multiple stages of the research process, from experimental design to selection of papers to be published, cited, and read. For example, most economic journals do not publish papers that are based on non-incentivized choices (see, e.g., Azrieli et al., Reference Azrieli, Chambers and Healy2018; Camerer & Hogarth, Reference Camerer and Hogarth1999). In contrast, non-incentivized, hypothetical choices are common in other social sciences such as psychology (see, e.g., Erlandsson, Reference Erlandsson2015, p. 44–46). However, while incentivization is typically seen as essential in economics, the specific implementation of incentive schemes varies widely. In this paper, we report the results of two preregistered experiments designed to compare the behavioral effects of three commonly used incentive schemes – full-payment, random-payment, and no-payment (hypothetical) – across five standard economic games used to assess prosocial behavior. Experiment 1 used low stakes (£1) and Experiment 2 used higher stakes (£10).
The use of incentivized choice tasks is a convention that separates economics from other social sciences, perhaps especially psychology. The difference in methodological convention implies that there is also a difference in the underlying belief about what monetary incentives do. As stated by Camerer and Hogarth (Reference Camerer and Hogarth1999): ‘Economists presume that experimental subjects do not work for free and work harder, more persistently, and more effectively, if they earn more money for better performance. Psychologists believe that intrinsic motivation is usually high enough to produce steady effort even in the absence of financial rewards; and while more money might induce more effort, the effort does not always improve performance’ (p. 7). Thus, incentivized-choice tasks remain the gold standard in experimental economics, whereas no such standard exists in experimental psychology.
Whether and how monetary incentives influence behavior in experiments is an empirical question, and the answer may vary across research designs and the types of tasks and outcome measures involved (for reviews, see, e.g., Camerer & Hogarth, Reference Camerer and Hogarth1999; Hertwig & Ortmann, Reference Hertwig and Ortmann2001; Smith & Walker, Reference Smith and Walker1993). Experiments often involve multiple decisions, meaning that researchers choose not just between whether or not to incentivize, but between different forms of incentive schemes. Researchers may choose to pay all participants for all decisions (a full-payment incentive scheme), all participants for some decisions (a random-payment incentive scheme), or some participants for some or all decisions (sometimes referred to as a between-subject random incentivized system, or BRIS; see, e.g., Thielmann et al., Reference Thielmann, Spadaro and Balliet2020). Theoretically, each of these may have benefits and drawbacks. For example, if the incentive scheme involves some form of randomization, as in the random-payment incentive scheme and BRIS, researchers may be concerned that participants treat a given choice not in terms of its stated payoff but in terms of some fraction of that payoff. On the other hand, if all participants are paid for all decisions, researchers may be concerned about wealth effects and hedging, where participants’ expectations of payment in one decision task influences their decisions in other tasks.
The choice of incentive scheme may be especially important for research on prosocial behavior, because the reputational benefits of acting prosocially may lead to inflated estimates of prosociality if there are no personal costs associated with prosocial behavior. For example, lack of incentives in the Dictator Game or Ultimatum Game makes it cheap to signal generosity or fairness concerns. Still, empirical studies on the effect of incentives in these economic games and other social dilemmas have yielded somewhat mixed results, with a growing number of studies finding that monetary incentives exert limited influence on behavior in standard economic games at typical stake levels. Some researchers have found that monetary incentives (versus no incentives) reduce generosity in the Dictator Game (Amir et al., Reference Amir, Rand and Gal2012; Bühren & Kundt, Reference Bühren and Kundt2015; Clot et al., Reference Clot, Grolleau and Ibanez2018); others have found no effect (Ben-Ner et al., Reference Ben-Ner, Kramer and Levy2008). In the Ultimatum Game, research has found no effect of incentives (versus no incentives) on average offers from the proposer (the first player) or on average minimum acceptable offers for responders (the second player), at least not when stake sizes are small (Amir et al., Reference Amir, Rand and Gal2012; Cameron, Reference Cameron1999), although effects may emerge at higher stakes (Andersen et al., Reference Andersen, Ertaç, Gneezy, Hoffman and List2011; Cameron, Reference Cameron1999). Finally, research has found no effect of incentives (versus no incentives) on decisions in the Trust Game (Amir et al., Reference Amir, Rand and Gal2012; Thielmann et al., Reference Thielmann, Heck and Hilbig2016) or on average contributions in the Public Goods Game (Amir et al., Reference Amir, Rand and Gal2012).
Importantly, much of the previous literature compares incentivized versus hypothetical choices, without distinguishing between different forms of incentivized designs. In particular, it remains unclear whether behavior under random-payment incentive schemes – in which only one of several decisions is randomly selected for payment – resembles that under full-payment (where all choices are incentivized) or hypothetical conditions (where none are). Both full-payment and random-payment schemes are commonly used in economics (Azrieli et al., Reference Azrieli, Chambers and Healy2018), yet their behavioral equivalence is often assumed rather than empirically tested. Charness et al. (Reference Charness, Gneezy and Halladay2016) suggested that full-payment schemes may introduce hedging and distort preferences, advocating random-payment (whether it means paying a subset of participants or for a subset of decisions) as a potentially more incentive-compatible design, a rationale that has supported their widespread adoption. A few studies have tested these claims directly. Clot et al. (Reference Clot, Grolleau and Ibanez2018), for instance, examined a between-subjects random incentivized system (BRIS) and found behavior in a Dictator Game largely comparable to full-payment under standard stakes, although some differences emerged at higher stakes (note that this study involved a single decision, rather than multiple decisions). Similarly, Bolle (Reference Bolle1990) found no difference in Ultimatum Game behavior between pay-all and pay-some incentive schemes. A recent meta-analysis of Dictator Game experiments implementing either a sure-payment incentive scheme (i.e., all participants are paid for all decisions; including studies in which participants only make a single decision) or an incentive scheme involving randomization (either between subjects [BRIS] or between decisions) found no difference in average offers between sure-payment and randomized protocols, suggesting that random-payment protocols and BRIS are comparable to full-payment protocols (Umer, Reference Umer2023). However, this meta-analysis did not include a comparison with hypothetical decisions.
In the end, the choice of incentive scheme may come down to logistical considerations. Even if paying all participants for all decisions were the most optimal option from a theoretical standpoint, doing so is rarely practically feasible. Furthermore, any form of incentive scheme brings with it an administrative burden; sometimes, paying participants is not possible at all for bureaucratic reasons. Thus, comparing the effect of various incentive schemes on behavior in experimental tasks has real, practical implications for researchers.
Additionally, the most consistent effect of incentives – when there is one – may be that incentives reduce the variance of the data around the predicted outcome, that is, reduce noise (Camerer & Hogarth, Reference Camerer and Hogarth1999; Hertwig & Ortmann, Reference Hertwig and Ortmann2001; Smith & Walker, Reference Smith and Walker1993). Incentives may also affect the underlying model of behavior (Berg et al., Reference Berg, Dickhaut and Rietz2010). This in itself could be a rationale for the use of incentives, even if there is no effect on average behavior.
In this paper, we report two experiments in which we compare a full-payment incentive scheme and a no-payment (hypothetical choice) incentive scheme to a random-payment incentive scheme, and investigate their effect on social decision-making in five standard economic games. Participants in both experiments were randomly assigned to one of three conditions: a full-payment incentive condition, in which they were paid for their decisions (and the decisions of other participants) in all games; a random-payment incentive condition, in which they were paid for their decisions (and the decision of other participants) in one randomly selected game; or a no-payment (hypothetical) condition, in which they were not paid for their decisions in any of the games. All participants played (in random order) a series of five economic games commonly used to measure social preferences: the Dictator Game, Ultimatum Game, Trust Game, Public Goods Game, and Prisoner’s Dilemma. We investigate the effect of incentive schemes on behavior in each of these games, as well as a composite measure of prosocial behavior across all games. In Experiment 1, monetary incentives were at the typical stake size for online studies (around £1 per game). In Experiment 2, we increased the stake size by a tenfold (to around £10 per game). The methods and data analysis plans were preregistered on the Open Science Framework (Experiment 1: https://osf.io/eg2j4; Experiment 2: https://osf.io/2q3da/). We report any deviations from the preregistrations in the text and label non-preregistered analyses as exploratory. Data, materials, and code are openly accessible on https://doi.org/10.17605/OSF.IO/PA54Z. We report all measures, conditions, data exclusions, and how we determined sample size.
2. Experiment 1
2.1. Methods
2.1.1. Participants
We requested a sample of 1,500 respondents from Prolific (Palan & Schitter, Reference Palan and Schitter2018) in April 2023. To be eligible for the study, participants had to be fluent in English and have completed at least 50 previous works on Prolific with an acceptance rate of 95% or higher. Participants were only allowed to complete the study on a computer (not a mobile phone or tablet). These pre-screening criteria were selected in Prolific before the study was launched. All participants gave their informed consent before continuing to the study. Participants were paid £1.50 for completing the study (based on the hourly rate suggested by Prolific for a study with estimated completion time of about 10 minutes). In addition, participants assigned to the random-payment incentive scheme and full-payment incentive scheme received a bonus payment based on their decisions (and the decisions of other participants) in one or all games, respectively (see section 2.1.2 Experimental design).
We received 1,502 responses. Of these, we discovered one response that had the same participant ID as a previous submission. We kept the first submission and excluded the response that was submitted later (based on the EndDate column in the Qualtrics output file). The final sample included 1,501 responses. Demographic information is provided in Table 1.
Sample characteristics (Experiment 1)
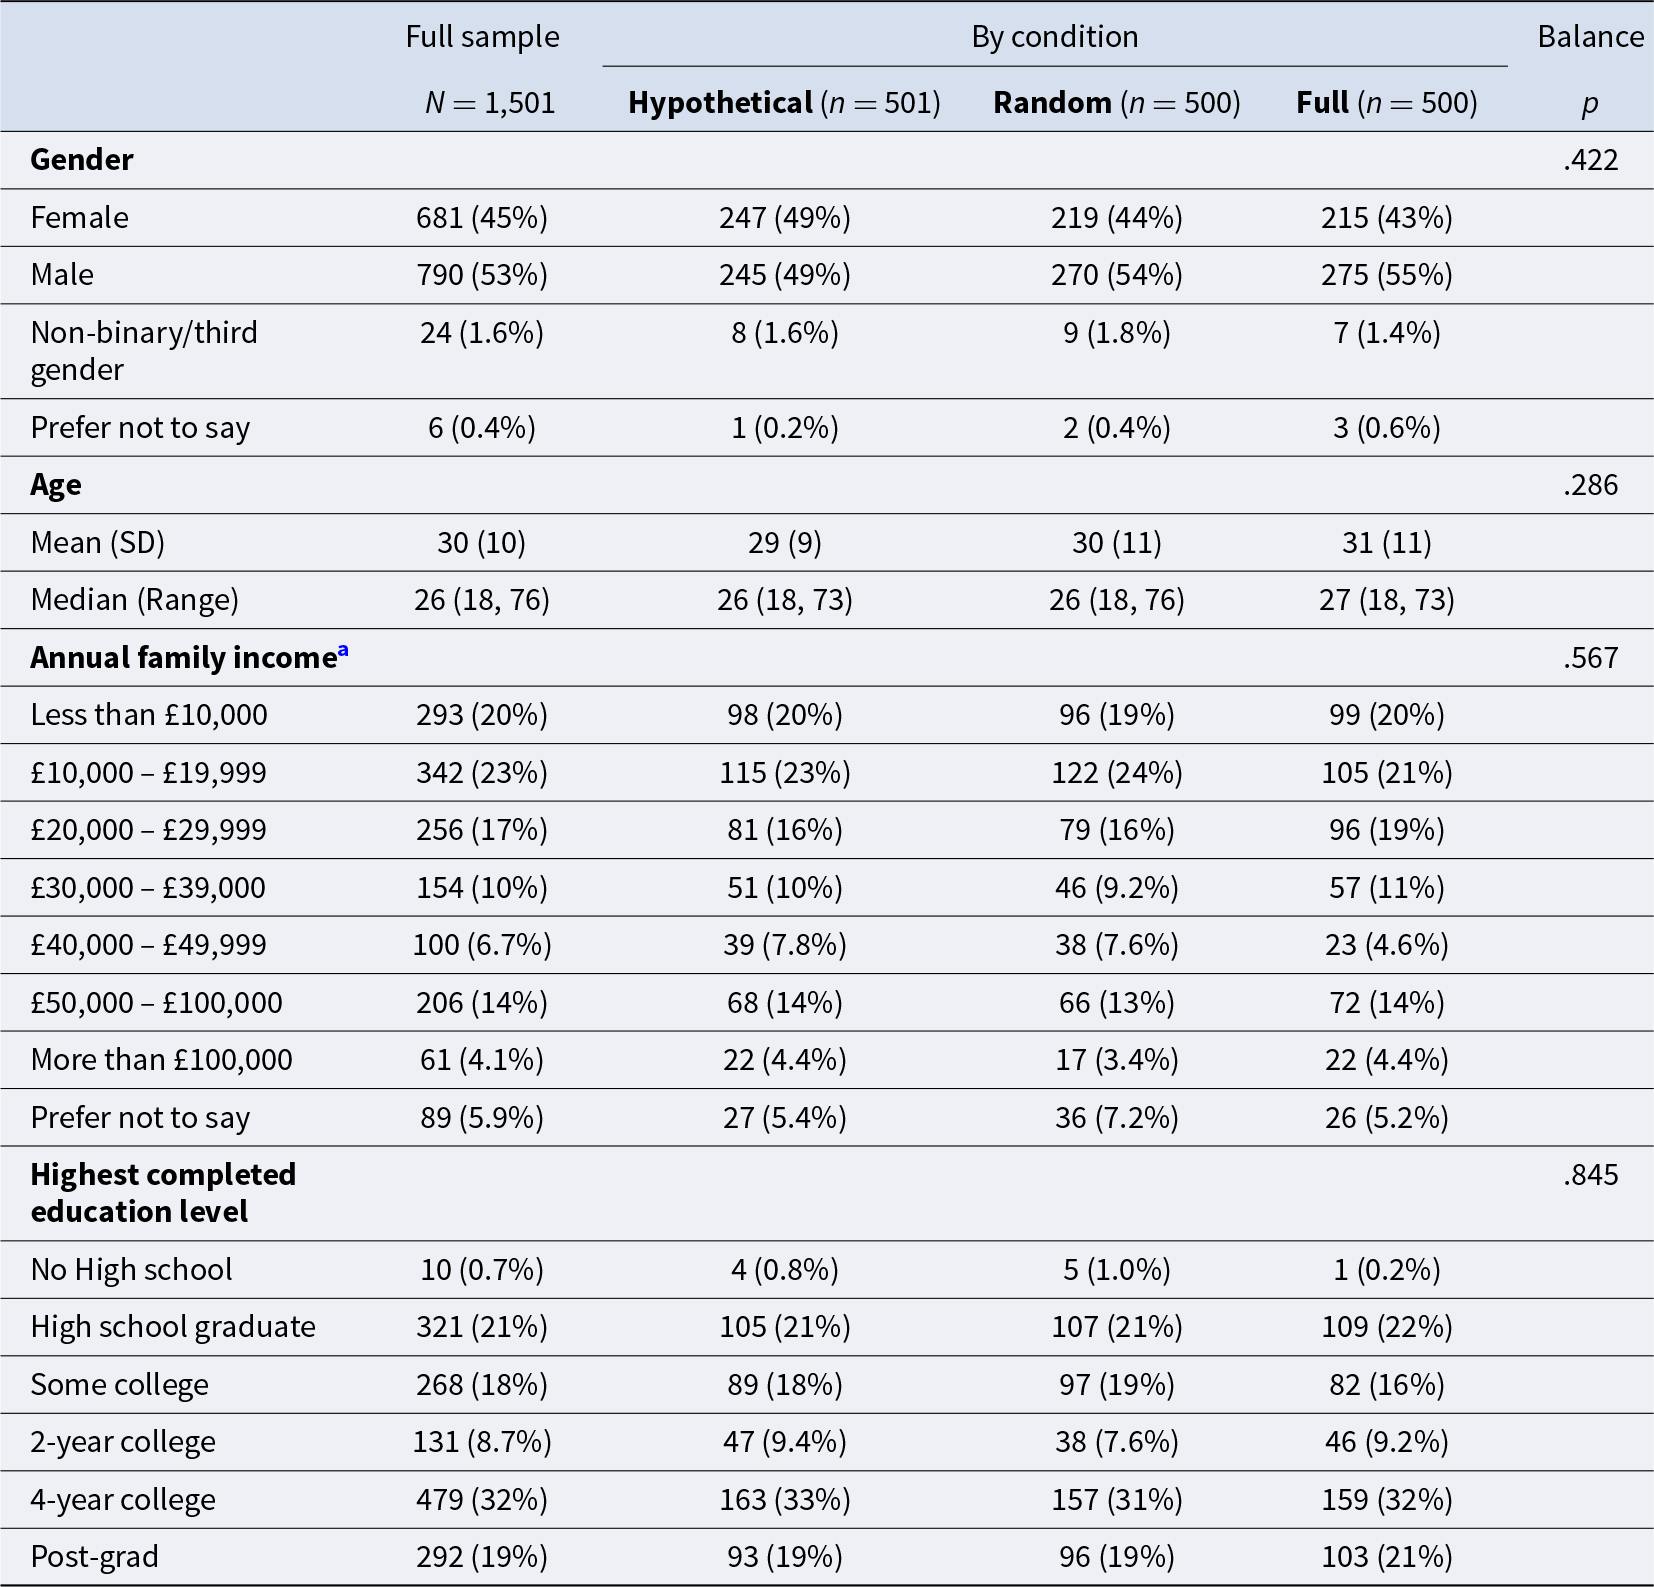
a Due to a typo in the script, the middle category had an upper bound of £39,000 rather than £39,999.
Notes: p-values refer to tests of balance across conditions. Gender (Male and Female) and education level were compared using Fisher’s exact tests; for education level, the p-value was estimated via Monte Carlo simulation with 5,000 replications to account for the complexity of the contingency table. Age was compared using the Kruskal–Wallis test, H(2) = 2.50. Income levels were compared using Pearson’s chi-squared test, χ 2(14) = 12.49.
2.1.2. Experimental design
At the start of the study, participants were randomly assigned to one of three conditions, determining their payment from the study. All participants were informed that they would complete a series of tasks in which they would be asked to distribute money between themselves and other participants, and that they would receive a payment of £1.50 for completing the study. In addition, participants assigned to the full-payment incentive scheme were informed that they would receive a bonus payment based on their decisions in each of the tasks. Participants assigned to the random-payment incentive scheme were informed that they would receive a bonus payment based on their decisions in one randomly selected task. Participants assigned to the no-payment (hypothetical) incentive scheme received no additional bonus payment based on their decisions in the tasks, but instead were instructed to ‘Imagine that you influence the payment of money to yourself and other participants in the experiment’. This phrasing was based on instructions from a previous study comparing hypothetical and incentivized social preferences (Bühren & Kundt, Reference Bühren and Kundt2015). Participants were informed of the payment scheme at the start of the study and again as a reminder before each game. For complete instructions, see Supplementary material.
All participants played all five games (see below). The presentation order of the games was randomized. Instructions for the games were based on a set of standardized instructions developed by Thielmann et al. (Reference Thielmann, Böhm, Ott and Hilbig2021), who based their standardized instructions on instructions from studies published in high-ranking journals and/or provided by other researchers in the field. One attention check question was included in the study and was presented randomly among the games. The attention check asked participants to select ‘milk’ as their favorite drink among a list of six options. Finally, participants answered a set of demographic questions, including age, gender, income, and education.
2.1.3. Games
Dictator Game. In the Dictator Game, participants were randomly paired with one other participant and were asked to distribute £1.00 between themselves and the other participant. Participants were asked to enter the amount in pence and could enter any amount (whole numbers only) between 0 and 100. The outcome measure for data analysis was participants’ contribution, as a percentage of the starting endowment.
Public Goods Game. In the Public Goods Game, participants were randomly assigned to a group with three other participants and were asked how much of an endowment of £1.00 to contribute to a group account. Any amount contributed to the group account was doubled and equally distributed among all four group members. Participants were asked to enter the amount in pence. The outcome measure was participants’ contribution, as a percentage of the starting endowment.
Prisoner’s Dilemma. In the Prisoner’s Dilemma, participants were randomly paired with one other participant. Both participants simultaneously chose between option A (cooperate) and option B (defect). If both players chose option A, each player received £1.00. If both players chose option B, each player received £0.50. If one player chose option A and the other chose option B, the participant who chose A received £0 and the participant who chose B received £1.50. The outcome measure for data analysis was the percentage of participants choosing option A (cooperate).
Ultimatum Game. In the Ultimatum Game, participants were randomly assigned to one of two roles: proposer or responder. Proposers were endowed with £1.00 and were asked to propose how much of this endowment to offer to the responder. They were asked to enter the amount in pence. Responders were asked to accept or reject the proposer’s offer, using the strategy method to elicit their responses (i.e., responders were asked to accept or reject each possible offer from the proposer using the following intervals: 0–9 pence, 10–19 pence, 20–29 pence, 30–39 pence, 40–49 pence, 50 pence, 51–60 pence, 61–70 pence, 71–80 pence, 81–90 pence, 91–100 pence).
For proposers, the outcome measure was the amount offered to the responder, as a percentage of the starting endowment. For responders, the outcome measure was the minimum offer from the proposer for which they chose accept (i.e., the switching point). Responders with multiple switching points or who switched from accept to reject as offers increased (n = 106) were excluded from analyses of Ultimatum Game behavior. This decision was specified in the preregistration.
Trust Game. In the Trust Game, participants were randomly assigned to one of two roles: sender or receiver. Both players were endowed with £0.90. The sender was asked to choose how much to transfer to the receiver: £0, £0.30, £0.60, or £0.90. The transferred amount was tripled in the receiver’s account. The receiver then chose how much of the tripled transfer to return to the sender, using the strategy method (i.e., they decided how much to return for each of the possible non-zero transfers from the sender).
For senders, the outcome measure was the amount transferred to the receiver, as a percentage of the starting endowment. Although senders could enter any amount (in whole pence) between 0 and 90, the actual transfer amounts possible were fixed at 0, 30, 60, or 90. If the sender entered any other amount, it was recoded during data analysis to the closest of the four fixed amounts. For example, a transfer of 40p was interpreted as 30p and a transfer of 50p was interpreted as 60p. If the sender entered an amount that was exactly in between two of the fixed amounts, it was interpreted as the closest lower value. For example, 75p was interpreted as 60p. These decisions were specified in the preregistration.
For receivers, the outcome measure was the fraction (in %) sent back to the sender out of the total possible amount across the three items. That is, we calculate the sum total of the receiver’s back-transfers and divided this number by the sum total of the maximum possible back-transfers.Footnote 1 We also conduct exploratory (non-preregistered) analyses where the outcome measure is the fraction sent back to the sender when the sender transfers the maximum amount possible (90p); results from these analyses are consistent with the main analyses (see Supplementary Table S2).
2.1.4. Data analysis
We report descriptive statistics for each game and condition, as well as aggregated across games (representing an index of overall prosocial behavior). For the composite measure of prosocial behavior, we standardized each outcome measure into a z-score and calculated the mean of these z-scores (for Ultimatum Game responders, we used the reversed z-score). For Ultimatum Game responders with multiple switching points or who switched from accept to reject as offers increased (n = 106), the composite measure was created from all other games except the Ultimatum Game. For correlations among the measures, see Supplementary Table S1.
To investigate differences in prosocial behavior between the three incentive schemes, we performed OLS regressions with prosocial behavior (the composite measure) as dependent variable and condition as predictor variable. The reference category for condition was the random-payment incentive scheme in the main analyses (as preregistered); a comparison between the no-payment and full-payment schemes was added on reviewer request (and thus was not preregistered). A second model also included age and gender as control variables (excluding participants who answered ‘non-binary/third gender’ [n = 24] or ‘prefer not to say’ [n = 6] on the question about gender). We then ran separate regressions for each of the games (logistic regression for the Prisoner’s Dilemma; OLS regressions for all other games). We ran these regressions first without and then with the control variables age and gender (again excluding participants who answered ‘non-binary/third gender’ or ‘prefer not to say’ on the question about gender). As a robustness test, we repeated all regression analyses while excluding participants (n = 96) who failed the attention check.
2.2. Results
2.2.1. Does the average level of prosocial behavior differ between incentive schemes?
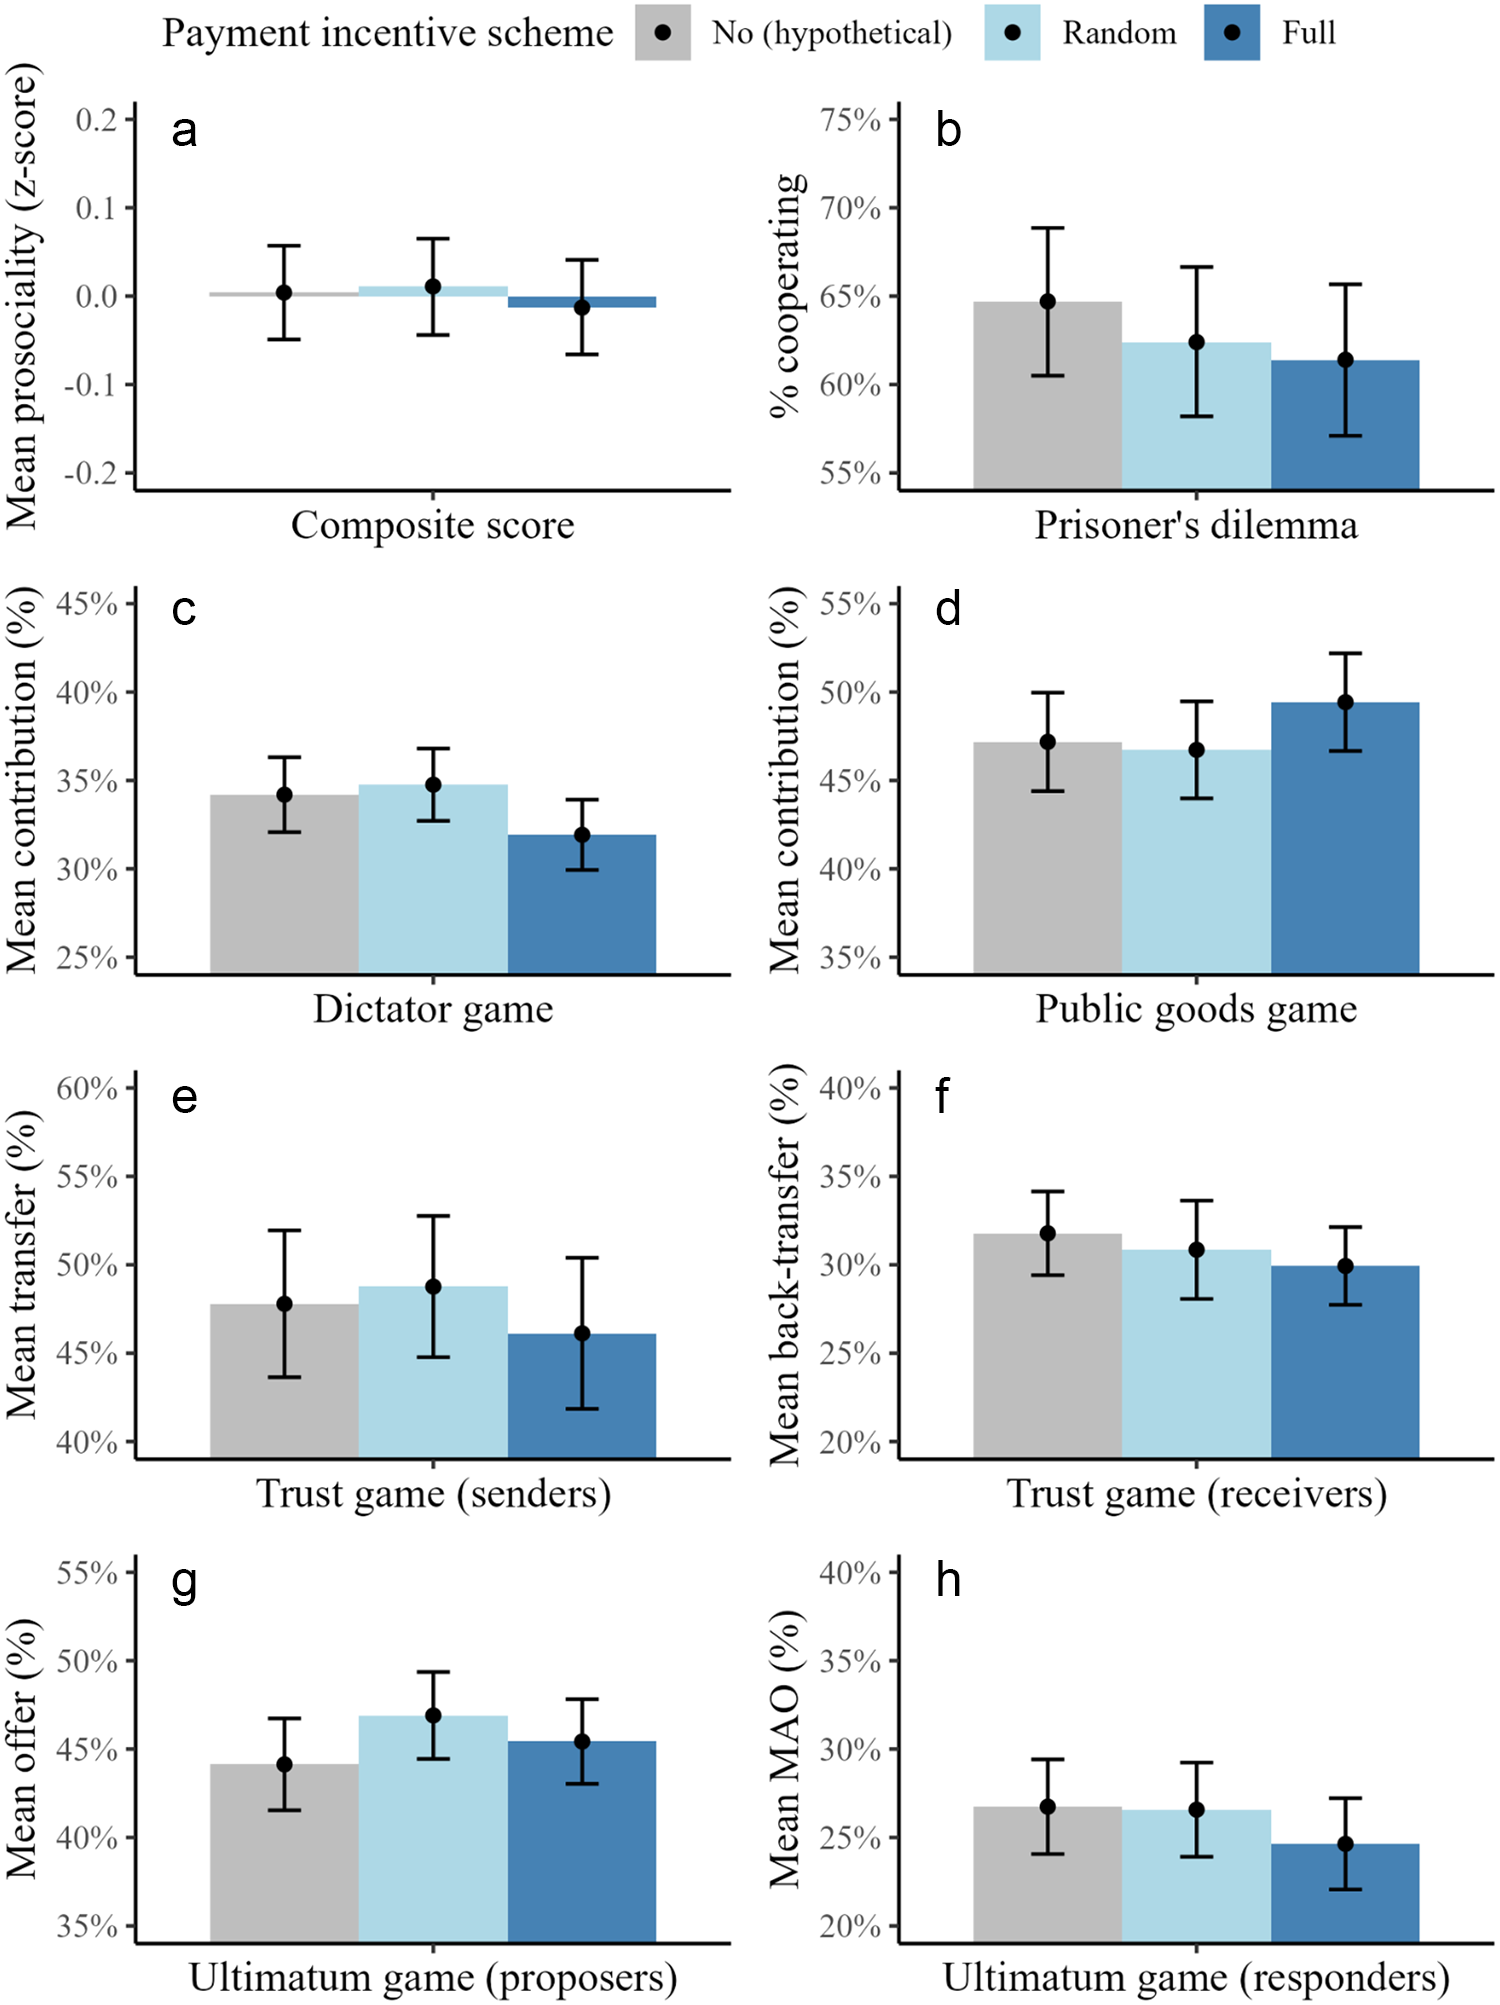
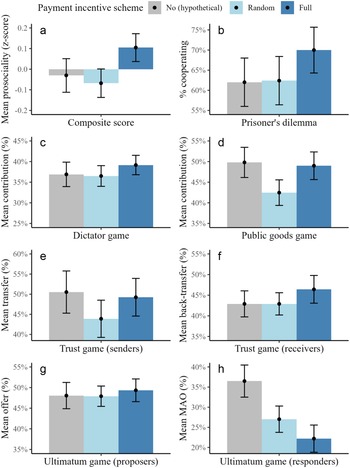
Figure 1 shows the average level of prosocial behavior in each game and condition, as well as aggregated across all games (composite measure). Table 2 shows the regression results. Relative to the random-payment incentive scheme, neither the full-payment incentive scheme nor the no-payment (hypothetical) incentive scheme significantly predicted behavior in any of the games or the composite measure, neither before nor after adjusting for age and gender (full-payment incentive scheme: B range – 2.836 to 3.058; no-payment [hypothetical] incentive scheme: B range – 2.767 to 1.510; all ps > .05). There also was no statistically significant difference in prosocial behavior between the full-payment incentive scheme and hypothetical decisions (exploratory analysis; B range – 2.8 to 2.2; all ps > .05). Results did not change after excluding participants (n = 96) who failed the attention check (see Supplementary Table S3).
Level of prosocial behavior in each game and condition (Experiment 1). Error bars represent 95% confidence intervals. (a) Mean prosociality across all games (composite measure; n = 1501). (b) Percentage of participants choosing option A (cooperate) in the Prisoner’s Dilemma (n = 1501). (c) Mean contribution (% of the endowment) in the Dictator Game (n = 1501). (d) Mean contribution (% of the endowment) in the Public Goods Game (n = 1501). (e) Mean transfer (% of the endowment) in the Trust Game (for participants assigned to the role of sender; n = 751). (f) Mean back-transfers (% of total possible back-transfers across all possible non-zero transfers from the sender) in the Trust Game (for participants assigned to the role of receiver; n = 750). (g) Mean offer (% of the endowment) in the Ultimatum Game (for participants assigned to the role of proposer; n = 753). (h) Mean minimum acceptable offer (MAO; % of the proposer’s endowment) in the Ultimatum Game (for participants assigned to the role of responder; n = 642)
Results from regression analyses of behavior in the games (Experiment 1)
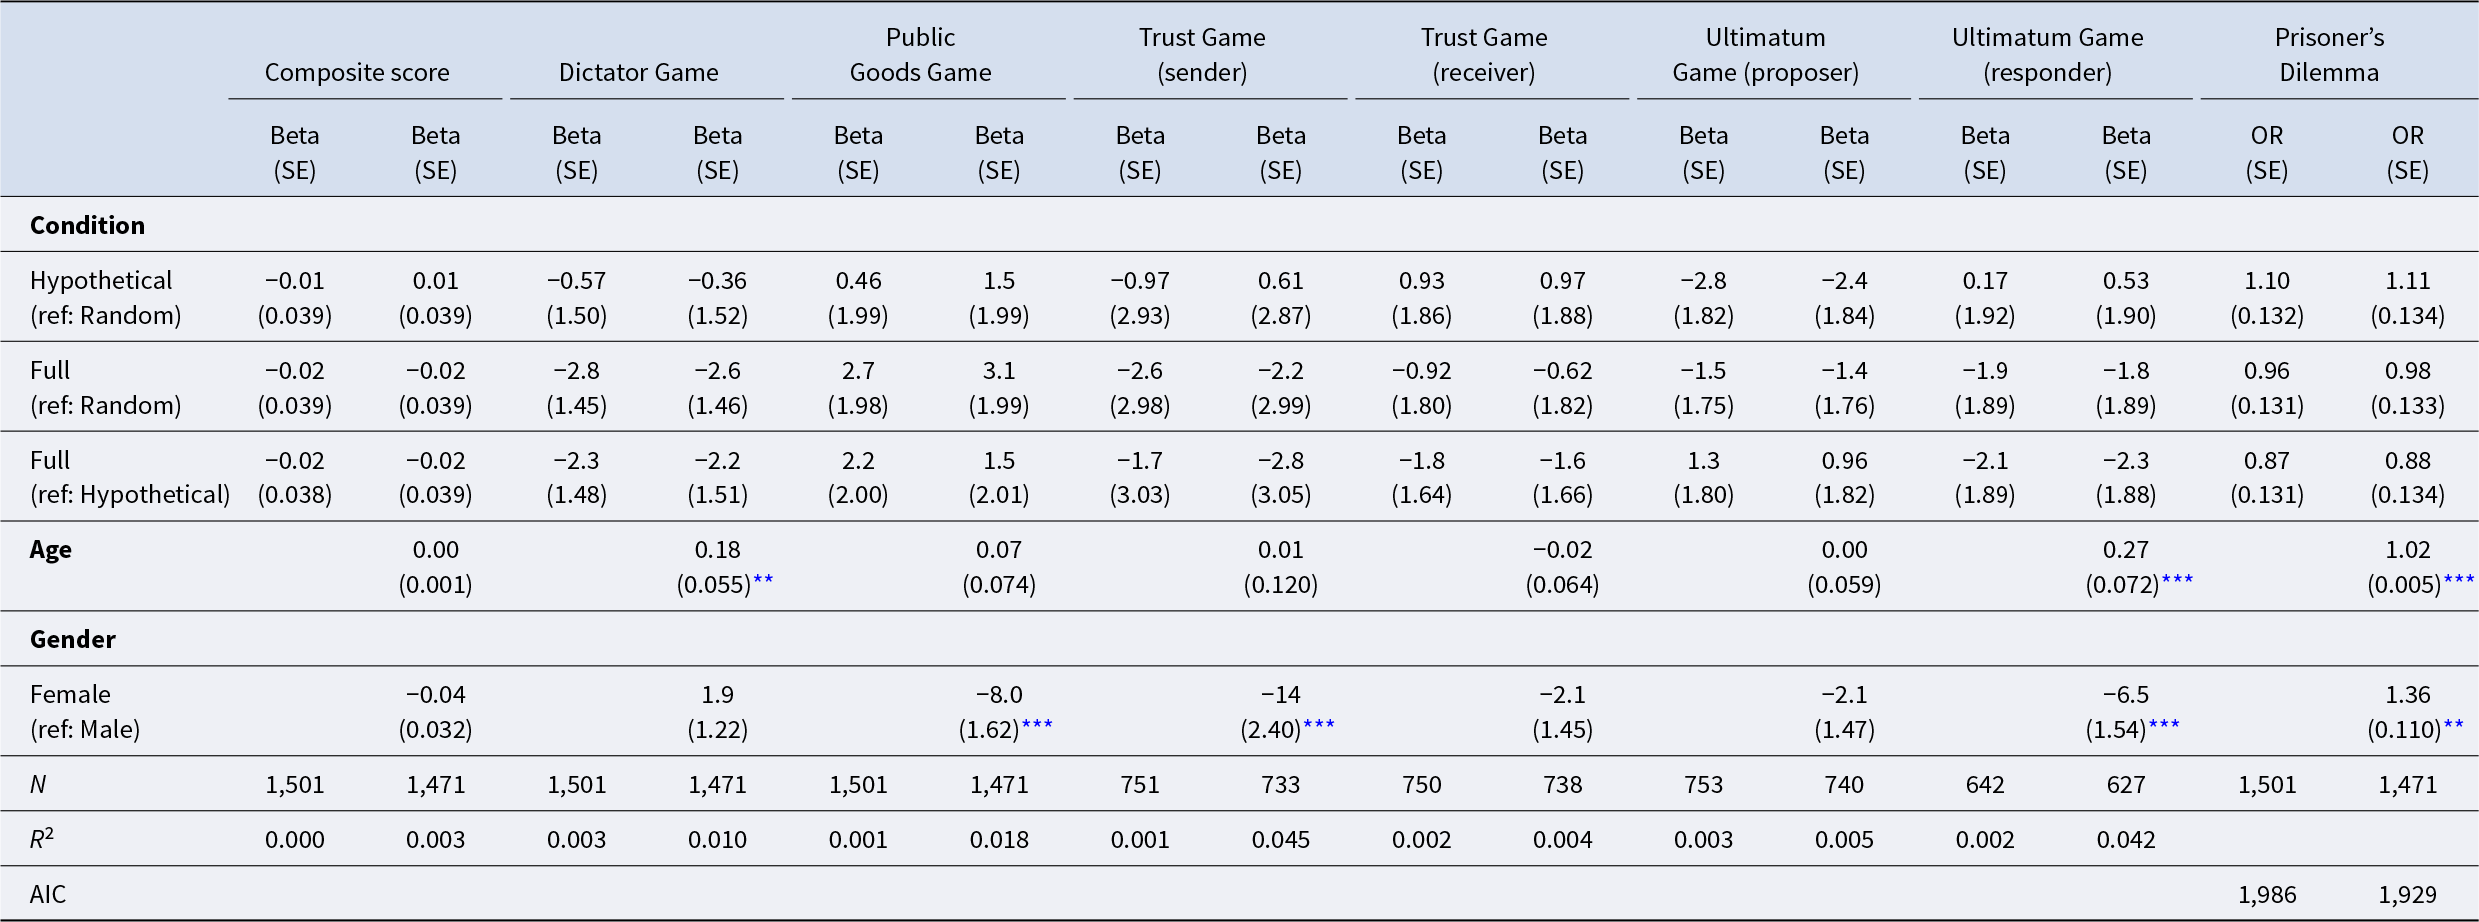
Notes: This table shows results from regression analyses of behavior in the games (logistic regression for the Prisoner’s Dilemma; OLS regressions for all other games and the composite measure; robust standard errors in parentheses). The first two rows show estimates from models with the Random incentive scheme as reference condition and the third row shows estimates from a model with Hypothetical as the reference condition. OR = Odds ratio. In the Dictator Game, the dependent variable (DV) is the participant’s contribution to the other player (% of the endowment). In the Public Goods Game, the DV is the participant’s contribution to the group account (% of the endowment). For Trust Game senders, the DV is an ordinal variable indicating the % of the endowment transferred to the receiver (with possible values 0%, 33%, 67%, or 100%). For Trust Game receivers, the DV is the % of the total possible back-transfer that the participant transferred to the sender (i.e., across all possible non-zero transfers from the sender). For Ultimatum Game proposers, the DV is the amount offered to the responder (% of the endowment). For Ultimatum Game responders, the DV is the minimum acceptable offer from the proposer (i.e., the switching point; % of the proposer’s endowment). In the Prisoner’s Dilemma, the DV is a binary variable, coded as 1 if the participant chose A (cooperate) and 0 if they chose B (defect). For the composite measure of prosocial behavior, each DV was standardized into a z-score and averaged. Hypothetical is the no-payment (hypothetical) incentive scheme; Full is the full-payment incentive scheme; both variables are coded as binary variables with the random-payment incentive scheme as the reference category. Age is the participant’s age in years. Female is a gender dummy.
** p < .01, *** p < .001.
To further examine the absence of effects, we conducted exploratory (i.e., not preregistered) equivalence tests using the two one-sided t tests (TOST) procedure. Power analyses (using the TOSTER R package; Caldwell, Reference Caldwell2022; Lakens, Reference Lakens2017) showed that to achieve 80% power, 429 respondents per group are needed to test an equivalence bound of 0.2, 191 respondents per group to test an equivalence bound of 0.3, and 108 respondents per group to test an equivalence bound of 0.4. For each comparison in the main regressions (Table 2), we ran equivalence tests using the smallest of these three equivalence bounds that would be detectable given the sample sizes. Tests were bootstrapped with 5000 replications. Results are presented in Supplementary Table S4. All but one test were significant (ps < .05), indicating evidence for no meaningful true effects, in line with the regression analyses. The exception was the comparison between random-payment and full-payment in the Dictator Game, where the equivalence test was not significant and thus results are inconclusive.
2.2.2. Does the distribution of responses differ between incentive schemes? (exploratory analysis)
Previous research has suggested that increasing the stake size reduces hyper-altruistic behavior (e.g., Brañas-Garza, Jorrat, et al., Reference Brañas-Garza, Estepa-Mohedano, Jorrat, Orozco and Rascón-Ramírez2021). To investigate this possibility, we plotted the distribution of responses for each game and incentive scheme and compared the distributions across incentive schemes (see Supplementary Figure S1; for cumulative distributions, see Supplementary Figure S2). These analyses were not preregistered. Kolmogorov-Smirnov tests (for continuous variables) and Kruskal-Wallis tests (for non-continuous variables; i.e., Trust Game senders and Ultimatum Game responders) revealed no statistically significant differences in any of the games between the random-payment incentive scheme and the no-payment (hypothetical) incentive scheme (Dictator Game: D = 0.033, p = .948; Public Goods Game: D = 0.02, p > .999; Ultimatum Game proposers: D = 0.069, p = .594; Ultimatum Game responders: H(1) = 0.052, p = 0.819; Trust Game senders: H(1) = 0.049, p = 0.825; Trust Game receivers: D = 0.092, p = .265), between the random-payment incentive scheme and the full-payment incentive scheme (Dictator Game: D = 0.054, p = .460; Public Goods Game: D = 0.07, p = .172; Ultimatum Game proposers: D = 0.038, p = .995; Ultimatum Game responders: H(1) = 0.786, p = 0.375; Trust Game senders: H(1) = 0.594, p = .440; Trust Game receivers: D = 0.055, p = .853), or between the no-payment and full-payment incentive schemes (Dictator Game: D = 0.046, p = .655; Public Goods Game: D = 0.073, p = .137; Ultimatum Game proposers: D = 0.059, p = .762; Ultimatum Game responders: H(1) = 1.321, p = .250; Trust Game senders: H(1) = 0.293, p = .588; Trust Game receivers: D = 0.07, p = .853). Exploratory (non-preregistered) tests for first-order stochastic dominance (Barrett & Donald, Reference Barrett and Donald2003; Schaub, Reference Schaub2024) indicated that the full-payment incentive scheme dominated the random-payment and no-payment incentive schemes in the Public Goods Game (see Supplementary Figure S2; for full output from these tests, see Supplementary Table S5).
2.2.3. Do incentive schemes affect the variance of the data? (exploratory analysis)
Previous research has suggested that financial incentives reduce the variance of the data around the predicted outcome (Camerer & Hogarth, Reference Camerer and Hogarth1999; Hertwig & Ortmann, Reference Hertwig and Ortmann2001; Smith & Walker, Reference Smith and Walker1993). To investigate whether there was a difference in the variance of the data between incentive schemes, we performed a Levene’s test of homogeneity of variances for each outcome measure. This test was not preregistered. Results revealed no statistically significant differences in any of the games (Dictator Game: F(2, 1498) = 0.623, p = .536; Public Goods Game: F(2, 1498) = 0.489, p = .613; Trust Game sender: F(2, 748) = 0.112, p = .894; Trust Game receiver: F(2, 747) = 1.632, p = .196; Ultimatum Game proposer: F(2, 750) = 1.351, p = .260; Ultimatum Game responder: F(2, 639) = 0.495, p = .610).
3. Experiment 2
In Experiment 1, we found no statistically significant differences in prosocial behavior between a no-payment incentive scheme and a full-payment incentive scheme, relative to a random-payment incentive scheme. A question that begs to be asked in light of these findings is what would happen if the stake size were increased. Could the absence of a difference in behavior between the incentive schemes be attributed to £1 being too trivial for people to care about? Although £1 is at the typical level of stakes for online studies, making our conclusions applicable to existing experimental literature on prosocial behavior, it is still possible that incentive schemes affect decisions with higher stakes. For example, rejection rates of unfair offers in the Ultimatum Game have been shown to decline when stakes increase to levels far exceeding those typically used in lab settings (Andersen et al., Reference Andersen, Ertaç, Gneezy, Hoffman and List2011; Cameron, Reference Cameron1999), suggesting that the influence of monetary incentives on responder behavior may become more pronounced when stake sizes are high. Furthermore, a recent meta-analysis of Dictator Game giving and Ultimatum Game offers found a small but significant negative effect of stake size in the Dictator Game (i.e., contributions decreased with increasing stake size), although there was no effect in the Ultimatum Game (Larney et al., Reference Larney, Rotella and Barclay2019). All studies in the meta-analysis involved real monetary stakes, although the analysis did not differentiate between different forms of incentive schemes. Thus, it remains an open question whether incentive schemes affect social decision making involving higher stakes. Therefore, in Experiment 2, we repeated Experiment 1 but increased the stake size tenfold.
3.1. Methods
3.1.1. Participants
We requested a sample of 750 respondents from Prolific (Palan & Schitter, Reference Palan and Schitter2018) in April 2024. The tenfold increase in stakes compared to Experiment 1 introduced a necessary tradeoff between sample size and incentive level to keep the study financially viable. A power calculation in G*Power 3.1 indicated that a sample size of 250 participants per group provides statistical power of 80% to detect an effect size of d = 0.25 in a two-sided between-subjects t-test with α = .05. As in Experiment 1, to be eligible for the study, participants had to be fluent in English and have completed at least 50 previous works on Prolific with an acceptance rate of 95% or higher. Individuals who participated in the previous study were also excluded. Participants were only allowed to complete the study on a computer (not a mobile phone or tablet). These pre-screening criteria were selected in Prolific before the study was launched. All participants gave their informed consent before continuing to the study. Participants were paid £1.50 for completing the study (based on the hourly rate suggested by Prolific for a study with estimated completion time of about 10 minutes). In addition, participants assigned to the random-payment incentive scheme and full-payment incentive scheme received a bonus payment based on their decisions (and the decisions of other participants) in one or all games, respectively (see section 2.1.2 Experimental design).
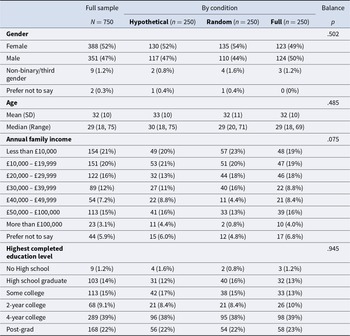
We received 751 responses. Of these, we discovered one response that had the same participant ID as a previous submission. We kept the first submission and excluded the response that was submitted later (based on the EndDate column in the Qualtrics output file). The final sample included 750 responses. Demographic information is provided in Table 3.
Sample characteristics (Experiment 2)
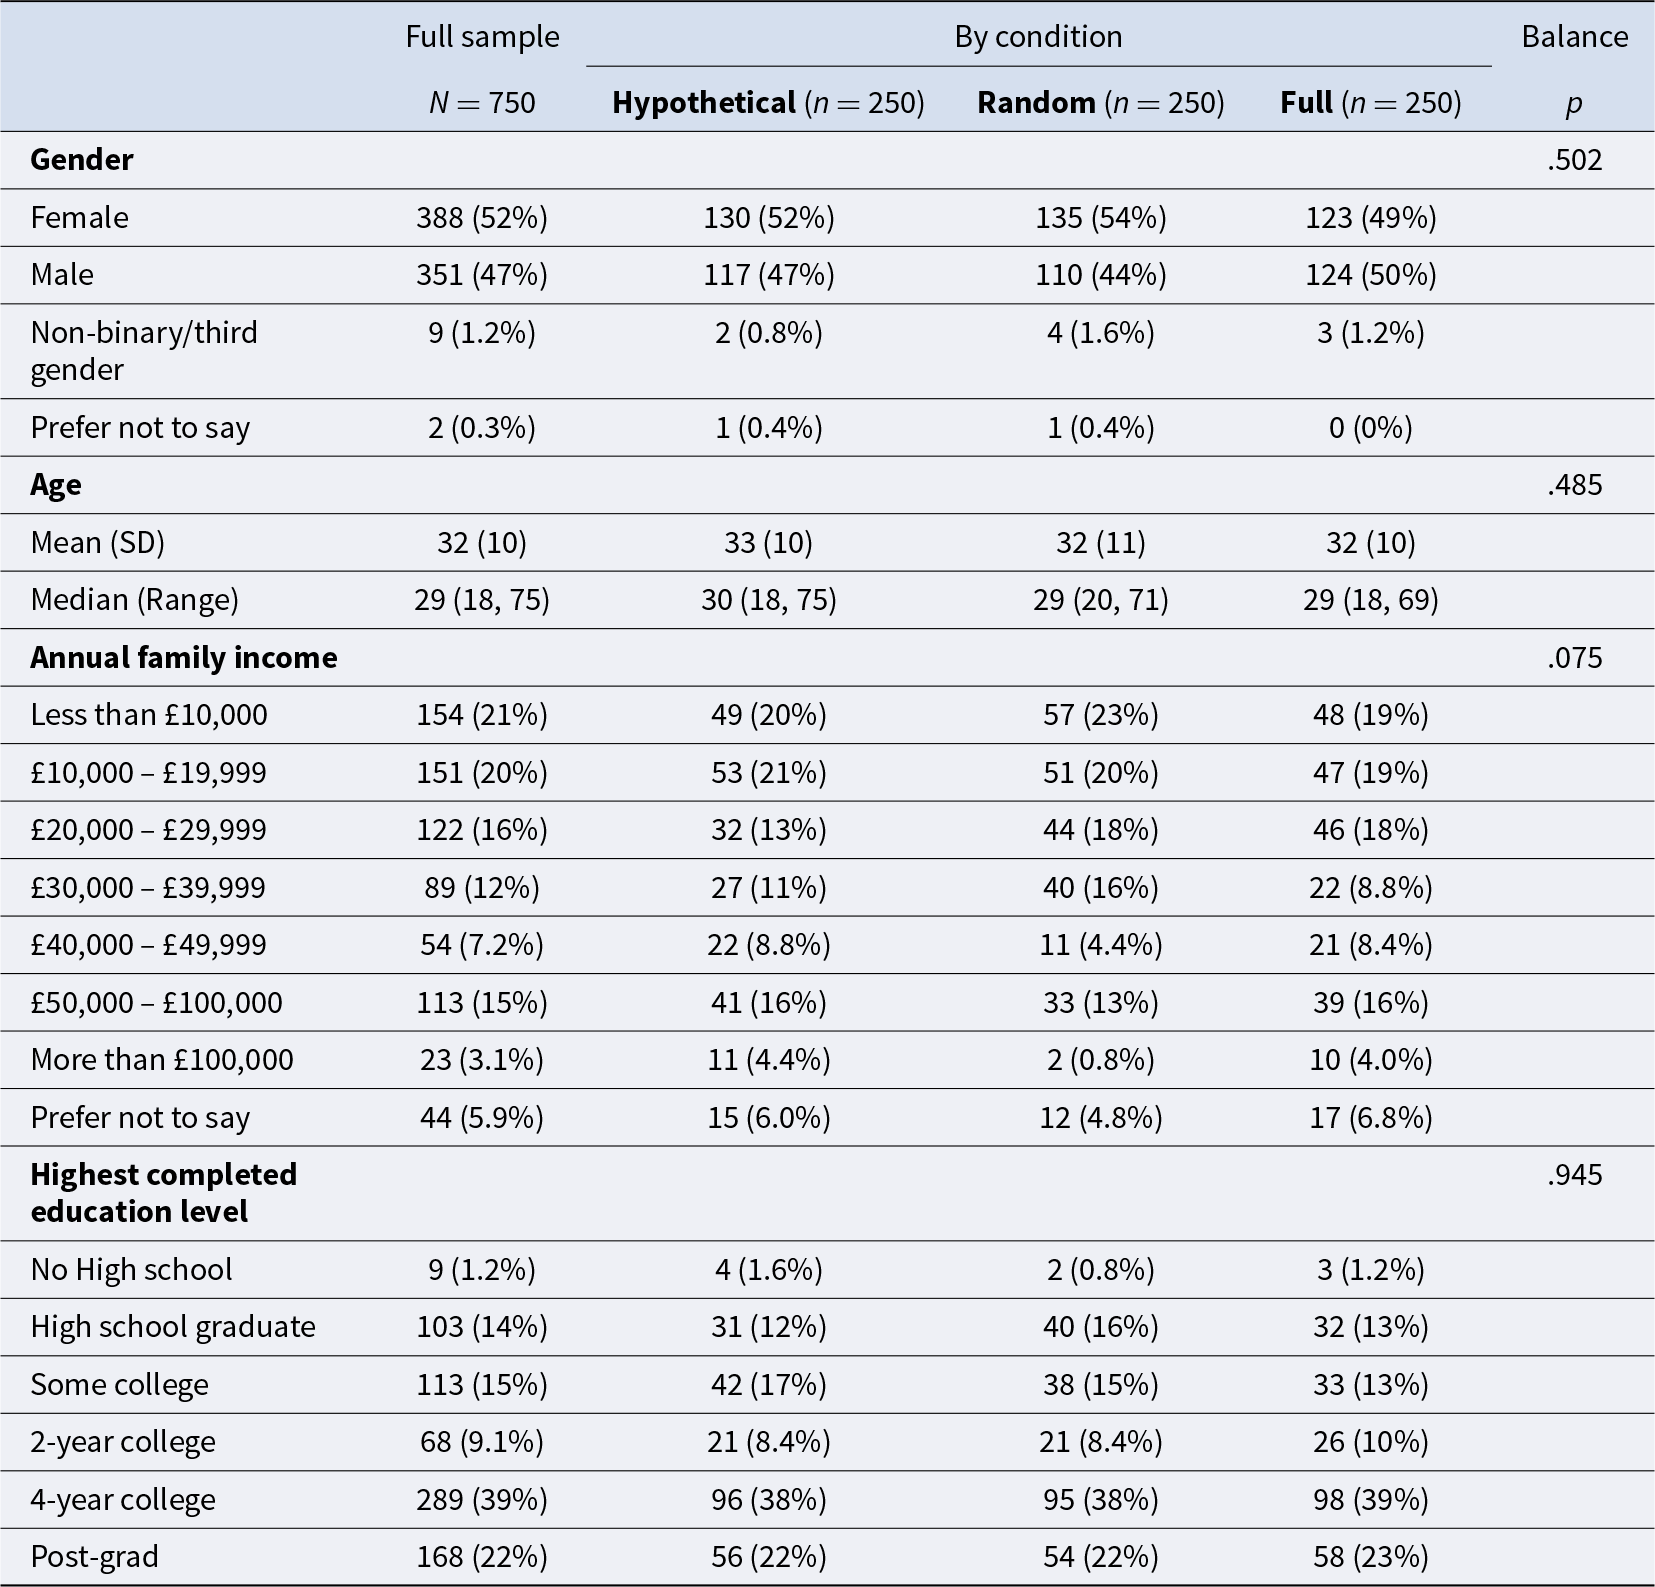
Notes: p-values refer to tests of balance across conditions. Gender (Male and Female) and education level were compared using Fisher’s exact tests; for education level, the p-value was estimated via Monte Carlo simulation with 5,000 replications to account for the complexity of the contingency table. Age was compared using the Kruskal–Wallis test, H(2) = 1.45. Income levels were compared using Pearson’s chi-squared test, χ 2(14) = 22.20.
3.1.2. Experimental design
The experimental design followed Experiment 1, except for the following changes: (1) endowments in all games were multiplied by 10; (2) participants were asked to enter amounts in pounds (rather than pence as in the previous study); and (3) we corrected an error in the Trust Game where the amount that receivers could enter into the response box ranged from zero to the tripled transfer plus the starting endowment, so that it only ranged from zero to the tripled transfer. We also corrected a typo in the question about income. For complete instructions, see Supplementary Materials.
3.1.3. Data analysis
Data analysis followed Experiment 1, except some of the analyses that were previously exploratory (non-preregistered; see sections 2.2.2 and 2.2.3) were preregistered for this study. For correlations among the measures that were included in the composite score of prosocial behavior, see Supplementary Table S6. As in Experiment 1, for Ultimatum Game responders with multiple switching points or who switched from accept to reject as offers increased (n = 59), the composite measure was created from all other games except the Ultimatum Game.
3.2. Results
3.2.1. Does the average level of prosocial behavior differ between incentive schemes?
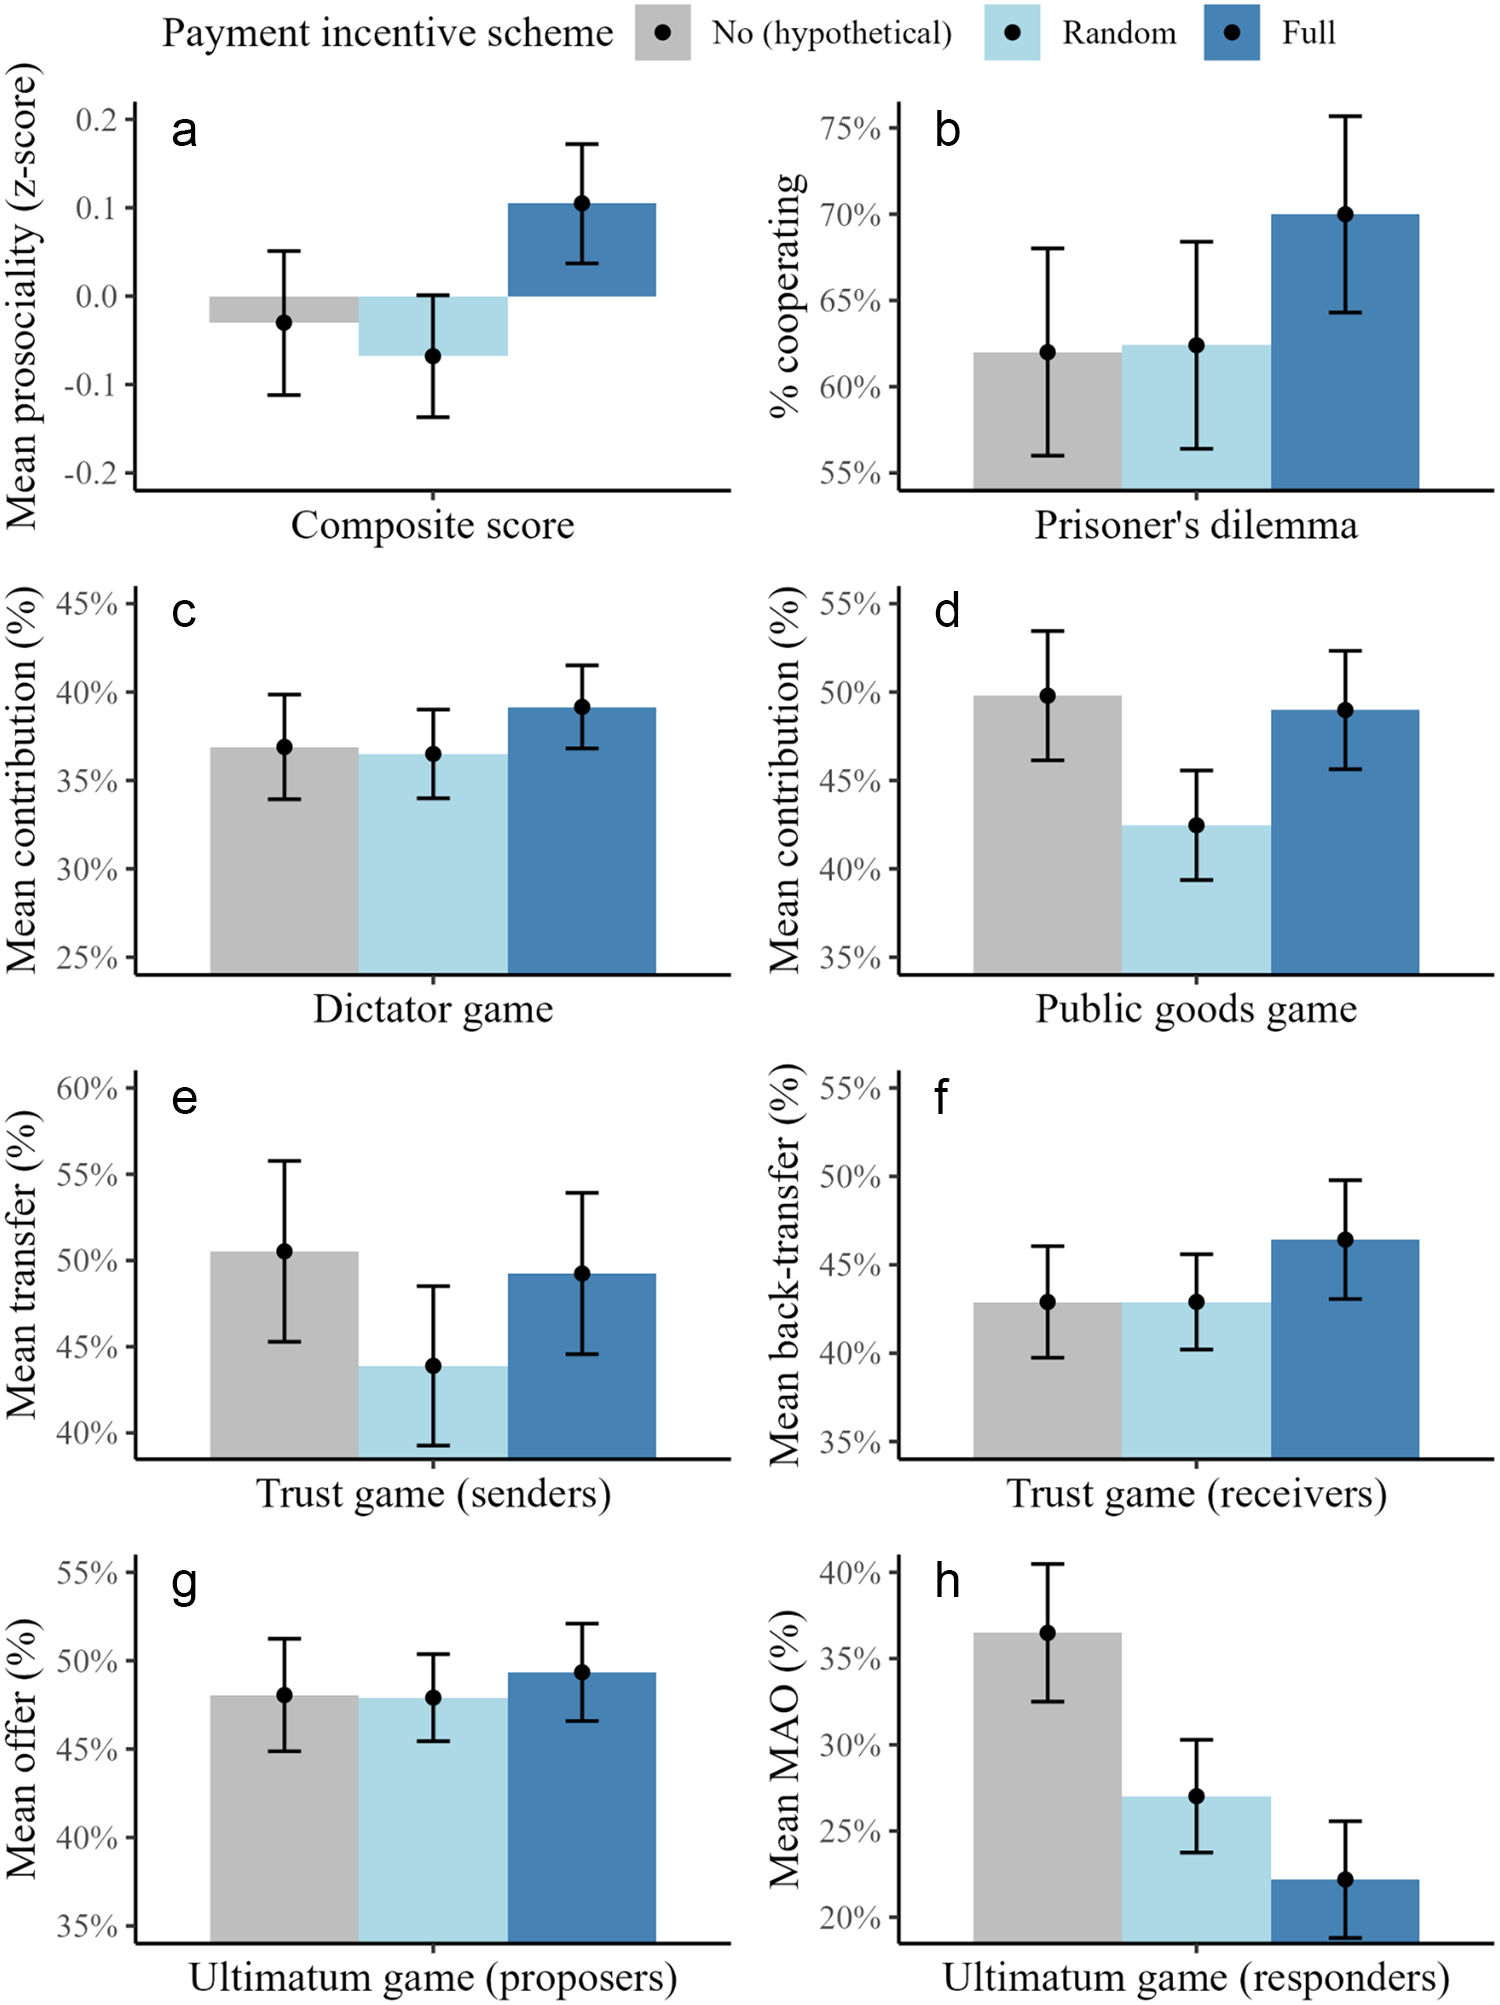
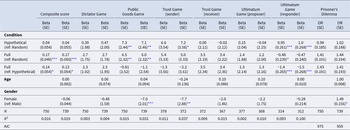
Figure 2 shows the average level of prosocial behavior in each game and condition, as well as aggregated across all games (composite measure). Table 4 shows the regression results. Consistent with Experiment 1, there was no statistically significant difference between incentive schemes in the Dictator Game, Prisoner’s dilemma, or Trust Game (for either senders or receivers, although there was a significant effect for senders after controlling for age and gender [see Table 4]). In all cases, p-values exceeded .05, suggesting that even with a tenfold increase in stakes from £1 to £10, prosocial behavior in these tasks was not affected by the form of incentive scheme. However, unlike in Experiment 1, we did find statistically significant differences in the Ultimatum Game, specifically for responders: Compared to participants in the random-payment incentive scheme, participants in the hypothetical incentive scheme had higher minimum acceptable offers (MAOs; B = 0.95, p < .001), and participants in the full-payment scheme had lower MAOs (B = − 0.48, p = .044; although this effect was no longer statistically significant after controlling for age and gender). Participants in the full-payment incentive scheme also had lower MAOs than participants in the hypothetical incentive scheme (exploratory analysis; B = − 1.4, p < .001). In line with Experiment 1, there were no statistically significant differences between incentive schemes for participants playing in the role of proposer.
Level of prosocial behavior in each game and condition (Experiment 2). Error bars represent 95% confidence intervals. (a) Mean prosociality across all games (composite measure; n = 750). (b) Percentage of participants choosing option A (cooperate) in the Prisoner’s Dilemma (n = 750). (c) Mean contribution (% of the endowment) in the Dictator Game (n = 750). (d) Mean contribution (% of the endowment) in the Public Goods Game (n = 750). (e) Mean transfer (% of the endowment) in the Trust Game (for participants assigned to the role of sender; n = 378). (f) Mean back-transfers (% of total possible back-transfers across all possible non-zero transfers from the sender) in the Trust Game (for participants assigned to the role of receiver; n = 372). (g) Mean offer (% of the endowment) in the Ultimatum Game (for participants assigned to the role of proposer; n = 377). (h) Mean minimum acceptable offer (MAO; % of the proposer’s endowment) in the Ultimatum Game (for participants assigned to the role of responder; n = 314)
Results from regression analyses of behavior in the games (Experiment 2)
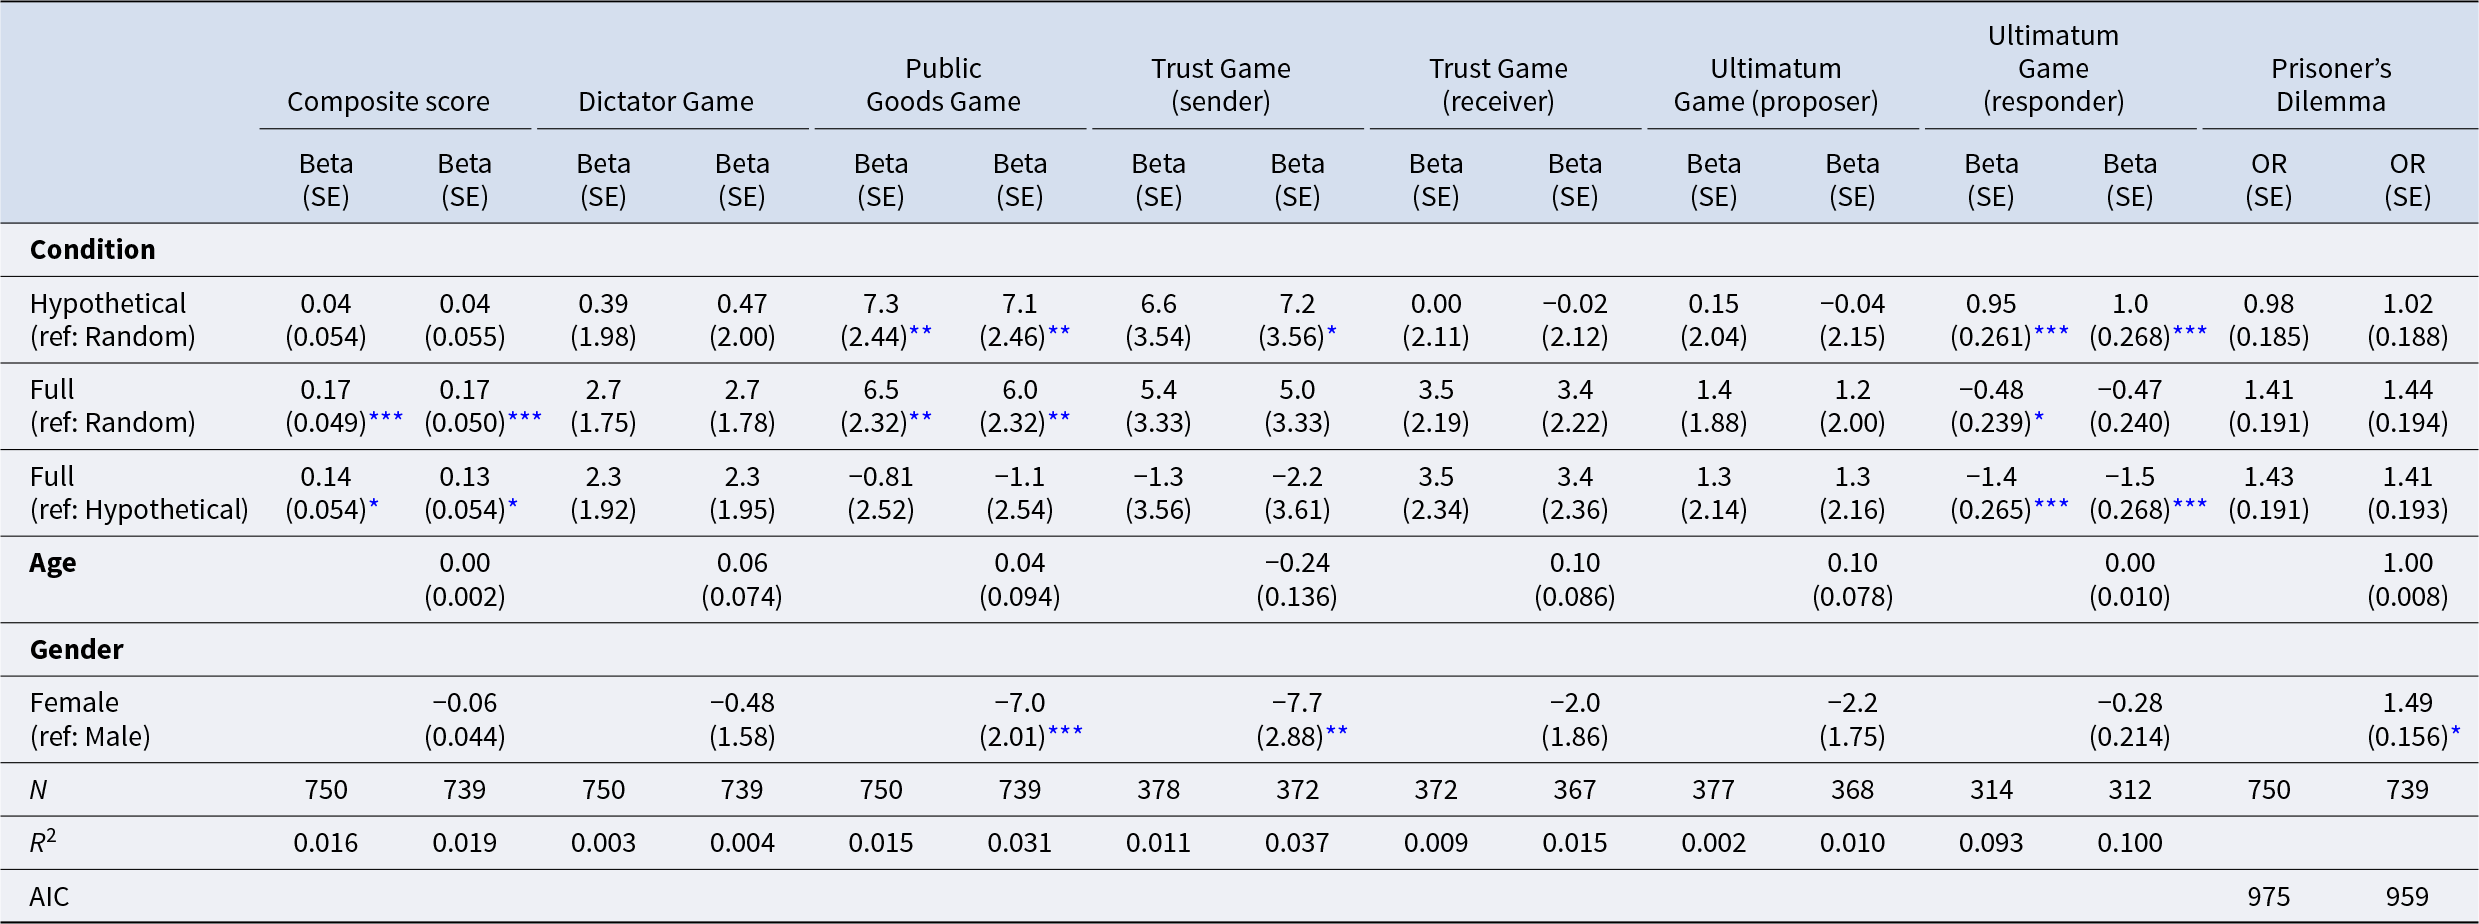
Notes: This table shows results from regression analyses of behavior in the games (logistic regression for the Prisoner’s Dilemma; OLS regressions for all other games and the composite measure; robust standard errors in parentheses). The first two rows show estimates from models with the Random incentive scheme as reference condition and the third row shows estimates from a model with Hypothetical as the reference condition. OR = Odds ratio. In the Dictator Game, the dependent variable (DV) is the participant’s contribution to the other player (% of the endowment). In the Public Goods Game, the DV is the participant’s contribution to the group account (% of the endowment). For Trust Game senders, the DV is an ordinal variable indicating the % of the endowment transferred to the receiver (with possible values 0%, 33%, 67%, or 100%). For Trust Game receivers, the DV is the % of the total possible back-transfer that the participant transferred to the sender (i.e., across all possible non-zero transfers from the sender). For Ultimatum Game proposers, the DV is the amount offered to the responder (% of the endowment). For Ultimatum Game responders, the DV is the minimum acceptable offer from the proposer (i.e., the switching point; % of the proposer’s endowment). In the Prisoner’s Dilemma, the DV is a binary variable, coded as 1 if the participant chose A (cooperate) and 0 if they chose B (defect). For the composite measure of prosocial behavior, each DV was standardized into a z-score and averaged. Hypothetical is the no-payment (hypothetical) incentive scheme; Full is the full-payment incentive scheme; both variables are coded as binary variables with the random-payment incentive scheme as the reference category. Age is the participant’s age in years. Female is a gender dummy.
* p < .05, **p < .01, ***p < .001.
Furthermore, unlike Experiment 1, we also found effects in the Public Goods Game: participants who made hypothetical decisions and those who were paid for all decisions contributed more to the public good compared to participants in the random payment condition, and these effects remained after controlling for age and gender. However, these findings are difficult to interpret, as there is no compelling rationale for why both full and hypothetical incentives would promote more cooperation than random payment. Furthermore, there was no statistically significant difference between the full-payment and hypothetical conditions.
For the composite measure of prosocial behavior, as in Experiment 1, there was no significant difference between the hypothetical condition and the random payment scheme. However, unlike Experiment 1, the full-payment incentive scheme increased prosocial behavior relative to both the random-payment scheme (B = 0.17, p < .001) and the no-payment (hypothetical) scheme (exploratory analysis; B = 0.14, p = .012), and these associations remained while controlling for age and gender. However, given the heterogeneous results across games – especially the influence of responder behavior in the Ultimatum Game – the interpretation of the composite score warrants caution, as it may reflect an aggregation of inconsistent and potentially unrelated treatment effects. Excluding Ultimatum Game responder behavior from the composite measure in exploratory (non-preregistered) analyses made the comparison between the full-payment and no-payment (hypothetical) incentive schemes non-significant, but the full-payment incentive scheme still increased prosocial behavior compared to the random-payment incentive scheme (significant at p < .01 instead of p < .001; see Supplementary Table S12).
Results remained after excluding participants (n = 48) who failed the attention check, except the effect of the full-payment (versus random-payment) incentive scheme in the Ultimatum Game (responders) was no longer statistically significant and an effect appeared in the Prisoner’s Dilemma where participants in the full-payment incentive condition were more likely to cooperate than participants in the no-payment (hypothetical) incentive condition (OR = 1.49, p < .05), although this effect was not robust to adjusting for age and gender (see Supplementary Table S7).
An exploratory (not preregistered) analysis of back-transfers in the Trust Game (receivers) when the sender transferred the maximum amount possible indicated that back-transfers were significantly higher in the full-payment incentive scheme than the no-payment (hypothetical) and random-payment incentive schemes (see Supplementary Table S8), although only the former remained statistically significant at p < .05 when adjusting for age and gender.
To further examine the mostly non-significant effects, we conducted exploratory (not preregistered) equivalence tests following the same procedure as in Experiment 1. Results are presented in Supplementary Table S9. Results are largely in line with results from the regression analyses: where we find no statistically significant differences in the regressions, the equivalence tests also indicate evidence for no meaningful effects (and vice versa), except for some comparisons in the Trust Game where results are inconclusive.
3.2.2. Does the distribution of responses differ between incentive schemes?
As in Experiment 1, we plotted the distribution of responses for each game and incentive scheme and compared the distributions across incentive schemes (see Supplementary Figure S3; for cumulative distributions, see Supplementary Figure S4). As in Experiment 1, Kolmogorov-Smirnov tests (for continuous variables) and Kruskal-Wallis testsFootnote 2 (for non-continuous variables; i.e., Trust Game senders and Ultimatum Game responders) revealed no statistically significant difference in the distribution of responses between the random-payment and the full-payment incentive scheme in the Dictator Game (D = 0.104, p = .134), Public Goods Game (D = 0.12, p = .055), or Trust Game (senders: H(1) = 3.312, p = .069; receivers: D = 0.166, p = .066), between the no-payment and random-payment incentive scheme in the Dictator Game (D = 0.048, p = .936) or Trust Game (senders: H(1) = 3.034, p = .082; receivers: D = 0.075, p = .867), or between the no-payment and full-payment incentive scheme in the Dictator Game (D = 0.092, p = .241) and Public Goods Game (D = 0.048, p = .936).Footnote 3 However, unlike Experiment 1, there was a statistically significant difference in the distribution of responses between all incentive schemes for Ultimatum Game responders (no-payment versus random-payment: H(1) = 11.044, p < .001; full-payment versus random-payment: H(1) = 4.21, p = .040; no-payment versus full-payment: H(1) = 25.319, p < .001) but not for proposers (no-payment versus random-payment: D = 0.088, p = .730; full-payment versus random-payment: D = 0.062, p = .968; no-payment versus full-payment: D = 0.075, p = .868). These differences appear to be driven by fewer participants accepting low offers (especially offers of £0–0.99) and more participants requiring an equal split (50%) in the no-payment condition compared to the random-payment and full-payment conditions (see Figure S3). Exploratory (non-preregistered) tests for first-order stochastic dominance (Barrett & Donald, Reference Barrett and Donald2003; Schaub, Reference Schaub2024) also indicated that the no-payment incentive scheme dominated the random-payment and full-payment incentive schemes and that the random-payment incentive scheme dominated the full-payment incentive scheme for Ultimatum Game responder behavior (see Supplementary Figure S4; for full output from these tests, see Supplementary Table S10).
There was also a difference between distributions in the no-payment and random-payment incentive scheme in the Public Goods Game (D = 0.144, p = .011). This difference appears to be driven by more participants contributing 100% of their endowment in the no-payment (hypothetical) incentive condition compared to the random-payment condition (see Figure S3); in other words, the no-payment incentive scheme increased ‘hyper-cooperative’ behavior. This finding is in line with previous literature that has shown that increasing stakes reduce hyper-altruistic behavior (Brañas-Garza, Jorrat, et al., Reference Brañas-Garza, Estepa-Mohedano, Jorrat, Orozco and Rascón-Ramírez2021). On the other hand, the proportion of participants that contributed 100% (or near 100%) was also larger in the full-payment incentive condition compared to the random-payment condition, but this difference was not statistically significant. Exploratory (non-preregistered) tests for first-order stochastic dominance also indicated that the no-payment and full-payment incentive schemes dominated the random-payment incentive scheme in the Public Goods Game (see Supplementary Figure S4).
There was also a difference in the distribution of responses between the no-payment and full-payment incentive schemes for Trust Game receivers (D = 0.188, p = .028; but not senders (H(1) = 0.006, p = .939). This difference appears to be driven by fewer participants in the full-payment condition transferring 31–40% of the possible amount and more participants transferring 51–80% (see Supplementary Figure S3). Exploratory (non-preregistered) tests for first-order stochastic dominance also indicated that the full-payment incentive scheme dominated the no-payment incentive scheme (see Supplementary Figure S4 and Supplementary Table S10). Additionally, the full-payment scheme dominated the random-payment incentive scheme.
In addition to the results reported above, the exploratory tests for first-order stochastic dominance also indicated that the full-payment incentive scheme dominated the no-payment and random-payment incentive schemes in the Dictator Game and that the no-payment and full-payment incentive schemes dominated the random-payment incentive scheme for Trust Game senders (see Supplementary Figure S4 and Table S10).
Finally, we conducted exploratory (non-preregistered) analyses investigating specifically whether there was a difference in the proportion of participants giving 0%, 50%, and 100% in the Dictator Game; these analyses indicated a significant difference in the proportion of participants giving 0% (χ2 = 6.53, p = .038, n = 102), with more participants giving 0 in the no-payment (hypothetical) incentive condition, followed by the random-payment incentive condition and lastly the full-payment condition (see Supplementary Table S11). There was also a significant difference in the proportion of participants giving 100%; however, this analysis includes only 15 participants (2% of our sample).
3.2.3. Do incentive schemes affect the variance of the data?
To investigate whether there was a difference in the variance of the data between incentive schemes, we performed a Levene’s test of homogeneity of variances for each outcome measure (except the Prisoner’s Dilemma). As in Experiment 1, there was no statistically significant difference in the variance of the data in the Public Goods Game (F(2, 747) = 2.101, p = .123), Trust Game (senders: F(2, 375) = 2.526, p = .081; receivers: F(2, 369) = 1.005, p = .367), or Ultimatum Game (proposers: F(2, 374) = 1.451, p = .236; responders: F(2, 311) = 0.398, p = .672). However, unlike Experiment 1, there was a statistically significant difference in the variance of the data in the Dictator Game (F(2, 747) = 5.284, p = .005). Inspection of box plots indicated that the variance was lower in the full-payment incentive scheme (interquartile range [IQR] = 0.30 – 0.50) than in the other conditions (hypothetical: IQR = 0.20 – 0.50; full-payment: IQR = 0.21 – 0.50).
4. Discussion
We conducted two preregistered behavioral experiments to investigate the effect of different incentive schemes on prosocial behavior. We found no statistically significant effect of a full-payment or a no-payment (hypothetical) incentive scheme relative to a random-payment incentive scheme on average behavior in one-shot economic games and social dilemmas with £1 stakes. This finding was consistent across all games and dilemmas included, as well as a composite measure of prosocial behavior. In a follow-up experiment where stakes were increased to £10, we still found no consistent effect of the incentive schemes, although effects varied somewhat across games and outcome measures. Our results raise questions about the reasonableness of the prevalent norm in experimental economics to exclusively rely on incentivized experiments as the sole legitimate type of experimental input for understanding human behavior.
The use of incentivized choice tasks is a methodological convention that separates economics from other social sciences such as psychology. Yet empirical research has provided mixed results on the impact of incentive schemes on behavior in experimental settings. Although incentives may matter in some domains and for some types of measures, the most consistent finding seems to be that when monetary incentives influence behavior (if there is any effect at all), they reduce the variance of the data around the predicted outcome (Camerer & Hogarth, Reference Camerer and Hogarth1999; Hertwig & Ortmann, Reference Hertwig and Ortmann2001; Smith & Walker, Reference Smith and Walker1993). Here, we find no significant difference between incentive schemes either in average prosocial behavior or in the variance of the data when choices involve £1 stakes. The non-significant effects on average behavior were corroborated in exploratory (non-preregistered) equivalence tests indicating no meaningful true effects, although evidence was inconclusive for one of three comparisons in the Dictator Game (between full- versus random-payment). Tests for first-order stochastic dominance also found no significant effects except in the Public Goods Game, where the full-payment incentive scheme dominated the random-payment and no-payment incentive schemes. When choices involved £10 stakes (Experiment 2), the full-payment incentive scheme increased overall prosocial behavior (the composite measure) relative to the random-payment and no-payment (hypothetical) incentive schemes; however, looking separately at each game, the only case where we find consistent and statistically significant differences between incentive schemes is in the Ultimatum Game, where responders in the full-payment condition accepted lower offers from the proposer compared to responders in the hypothetical incentive scheme, with responders in the random-payment incentive scheme falling in between. This pattern aligns with Andersen et al. (Reference Andersen, Ertaç, Gneezy, Hoffman and List2011), who demonstrated that rejection rates decline as stakes increase, particularly for low offers. However, the interpretation of responder behavior in the Ultimatum Game is complex: Low minimum acceptable offers (MAOs) could reflect selfish maximization or altruistic tendencies, as those who accept zero in the Ultimatum Game have been shown to be the most prosocial in the Dictator Game (Staffiero et al., Reference Staffiero, Exadaktylos and Espín2013). Likewise, rejecting unfair offers may indicate a form of punishment by individuals who behave fairly, or spite by individuals who behave unfairly (Brañas-Garza et al., Reference Brañas-Garza, Espín, Exadaktylos and Herrmann2014). The ambiguity of Ultimatum Game responses affects not only the interpretation of Ultimatum Game responder behavior, but also of the composite measure, as the Ultimatum Game is included in the composite measure, in line with previous research (e.g., Gärtner et al., Reference Gärtner, Andersson, Västfjäll and Tinghög2022). Excluding Ultimatum Game responder behavior from the composite measure in exploratory (non-preregistered) analyses made the comparison between the full-payment and no-payment (hypothetical) incentive schemes non-significant, but the full-payment incentive scheme still increased prosocial behavior compared to the random-payment incentive scheme.
In Experiment 2, we also found statistically significant effects in the Public Goods Game; however, these effects appear self-contradictory, as they indicate that prosocial behavior increases both when participants are paid for all decisions (full-payment incentive scheme) and when they are not paid at all (hypothetical incentive scheme), compared to when they are paid for a randomly selected decision (random-payment incentive scheme). The only circumstance under which these seemingly contradictory effects would make sense is if they are driven by two separate mechanisms. For example, it is possible that the full-payment incentive scheme increased contributions in the Public Goods Game because participants were paid a larger total payoff from the experiment, making prosocial behavior in each individual task ‘cheaper’ in relation to the total payoff. In contrast, the no-payment condition may have increased contributions because acting prosocially had no personal cost. However, these explanations are post-hoc rationalizations of the observed data rather than theory-driven predictions; based on existing literature on incentive schemes it is hard to find any reason why both a full-payment and a no-payment incentive scheme would increase contributions in the Public Goods Game, compared to a random-payment incentive scheme. Therefore, these effects may be due to noise. In either case, our results make it clear that hypothetical choice tasks do not necessarily lead to inflated rates of prosocial behavior, as one might think. If anything, incentives (particularly the full-payment incentive scheme) increased prosocial behavior in the present study, as this was the effect that most consistently appeared in the Ultimatum Game, Public Goods Game, and composite measure taken together, although the precise interpretation is somewhat ambiguous and in most tasks there was no effect at all.
Exploratory (non-preregistered) equivalence tests for Experiment 2 also indicated evidence in line with the conclusions above (i.e., no meaningful effects in the Dictator Game or Ultimatum Game proposer behavior, but some effects in the Public Goods Game, Ultimatum Game responder behavior, and the composite measure). These tests also indicated evidence of no meaningful effects in the Trust Game, except for some comparisons where evidence was inconclusive (specifically, for senders, evidence was inconclusive for random- versus no-payment and random- versus full-payment, and for receivers, evidence was inconclusive for random- versus full-payment). Exploratory tests for first-order stochastic dominance also indicated that no-payment and full-payment dominated random-payment for Trust Game senders (which, as in the Public Goods Game, appears self-contradictory) and that full-payment dominated both no-payment and random-payment for Trust Game receivers. Thus, even though there were no significant effects for average behavior in the Trust Game, there may be some differences in the underlying distributions, although the precise interpretation and practical implication is somewhat elusive. Furthermore, in the Trust Game, when first-players transferred the maximum possible amount, second-players in the full-payment incentive scheme back-transferred a larger amount than second-players in the random-payment or hypothetical incentive schemes. However, these analyses were exploratory (not preregistered) and need to be confirmed in future studies.
Finally, we found no significant differences in the variance of the data, except in the Dictator Game (in Experiment 2), where the full-payment incentive scheme reduced variance. This is in line with expectations (Camerer & Hogarth, Reference Camerer and Hogarth1999; Hertwig & Ortmann, Reference Hertwig and Ortmann2001; Smith & Walker, Reference Smith and Walker1993), although a recent study found effects in the opposite direction: hypothetical choices were less dispersed than choices that were fully incentivized (Brañas-Garza et al., Reference Brañas-Garza, Espín and Jorrat2025). Exploratory tests also found that the full-payment incentive scheme stochastically dominated the no-payment and random-payment incentive schemes in the Dictator Game (in Experiment 2).
Much of the previous literature on the role of incentives in prosocial behavior has focused on comparisons between decisions that are either incentivized or not, without distinguishing between different forms of incentive schemes. An exception is a recent meta-analysis of Dictator Game experiments, which found no difference in average offers between sure-payment protocols (i.e., studies where participants are paid for all their decisions) and protocols in which participants are paid for one or some of their decisions, suggesting that random-payment protocols are as effective as full-payment protocols (Umer, Reference Umer2023). Importantly, we here also included a condition in which decisions were entirely hypothetical; thus, whereas Umer (Reference Umer2023) concludes that random-payment protocols are as effective as full-payment protocols, the findings from the present studies suggest that random-payment protocols are as ineffective as full-payment protocols, as we found little difference in average behavior between the full-payment or the no-payment (hypothetical) incentive schemes, relative to the random-payment incentive scheme. This conclusion is in line with recent work suggesting that incentives (versus no incentives) do not affect risk preferences (Brañas-Garza, Estepa-Mohedano, et al., Reference Brañas-Garza, Estepa-Mohedano, Jorrat, Orozco and Rascón-Ramírez2021; Hackethal et al., Reference Hackethal, Kirchler, Laudenbach, Razen and Weber2022) or time preferences (Brañas-Garza et al., Reference Brañas-Garza, Jorrat, Espín and Sánchez2023), as well as a previous study from our team where monetary incentives had no effect on payoff comprehension in the same economic games that we included here (Koppel et al., Reference Koppel, Andersson, Johannesson, Strømland and Tinghög2025). It is also in line with a recent meta-analysis of effects of incentives on performance across various contexts, which found little evidence that incentives improve performance (Cala et al., Reference Cala, Havranek, Irsova, Luskova, Matousek and Novak2026). On the other hand, we did find effects in some games at higher stake sizes (£10), although effects were not consistent across games. Furthermore, tests of differences in distributions and (exploratory) first-order stochastic dominance suggest that in some games, even though there is no effect on average behavior or evidence is inconclusive, there may be differences in the underlying distributions of responses. However, the practical implication of those differences is somewhat unclear.
A question that begs to be asked in light of the current findings is whether our results are good or bad news for experimental research in this domain. On one hand, implementing incentive-compatible choice tasks is often administratively burdensome and time consuming. If hypothetical scenarios yield equally valid responses, it would significantly simplify and reduce the costs of conducting experiments in this field, making life easier for experimental researchers. On the other hand, our findings could be interpreted as indicating that incentive-compatible choice tasks yield equally unreliable results as hypothetical choice tasks, which would pose a significant challenge to the future of experimental research on prosocial behavior. Concerns about external validity have persistently plagued this field (see, e.g., Bostyn et al., Reference Bostyn, Sevenhant and Roets2018; Galizzi & Navarro-Martinez, Reference Galizzi and Navarro-Martinez2019). Our findings could intensify the argument that experimental researchers should shift their focus toward behavior in natural settings rather than conducting experiments in highly stylized environments that offer limited insight into real-life behavior.
A limitation of the present study is that we did not include a between-subjects random incentive scheme (BRIS), where there is a random drawing such that some participants receive payment for some (or all) of their decisions. A benefit of BRIS is that it allows for even higher stake sizes without increasing the costs of the experiment. On the other hand, like any incentive scheme that involves some form of randomization, participants may treat a given choice not in terms of its stated payoff but in terms of some fraction of that payoff. Relatedly, in the present study, we did not inform participants of the exact number of tasks that they would complete, which may add ambiguity about the probabilities of payoffs in the random-payment condition, potentially creating an additional source of variation in this condition.
Additionally, our sample consisted of online adult participants recruited via Prolific rather than a typical university student sample, which is commonly used in experimental economics. While our sampling choice may enhance external validity of the findings, it limits direct comparability with many previous studies and raises questions about generalizability across different populations and experimental contexts. Moreover, our findings may not generalize to other, more complex, decision environments such as markets or auctions. In addition, it is possible that group-level averages obscure meaningful individual-level variation. Some individuals may become more prosocial in hypothetical contexts, while others may behave less prosocially. These opposing tendencies could cancel out in the aggregate, masking underlying heterogeneity. As our study was not designed to investigate such trait-based moderation, future research using richer psychological or personality measures could explore how individual differences shape responses to different incentive schemes (for a comparison of incentive schemes in terms of attention, response time, and previous experience, see Supplementary Table S12; exploratory tests revealed no statistically significant differences between conditions).
These points also raise the broader issue of which incentive scheme, if any, best approximates behavior outside the lab. Full-payment schemes offer clear financial consequences but may induce artificial effects such as hedging across tasks (see, e.g., Charness et al., Reference Charness, Gneezy and Halladay2016). Hypothetical choices, while not monetarily consequential, may reflect moral or reputational motivations relevant in many real-world social interactions. On the other hand, experimental instructions about hypothetical payments may be difficult for participants to understand; participants may still believe that there is some probability of receiving payment, despite being instructed otherwise (Brañas-Garza et al., Reference Brañas-Garza, Espín and Jorrat2025). Random-payment schemes offer some balance between these features, yet their external validity remains largely assumed. Given that many everyday prosocial decisions – such as helping others, cooperating, or donating – occur without explicit financial incentives, hypothetical or low-stakes designs may sometimes better capture naturally occurring behavior. That said, the most appropriate incentive scheme ultimately depends on the specific behavioral domain and context under investigation. Our findings suggest that in typical online environments, the choice of incentive scheme may be less critical than is often assumed in experimental economics.
The idea that only incentivized decisions can be trusted has for decades been a near mantra in the field of experimental economics, and viewed as a defining feature that sets it apart from experimental work in other social sciences. For example, this journal (Experimental Economics) explicitly states in their publication guidelines that it only considers studies in which participants are incentivized. We think our results call for a more nuanced approach toward the paradigmatic role of monetary incentives in economics in general, and experimental economics in particular. What this more nuanced approach entails we are not certain of, but it should not be based on ‘check-list thinking’ about the use of monetary incentives for assessing whether a study provides valuable insights about human prosociality. Instead, researchers should carefully consider the specific context, goals, and underlying assumptions of their study and, in case incentives are deemed not necessary, explicitly justify their choice. Referees and editors, in their turn, should not reject papers purely on the grounds that subjects were not paid. This will help to bridge the divide between economics and other social sciences in the study of human behavior.
Supplementary material
The supplementary material for this article can be found at https://doi.org/10.1017/eec.2026.10044. The replication material for the study is available at https://doi.org/10.17605/OSF.IO/PA54Z
Acknowledgements
We thank Magnus Johannesson and Eirik Strømland for helpful comments on earlier versions of this work. This research was funded by the Swedish Research Council. Funders had no role in study design, data collection, analysis, decision to publish, or preparation of the manuscript.
Competing interests
The authors have no conflicts of interest to declare.




 Open access

