


1. Introduction
Most observable differences among individuals in physiology, behaviour, morphology, disease susceptibility and reproductive fitness are measurable and present a quantitative distribution.
Quantitative genetic variation is the substrate for phenotypic evolution in natural populations and also underlies susceptibility to common complex diseases and behavioural disorders in humans, as well as responses to pharmacological therapies. In medicine, an important goal is to identify genetic risk factors for the presence of many common diseases. In some cases, however, quantitative traits (QTs) may provide more information for identifying genes than qualitative traits. They may represent intermediate traits or endophenotypes for diseases. An understanding of the genetic and environmental factors causing QTs variation is thus relevant in a number of biological contexts, including medicine, evolution and the emerging discipline of system biology.
Phenotypic variation for QTs results from the segregation of alleles at multiple QT loci with effects that are sensitive to the genetic, gender and external environments. For complex traits, the relationship between genotype and phenotype is not a simple ratio, and inferences about the net effects of all loci affecting the trait can be made by partitioning the total phenotypic variance into components attributable to additive, dominance and epistatic genetic variance, variance of genotype–environment interactions and environmental variance. These variances are population-specific, due to the dependence of the genetic terms on allele frequencies at each of the contributing loci, and to real environmental differences between populations. The relative weight of genetic factors in determining the variability of a QT is usually evaluated by means of heritability estimates. A promising approach for identifying genes affecting the complex and QTs is the study of population isolates, which allow a reduction in the complexity of the genetic models underlying the trait. Although generalizability of findings on genetic isolates to outbred populations are often uncertain, the former have the advantage of a more homogeneous genetic pool, having undergone low immigration and expansion, and of limiting potential confounders related to genetic heterogeneity. In isolated populations, the founder effect and genetic drift can cause an increase in the frequency and the attributable risk of particular alleles, maybe broadening the magnitude of effect sizes. The presence of both inbreeding and extended genomic regions in linkage disequilibrium (LD) with previously mentioned factors may generate a more homogeneous genetic background. Moreover, the members of isolated populations share a common environment and lifestyle, thus the environmental diversity is strongly reduced. In these genetically and culturally homogeneous populations, a common remote genetic pool produced a large proportion of individuals who inherited the same trait-predisposing genes.
In our study, we describe 43 QTs in the population of nine isolated villages (Baunei, Loceri, Perdasdefogu, Seui, Seulo, Talana, Urzulei, Ussassai and Triei) from the secluded Ogliastra region in Sardinia (Fig. 1). This area represents an isolate that could provide a significant advantage in studying complex traits because of its reduced genetic diversity and its environmental homogeneity. Mitochondrial analysis traced the original population back to the Neolithic era and showed that Ogliastra inhabitants rank among the most genetically homogenous European population and that they have the lowest values of mtDNA gene diversity with respect to other Sardinia areas (Fraumene et al., Reference Fraumene, Petretto, Angius and Pirastu2003; Falchi et al., Reference Falchi, Giovannoni, Calò, Piras, Moral, Paoli, Vona and Varesi2006). Several Ogliastra villages slowly grew in isolation and had little or no admixture with the others, giving rise to high endogamy (from 64% in Loceri to 92% in Baunei) and inbreeding. Previous genealogical studies determined that villages used in our study have very few maternal and paternal lineages: ten mitochondrial lineages and eight Y chromosomes represent 80–85% of the entire population of each village (Angius et al., Reference Angius, Melis, Morelli, Petretto, Casu, Maestrale, Fraumene, Bebbere, Forabosco and Pirastu2001; Ghiani & Vona, Reference Ghiani and Vona2002; Fraumene et al., Reference Fraumene, Belle, Castrì, Sanna, Mancosu, Cosso, Marras, Barbujani, Pirastu and Angius2006 and unpublished data). Additional analyses of the population structure through high-density SNPs confirmed a great deal of genetic differentiation among sub-population isolates within Ogliastra as a consequence of distinct founder effects and genetic drift (Pistis et al., Reference Pistis, Piras, Pirastu, Persico, Sassu, Picciau, Prodi, Fraumene, Mocci, Manias, Atzeni, Cosso, Pirastu and Angius2009). All these data demonstrate that history and geography have influenced the genetic features of Ogliastra communities producing differences in LD and the population structure and allowing us to consider each village as an isolate with specific characteristics. In addition, a good parallelism with the geographical structure of the region was observed, since villages cluster according to their geographic position and relative proximity. In particular, statistically significant genetic heterogeneity was detected between two groups of villages: Seui, Seulo, Ussassai and Perdasdefogu (group 1) and Talana, Baunei, Urzulei and Triei (group 2). In contrast, Loceri can be considered as a freestanding group since it is characterized by a minor geographical isolation, due to its closeness to the seashore and the important administrative centre of Lanusei and by the lowest LD values. Furthermore, archival data, spanning many centuries, confirmed its frequent genetic exchanges with other villages (Pistis et al., Reference Pistis, Piras, Pirastu, Persico, Sassu, Picciau, Prodi, Fraumene, Mocci, Manias, Atzeni, Cosso, Pirastu and Angius2009).
Geographical location of the nine isolates.

Here, we present the study of distribution and heritability of 43 QTs in nine isolated villages of Ogliastra region. Studied phenotypes range from haematological and serum traits to anthropometric measures.
2. Materials and methods
(i) Study design and genealogical data
Study sample comes from a large epidemiologic survey on complex diseases carried out in nine isolated villages of Ogliastra, a Central–Eastern Sardinia region that has been geographically and socially secluded for thousands of years, due to mountains and deep river valleys. The nine selected communities, with an average population of about 1500 inhabitants, share similar demographic features: limited number of founders, high endogamy, consanguinity and slow population growth. Briefly, the study design is cross-sectional and population-based. People living in the villages were invited to take part in the study by means of information campaigns and letters sent to every family. Furthermore, word of mouth, especially among family members, made a high level of recruitment possible. The participants gave a blood sample, underwent anthropometric measurements and a standardized interview collecting socio-demographic, lifestyle, medical and pharmacological history data. The research adheres to the tenets of the Declaration of Helsinki and written informed consent was obtained from all enrolled people. About 80% of the resident population participated in the study.
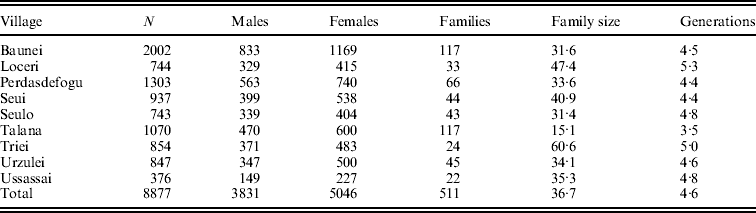
For each inhabitant, we collected genealogical information dating back to the 17th century and stored them in a relational database along with clinical and epidemiological data. To construct pedigrees, we used a tool called FamPrep, implemented in the PedNavigator software (Mancosu et al., Reference Mancosu, Ledda and Melis2003), which allow the reconstruction of different types of genealogies starting from a list of individuals and setting the number of generations. Pedigree structures are such that every individual in the study sample is related to every other individual through multiple lines of descent. Available data allowed us to organize 15 158 individuals, – 7916 females and 7242 males – into 511 pedigrees (on average 4·6 generations deep) with an average family size of 36·7 individuals. The overall sample includes 9024 sibling pairs, 432 half-sibling pairs, 13 373 first cousins, 19 938 parent–child pairs, 17 610 grandparent–grandchild pairs and 16 663 avuncular pairs in addition to other more distant relatives. Statistics about the family structures of each village are displayed in Table 1.
Number of phenotyped individuals and family features for each village
(ii) Phenotypic data
The sample analysed in the present study consists of 8876 males (43%) and females (57%), aged over 18 years. From each participant, blood aliquots were fractionated to provide serum, plasma and white blood cells.
Blood cell counts were performed by Beckman Coulter, whereas serological parameters and the corresponding levels were determined with an automated Targa BT-3000 Chemistry Analyser. Body mass index (BMI) was calculated as weight (in kilograms) divided by height squared (in meters).
Overall, we collected data on 43 quantitative phenotypes: 3 anthropometric, 17 haematological and 23 serum traits (Table 2).
Sample size, overall and sex-specific traits mean values and F test P-value of sex-specific traits variance

* P<0·05, **P<0·01, ***P<0·001, ****P<0·0001.
1 Data available for Perdasdefogu, Talana and Urzulei.
2 Data not available for Triei and Loceri.
(iii) Statistical analysis
We explored the distribution of each trait on the whole sample generating summary plots which allowed us to identify outliers falling outside the ±3 standard deviations (SDs) range of the distribution. Such outliers were then excluded from the subsequent analysis. We next computed descriptive overall statistics for all traits according to sex, and performed F test on the variance of traits in order to assess the variability pattern in males and females.
Subsequently, we examined differences in the traits’ mean values among villages by analysis of variance (ANOVA), adjusting for age and gender and using Bonferroni correction. Whenever required, we normalized traits using the appropriate transformation.
To quantify the relative genetic contribution to the variation of each trait, we carried out a heritability analysis with the standard variance component (VC) approach based on maximum likelihood methods (Hartley & Rao, Reference Hartley and Rao1967) as implemented in the SOLAR software (Almasy & Blangero, Reference Almasy and Blangero1998). Since each village has a particular founder population and may represent a genetic sub-isolate, separate heritability estimates were obtained. We tested the influence of age and gender on each trait, and covariates with significant effect (P⩽0·05) were included in the analysis. We estimated a model including additive genetic (V a) and residual environmental (V e) VCs: heritability was obtained as the ratio of the additive genetic variance to the sum of the additive genetic and environmental variance.
To evaluate sex-specific effects on the variation of investigated traits, we used a standard sex-limitation modelling approach that allows testing specific patterns of interaction, such as genotype by sex (G×S) interactions (Martin et al., Reference Martin, Cole, Hixson, Mahaney, Czerwinski, Almasy, Blangero and Comuzzie2002). The expected genetic covariance between a male and female relative pair is defined as covariance (GM, GF)=2ɸ ρG(M,F) σGM σGF, where ɸ is the coefficient of kinship between the two individuals, ρG(M,F) the genetic correlation between the expressions of the trait in the two sexes and σGM and σGF the genetic SDs for men and women. In the absence of a G×S interaction, the genetic correlation between relatives for a trait measured in males and females should be 1 and the genetic variances in the two groups should be equal. Conversely, if there is G×S interaction, the genetic correlation between the sexes, is significantly <1 and/or the genetic variances are different between the sexes. To evaluate G×S interactions influencing the traits, a likelihood ratio test (LRT) was used to compare the three nested models, obtained constraining ρG=1, σGM=σGF and σEM=σEF, respectively, to the full model, where σEM and σEF are the environmental SD in males and females.
The R statistical software (v.2.5.0) was used for all the analyses except for VC heritability analysis, which was performed using SOLAR (Sequential Oligogenic Linkage Analysis Routine, version 4.1.0).
3. Results
We studied 3 anthropometric, 17 haematological and 23 serum traits. For each trait, the total number of phenotyped individuals included in the analysis exceeds 8000 individuals except for a small number of traits available only in a few villages. Indeed, for platelets distribution width (PDW), the number of phenotyped individuals included in the analysis was 2535 (data available for Perdasdefogu, Talana and Urzulei), for piastrinocrite (PCT) blood samples were collected only in Perdasdefogu, Talana and Urzulei (n=2635) and for magnesium data were not available in Triei and Loceri (n=6369). Anthropometric measures were available for 7780 individuals.
Table 2 shows descriptive overall statistics of all studied traits, according to sex. For many traits there were marked differences between genders, affecting not only the trait means but also the overall pattern of variability around the mean. We detected 37 traits with a highly significant (P<0·0001) evidence for variance heterogeneity by sex (Fig. 2). The 37 traits included all 3 anthropometric traits, many haematological (15 out of 17) and serological traits (19 out of 23).
Distribution of six representative traits in male and female participants. Relative densities were plotted for females (dotted lines) and males (continuous line) for 2 blood cell measures (Hb and PLT), 2 serum (LDL cholesterol and HDL cholesterol) and 2 anthropometric measures (BMI and height).

ANOVA of all 43 QTs among the nine villages showed statistically significant differences for most of them (Fig. 1, Supplementary materials). Looking at these results, we realized that for many traits some villages looked more alike to each other and markedly differed from other ones. In particular, the observed differences among trait mean values were such in order to group villages in a way which resembled the clustering outlined on the basis of the population's genetic structure (Pistis et al., Reference Pistis, Piras, Pirastu, Persico, Sassu, Picciau, Prodi, Fraumene, Mocci, Manias, Atzeni, Cosso, Pirastu and Angius2009). We therefore performed ANOVA again, using population as a factor, after grouping villages as follows: Talana, Baunei, Urzulei and Triei (group 1 – northern Ogliastra), Seui, Seulo, Ussassai and Perdasdefogu (group 2 – southern Ogliastra) and Loceri (group 3).
This last analysis showed statistically significant differences between groups of villages for most of the traits (Table 3). In particular, we observed differences among all groups in: electrolytes (sodium, potassium, phosphorus, chlorine and calcium), 6 serological traits (total protein, alkaline phosphatase, cholinesterase, LDL cholesterol, total and indirect bilirubin), 4 haematological traits (RDW, RBC, MCHC and MPV) and 1 anthropometric measure (BMI). In contrast, we never observed significant differences in 2 haematological measures (HCT and neutrophils) and in 4 serological traits (ALT transaminase, triglycerides and uric acid).
ANOVA of all 43 QTs among the 3 groups of villages, Bonferroni correction

* P<0·05, **P<0·01, ***P<0·001, ****P<0·0001.
Most differences (79% of the traits) were detected between group 1 and 2 for 14 haematological, 18 serological and 2 anthropometric measures. Furthermore, for 77% of traits Loceri, which represents a freestanding group, resulted as more similar to villages of group 1, whereas for the remainder 23% it resembled those of group 2.
Heritability analysis of 43 QTs by means of the VC method was separately performed by village. Only 26 out of 373 heritability estimates were not significantly different from zero (Fig. 2, Supplementary materials). Statistically significant heritability estimates varied from 12% (basophils in Perdasdefogu) to 88% (MCH in Seulo and Triei) among haematological traits, from 12% (ALT Transaminase in Baunei) to 84% (direct bilirubin in Seulo) among serological traits and, from 23% (BMI in Seulo) to 81% (height in Ussassai) among anthropometric measures. Most of the traits are rather stable and heritability estimates were similar in all the nine isolates except for basophils (Triei higher than Perdasdefogu), MCHC (Baunei, Perdasdefogu, Ussassai and Triei higher than Talana and Urzulei), RDW (Triei higher than Baunei), direct bilirubin (Seulo higher in respect with all other villages), LDL cholesterol (Perdasdefogu higher than Seui), total cholesterol (Perdasdefogu and Urzulei higher than Loceri) and triglycerides (Perdasdefogu higher than Seui and Loceri). As we observed sporadic statistically significant differences among villages only in a few traits, we also carried out a further analysis pooling together pedigrees of all the villages. In supplementary table 1, heritability estimates obtained for each QT on the total sample are reported. After accounting for age and sex, heritability estimates ranged between 34% (basophils) and 76% (MCV and MCH) for the 17 haematological traits, between 30% (calcium and direct bilirubin) and 89% (alkaline phosphatase) for the 23 serum measures and, between 41% (BMI) and 73% (height) for the three anthropometric traits. Variance due to covariates ranged from 0·3% for PDW and 60% for height.
Since many traits were found to have significantly different variances in males and females, we also performed a sex-specific variance decomposition to explore the effects of genetic and environmental factors in males and females. Genetic and environmental SDs for men and women and genetic correlations in the 43 investigated QTs, along with sex-specific heritabilities, are shown in supplementary table 1. Genetic SDs of basophils, Hb, MCH and direct bilirubin were significantly higher in men, whereas genetic SDs of ALT transaminase, serum creatinine and serum glucose were significantly higher in women. Environmental SD of alkaline phosphatase, ALT transaminase, indirect bilirubin, LDL and total cholesterol, triglycerides and serum phosphorus were significantly higher in men, whereas BMI environmental SD was higher in women. The genetic correlations between sexes were significantly different from 1 for 3 haematological traits (basophils, eosinophils, MCHC) and 9 serological measures (ALT, indirect and total bilirubin, HDL, magnesium, phosphorus, potassium, serum creatinine, uric acid).
To better understand the nature of different heritabilities in genders for some traits, we also performed parent–offspring regression (Falconer & Mackay, Reference Falconer and Mackay1996), which presupposes a linear relationship between the mean value of the trait in the offspring and the mean value of the trait in parents. Heritability is the regression coefficient of this linear model. Father–son heritability estimates of basophils, ALT and direct bilirubin were, respectively, about three and four times higher than mother–son ones, father–daughter heritability of direct bilirubin was about twice that of mother–daughter, whereas mother–offspring heritability of serum glucose was twice that of father–offspring (Table 4).
Heritability and 95% CI by means of parent–offspring regression

4. Discussion
In the present study, we assessed the features and genetic contribution of 43 quantitative phenotypes in nine villages of the Ogliastra region in the central-eastern area of Sardinia. This region is characterized by high endogamy, low immigration, environmental homogeneity as well as genetic differentiation from the rest of the island (Cappello et al., Reference Cappello, Rendine, Griffo, Mameli, Succa, Vona and Piazza1996). We collected information on a large number of traits spanning from anthropometric measures to hematological and serum markers of diseases.
For most of the traits, we observed evidence of heterogeneity by sex which often reflects the known sexual dimorphism of traits, for example anthropometric measures (weight, height and BMI). These results are consistent with others studies performed in isolated populations, as the Hutterites (Weiss et al., Reference Weiss, Pan, Abney and Ober2006) or the Sardinians (Pilia et al., Reference Pilia, Chen, Scuteri, Orrú, Albai, Dei, Lai, Usala, Lai, Loi, Mameli, Vacca, Deiana, Olla, Masala, Cao, Najjar, Terracciano, Nedorezov, Sharov, Zonderman, Abecasis, Costa, Lakatta and Schlessinger2006), and in the general outbred population.
While analysing trait distribution in order to detect potential differences or similarities among villages, we observed that villages clustered accordingly to already known population characteristics (Pistis et al., Reference Pistis, Piras, Pirastu, Persico, Sassu, Picciau, Prodi, Fraumene, Mocci, Manias, Atzeni, Cosso, Pirastu and Angius2009). In particular, the results showed significant differences in the distribution of most traits (about 79% of them) between the group including Talana, Triei, Urzulei and Baunei and the one with Ussassai, Seui, Seulo and Perdasdefogu. These data seem to reflect the same correspondence between LD extension and population structure characteristics with the village's geographic location, as observed in our previous studies. Northern Ogliastra differs from southern Ogliastra not only from a genetic point of view, but also phenotypically, with the village of Loceri in an intermediate position. Loceri, as a matter of fact, is not geographically isolated as the other villages, being close to the seashore and to Lanusei, an important administrative centre in Ogliastra. We suggest that such results may be partly attributed to complex relationships reflecting the different influence of history and biodemography on the genetic features of these isolates. Distinctive founder effects and genetic drift may have given rise to a striking differentiation among sub-populations in the same region.
Heritabilities of the investigated traits, except for a few, were not significantly different among villages, and so further estimates were computed on the overall sample. Such estimates are always higher than 30%, showing that all QTs have a strong genetic component of the variance. In particular, we estimated heritability of approximately 54% for haematological and anthropometric traits and of approximately 50% for serological traits. In general, our results appear to be consistent with previous family-based studies (Lin et al., Reference Lin, Boden-Albala, Juo, Park, Rundek and Sacco2005; Malhotra & Wolford, Reference Malhotra and Wolford2005; Marroni et al., Reference Marroni, Grazio, Pattaro, Devoto and Pramstaller2008) and in particular with a study conducted in another Sardinian village (Pilia et al., Reference Pilia, Chen, Scuteri, Orrú, Albai, Dei, Lai, Usala, Lai, Loi, Mameli, Vacca, Deiana, Olla, Masala, Cao, Najjar, Terracciano, Nedorezov, Sharov, Zonderman, Abecasis, Costa, Lakatta and Schlessinger2006), even if our cohort is larger than those analysed in previously published studies. In contrast, several traits showed smaller heritability estimates than in previous twins studies (Evans et al., Reference Evans, Frazer and Martin1999; Beekman et al., Reference Beekman, Heijmans, Martin, Pedersen, Whitfield, DeFaire, van Baal, Snieder, Vogler, Slagboom and Boomsma2002), but twin designs may lead to an overestimation of the degree of genetic determination occurring from a greater sharing of environmental factors in monozygotic rather than in dizygotic twins. Nevertheless, twin studies explicitly correct for age affects both the means and the covariance, while family- and population-based studies are generally only correct for the direct effect of age on the mean and do not correct the covariance for the age differences between family members.
Overall, the heritability of red cells indexes was quite large, accordingly with the high prevalence of alpha and beta thalassemia in Sardinia. On the contrary, electrolytes showed small values of heritability and, considering villages separately, they were often not statistically significant or extremely variable. We believe that environment plays an important role in electrolytes concentration, while genetic factors are less influential; furthermore, this result is in agreement with other studies (Pilia et al., Reference Pilia, Chen, Scuteri, Orrú, Albai, Dei, Lai, Usala, Lai, Loi, Mameli, Vacca, Deiana, Olla, Masala, Cao, Najjar, Terracciano, Nedorezov, Sharov, Zonderman, Abecasis, Costa, Lakatta and Schlessinger2006).
As far as the sporadic statistically significant differences in heritability estimates we observed among some of the villages are concerned, it must be considered that different populations might have different heritabilities even for the same trait. This is due to the fact that heritability estimates are always relative to the genetic and environmental factors in the specific population, and are not absolute measurements of the contribution of genetic and environmental factors to a phenotype. Heritability estimates reflect the amount of variation in genotypic effects compared to variation in environmental effects. As a matter of fact, heritability is larger for outbred individuals (with diverse genetic background) or for little environmental effects, and is smaller for inbred individuals or for individuals reared in very diverse environments (Falconer & Mackay, 1996). In Ogliastra isolated populations, on one hand, we may assume a relatively homogeneous environment which tends to increase heritability, but on the other hand, we know that inbreeding is relatively high which tends to decrease heritability; nonetheless there is a high genetic differentiation between villages, and so we suggest that in these villages there may be different frequencies of allelic variants involved in the expression of some QTs, which may influence heritability in both directions.
Despite the heterogeneous variability in males and females, we observed for many traits, a sex-limited expression of genetic and/or environmental factors occurred in a few of them. Sex-limitation was qualitative for traits where the genetic correlation was significantly less than 1, indicating that different genes or subset of genes contribute to their variance in men and women; although it was quantitative for traits where genetic or environmental SDs were significantly different in men and women, indicating that the same factors affect both sexes, but their impact on the phenotype is greater in one sex than the other.
The findings are relevant for the design of genome-wide association studies and for investigations on the relationship of analysed traits with common diseases.
When we performed parent–offspring regression, with the aim of investigating the nature of different heritabilities in genders, for some traits sons showed stronger heritability to their fathers than to their mothers, whereas for other traits the opposite was true. However, the estimation of heritability by regression analysis is vulnerable to errors stemming from the unequal variances in the sample populations of parents and offspring, as we observed in our sample (data not shown). No corrections were applied to the estimates to compensate for unequal variances, because the introduced errors should result in an underestimation of heritability, and the values presented here might therefore be taken as conservative estimates for the heritable values. These results need a further elaboration by means of an analysis that takes into account the genotype of subjects in order to test the influence of Y-linked or X-linked genes, paternal or maternal effects and genomic imprinting.
In future studies, we plan to refine heritability estimates for traits sensitive to major environmental factors, extending the analysis by taking into account recorded information about smoking, nutrition and alcohol consumption.
In conclusion, our findings of high heritability suggest that genetic effects substantially contribute to phenotypic variation in this population. Thus, our results support the idea that isolated populations provide excellent research conditions for gene-mapping projects, due to the reduced level of genetic heterogeneity as well as more uniform environmental background. We believe that the obtained information is potentially useful for continuing genetic research in these populations.
We thank the Ogliastra population and all the individuals who participated in this study. We are very grateful to the municipal administrators for their collaboration to the project and for economic and logistic support. This work was supported by grants from the Italian Ministry of Education, University and Research (MIUR) no. 5571/DSPAR/2002 and (FIRB) D. M. no. 718/Ric/2005.



