

1. Introduction
Measurements of genetic variation in natural populations have been, and remain, a major concern for evolutionary and ecological biologists for good reason. Geographical range has been shown to be a good predictor of the levels of genetic variation in plants (Gitzendanner &Soltis, Reference Gitzendanner and Soltis2000). Geographically restricted species, often consisting of small and isolated populations, are more susceptible to losses of genetic variation due to genetic drift and restricted gene flow (Hamrick &Godt, Reference Hamrick and Godt1989). However, widespread species, usually consisting of historically larger and more continuous populations, maintain higher polymorphism and are less affected by drift (Premoli et al., Reference Premoli, Sauto, Allnutt and Newton2001). A better knowledge of the spatial organization of genetic diversity is of interest for a better preservation of natural populations in the face of environmental changes (Pressoir &Berthaud, Reference Pressoir and Berthaud2004). The heterogeneous distribution of genetic variation within and among populations is provided by mutation, genetic drift, due to finite population size, and heterogeneous natural selection, while gene flow and homogeneous directional selection tend to produce genetic homogeneity (Zhan et al., Reference Zhan, Linde, Jürgens, Merz, Steinebrunner and McDonald2005). Comparing patterns of population genetic differentiation at neutral marker loci with those of quantitative traits permits inferences about the relative role of selection in population divergence, by contrasting the degree of adaptive change with that of differentiation due solely to drift (Gomez-Mestre &Tejedo, Reference Gomez-Mestre and Tejedo2004). Results of a large number of studies have compared the genetic differentiation at quantitative traits (Q ST) and allozymes or molecular markers (F ST) (Spitze, Reference Spitze1993; Bonnin et al., Reference Bonnin, Prosperi and Olivieri1996; Merilä &Crnokrak, Reference Merilä and Crnokrak2001; Morgan et al., Reference Morgan, Evans, Garland, Swallow and Carter2005; Porcher et al., Reference Porcher, Giraud and Lavigne2006), showing differences between them in population structure. Three possible results from comparisons of F ST and Q ST indices can be found. First, if Q ST is significantly greater than F ST this means that the degree of differentiation at quantitative traits exceeds that achievable by genetic drift alone and, consequently, directional natural selection favouring different phenotypes in different populations must have been involved to achieve this much differentiation. Second, if Q ST and F ST are roughly equal the hypothesis that among-population variance is due to random genetic drift can not be rejected (Spitze, Reference Spitze1993; Merilä &Crnokrak, Reference Merilä and Crnokrak2001). Finally, if F ST is higher than Q ST, this means that natural selection must be favouring the same mean phenotype in different populations. Questions regarding the correlation between genetic variation in quantitative traits and neutral markers are important for both fundamental and applied research. In some cases quantitative and neutral molecular distances have been reported to show a significant positive correlation (Merilä &Crnokrak, Reference Merilä and Crnokrak2001; Stenoien et al., Reference Stenoien, Fenster, Tonteri and Savolainen2005; Zhan et al., Reference Zhan, Linde, Jürgens, Merz, Steinebrunner and McDonald2005), suggesting that variation at molecular markers can be used as a predictor of the degree of quantitative differentiation. However, some other studies do not support such correlation and hence molecular markers become inaccurate predictors of variation at quantitative traits (Reed &Frankham, Reference Reed and Frankham2001; Gomez-Mestre &Tejedo, Reference Gomez-Mestre and Tejedo2004). Absence of such association between genetic variation at quantitative traits and molecular markers might be explained by several genetic and environmental factors. These factors include a non-additive genetic component such as epistasis or dominance (Crnokrak & Roff, Reference Crnokrak and Roff1995), the conversion of non-additive genetic variance components to additive through genetic drift (Lopez-Fanjul et al., Reference Lopez-Fanjul, Fernandez and Toro2003), variation in mutation rates across loci, and variation in selection pressures and eco-geographical effects (Reed & Frankham, Reference Reed and Frankham2001).
Local adaptation of populations to environmental variation is a classic finding in plant ecology (Prosperi et al., Reference Prosperi, Jenczewski, Angevain and Ronfort2006). Genetic variability at quantitative traits is known to vary depending on environmental conditions (Hoffman & Merilä, Reference Hoffman and Merilä1999), although no universal of increased and decreased genetic variance with increased environmental stress has been observed (Bennington & McGraw, Reference Bennington and McGraw1996). On the other hand, numerous studies have detected associations between molecular markers and environmental factors (Ivandic et al., Reference Ivandic, Hackett, Nevo, Keith, Thomas and Forster2002).
The genus Medicago is one of most widespread genera of the Fabaceae, including approximately 83 different species and 18 infraspecies taxa (Bena et al., Reference Bena, Prosperi, Lejeune and Olivieri1998). Two-thirds are annual and one-third perennial (Lesins & Lesins, Reference Lesins and Lesins1979). In Tunisia, this genus represents an important proportion of native flora through all bioclimatic stages (Salhi-Hannachi et al., Reference Salhi-Hannachi, Boussaid and Marrakchi1998). Nineteen annual species naturally distributed over a very wide range of environmental conditions have been described (Pottier-Alapetite, Reference Pottier-Alapetite1979). They have distinct patterns of regional distribution and show a clear ecological preference in relation to edaphic and climatic factors (Salhi-Hannachi et al., Reference Salhi-Hannachi, Boussaid and Marrakchi1998). Model plants are facilitating the genetic characterization and comparative mapping of a number of traditional crops. Medicago truncatula has been widely accepted as a model legume to this end as it provides the essential tools for multiple aspects of legume genetics and genomics (Cook, Reference Cook1999). It is self-fertilizing, diploid (2n=16) and it has a relatively small genome (11·5 pg/2C; Blondon et al., Reference Blondon, Marie, Brown and Kondorosi1994) of about the same size as that of rice and 4 times larger than that of Arabidopsis. The selfing annual forage M. laciniata (cut-leaf medic) is a diploid species (2n=16). M. truncatula and M. laciniata have two different geographical distributions through the world and in Tunisia. The first is an omni-Mediterranean and a ubiquitous species in Tunisia. The second is the only species of genus Medicago which is limited to southern Mediterranean regions (Heyn, Reference Heyn1963); it is restricted in Tunisia to the inferior semi-arid, arid and Saharan stages (Badri et al., Reference Badri, Zribi, Soula, Lazrek, Badri, Khaldi, Yousfi, Djebali, Huguet and Aouani2004a). Due to their ability to be nodulated by N2-fixing bacteria to improve soil fertility, forage production and pastures, M. truncatula and M. laciniata need to be well understood for their better management in situ and for identification of interesting resources. These two species show different patterns of symbiotic specificity. While M. truncatula is nodulated by Sinorhizobium meliloti and S. medicae (Zribi et al., Reference Zribi, Mhamdi, Huguet and Aouani2004), nitrogen-fixing sinorhizobia with M. laciniata constitute a novel biovar (bv. medicaginis) of S. meliloti (Villegas et al., Reference Villegas, Rome, Maure, Domergue, Gardan, Bailly, Cleyet-Marel and Brunel2006). Although it has a small area, Tunisia is environmentally very diverse and therefore the natural populations of these two species are of great importance for possible use in breeding programmes of lines.
Microsatellite loci, or simple sequence repeats (SSRs), are tandem repeats of short oligonucleotides ubiquitously interspersed in eukaryotic genomes (Kashi et al., Reference Kashi, King and Soller1997). SSRs have been extensively used as DNA markers for identifying cultivars or accessions (Fahima et al., Reference Fahima, Röder, Grama and Nevo1998), or for genetic mapping (Thoquet et al., Reference Thoquet, Gherardi, Journet, Kereszt, Ane, Prosperi and Huguet2002) and population genetics and ecology studies (Innan et al., Reference Innan, Terauchi and Miyashita1997). The major constraint of using SSRs as molecular markers is the cost and effort required for their development, and this has restricted their use to only a few of the agriculturally important crops (Gutierrez et al., Reference Gutierrez, Vaz Patto, Huguet, Cubero, Moreno and Torres2005). A more widespread use of SSR markers in plants would be facilitated if such loci were transferable across species. Transferability of SSRs from M. truncatula has recently been evaluated for amplification and polymorphism within the genus (Julier et al., Reference Julier, Flajoulot, Barre, Cardinet, Santoni, Huguet and Huyghe2003; Eujayl et al., Reference Eujayl, Sledge, Wang, May, Chekhovskiy, Zwonitzer and Mian2004; Gutierrez et al., Reference Gutierrez, Vaz Patto, Huguet, Cubero, Moreno and Torres2005), and in all these studies high levels of both cross-amplification and polymorphism were detected in several Medicago spp. M. laciniata has not been included in these investigations. With the whole-genome sequencing effort under way for M. truncatula, the ability to transfer genetic information across species from this model species will become a very important aspect of legume genomics (Eujayl et al., Reference Eujayl, Sledge, Wang, May, Chekhovskiy, Zwonitzer and Mian2004).
In this study, we have analysed the genetic variation in four sympatric natural populations of M. laciniata and M. truncatula using quantitative traits and SSR markers. Associations were studied in both species between quantitative traits, SSR markers and eco-geographical factors. The aims of this study were: (i) to investigate the transferability of SSR markers from M. truncatula to M. laciniata, (ii) to assess and compare the genetic variability at quantitative traits and SSR markers available within and among sympatric populations of M. laciniata and M. truncatula, (iii) to compare divergence at quantitative traits (Q ST) and SSR loci (F ST) and to determine whether the genetic variability as determined by SSR markers is a good indicator for that at quantitative traits in both species, and finally (iv) to estimate associations of quantitative traits and molecular markers with site-of-origin eco-geographical factors.
2. Materials and methods
(i) Plant material
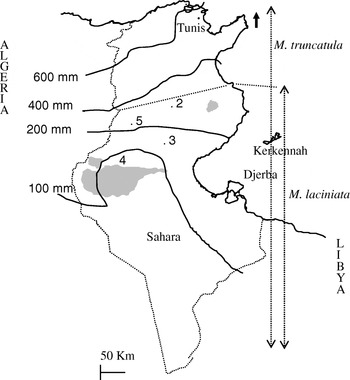
Four sympatric populations of M. laciniata and M. truncatula covering different regions of plant distribution in Tunisia were used (Fig. 1; Table 1). They were sampled in July 1999 in the arid (Jelma, Amra and Majel Bel Abbes) and Saharan (Deguache) stages. A collection site of mature pods, as defined here, is an ecologically homogeneous area of about 500 m2 which contains one population of each species. To minimize the chance of sampling the same individual more than once, genotypes of both species were collected from the same points, where present, every 4 m. However, when pods of both species could not be found at the same point we sampled them from two different points. These populations were selected on the basis of their belonging to different edaphic and climatic areas (Table 1) and of being accessible and abundant under natural conditions. Based on Heyn's (Reference Heyn1963) classification, constitutive lines of the studied populations of M. laciniata belong to two varieties, while those of M. truncatula belong only to the tricycla variety. Indeed, analysed populations of M. laciniata include lines belonging to: (i) laciniata variety only (Jelma and Amra), (ii) brachyacantha and laciniata varieties (Majel Bel Abbes) and (iii) brachyacantha variety alone (Deguache). To distinguish between natural populations of the two species, the following abbreviations were used: TN for M. truncatula and TNL for M. laciniata.
Map of Tunisia with the location of M. laciniata and M. truncatula sampling sites. Abbreviations: 2, Jelma (latitude (N)=35° 14′, longitude (E)=09° 30′); 3, Amra (latitude (N)=34° 35′, longitude (E)=09° 09′); 4, Deguache (latitude (N)=33° 59′, longitude (E)=08° 12′); 5, Majel Bel Abbes (latitude (N)=34° 19′, longitude (E)=08° 41′).
List of the four eco-geographical factors of site-of-origin and classification, in respect to each factor, of sympatric populations of M. laciniata (TNL) and M. truncatula (TN)
(TNL2; TN2), Jelma; (TNL3; TN3), Amra; (TNL4; TN4), Deguache; (TNL5; TN5), Majel Bel Abbes.
Lines were created by two or three generations of spontaneous selfing in the greenhouse. Each population was constituted by 10 lines, excepted for the Amra population (TN3) of M. truncatula which has 11 lines. We assumed that offspring should be genetically identical in each presumed line. Consequently, the within-line variance can be considered as environmental while the among-line variance component is assumed to be solely genetic (Falconer & Mackay, Reference Falconer and Mackay1996; Bonnin et al., Reference Bonnin, Prosperi and Olivieri1997).
(ii) Quantitative traits
Forty (40) genotypes (original plants) of M. laciniata and 41 of M. truncatula were analysed in this trial. To estimate environmental variance within a genotype (Falconer & Mackay, Reference Falconer and Mackay1996), five seeds per genotype were used. A total of 405 plants were analysed in this study. Line seeds of both species were surface-sterilized and scarified with concentrated sulphuric acid. Soaked seeds were sown in Petri dishes on agar agar 0·9% medium before being vernalized at 4°C for 96 h. Seedlings were transplanted into plastic hampers (30/50 cm) containing a mixture of sand/peat (1:3/2:3) in the greenhouse of the Centre de Biotechnologie à la Technopole de Borj-Cédria (CBBC) in February 2003. Hampers were randomized and growth conditions were as follows: temperature 25/15°C (day/night) and moisture about 50–80%.
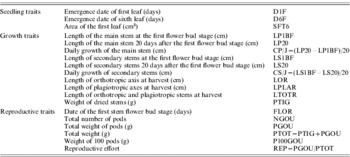
During the plant growth cycle, 19 quantitative characters were measured. Some traits were used by Bonnin et al. (Reference Bonnin, Prosperi and Olivieri1997) and they were all also used by Badri et al. (Reference Badri, Zribi, Soula, Lazrek, Badri, Khaldi, Yousfi, Djebali, Huguet and Aouani2004a, Reference Badri, Huguet and Aouanib). All traits revealed high heritability levels. They were divided into two categories: vegetative and reproductive traits (Table 2). For weight determination, plant organs were dried at 70°C for 48 h.
List of measured quantitative traits and their abbreviations
(iii) Molecular markers
Extraction of DNA from leaves lines was carried out according to Rogers &Bendish's (Reference Rogers, Bendish, Gelvin and Schiperoot1988) protocol modified by Gherardi et al. (Reference Gherardi, Mangin, Bonnet, Goffinet and Huguet1998). Molecular characterization of studied lines was performed using a total of 20 SSR loci (Table 3).
Name, linkage group, position, core sequence, primers and origin of the 20 SSR loci used
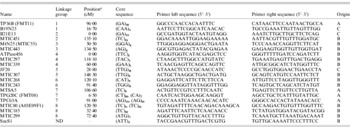
A, microsatellite-enriched genomic library; B, expressed sequence tags (ESTs); C, bacterial artificial chromosome (BAC); ND, not determined.
a Genetic distance from the upper telomere estimated according to the LR4 framework genetic map (Jemalong A17×DZA315·16) (P. Thoquet, M. Gherardi, G. Cardinet &T. Huguet, unpublished results).
Final concentrations of the PCR cocktail included 11·4 μl of distilled water, 2×10 Taq buffer (Uptima), 1·5 mM MgCl2, 0·2 mM dNTPs, 50 ng of each primer, 0·16 U Taq DNA polymerase per 20 μl reaction, and 30 ng of genomic DNA. Each reaction was overlaid with 25 μl of mineral oil to prevent evaporation. Amplifications were carried out in a thermal cycler (Biometra) for 4 min at 94°C, followed by 40 cycles of 30 s at 94°C, 30 s at 55°C and 30 s at 72°C, followed by a final extension for 6 min at 72°C, and an indefinite hold at 4°C. Fragments generated by amplification were separated according to size on 3·5% agarose gels run in 0·5×TBE (45 mmol/l Tris, 45 mmol/l boric acid, 0·02 mmol/l EDTA pH 8) using 110 V for about 3 h, stained with ethidium bromide (EtB), and visualized by illumination with ultraviolet light (312 nm). Microsatellite allele sizes were estimated on 6% non-denaturing polyacrylamide gels. The Marcel ladder (Bio-Rad) was used as standard size.
(iv) Statistical analyses
(a) Quantitative traits
Genetic variance in quantitative traits was partitioned into within- and among-population components using SAS Proc GLM (type III) (SAS 7.02, SAS Institute, 1998). The model included population and genotype within population. To estimate variance components, population and genotype were considered as random effects. Phenotypic mean values of each population were compared for all quantitative traits with the Duncan multiple range test.
Total phenotypic variance (σT2) was the sum of three components of variance: (i) that arising among populations (σp2), (ii) that between genotypes within populations (σg2) and (iii) that due to error arising between individuals within the original genotype (σe2). Broad-sense heritability (H 2) was estimated for each character as the ratio of the variance arising between genotypes (σg2) on the sum of (σg2) and (σe2) (Bonnin et al., Reference Bonnin, Prosperi and Olivieri1997). The level of population differentiation at quantitative traits (Q ST) was computed as described in Stenoien et al. (Reference Stenoien, Fenster, Tonteri and Savolainen2005) for a completely selfing species as follows:
The calculation of 95% confidence intervals (CIs) for Q ST was performed by 5000 bootstrap replicates in SAS Interactive Matrix Language (IML). The coefficient of genetic variation (CV g) was obtained as shown below (Bonnin et al., Reference Bonnin, Prosperi and Olivieri1997):
where m is the population phenotypic mean.
Phenotypic correlations among measured traits were estimated by the SAS CORR procedure (SAS 7.02, SAS Institute, 1998). A standardized principal component analysis (PCA) (PRINCOMP procedure – SAS software) was performed on the correlation matrix of the synthetic variable based on the mean line values (average of the five replications). To represent the relationships between populations in both species at quantitative traits, cluster analysis was performed to generate a phenogram based on the Euclidean distance of dissimilarity calculated using all PCA scores.
(b) SSR markers
Molecular genetic diversity was estimated within each population using seven indices: (i) the number of multilocus genotypes (Geno), (ii) the mean number of alleles per locus (A) (total number of alleles/number of loci), (iii) the allele number (sum of alleles obtained for each locus) (An), (iv) the mean observed heterozygosity (Ho), (v) the gene diversity (He, expected heterozygosity; Nei, Reference Nei1978), (vi) the number of unique alleles (i.e. alleles present in only one population) (Ua) and (vii) linkage disequilibria (LD%) under Hardy–Weinberg equilibrium using Genetix software version 4.02 (Belkhir, Reference Belkhir2001) (Genetix@crit.univ-montp2.fr). Linkage disequilibrium was estimated as described in Volis et al. (Reference Volis, Yakubov, Shulgina, Ward, Zur and Mendlinger2001). Molecular differentiation among populations (F ST) was used as a measure of genetic differentiation among populations for the polymorphic loci. It was defined as a standardized genetic variance among populations and it was estimated according to Weir &Cockerham's (Reference Weir and Cockerham1984) method. Overall F ST among populations and pairwise estimates for all pairs of populations were computed, running the FSTAT program (Goudet, Reference Goudet1995). CIs, based on resampling techniques, are provided with the software and involve jack-knifing over all loci to obtain the mean and the standard error of the overall F ST, and bootstrapping over loci to obtain 95% CIs. The existence of a geographic pattern of molecular genetic variation was analysed as described in Rousset (Reference Rousset1997) through Mantel tests (Mantel, Reference Mantel1967) carried out between matrices of log-transformed geographic distances and odds-transformed genetic distances F ST/(1−F ST). The matrix of geographical distance between populations was calculated by measuring the shortest distance between two points in the map, using geographical coordinates for each site.
To visualize the relationships among populations within and between the two species at SSR markers, a neighbour-joining (NJ) analysis based on Nei's (Reference Nei1978) genetic distances among populations was performed. Support for clustering was determined by a bootstrap procedure applied on SSR alleles (1000 replications). The Nei's genetic distances were computed using Genetix software (Belkhir, Reference Belkhir2001), while the NJ analysis and bootstrapping were performed with Darwin software (Perrier &Jacquemoud-Collet, Reference Perrier and Jacquemoud-Collet2006).
(c) Quantitative traits versus SSR markers
Sampling variances on estimates of variance components can be obtained using bootstrap or jack-knife procedures. As suggested by Bonnin et al. (Reference Bonnin, Prosperi and Olivieri1996), we used bootstrapping over loci and traits (5000 bootstraps) to estimate means and 95% CIs of Q ST and F ST from the observed distribution. Association between within-population genetic variation for quantitative traits (CV g) and SSR markers (He) was estimated by computing the Pearson correlation coefficient (r) (Volis et al., Reference Volis, Yakubov, Shulgina, Ward and Mendlinger2005).
(d) Association of quantitative traits and SSR markers with environmental factors
Thirteen eco-geographical factors of the sampling sites were recorded: texture, pH, saturation (ml/100 g), electro-conductivity (mmho/cm), total calcareous (%), active calcareous (%), organic matter (%), carbon (%), assimilated P2O5 and K2O, climate, mean annual rainfall (mm) and altitude (m). Only four of these 13 factors (texture, organic matter, mean annual rainfall and altitude), which showed significant differences between studied sites, were retained. To determine the influence of the eco-geographical factors on the behaviour of natural populations at quantitative traits, two analyses were performed. First, variances component estimates within and among populations were computed from quantitative data using SAS Proc Mixed (SAS Institute, 1998) with the following mixed model:
where y ijklmn are the observations for all quantitative traits, μ is the population mean, P i is the random effect of population, L j(i) is the random effect of genotype nested within population, T k is the fixed effect of texture, A l is the fixed effect of altitude, R m is the effect of mean annual rainfall considered as co-variable, and e ijklmn a random residual effect. Second, correlations between quantitative traits and environmental factors were computed using Pearson correlation coefficients (r) (Jaramillo-Correa et al., Reference Jaramillo-Correa, Beaulieu and Bousquet2001). The significance level was set to 0·05, and adjusted for multiple comparisons by Bonferroni corrections. Associations of gene diversity (He) of each locus and mean gene diversity over all loci (He all) with eco-geographical factors were estimated using the Spearman rank correlation analysis (Turpeinen et al., Reference Turpeinen, Tenhola, Manninen, Nevo and Nissilä2001).
3. Results
(i) Quantitative traits
Analysis of variance of population effect showed that 18 of the 19 measured quantitative traits exhibited significant differences among populations of M. truncatula versus 16 between those of M. laciniata (data not shown). Generally, sympatric populations of M. truncatula produced more vegetative biomass than those of M. laciniata; the exception being the Deguache population. In both species, a North–South gradient for the time flowering trait (FLOR) was found. Indeed, populations coming from further South were the earliest flowering. Furthermore, M. laciniata is earlier flowering than M. truncatula and it allocated the most effort to reproduction (REP) (Table 4).
Population means, coefficients of genetic variation (CVg) (in parentheses) and heritabilities (H2) of 19 measured quantitative traits for sympatric populations of M. laciniata (TNL) and M. truncatula (TN)
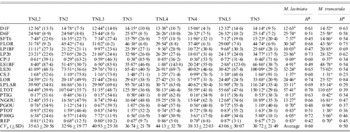
Means followed by the same letters are not significantly different between analysed sympatric populations of M. laciniata and M. truncatula at P=0·05 based on Duncan's multiple-range test.
(TNL2; TN2), Jelma; (TNL3; TN3), Amra; (TNL4; TN4), Deguache; (TNL5; TN5), Majel Bel Abbes.
The total heritability values (H 2) given above were estimated on all populations grouped together for each species.
Table 4 gives the coefficients of genetic variation (CV g) of each trait and for each population in both species. In M. laciniata the average coefficient of variation was 35·63% in Jelma (SD=20·56%), 40·93% in Amra (SD=25·38%), 44·13% in Deguache (SD=32·70%) and 43·06% in Majel Bel Abbes (SD=30·07). The CV g was 32·96% in Jelma (SD=19·77%), 36·74% in Amra (SD=21·78%), 38·33% in Deguache (SD=22·03%) and 30·72% in Majel Bel Abbes (SD=21·49%) for M. truncatula. We will arbitrarily consider as large those coefficients above 25%. In M. laciniata, 11 traits of 19 measured traits in Jelma, 12 of 19 in Amra and Majel Bel Abbes, and 14 of 19 in Deguache, revealed high CV g. In M. truncatula, 11 of 19 measured traits in Jelma and Majel Bel Abbes, and 14 of 19 in Amra and Deguache, showed a large CV g. Therefore, a higher within-population genetic variation (CV g) (14/19) was found in Deguache for M. laciniata and in Amra and Deguache for M. truncatula.
For M. laciniata, heritability of measured traits varied between H 2=0·42 for REP and H 2=0·74 for length of the orthotropic axis at harvest (LOR) with an average of H 2=0·60 (Table 4). For M. truncatula, it ranged from H 2=0·23 for daily growth of secondary stems (CS/J) to H 2=0·84 for the LOR trait with a mean of H 2=0·50. Therefore, for both species the higher heritability levels were found for the LOR trait.
Taking into account measured traits per group (Table 2), the higher heritability levels for M. laciniata were found for growth traits (H 2=0·63), followed by reproductive traits (H 2=0·58) and seedlings traits (H 2=0·52). For M. truncatula, the higher heritability level was found for seedlings traits (H 2=0·58) while the growth and reproductive traits displayed the same value (H 2=0·48). Thus, in contrast to the seedling traits group, for the two remaining groups of traits the higher heritability levels (H 2) were observed for M. laciniata.
M. laciniata showed significantly lower quantitative differentiation among populations (Q ST=0·12) than M. truncatula (Q ST=0·45). The bootstrap confidence intervals showed that these overall Q ST values are significantly greater than zero. For both species, Q ST ranged from Q ST=0·00 to Q ST=0·61 and Q ST=0·82 for M. laciniata and M. truncatula, respectively (Table 5). For M. laciniata, the higher values were observed for reproductive traits (Q ST=0·22), followed by those of growth traits (Q ST=0·08) and seedling traits (Q ST=0·02). In M. truncatula higher quantitative differentiation among populations was found for growth traits (Q ST=0·52), followed by reproductive characters (Q ST=0·49) and seedling traits (Q ST=0·14). Therefore, in both species lower Q ST levels were observed for the seedling traits group.
Population differentiation for quantitative traits (QST) and SSR loci (FST) among M. laciniata and M. truncatula populations
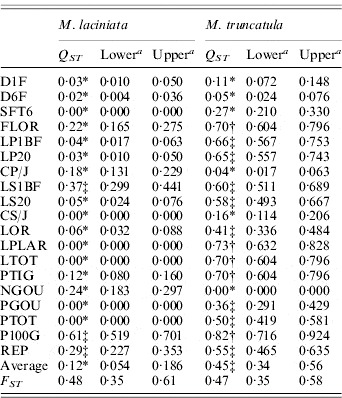
a The lower and upper confidence limits for a 95% confidence interval for Q ST and F ST based on 5000 bootstrap samples (bootstrapping over traits/loci).
* Q ST was significantly smaller than F ST at P=0·05; ‡Q ST was not significantly different to F ST at P=0·05; †Q ST was significantly larger than F ST at P=0·05.
Among a total of 171 possible correlations between all measured variables, 137 and 146 were significant for M. laciniata and M. truncatula, respectively (Supplementary Tables 1 and 2, which can be found on the Journal's website: http://journals.cambridge.org). Established correlations between measured traits in each species displayed generally the same signs, where the majority of correlations are positive. Growth parameters were positively correlated between them and with flowering time trait (FLOR). This latter trait is negatively correlated with the reproductive effort parameter (REP). Plant vigour (LTOT) is positively correlated with phenological traits (NGOU and PGOU). For both species, it was found that earlier emerging seedlings (D1F) produced the lowest total vegetative biomass (PTOT).
Matrix of correlations established between 19 quantitative traits in natural populations of M. laciniata
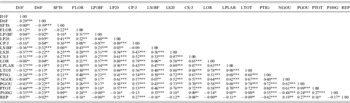
Significance levels: ns, not significant (P>0·05); *P⩽0·05; **P⩽0·01; ***P⩽0·001.
Matrix of correlations established between 19 quantitative traits in natural populations of M. truncatula
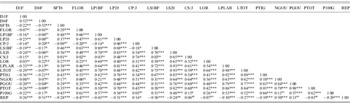
Significance levels: ns, not significant (P>0·05); * P⩽0·05; ** P⩽0·01; *** P⩽0·001.
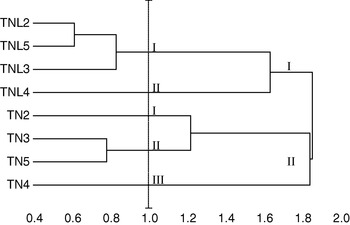
Five principal components, whose eigenvalue was higher than 0·80, were found to correspond to 87·24% of the total variation. Using these five components, constitutive populations of both species were clustered based on Euclidean distances of dissimilarity. Our results showed that M. laciniata and M. truncatula form two distinguishable groups; in addition analysed populations in each species cluster differently (Fig. 2). For a Euclidean distance of 1, natural populations of M. laciniata form only two groups whereas those of M. truncatula form three groups. In addition, the Deguache population in each species forms a separate group. This finding is expected because the Deguache population of M. laciniata is the only one having lines which belong to only the brachyacantha variety. Moreover, even if all constitutive lines of M. truncatula populations belong to the tricycla variety, those of Deguache population exhibited pods with the smallest sizes. On the other hand, this is the only population of both species that comes from the Saharan stage.
Hierarchical cluster of sympatric populations of M. laciniata (TNL) and M. truncatula (TN) based on Euclidean distances of dissimilarity computed using all principal component analysis (PCA) scores. Abbreviations: (TNL2; TN2), Jelma; (TNL3; TN3), Amra; (TNL4; TN4), Deguache; (TNL5; TN5), Majel Bel Abbes.
(ii) Molecular markers
In a preliminary study, the analysis of amplification transferability of 52 SSR loci from the model legume M. truncatula to M. laciniata revealed that about 78·85% of them amplified with M. laciniata. This result suggests that SSR markers developed on the M. truncatula genome could be considered as valuable genetic markers for M. laciniata. Twenty (20) SSR loci of these 52 tested markers were used to analyse molecular genetic diversity in sympatric populations of M. laciniata and M. truncatula.
Among the 20 SSR loci used, 65% and 95% were polymorphic with M. laciniata and M. truncatula, respectively. Using these SSR markers, a total of 56 and 68 alleles were found in M. laciniata and M. truncatula, respectively. Among the 40 and 41 analysed lines of M. laciniata and M. truncatula, respectively, 26 and 35 multilocus genotypes were distinguished. For each pair of sympatric populations of both studied species, the higher common alleles per locus were found in the Amra population (9 alleles), followed by the Deguache (5 alleles), Majel Bel Abbes (4 alleles) and Jelma populations (3 alleles). The within-population molecular diversity parameters of M. laciniata and M. truncatula are given in Table 6. These results revealed generally that the Deguache and Amra populations of M. laciniata and M. truncatula, respectively, have contrasting behaviours relative to the other populations in each species.
SSR markers diversity, averaged over loci, in sympatric populations of M. laciniata and M. truncatula
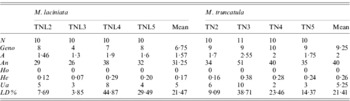
(N), line number; (Geno), the number of multilocus genotypes; (A), the mean number of alleles per locus (total number of alleles/number of loci); (An), allele number (sum of alleles obtained for each locus); (Ho), the mean observed heterozygosity; (He, expected heterozygosity; Nei, Reference Nei1978), the gene diversity; (Ua), the number of unique alleles, i.e. alleles found only in genotypes from one population; (LD%), linkage disequilibria under Hardy–Weinberg equilibrium.
(TNL2; TN2), Jelma; (TNL3; TN3), Amra; (TNL4; TN4), Deguache; (TNL5; TN5), Majel Bel Abbes.
At the population scale, for both species the highest gene diversity (He) across all loci was found in the Deguache and Amra populations of M. laciniata and M. truncatula, respectively (Table 6). The lowest gene diversity levels were observed in the Amra population of M. laciniata and the Jelma population of M. truncatula.
A large molecular differentiation among populations (F ST) was found for both species (Table 7), as the bootstrap confidence intervals revealed F ST values are significantly greater than zero. In M. laciniata, F ST ranges from 0·26 to 0·57 with an average for all loci of F ST=0·48; and it varies for M. truncatula between 0·25 and 0·65 with a mean of F ST=0·47. Thus, there was not a significant difference in overall F ST between the two analysed species. Molecular differentiations among populations (F ST) are not dependent on geographical distance; with (r=0·26; P=0·46) and (r=0·53; P=0·30) for M. laciniata and M. truncatula, respectively. This finding suggests that there is no evidence for an isolation-by-distance pattern of population differentiation in either species.
Pairwise population differentiation at SSR markers (FST) of sympatric populations of M. laciniata and M. truncatula
(TNL2; TN2), Jelma; (TNL3; TN3), Amra; (TNL4; TN4), Deguache; (TNL5; TN5), Majel Bel Abbes.
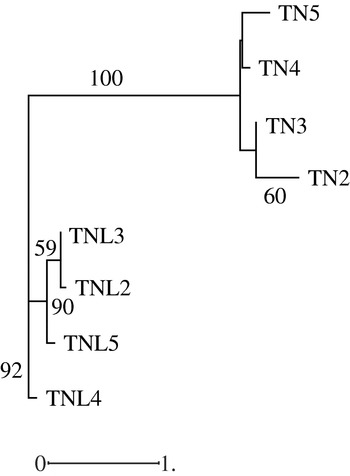
Hierarchical classification of analysed populations in both species based on molecular data revealed that the two species form two distinguishable groups; in addition the studied populations in each species cluster differently (Fig. 3). While the Deguache population constitutes a separate group in M. laciniata, the Jelma population is in M. truncatula. This finding is expected for M. laciniata because the Deguache population is the only one where all their constitutive lines belong to only the brachyacantha variety. Moreover, this is the only population that comes from the Saharan stage.
Neighbour-joining analysis based on microsatellite loci data among natural populations of M. laciniata (TNL) and M. truncatula (TN) using the Nei genetic distances. The numbers on the branches indicate bootstrap values (expressed in percentages) and are shown for all clusters with >50% bootstrap support.
(iii) Quantitative traits versus SSR markers
For M. laciniata, the Q ST values for the majority of analysed traits (16/19) were significantly lower than F ST for SSR loci, while only three traits (3/19) displayed no statistical difference between Q ST and F ST (Table 5). Furthermore, we found three different patterns with almost homogeneous partition of population differentiation for M. truncatula across these quantitative traits. First, we found that eight of the 19 measured traits showed no significant difference in the level of Q ST and F ST. Second, five of these traits exhibited significantly greater Q ST than F ST. Third, the remainder of the measured traits (6/19) displayed significantly smaller Q ST than F ST. For both species, estimates of within-population quantitative genetic variation (CV g) varied independently on that estimated at SSR markers (He), with (r=0·65; P=0·35) and (r=0·60; P=0·40) for M. laciniata and M. truncatula, respectively.
(iv) Associations of quantitative traits and SSR markers with eco-geographical factors
The site-of-origin environmental factors explain about 5·85% and 11·27% of total quantitative variation among natural populations of M. laciniata and M. truncatula, respectively. Of 76 possible correlations between measured traits and environmental factors, seven and 45 are significant for M. laciniata and M. truncatula, respectively (Table 8). The environmental characteristic with the greatest influence on the quantitative traits of natural populations of M. laciniata is texture (42·86% of significant correlations), followed by mean annual rainfall and altitude (28·57%) and organic matter (0). Furthermore, for M. truncatula the highest effect was observed for mean annual rainfall and altitude (33·33%), followed by organic matter (24·44%) and texture (8·88%). On the other hand, no significant associations were found between gene diversity (He) of each locus and mean gene diversity over all loci (He all) with eco-geographical factors for either of the analysed species (data not shown).
Estimated correlations between 19 measured traits for M. laciniata and M. truncatula and site-of-origin eco-geographical factors
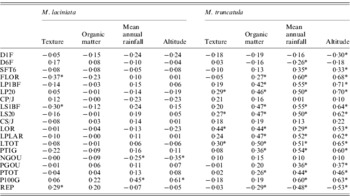
* Significant after using Bonferroni correction at α=(0·05/76=0·00066).
4. Discussion
(i) Transferability of SSR markers from M. truncatula to M. laciniata
Given that M. laciniata and M. truncatula belong to the sections Leptospirae and Pachyspirae, respectively, this high proportion of amplification transferability (78·85%) of SSR markers from M. truncatula to M. laciniata was not expected. Indeed, a reduction in amplification (50% to 100%) of SSR markers with species belonging to two different sections has been reported (Byrne et al., Reference Byrne, Marquez-Garcia, Uren, Smith and Moran1996). To confirm the amplification of the expected M. truncatula SSRs with M. laciniata and other annual species of genus Medicago, several amplified PCR products with the corresponding forward and reverse SSR primers in one individual per species were sequenced (M. Laouar, M. Gherardi, M. Badri &T. Huguet, unpublished results). Generally, all primer sets in this study yielded PCR products within the expected size ranges in all the Medicago spp. Eujayl et al. (Reference Eujayl, Sledge, Wang, May, Chekhovskiy, Zwonitzer and Mian2004) reported a higher level of transferability (89%) of expressed sequence tag (EST)-SSR markers across six species of Medicago (Gutierrez et al., Reference Gutierrez, Vaz Patto, Huguet, Cubero, Moreno and Torres2005). In addition to M. truncatula, they tested the SSR markers on three other Medicago species (M. littoralis, M. sativa subsp. sativa cv. Coussouls, and M. sativa subsp. sativa natural population from Spain) and three additional legume species (Pisum sativum, Phaseolus vulgaris and Glycine max). EST-SSRs from M. truncatula have also been assessed for transferability and polymorphism with the perennial cultivated species M. sativa (Julier et al., Reference Julier, Flajoulot, Barre, Cardinet, Santoni, Huguet and Huyghe2003). A synthetic review (Rossetto, Reference Rossetto and Henry2001) based on major published studies carried out on cross-transferability of plant SSRs reported a success rate of 35%. However, sequence analysis determined that the level of conservation in the SSR motif was very low, while the flanking regions were generally well conserved (Gutierrez et al., Reference Gutierrez, Vaz Patto, Huguet, Cubero, Moreno and Torres2005).
(ii) Quantitative and molecular genetic diversity levels in M. laciniata and M. truncatula
While the two species revealed a similar level of within-population variation at quantitative traits for the Jelma and Deguache populations, M. laciniata was more polymorphic in the Majel Bel Abbes population and M. truncatula was polymorphic in the Amra population. As regards molecular markers, M. truncatula exhibited the highest level of polymorphism, with the exception of the Deguache population. Overall, we found that M. laciniata displayed significantly lower quantitative differentiation among populations (Q ST) than M. truncatula. In addition, established correlations between quantitative traits and eco-geographical factors were more moderate for M. laciniata than for M. truncatula. These findings suggest a higher capacity of M. truncatula to adapt to local varying environmental conditions due to its important phenotypic plasticity. In its natural habitat, M. laciniata seemed to be more influenced by anthropogenic effects than M. truncatula. Indeed, M. laciniata grows spontaneously only in areas which have not been ploughed for at least 2 years (M. Badri, personal observations). Geographical distribution ranges of these two species in Tunisia might be one possible explanation of this observed difference in phenotype plasticity. While M. truncatula is a widespread species, M. laciniata is restricted to the inferior semi-arid, arid and Saharan stages. In species with widespread distributions and well-connected populations, a reduction in genetic diversity within populations probably contributes to population extinctions. However, it is likely to be more severe for species occurring in isolated habitats because their populations will tend to be less numerous and may be less well connected or occur over narrow geographical regions (Jump &Penuelas, Reference Jump and Penuelas2005). In this collection of M. laciniata and M. truncatula and for all used SSRs no heterozygous genotype was identified. Self-fertilizing generations are the most obvious reason for this finding. However, any outcrossing events might be compensated by the two or three selfing consecutive generations performed for the analysed populations. In contrast to the molecular variation, the quantitative genetic variation was larger within populations of M. laciniata (88%) and M. truncatula (55%) than between them. Turpeinen et al. (Reference Turpeinen, Tenhola, Manninen, Nevo and Nissilä2001) reported that the partitioning of genetic variation within and among populations may potentially be dependent on the number of samples and the marker system applied. Generally, self-fertilizing plant species tend to have less within-population genetic variation than outcrossing plant species, and greater among–population variation (Charlesworth, Reference Charlesworth2003). This is a direct consequence of the mating system. Inbreeding reduces the effective population size, and consequently enhances the effect of genetic drift.
Phylogenetic relationships among populations between and within M. laciniata and M. truncatula based on quantitative traits and SSR markers revealed that the two species were genetically distinct from each other. We found that the genetic structure between studied populations in both species was more similar at SSR loci than at quantitative traits. This finding is in agreement with observed population differentiation in both species at quantitative traits (Q ST) and SSR markers (F ST). While M. laciniata displayed significantly lower quantitative differentiation among populations (Q ST) than M. truncatula, no significant difference was found between the two species at SSR markers (F ST). The Deguache population appeared as a separate cluster in both species at quantitative traits as well as in M. laciniata at SSR markers. Accordingly, the Deguache population of M. laciniata is the only population which includes lines belonging to only the brachyacantha variety. For M. truncatula even if all constitutive lines of this population, as those of other studied populations, belong to the tricycla variety it exhibited pods with the smallest sizes. Moreover, Deguache is the only studied population that comes from the Saharan bioclimatic stage. For M. laciniata, the highest within-population variation at quantitative traits and SSR markers was found in this population. This finding is in accordance with the niche-width variation theory (Van Valen, Reference Van Valen1965), which predicts higher genetic diversity in a broader spatiotemporal and/or stressful environment (Turpeinen et al., Reference Turpeinen, Tenhola, Manninen, Nevo and Nissilä2001). Independently of species effect, established correlations between measured traits displayed generally the same signs. Overall, the signs of these correlations are in agreement with those reported for French natural populations of M. truncatula (Bonnin et al., Reference Bonnin, Prosperi and Olivieri1997).
(iii) Quantitative traits versus SSR markers
Alternative methods for evaluating the significance of the difference between estimates of F ST and Q ST could be constructed using Bayesian approaches (Holsinger &Wallace, Reference Holsinger and Wallace2004); however, we have chosen to apply bootstrap methodologies as these have been used most commonly to test hypotheses of neutral or adaptive divergence among populations in previous studies (Morgan et al., Reference Morgan, Evans, Garland, Swallow and Carter2005). One of the central questions facing evolutionary biologists is the relative degree to which random processes and natural selection lead to evolutionary change (Spitze, Reference Spitze1993; Morgan et al., Reference Morgan, Evans, Garland, Swallow and Carter2005). We found that about the totality of measured traits for M. laciniata exhibited significantly lower Q ST than F ST. This finding and the observed lack of correlation between F ST values and geographical distance among populations support the hypothesis of convergent selection for these traits. On the other hand, we found three different patterns of population differentiation across these 19 quantitative traits for M. truncatula. First, we found that the majority of these traits (8/19) displayed no significant difference in the level of Q ST and F ST, indicating that the effects of selection and drift are indistinguishable. However, significant correlations were established between these traits and eco-geographical factors, consistent with spatial heterogeneity selection rather than genetic drift. Second, we found that five of these traits displayed significantly higher Q ST than F ST for M. truncatula, suggesting that divergent selection for local adaptation played a significant role in the evolution of these traits. The presence of significant correlations between these traits and eco-geographical factors may suggest that these particular characters are adapting in response to the regional differences detected in these environmental factors. Third, the remainder of the 19 measured traits exhibited significantly smaller Q ST than F ST, consistent with convergent selection favouring the same phenotype in a different environment. A review by Merilä &Crnokrak (Reference Merilä and Crnokrak2001) reported that more than 20 independent studies have compared F ST and Q ST. Estimates of Q ST have been based on an average of quantitative traits, where estimates of F ST in most of these studies have been based on allozymes, RAPD and RFLP, and only a few on SSR markers. Overall, the majority of studies which used SSR markers for the estimation of F ST generally showed that F ST is on average equal to or greater than Q ST (Merilä &Crnokrak, Reference Merilä and Crnokrak2001; Porcher et al., Reference Porcher, Giraud and Lavigne2006). For the remaining molecular markers used, the overall trend revealed by these studies is that quantitative traits often show a higher level of population differentiation than molecular markers (Q ST>F ST), suggesting that diversifying selection is commonly operating on the former, at least on a broad scale (i.e. among populations) (Podolsky &Holtsford, Reference Podolsky and Holtsford1995; Bonnin et al., Reference Bonnin, Prosperi and Olivieri1996). Depending on the marker type, some differences in F ST values were observed but they were also relatively dependent on plant species (Isabel et al., Reference Isabel, Beaulieu, Thériault and Bousquet1999).
On the other hand, our results showed no significant associations (P>0·05) between within-population genetic variability of quantitative traits (CV g) and SSR markers (He) in either of the analysed species. As the quantitative traits examined in this study were found to be adaptive, it is not surprising that we failed to detect a relationship between SSR loci He and variation in any of the quantitative traits. This finding is in agreement with numerous studies which have reported no significant association between molecular marker and phenotypic distance measures (Podolsky &Holtsford, Reference Podolsky and Holtsford1995; Reed &Frankham, Reference Reed and Frankham2001; Gomez-Mestre &Tejedo, Reference Gomez-Mestre and Tejedo2004; Volis et al., Reference Volis, Yakubov, Shulgina, Ward and Mendlinger2005). Many genetic and environmental factors could weaken the expected association between genetic variation at molecular markers and quantitative traits (Zhan et al., Reference Zhan, Linde, Jürgens, Merz, Steinebrunner and McDonald2005). Recently, Reed &Frankham (Reference Reed and Frankham2001) conducted a meta-analysis based on more than 70 data sets across various species and found that the correlation between the genetic variation of molecular markers and quantitative traits was not significant, with an overall correlation coefficient of −0·08. The low levels of linkage disequilibria (LD) (<50%) found in studied populations of M. laciniata and M. truncatula might be one possible factor behind the absence of significant association between genetic variation of quantitative traits and SSR markers. Indeed, the strong LD in a predominantly selfing species would contribute to similar patterns of molecular and phenotypic genetic variation under the neutral model (Beer et al., Reference Beer, Goffreda, Phillips, Murphay and Sorrells1993). In the absence of natural selection, there should therefore be a strong association between F ST and Q ST.
(iv) Associations of quantitative traits and SSR markers with eco-geographical factors
Climate change is multidimensional and simultaneous changes may occur in a number of factors such as temperature, precipitation, growing season length and changes in day length during latitudinal range changes (Jump &Penuelas, Reference Jump and Penuelas2005). In this study, overall results showed significant effects of the four retained eco-geographical factors on quantitative traits among populations for both species. Established correlations between quantitative traits and eco-geographical factors were generally more moderate for M. laciniata than for M. truncatula, probably reflecting the fact that the two species do not exhibit the same genetic bases for local adaptation to varying environmental conditions. On the other hand, the finding of many correlations between quantitative traits and environmental factors suggests that these particular characters are adapting in response to the regional differences detected in such factors. These observations are similar to those found in populations of Triticum dicoccoides (wild emmer wheat) (Li et al., Reference Li, Krugman, Fahima, Beiles, Korol and Nevo2001) and in Hordeum spontaneum (wild barley) (Huang et al., Reference Huang, Beharav, Youchun, Kirzhner and Nevo2002), showing a significant micro-geographical genetic differentiation in response to climate (solar radiation, temperature and aridity stress). Moreover, this micro-geographical adaptive differentiation with respect to climate was also found in tree species such as Pinus edulis (pinon pine) (Mitton &Duran, Reference Mitton and Duran2004).
Numerous studies have reported significant correlations between SSR markers and eco-geographical factors, suggesting the operation of natural selection on these markers by creating SSR loci regional divergence. These results were found in wild emmer wheat (Li et al., Reference Li, Röder, Fahima, Beiles, Korol and Nevo2000), in wild barley (Ivandic et al., Reference Ivandic, Hackett, Nevo, Keith, Thomas and Forster2002) and in the selfing plant Arabidopsis thaliana (Innan et al., Reference Innan, Terauchi and Miyashita1997). In agreement with Jaramillo-Correa et al. (Reference Jaramillo-Correa, Beaulieu and Bousquet2001), our findings do not support this hypothesis, suggesting that the SSR markers used were selectively neutral.
Our findings suggest that observed genetic variability patterns were dependent on global species divergence due to niche specialization and convergence due to local selection by the particular eco-geographical factors in each sympatric site. To our knowledge, this is the first report of an analysis of genetic variability of sympatric natural populations of two annual species of genus Medicago that have two different geographical distributions ranges. Further studies are required to analyse the mechanisms underlying adaptive genetic differentiation within and among natural populations of both species in relation to eco-geographical factors. We call also for further research to focus on the ecological genomics of abiotic and biotic stress tolerance in sympatric populations of M. laciniata and M. truncatula.
The authors thank F. Lazrek and M. Gherardi for molecular technical assistance, J. Ronfort for reading a preliminary version of this paper, S. Santoni for his generous gift of SSR markers and two anonymous reviewers for useful comments on an earlier version of the manuscript. This work was funded by Tunisian-French collaborative programmes (CMCU 00F0909 and PICS 712).


