





Background
Depression is a common and highly heterogeneous psychiatric disorder, the onset of which is shaped by the complex interplay of multiple risk factors (Herrman et al., Reference Herrman, Patel, Kieling, Berk, Buchweitz, Cuijpers and Wolpert2022; Marx et al., Reference Marx, Penninx, Solmi, Furukawa, Firth, Carvalho and Berk2023). Previous studies have identified childhood trauma, neuroticism, low levels of physical activity, unhealthy dietary patterns, substance use, social inequalities, intimate partner violence (IPV), air pollution, and environmental noise, among other factors, as being associated with increased risk of depression (Borroni et al., Reference Borroni, Pesatori, Bollati, Buoli and Carugno2022; Li, D’Arcy, & Meng, Reference Li, D’Arcy and Meng2016; Li et al., Reference Li, Lv, Wei, Sun, Zhang, Zhang and Li2017; Luger, Suls, & Vander Weg, Reference Luger, Suls and Vander Weg2014; Lund et al., Reference Lund, Brooke-Sumner, Baingana, Baron, Breuer, Chandra and Saxena2018; Nanni, Uher, & Danese, Reference Nanni, Uher and Danese2012; Shi et al., Reference Shi, Huang, Guo, Tian, Wang, Wong and Ni2023; Sun et al., Reference Sun, Lv, Bi, Zhang, Lu, Guo and Yue2025). However, a major limitation of this body of research is that most studies have examined a single risk factor in isolation, overlooking the frequent co-occurrence and potential interactions among multiple risk factors. For example, Childhood trauma often clusters, and this clustering is strongly associated with depression, particularly in the context of poverty (Lacey et al., Reference Lacey, Howe, Kelly-Irving, Bartley and Kelly2022). Childhood trauma also undermines interpersonal functioning and self-efficacy, thereby influencing other adaptive health and lifestyle behaviors, including physical activity, diet, and alcohol use (Marx et al., Reference Marx, Penninx, Solmi, Furukawa, Firth, Carvalho and Berk2023). Therefore, if other depression risk factors are not considered, the complexity and true health impact of risks cannot be fully captured, which may lead to misleading conclusions. A more holistic approach is therefore required to fully capture the complexity of the relationships between multiple risk factors and depression risk.
Latent class analysis (LCA), a person-centered analytic approach, offers a method to identify distinct combinations of risk factors within a population and to uncover the underlying subtypes that contribute to population heterogeneity. This method has been successfully applied in dementia research to identify clinically meaningful patterns of sleep health and cognitive reserve (Dove et al., Reference Dove, Yang, Dekhtyar, Guo, Wang, Marseglia and Xu2024; Huang et al., Reference Huang, Beydoun, Kianersi, Redline and Launer2025). Although LCA has been applied in depression research to stressor and trauma experiences, few studies have combined multiple risk factors with clinical and neuroimaging outcomes (Su et al., Reference Su, D’Arcy, Li, O’Donnell, Caron, Meaney and Meng2022; Yapp et al., Reference Yapp, Booth, Davis, Coleman, Howard, Breen and Oram2023).
Against this background, the present study utilized 24 depression risk factors to conduct LCA and identify latent profiles associated with depression. We then systematically examined the associations of these profiles with depressive symptoms, depression risk, and neuroimaging outcomes. An overview of the study framework is presented in Figure 1.
Study flowchart. MHQ, mental health questionnaire; LCA, latent class analysis; DRF, depression risk factors; CA, childhood adversity-related risk profile; AA, adulthood adversity-related risk profile; MDD, major depressive disorder; dMRI, diffusion magnetic resonance imaging; FA, fractional anisotropy; sMRI, structural magnetic resonance imaging; GMV, grey-matter volume; PLS, partial least squares.

Figure 1. Long description
The flowchart is divided into three horizontal panels.
Top panel: Latent profiles of depression risk factors among 157,317 participants. On the left, 24 depression risk factors are categorized into 7 Psychological factors, 13 Sociocultural community factors, and 4 Lifestyle factors. An arrow labeled L C A points to a line graph showing probability profiles. On the right, three risk profiles are identified: Low risk (grey icon), Childhood adversity C A (red icon), and Adulthood adversity A A (green icon).
Middle panel: Characteristics of three profiles for depression and imaging outcomes. The left box lists the three profiles (Low risk, C A, and A A) alongside clinical outcomes (Depressive symptoms and Risk of M D D) and imaging outcomes (d M R I metrics-F A and s M R I metrics-G M V). An arrow points to the right box showing three comparisons: C A versus Low risk specific impairment, A A versus Low risk specific impairment, and C A versus A A specific impairment.
Bottom panel: Imaging-transcriptomics analysis in two adversity profiles. On the left, 389 samples in 12 subcortical regions are processed via abagen to create a Gene expression matrix (9,854 genes by 389 samples) labeled X, and Z values labeled Y. Both X and Y feed into a P L S Regression box. This leads to a Gene rank table showing ranked P L S 1 loadings for genes like S C N 3 B and F A M 2 2 2 A. The final step on the right is an Enrichment dot plot showing disease ontology enrichment analysis.
Materials and methods
Data source
The UK Biobank is a large, population-based cohort of more than half a million participants aged 40–69 years at baseline (2006–2010), offering rich data to examine how lifestyle and environmental factors relate to the risk of physical and mental health disorders (Sudlow et al., Reference Sudlow, Gallacher, Allen, Beral, Burton, Danesh and Collins2015). The UK Biobank distributed an online Mental Health Questionnaire (MHQ) to 339,092 participants during 2016–2017, and 157,366 ultimately completed it (Davis et al., Reference Davis, Coleman, Adams, Allen, Breen, Cullen and Hotopf2020). In total, 157,317 people are included in our analyses.
Indicators used to derive depression-related latent profiles
We searched for multiple data sources and collected 24 depression risk factors, which were used to identify the profiles (Herrman et al., Reference Herrman, Patel, Kieling, Berk, Buchweitz, Cuijpers and Wolpert2022; Marx et al., Reference Marx, Penninx, Solmi, Furukawa, Firth, Carvalho and Berk2023). These risk factors encompassed 7 psychological factors, 13 sociocultural and community factors, and 4 lifestyle factors (Supplementary Table S1). All risk factors were converted into binary variables (1 = yes/exposed, 0 = no/unexposed) for inclusion in the statistical models.
Psychological factors included childhood trauma, rumination, and neuroticism. Childhood trauma was captured during the online follow-up using the Childhood Trauma Screener (Glaesmer et al., Reference Glaesmer, Schulz, Häuser, Freyberger, Brähler and Grabe2013), which includes five items assessing physical abuse, physical neglect, emotional abuse, emotional neglect, and sexual abuse. Each item used a five-point Likert response Each item used a five-point Likert response scale, ranging from never true, rarely true, sometimes true, often true, to very often true, and previously validated cut-points (Glaesmer et al., Reference Glaesmer, Schulz, Häuser, Freyberger, Brähler and Grabe2013) were applied to classify the presence or absence of each adversity. Rumination was collected as yes or no to worrying too long after an embarrassing experience (Eszlari et al., Reference Eszlari, Bruncsics, Millinghoffer, Hullam, Petschner, Gonda and Juhasz2021). Neuroticism was defined as a total score greater than 10 on the Neuroticism scale (Liu et al., Reference Liu, Cheng, Wen, Jia, Cheng, Meng and Zhang2023; Nagel et al., Reference Nagel, Jansen, Stringer, Watanabe, de Leeuw, Bryois and Research2018).
Sociocultural and community factors comprised high social deprivation, lack of social support, and adulthood adversity (AA). High social deprivation was measured using the Index of Multiple Deprivation; values above the 80th percentile were classified as high deprivation (Arechvo et al., Reference Arechvo, Wright, Syngelaki, Von Dadelszen, Magee, Akolekar and Nicolaides2023; Palmer et al., Reference Palmer, Kavanagh, Cuschieri, Cameron, Graham, Wilson and Roy2024; Qi et al., Reference Qi, Yang, Liu, Hao, Pan, Wen and Zhang2024). Low social support was collected as yes or no to being unable to confide in someone close daily or almost daily, according to the cut-off used previously (Zajner, Spreng, & Bzdok, Reference Zajner, Spreng and Bzdok2022). At recruitment, participants also reported six stressful life events, including serious illness, injury, or assault to themselves; serious illness, injury, or assault to a close relative; death of a close relative; death of a spouse or partner; marital separation; and financial difficulty. In addition, IPV was also treated as part of the AA domain, operationalized with multiple indicators, including physical violence, sexual assault, and belittlement by a current or former partner (Kyle, Reference Kyle2023). Air pollution was defined as annual NO₂ levels above the 75th percentile, based on 2007 land-use regression models, and noise exposure was measured by average daytime sound levels above the 75th percentile, from the CNOSSOS-EU 2009 model (Cai et al., Reference Cai, Hansell, Blangiardo, Burton, de Hoogh, Doiron and Hodgson2017; Vienneau et al., Reference Vienneau, de Hoogh, Bechle, Beelen, van Donkelaar, Martin and Marshall2013).
Lifestyle factors included unhealthy diet, low physical activity, smoking history, and drinking history. An unhealthy diet was defined using the UK Biobank Food Frequency Questionnaire; participants consuming fewer than four of seven key food groups were classified as having an unhealthy diet (Lourida et al., Reference Lourida, Hannon, Littlejohns, Langa, Hyppönen, Kuzma and Llewellyn2019). Low physical activity was defined as a low activity level on the International Physical Activity Questionnaire. Data on substance use (e.g., smoking and drinking history) were collected through questionnaires at recruitment.
Depressive diagnosis and symptoms
Diagnosis of major depressive disorder (MDD) was defined according to the Composite International Diagnostic Interview – Short Form (CIDI-SF) implemented in the self-reported MHQ, which was developed based on the Diagnostic and Statistical Manual, 4th edition (Davis et al., Reference Davis, Cullen, Adams, Brailean, Breen, Coleman and Hotopf2019).
Additionally, the depressive symptoms, including anhedonia, depressed mood, sleep problems, fatigue, appetite changes, feelings of worthlessness, impaired concentration, psychomotor symptoms, self-harm ideation, or suicidal ideation, were also included in our study. These depressive symptoms were assessed using scores ranging from 1 (not at all) to 4 (nearly every day). Responses of 2, 3, or 4 were coded as the presence of symptoms, and a response of 1 was coded as the absence of symptoms.
Neuroimaging characteristics
All brain MRI data were acquired on a 3 T Skyra scanner (Siemens), preprocessed and quality controlled, and made available to approved researchers as image-derived phenotypes (Alfaro-Almagro et al., Reference Alfaro-Almagro, Jenkinson, Bangerter, Andersson, Griffanti, Douaud and Smith2018; Maximov, Alnæs, & Westlye, Reference Maximov, Alnæs and Westlye2019).
Grey-matter volumes were derived from T1-weighted MRI scans segmented using FAST (FMRIB’s Automated Segmentation Tool) and FIRST (FMRIB’s Integrated Registration and Segmentation Tool) (Alfaro-Almagro et al., Reference Alfaro-Almagro, Jenkinson, Bangerter, Andersson, Griffanti, Douaud and Smith2018). The 139 brain regions include 96 cortical and 15 subcortical regions defined by the Harvard–Oxford (https://fsl.fmrib.ox.ac.uk/fsl/fslwiki/Atlases), and 28 cerebellar regions based on Diedrichsen cerebellar atlas (http://www.diedrichsenlab.org/imaging/propatlas.htm). White-matter microstructural integrity was evaluated using diffusion tensor imaging (DTI). Tract-based spatial statistics were applied to extract fractional anisotropy (FA) (Smith et al., Reference Smith, Jenkinson, Johansen-Berg, Rueckert, Nichols, Mackay and Behrens2006). Twenty-seven regions of interest across both hemispheres were extracted from the Johns Hopkins University (JHU) DTI atlas (Mori et al., Reference Mori, Oishi, Jiang, Jiang, Li, Akhter and Mazziotta2008).
Statistical analysis
Latent class analysis
The sample was randomly divided into discovery and validation datasets. Using the MplusAutomation package in R (Hallquist & Wiley, Reference Hallquist and Wiley2018) and Mplus (Muthén & Muthén, Reference Muthén and Muthén1998), risk factor profiles (i.e. latent classes) were derived using LCA, which is a form of structural equation mixture modelling designed to capture heterogeneity in populations by identifying distinct profiles among observed indicators (Mori, Krumholz, & Allore, Reference Mori, Krumholz and Allore2020).
Model estimation was performed using maximum likelihood with robust standard errors, and missing data on the indicators were addressed through full information maximum likelihood (FIML), which can be applied to binary variables (Depaoli, Jia, & Visser, Reference Depaoli, Jia and Visser2025). This method incorporates all available observations, including partially missing cases, and maximizes the likelihood function while accounting for uncertainty in class membership, thereby producing stable parameter estimates in the presence of missingness. Examination of missingness patterns indicated that missingness in the indicators was associated with observed covariates (Supplementary Tables S2–S3). This pattern was considered compatible with the Missing at Random (MAR) assumption. Accordingly, FIML was therefore considered appropriate for handling missing indicator data (Heron, Reference Heron2012).
To determine the optimal number of classes, models specifying between one and six classes were compared using a range of fit indices, including the Akaike information criterion (AIC), Bayesian information criterion (BIC), sample-size–adjusted BIC (aBIC), the Vuong–Lo–Mendell–Rubin likelihood ratio test (VLMRT), the Lo–Mendell–Rubin adjusted likelihood ratio test (LMRT), mean posterior probability and entropy. Lower AIC, BIC, and aBIC values suggest a better-fitting model. A statistically significant P value from the VLMRT and LMRT tests indicates that the model with k classes provides a better fit than the model with k-1 classes. Mean posterior probability reflects the mean probability that individuals are correctly assigned to their latent class, with values above 0.70 generally considered acceptable. Entropy measures the distinctiveness of the class separation, and values above 0.70 likewise indicate adequate classification. To validate robustness and generalizability, two independent validation datasets were generated through random partitioning of participants, and latent profiles were identified within each dataset.
Association between risk factor profiles and outcomes
Differences in distal outcomes across latent profiles were examined using the modified three-step Bolck–Croon–Hagenaars (BCH) procedure. This approach accounts for classification uncertainty by incorporating individuals’ posterior class membership probabilities rather than treating class assignment as fixed. In practice, individuals may have partial membership across classes (e.g., 80% probability for one class and 20% for another), and the BCH framework integrates this uncertainty through a weighted regression model. Weights were calculated for each individual using the modal probability weighted by the inverse of the estimated probability of being in the assigned class (Bolck, Croon, & Hagenaars, Reference Bolck, Croon and Hagenaars2004; Vermunt, Reference Vermunt2010). By explicitly modeling classification error, the BCH method yields more accurate and less biased estimates of associations between latent profiles and distal outcomes. Simulation studies have indicated that the BCH method yields unbiased and stable estimates of distal outcome associations even in models with relatively low entropy, particularly when sample sizes are large (n ≥ 10,000) (Vermunt, Reference Vermunt2010).
Using the BCH method, linear or logistic regression models were fitted for each outcome across latent profiles. Continuous outcomes were z-score standardized prior to analysis, and class-specific intercepts were compared using z-tests to assess differences between profiles. Associations with continuous outcomes were reported as standardized β coefficients, whereas associations with binary outcomes were reported as odds ratios. All models were adjusted for age, sex, Townsend Deprivation Index, and ethnicity. For symptom-specific analyses, primary models were estimated adjusting for overall depression severity using the PHQ-9 total score excluding the focal item, thereby avoiding part–whole coupling. Unadjusted models were additionally estimated as sensitivity analyses to examine raw symptom associations. For volumetric neuroimaging outcomes, total grey-matter volume was included as a covariate to account for individual differences in head size. In addition, all neuroimaging models were adjusted for imaging site to account for scanner-related variability across the four imaging centers.
The proportion of missing data for outcomes and covariates was less than 1% (Supplementary Tables S2–S4). Outcome analyses were conducted using complete-case analysis (excluding missing data in covariates and outcomes) in the primary models. To assess robustness to missing data handling, we additionally conducted multiple imputation (MI). Outcome models were re-estimated across imputed datasets. Results were corrected for multiple comparisons using the Bonferroni method, with a significance threshold of P < 0.05.
Association between subcortical structural differences and gene expression
To explore our hypothesis that the amygdala differences observed between the Adulthood adversity-related (AA) and Childhood adversity-related (CA) profiles may be related to differential expression of depression-related genes in the brain, we conducted imaging–transcriptomic analyses. Whole-brain transcriptional profiles were obtained from the Allen Human Brain Atlas (AHBA; https://help.brain-map.org/). Because only two of the six donors in the AHBA dataset provided gene expression data for right hemisphere, analyses were restricted to these two donors to ensure bilateral coverage of the subcortical structures, including the amygdala. The microarray expression data from the AHBA were preprocessed using the Python toolbox abagen (https://github.com/rmarkello/abagen) (Markello et al., Reference Markello, Arnatkeviciute, Poline, Fulcher, Fornito and Misic2021). A standardized preprocessing pipeline was implemented following the recommended protocol, which included six key steps (Li et al., Reference Li, Seidlitz, Suckling, Fan, Ji, Meng and Liao2021): gene information re-annotation, data filtering, probe selection, assigning samples to the atlas (http://human.brain-map.org), data normalization, and gene filtering. This preprocessing generated a gene expression matrix encompassing 9,854 genes × 389 samples.
Subsequently, partial least squares (PLS) regression was employed to explore the transcriptional profiles associated with subcortical GMV differences between the CA and AA profiles (Abdi & Williams, Reference Abdi, Williams, Reisfeld and Mayeno2013). In this analysis, the gene expression matrix served as the independent variable, while the Z-maps of between-profile differences were used as the dependent variable. The first component of PLS (PLS1) regression captured the spatial pattern that explained the largest proportion of gene expression variance across subcortical regions, offering a concise low-dimensional representation of the covariance within high-dimensional data matrices. To evaluate the significance of PLS1, a spatial autocorrelation-adjusted analysis with 5,000 permutations was performed, ensuring that the observed R2 of PLS1 exceeded random expectations. Additionally, a bootstrapping method was applied to correct estimation errors in the weights assigned to each gene for the significant component, after which genes were ranked based on their adjusted weights. To further investigate the functional signatures of the identified genes, the Enrichr website (https://maayanlab.cloud/Enrichr/) was employed for enrichment analysis using DisGeNET (Piñero et al., Reference Piñero, Ramírez-Anguita, Saüch-Pitarch, Ronzano, Centeno and Furlong2020), with significant enrichment defined as Benjamini–Hochberg corrected q < 0.05.
Sensitivity and robustness analysis
To evaluate whether the latent class structure and downstream associations were influenced by proximal adversity or psychologically proximal indicators, we conducted two sensitivity LCAs: (1) excluding proximal adversity indicators (illness or injury [self], illness or injury [relative], death of a close relative, death of a partner, marital separation, financial difficulty, physical violence, belittlement, and sexual assault); and (2) excluding proximal psychological indicators (neuroticism, rumination, and low social support). All sensitivity LCAs retained the same modeling framework as the primary analysis, including the same three-class solution and estimation approach. Distal outcome analyses were subsequently re-estimated using the BCH method to account for classification uncertainty. To address potential confounding by depression status, we conducted additional imaging analyses within a never-depressed subgroup, restricting the analyses to brain regions that had survived multiple comparison correction in the primary analysis.
Results
Overall, this study included 157,317 participants. The mean age at baseline was 55.93 years (SD = 7.74), with 43.38% of participants being men and 96.76% identifying as white (Table 1).
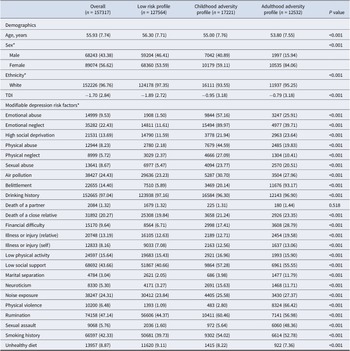
Characteristics of study participants by three identified latent profiles, among 157317 participants from the UK Biobank

Table 1. Long description
The table contains six columns: Variable, Overall (n = 157317), Low risk profile (n = 127564), Childhood adversity profile (n = 17221), Adulthood adversity profile (n = 12532), and P value.
Demographics:
- Age, years: Overall mean 55.93, Low risk 56.3, Childhood 55.0, Adulthood 53.8 (P < 0.001).
- Sex: Male percentage is highest in Low risk (46.41%) and lowest in Adulthood adversity (15.94%). Female percentage is highest in Adulthood adversity (84.06%).
- Ethnicity: White participants make up over 93% of all profiles.
- T D I: Overall mean -1.70, with the most deprivation in Adulthood adversity (-0.79).
Modifiable depression risk factors (selected data):
- Emotional abuse: 1.50% in Low risk vs 57.16% in Childhood adversity.
- Emotional neglect: 11.61% in Low risk vs 89.97% in Childhood adversity.
- Belittlement: 5.89% in Low risk vs 93.17% in Adulthood adversity.
- Physical violence: 1.09% in Low risk vs 66.42% in Adulthood adversity.
- Sexual assault: 1.60% in Low risk vs 48.36% in Adulthood adversity.
- Rumination: High across all groups, ranging from 44.37% (Low risk) to 60.46% (Childhood adversity).
- Smoking history: Higher in Childhood (54.02%) and Adulthood (52.78%) profiles compared to Low risk (39.73%).
- Death of a partner: The only factor with a non-significant P value (0.518), remaining around 1.3% to 1.4% across all groups.
Note: Continuous variables are presented as mean (standard deviation). *Count data are presented as frequency (%). TDI, Townsend Deprivation Index.
LCA identified three depression risk factor profiles
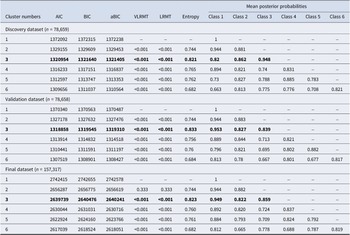
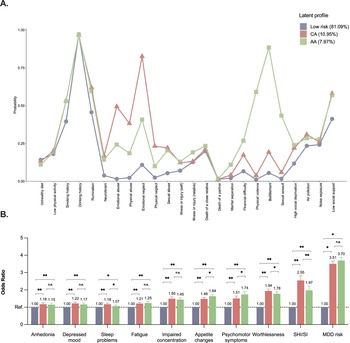
In the discovery dataset, models with one to six classes showed that although AIC, BIC, and aBIC continued to decrease as the number of classes increased, the improvement became less pronounced after the three-class solution (Sinha, Calfee, & Delucchi, Reference Sinha, Calfee and Delucchi2021). The three-class solution was further supported in the validation dataset (Table 2). We then combined the two datasets into a larger sample for analysis, which continued to support the three-class profile (Table 2; Supplementary Table S5, Supplementary Figures S1–S2). Adversity-related indicators showed the greatest differentiation across latent profiles, whereas diet, physical activity, illness or injury of self or relatives, bereavement, and marital separation contributed relatively less to profile separation. (Table 1; Figure 2a). We further labeled three profiles based on their distributions of risk factors (Figure 2a): (1) Low risk profile (81.09%), characterized by the lowest probabilities across most risk factors; (2) CA profile (10.95%), characterized by the highest probabilities of adverse childhood experiences (including emotional abuse, physical abuse, emotional neglect, physical neglect, and sexual abuse), along with higher levels of neuroticism and rumination; and (3) AA profile (7.97%), characterized by the highest probabilities of social and environmental adversities in adulthood, including financial difficulties, marital divorce, serious illness or injury of self/relatives, IPV (physical violence, belittlement or sexual assault), and low social support. Between-profile comparison on the 24 multiple factors across three profiles is shown in Table 1. Sensitivity analyses supported the stability of the three-class solution. Excluding either proximal psychological indicators or proximal adversity indicators retained the overall three-class structure, with the low-risk class remaining highly stable and only limited redistribution observed across the higher-risk classes (Supplementary Tables S6–S7; Supplementary Figures S3–S4).
Model fit statistics using depression risk factors as indicators of latent class
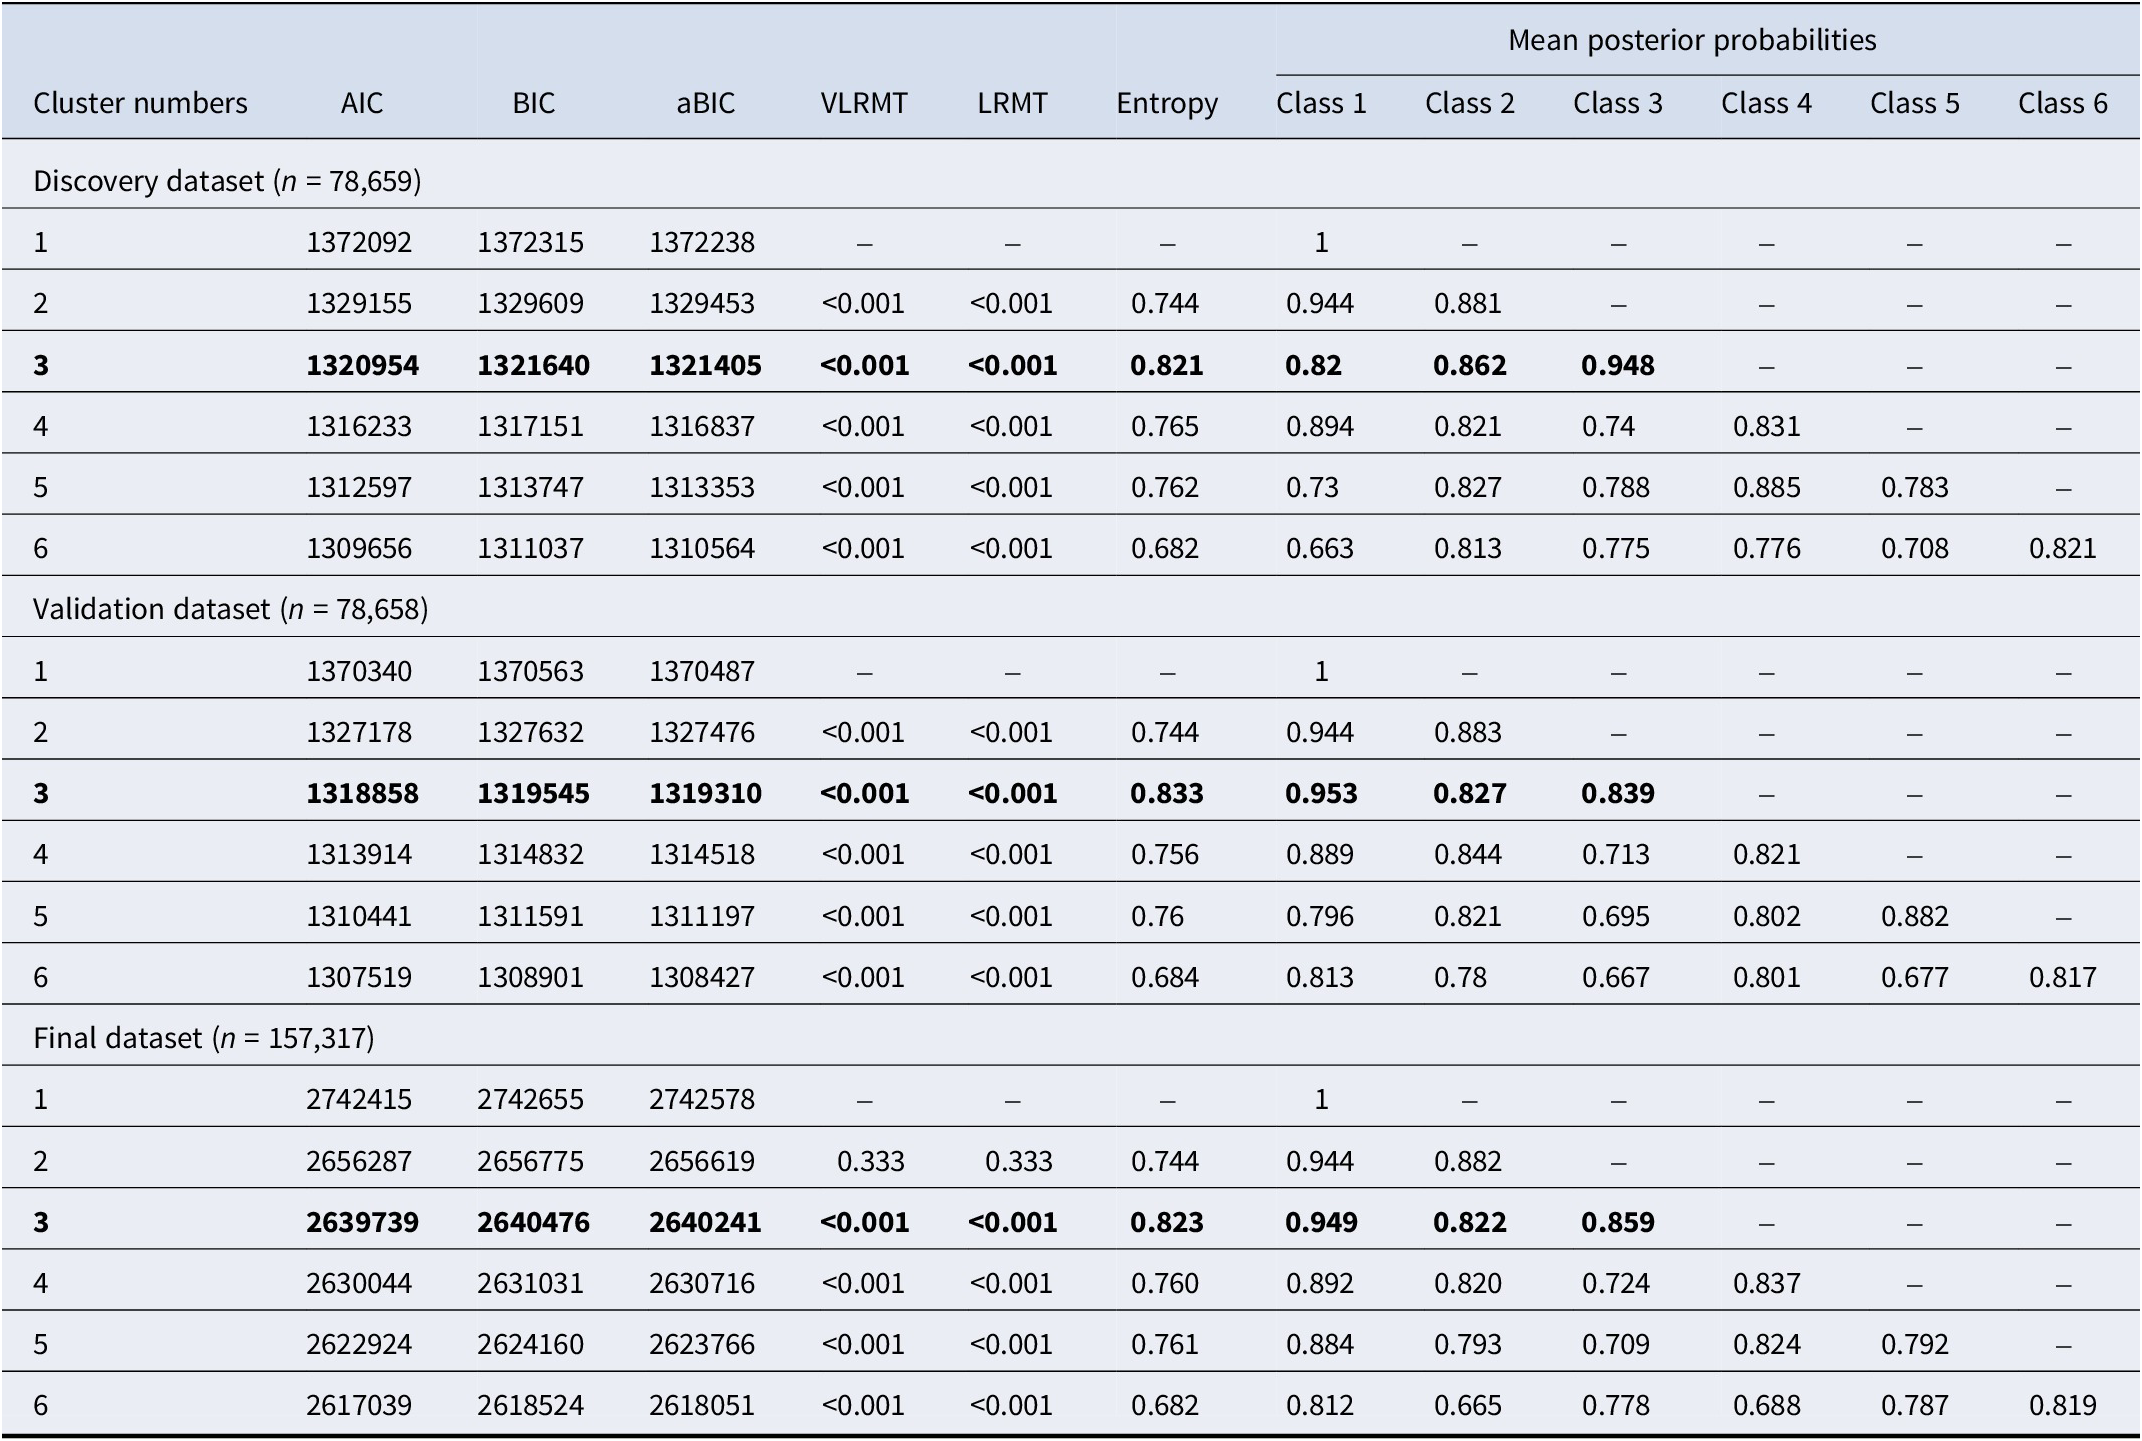
Table 2. Long description
The table is divided into three sections based on dataset size: Discovery (n = 78,659), Validation (n = 78,658), and Final (n = 157,317). Columns include Cluster numbers (1 to 6), A I C, B I C, a B I C, V L R M T, L R M T, Entropy, and Mean posterior probabilities for Classes 1 through 6.
* Discovery Dataset: Cluster 3 is bolded with A I C 1,320,954; B I C 1,321,640; a B I C 1,321,405; V L R M T and L R M T both less than 0.001; and Entropy 0.821. Posterior probabilities for Classes 1, 2, and 3 are 0.82, 0.862, and 0.948 respectively.
* Validation Dataset: Cluster 3 is bolded with A I C 1,318,858; B I C 1,319,545; a B I C 1,319,310; V L R M T and L R M T both less than 0.001; and Entropy 0.833. Posterior probabilities for Classes 1, 2, and 3 are 0.953, 0.827, and 0.839 respectively.
* Final Dataset: Cluster 3 is bolded with A I C 2,639,739; B I C 2,640,476; a B I C 2,640,241; V L R M T and L R M T both less than 0.001; and Entropy 0.823. Posterior probabilities for Classes 1, 2, and 3 are 0.949, 0.822, and 0.859 respectively.
Across all datasets, as cluster numbers increase from 1 to 6, A I C, B I C, and a B I C values generally decrease, while Entropy peaks at Cluster 3 before declining.
Note: AIC, Akaike Information Criterion; BIC, Bayesian Information Criterion; aBIC, Sample-size adjusted BIC; VLRMT, Vuong-Lo–Mendell–Rubin likelihood ratio test; LMRT, Lo–Mendell–Rubin adjusted likelihood ratio test.
Bold values indicate the optimal model fit.
Results of latent class analysis and associations with depression outcomes. (a) Probabilities of risk factors for each profile. (b) Associations between profiles and depressive symptoms and incidence. Results are from logistic regression models adjusted for age, sex, ethnicity, and Townsend Deprivation Index. For the nine depressive symptom outcomes, models were additionally adjusted for overall depressive symptom severity, calculated as the PHQ-9 total score excluding the focal item. The MDD risk model was not adjusted for overall depressive symptom severity. To compare the CA and AA profiles directly, the models were re-estimated using the CA profile as the reference group. MDD, major depressive disorder; CA, childhood adversity-related profiles; AA, adulthood adversity-related profiles; SHI/SI, self-harm ideation or suicidal ideation; n.s. indicates no significance, * indicates P < 0.05, ** indicates Bonferroni-corrected significance.

Figure 2. Long description
Panel A is a line graph showing the probability of 26 risk factors across three latent profiles. The y-axis ranges from 0.00 to 1.00. The Low risk profile (blue circles, 81.09 percent) remains below 0.25 for most factors except smoking, drinking, rumination, and low social support. The C A profile (red triangles, 10.95 percent) shows high peaks for emotional abuse, physical abuse, and emotional neglect. The A A profile (green squares, 7.97 percent) shows high peaks for financial difficulty, physical violence, belittlement, and sexual assault. All three profiles peak near 1.00 for drinking history.
Panel B is a bar chart showing Odds Ratios for ten depression-related outcomes. The y-axis ranges from 0 to 5. The Low risk profile serves as the reference group (Odds Ratio of 1.00). For all outcomes, C A (red) and A A (green) profiles show significantly higher odds than the reference. For S H I forward slash S I, the C A profile has an Odds Ratio of 2.55, significantly higher than the A A profile at 1.97. For M D D risk, both C A and A A profiles show the highest odds, at 3.53 and 3.69 respectively, with no significant difference between them. Other outcomes include Anhedonia, Depressed mood, Sleep problems, Fatigue, Impaired concentration, Appetite changes, Psychomotor symptoms, and Worthlessness, all with Odds Ratios between 1.07 and 1.94.
Differentiated depressive symptoms across the three profiles
The CA and AA profiles showed significantly higher depression prevalence (P < 0.001; low risk 19.1%, CA 41.0%, AA 47.6%). Further comparison of the three risk factor profiles revealed that the CA and AA profiles showed significantly increased odds of MDD (CA: OR = 3.507, 95% CI: 3.353–3.670, P < 0.001; AA: OR = 3.701, 95% CI: 3.532–3.881, P < 0.001) compared with the low risk profile.
Regarding specific depressive symptoms, the CA profile exhibited markedly higher risks of self-harm or suicidal ideation (OR = 2.550, 95%CI:2.307–2.818, P Bonferroni < 0.001), increased feelings of worthlessness (OR = 1.941, 95%CI:1.833–2.054, P Bonferroni < 0.001), and more sleep problems (OR = 1.178, 95%CI:1.117–1.242, P Bonferroni < 0.001), compared with the low risk profile. In addition, the AA profile showed higher risks of appetite changes (OR = 1.642, 95%CI:1.545–1.757, P Bonferroni < 0.001) and psychomotor symptoms (OR = 1.740, 95%CI:1.581–1.916, P Bonferroni < 0.001) (Figure 2b; Supplementary Table S8). Direct comparisons between CA and AA suggested that most core symptoms exhibited similar magnitudes of association, including anhedonia, depressed mood, fatigue, and impaired concentration (Figure 2b). Results from multiple imputation analyses were directionally consistent with complete-case estimates across all symptom contrasts, supporting the robustness of the findings to missing data handling (Supplementary Table S9). Some profile differences became apparent only after accounting for overall depression severity, indicating that relative symptom prominence varied across profiles even when total symptom burden was comparable (Supplementary Table S10). In sensitivity analyses excluding proximal adversity and psychological indicators, the direction of effects for depressive outcomes remained consistent with the primary analysis (Supplementary Table S11–S12).
Specific neuroimaging characteristics across three profiles
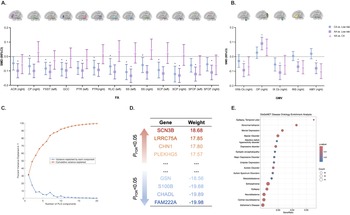
For the CA profile, lower FA was specifically observed in the right cerebral peduncle (CP) (β = −0.067, 95%CI: −0.121, −0.012, P Bonferroni = 0.005) and the left retrolenticular part of the internal capsule (RLIC) (β = −0.069, 95%CI: −0.123, −0.014, P Bonferroni = 0.004) (Figure 3a; Supplementary Table S13). In contrast, the AA profile predominantly showed lower FA in prefrontal-related pathways – namely the anterior corona radiata (ACR) (β = −0.099, 95%CI: −0.148, −0.050, P Bonferroni = 0.011) and bilateral superior fronto-occipital fasciculi (SFOF) (left hemisphere: β = −0.122, 95%CI: −0.171, −0.073, P Bonferroni < 0.001; right hemisphere: β = −0.111, 95%CI: −0.161, −0.060, P Bonferroni = 0.002), alongside reduced GMV in right cerebellar lobules VIIIb (β = −0.093, 95%CI: −0.138, −0.048, P Bonferroni = 0.022) and IX (β = −0.109, 95%CI: −0.158, −0.06, P Bonferroni = 0.004), the right amygdala (β = −0.069, 95%CI: −0.123, −0.014, P Bonferroni = 0.015), and the right insular cortex (β = −0.069, 95%CI: −0.102, −0.037, P Bonferroni = 0.028), and increased GMV in the occipital pole (β = 0.09, 95%CI: 0.047, 0.133, P Bonferroni = 0.016) (Figure 3a,b; Supplementary Tables S13–S14). Both CA and AA profiles shared tracts (counted unilaterally where applicable) with lower FA, spanning cerebellar, thalamic, and subcortical associative pathways. These tracts included the fornix, stria terminalis (FXST), genu of the corpus callosum (GCC), superior cerebellar peduncle (SCP), posterior thalamic radiation (PTR), and sagittal stratum (SS) (Figure 3a; Supplementary Table S13). Specifically, we found that the AA profile had smaller GMV in the right amygdala than the CA profile at the nominal significance level (Figure 3b). Minor directional inconsistencies were observed in the multiple imputation analyses for a small number of associations with very small effect sizes. However, these differences did not alter the overall pattern or interpretation of the primary findings (Supplementary Table S15). For the sensitivity analysis excluding proximal adversity indicators or psychological indicators, effect directions of class-related neuroimaging differences were largely preserved (Supplementary Tables S16–S17). In the never-depressed subgroup, all examined imaging features showed effect directions consistent with the primary analysis. Most associations remained nominally significant, indicating that the primary imaging differences were not solely driven by depression status (Supplementary Table S18).
Characteristics of latent profiles. (a) Forest plot of pairwise differences in fractional anisotropy across profiles, restricted to regions with at least one Bonferroni-corrected significant effect. ACR, anterior corona radiata; CP, cerebral peduncle; FXST, fornix cres and stria terminalis; GCC, genu of corpus callosum; PTR, posterior thalamic radiation; RLIC, retrolenticular part of internal capsule; SCP, superior cerebellar peduncle; SFOF, superior fronto-occipital fasciculus; SS, sagittal stratum. (b) Forest plot of pairwise differences in grey-matter volume across profiles, restricted to tracts with at least one Bonferroni-corrected significant effect. Cb, cerebellum; OP, occipital pole; INS, insular cortex; AMY, amygdala. (c) PLS variance explained. Partial least squares (PLS) linking AHBA expression to the AA–CA GMV map. Blue: variance per component; orange: cumulative. PLS1 explained the largest proportion of variance. (d) Ranked PLS1 loadings. Top/bottom genes ordered by PLS1 weight (P FDR-corrected < 0.05). (e) Disease enrichment. DisGeNET enrichment of PLS-ranked genes. SMD, standardized mean difference; CI, confidence interval; CA, childhood adversity-related profile; AA, adulthood adversity-related profile; * indicates Bonferroni-corrected significance.

Figure 3. Long description
Panel A is a forest plot showing S M D and 95 percent C I for F A across brain regions. Three groups are compared: C A versus Low risk (blue circles), A A versus Low risk (purple squares), and A A versus C A (pink triangles). Regions include A C R, C P, F X S T, G C C, P T R, R L I C, S S, S C P, and S F O F. Most values are below zero, indicating lower F A in adversity groups.
Panel B is a forest plot for G M V in white-matter tracts. It shows significant differences in regions like O P, I X C b, I N S, and A M Y. The O P shows a positive S M D for the A A group, while other regions show negative values.
Panel C is a line graph of P L S variance. The x-axis is the number of P L S components from 0 to 20. The y-axis is the percent variance explained. A blue line shows variance per component, starting high at component 1 and dropping sharply. An orange line shows cumulative variance, reaching nearly 100 percent by component 20.
Panel D is a table of ranked P L S 1 gene loadings. Top genes with positive weights include S C N 3 B (18.68), L R R C 7 5 A (17.85), C H N 1 (17.80), and P L E K H G 5 (17.57). Bottom genes with negative weights include G S N (-18.56), S 1 0 0 B (-19.68), C H A D L (-19.89), and F A M 2 2 2 A (-19.98).
Panel E is a dot plot for Dis G e N E T disease ontology enrichment. The x-axis is the Gene Ratio and the y-axis lists disorders. Epilepsy and Abnormal behavior show the highest Gene Ratios. Dot color indicates p-adjust values from 0.01 to 0.02, and dot size represents gene count.
Gene expression patterns reveal functional differences between CA and AA profiles
We performed regression and spatial correlation analyses on a gene expression database of the human brain to identify genes associated with subcortical brain region differences between the CA profile and the AA profile. PLS1 explained 30.89% of the variance in GMV deviation in differences of two adversity-related profiles (Figure 3c). Enrichment analysis showed that the PLS1-weighted enriched genes (listed in descending order) (Figure 3d) were associated with several mental disorders, including depression (Figure 3e).
Discussion
In the large sample of UK adults who completed a MHQ, we identified three latent profiles of multiple depression risk factors: low risk profile, CA profile, and AA profile. Together, the CA and AA profiles accounted for approximately 20% of the sample, and both showed an MDD prevalence exceeding 40%, highlighting their elevated depression risk. Specifically, the CA profile was associated with a higher likelihood of feelings of worthlessness, sleep problems, and self-harm/suicidal ideation, with lower FA in occipital-related white-matter pathways. By contrast, the AA profile showed greater appetite changes and psychomotor symptoms, with greater microstructural alterations of prefrontal projection fibers, accompanied by lower GMV in the insular cortex, amygdala, and cerebellar lobules VIIIb/IX, and higher GMV in the occipital pole, suggesting potentially distinct neurobiological correlates. These findings reveal the heterogeneity of depression risk and offer a person-centered perspective on the potential developmental pathways of depression risk. Given the large sample size, statistical significance should be interpreted alongside effect magnitude. Effect sizes ranged from 0.07 to 0.15 in absolute magnitude, consistent with prior large-scale UK Biobank neuroimaging studies (Qureshi et al., Reference Qureshi, Topiwala, Al Abid, Allen, Kuźma and Littlejohns2024). Such effect sizes are typical in population-level brain–behavior research and may reflect subtle but widespread neurobiological differences associated with adversity profiles.
Compared with the low risk profile, the CA profile had an elevated risk of MDD and was characterized by a greater burden of sleep problems, feelings of worthlessness, and self-harm or suicidal ideation. Neuroimaging results indicated that, relative to the low risk profile, the CA profile showed lower FA in the right CP and the left RLIC, with a relatively pronounced effect in the left RLIC, which carries thalamo-occipital projections within the visual pathway. Moreover, reduced FA was also observed in subcortical, thalamic, and cerebellar pathways, as reflected by reduced FA in the left FXST, GCC, right PTR, bilateral SS, and bilateral SCP. These findings are consistent with previous studies, which have demonstrated that CA is associated with a higher risk of depression and structural brain alterations. Childhood is a critical window for white-matter myelination, and studies have shown that CA is associated with widespread white-matter microstructural abnormalities, particularly in the GCC, visual radiation (part of the RLIC), PTR, and SS (Lim, Howells, Radua, & Rubia, Reference Lim, Howells, Radua and Rubia2020; McCarthy-Jones et al., Reference McCarthy-Jones, Oestreich, Lyall, Kikinis, Newell, Savadjiev and Whitford2018). These neural pathways connecting the frontal–limbic regions and occipital visual cortex may be involved in the transmission and processing of aversive experiences (Lim et al., Reference Lim, Howells, Radua and Rubia2020), suggesting that CA may be associated with persistent alterations in these tracts into adulthood. Moreover, evidence has shown that in women with perinatal depression, FA in the right RLIC is negatively correlated with depression severity (Silver et al., Reference Silver, Moore, Villamarin, Jaitly, Hall, Rothschild and Deligiannidis2018), which, together with the current findings, is consistent with the possibility that brain structural alterations may partly link CA with depression risk. In addition, previous studies have reported that FA in the internal capsule plays a stable mediating role between childhood trauma load and trauma symptom severity (including hyperarousal, attentional impairment, and negative cognition) (Wong et al., Reference Wong, Lebois, Ely, van Rooij, Bruce, Murty and Harnett2023), supporting the notion that the internal capsule may serve as a key white-matter node through which early adversity exposure affects subsequent attentional deficits and negative cognitive responses (e.g., feelings of worthlessness). This pattern is also consistent with prior DTI studies of insomnia reporting reduced white-matter integrity in the internal capsule, including the RLIC, suggesting that the burden of sleep symptoms associated with CA may co-vary with structural differences in arousal-related and thalamo-cortical projection pathways (Li et al., Reference Li, Tian, Bauer, Huang, Wen, Li and Jiang2016). Another important neuroimaging finding related to the CA profile is the reduced FA in the right CP. Previous studies have shown that the CP is primarily associated with motor functions (Domi, deVeber, Mikulis, & Kassner, Reference Domi, deVeber, Mikulis and Kassner2020). Although case–control studies have reported lower FA in the right CP among patients with depression compared to healthy controls, the underlying reasons for this reduction remain unclear (Silver et al., Reference Silver, Moore, Villamarin, Jaitly, Hall, Rothschild and Deligiannidis2018). The present findings raise the possibility that this alteration may be partly related to CA. Moreover, consistent with the present findings, numerous studies have shown that CA significantly increases the risk of suicidal ideation and suicidal behavior in adulthood (Ioannis Angelakis, Austin, & Gooding, Reference Angelakis, Austin and Gooding2020; Angelakis, Gillespie, & Panagioti, Reference Angelakis, Gillespie and Panagioti2019; Baldini et al., Reference Baldini, Gottardi, Di Stefano, Rindi, Pazzocco, Varallo and Ostuzzi2025). Evidence suggests that suicide risk may be associated with different types of CA, with sexual abuse being the most frequently reported and conferring the highest risk (Baldini et al., Reference Baldini, Gottardi, Di Stefano, Rindi, Pazzocco, Varallo and Ostuzzi2025). In addition, suicide risk may also be related to the cumulative burden of CA, as studies have demonstrated that individuals exposed to multiple childhood adversities have a markedly elevated risk of suicidal ideation in adulthood (OR = 5.18, 95%CI:2.52–10.63) (Angelakis et al., Reference Angelakis, Gillespie and Panagioti2019).
Compared with the low risk profile, the AA profile also showed a higher risk of MDD, with appetite changes and psychomotor symptoms emerging as the most prominent symptom differences. In individuals with AA, we observed decreased FA in frontal white-matter tracts (right ACR and bilateral SFOF), extending to subcortical, thalamic, and cerebellar regions, including the left FXST, GCC, left PTR, left SS, and right SCP. These white-matter alterations were accompanied by GMV reductions in the bilateral cerebellar lobule IX and right lobule VIIIb, as well as in the insula and amygdala, together with GMV increases in the occipital lobe. Previous studies in adults with depression have similarly reported reduced FA in multiple white-matter tracts, including the prefrontal–thalamic pathways (ACR, PTR) and GCC (Hermesdorf et al., Reference Hermesdorf, Berger, Szentkirályi, Schwindt, Dannlowski and Wersching2017; van Velzen et al., Reference van Velzen, Kelly, Isaev, Aleman, Aftanas, Bauer and Schmaal2020; Wu et al., Reference Wu, Mei, Hou, Wang, Zang, Zhang and Zhang2023). Such alterations may be related to the role of the prefrontal cortex in executive control and emotion regulation, suggesting that impaired stress regulation may be a relevant framework for interpreting the AA profile (Zhuo et al., Reference Zhuo, Li, Lin, Jiang, Xu, Tian and Song2019). From the perspective of white-matter tracts, the cerebellar–thalamic–cortical pathway may play a key role in the psychomotor symptoms of depression (Mittal, Bernard, & Walther, Reference Mittal, Bernard and Walther2021; Wüthrich et al., Reference Wüthrich, Lefebvre, Mittal, Shankman, Alexander, Brosch and Walther2024). Combined with our findings of GMV reductions in cerebellar lobules IX, VIIIb, and GMV enlargement in the occipital lobe within the AA profile, it is plausible that adverse experiences in adulthood may be associated with structural alterations in both white and grey matter along the cerebellar–thalamic–cortical circuit, thereby contributing to psychomotor-related clinical symptoms in depression. Functional imaging studies have shown that depressed individuals with appetite loss exhibit reduced activation in the insular cortex, a region involved in interoceptive processing (Simmons et al., Reference Simmons, Burrows, Avery, Kerr, Bodurka, Savage and Drevets2016). Moreover, the functional coupling between the insula and the reward circuitry has been found to characterize individual differences in appetite and to be linked with peripheral metabolic and inflammatory profiles (Cosgrove et al., Reference Cosgrove, Burrows, Avery, Kerr, DeVille, Aupperle and Simmons2020). These findings provide a relevant context for interpreting the observed reduction in insular GMV and altered appetite phenotype among individuals with AA.
Notably, the most pronounced nominally significant difference between the AA and CA profiles was observed in the amygdala. Given the core role of the amygdala in emotional processing, we provide an exploratory discussion of this finding. Prior research has demonstrated that cumulative adversity risk in early adolescence (ages 9–13) predicts larger amygdala volume in adulthood (Evans et al., Reference Evans, Swain, King, Wang, Javanbakht, Ho and Liberzon2016). In another study including patients with depression and healthy volunteers, recent stressful life events were indeed linked to reduced amygdala volume, while no association was observed for childhood physical or sexual abuse (Sublette et al., Reference Sublette, Galfalvy, Oquendo, Bart, Schneck, Arango and Mann2016). In the present study, we did not observe a significant amygdala difference between the CA and low-risk profiles. Interpreted in light of previous evidence, this finding may indicate that the effects of CA on amygdala structure are developmentally dynamic. Compensatory developmental changes following CA may be one possible explanation, although this remains speculative. Future research should examine longitudinal brain development after CA and the combined or interactive effects of childhood and AA. We further conducted transcriptomic–neuroimaging association analyses for the amygdala and other subcortical regions showing GMV differences between the two adversity-related profiles. Gene-expression patterns that spatially aligned with the distribution of these GMV differences were enriched for genes related to psychiatric disorders (including depression), suggesting that such transcriptional signatures may help explain profile-specific differences in risk for depression. Collectively, these findings offer additional insight into how adversity is associated with brain structure and molecular signatures.
In this study, we found that adversity-related latent profiles (childhood or adulthood) were linked to markedly elevated risk of depression. These findings suggest that interventions targeting interpersonal difficulties and emotion regulation, such as Interpersonal Psychotherapy (IPT) or Skills Training in Affective and Interpersonal Regulation (STAIR), may be particularly relevant for individuals with adversity-related profiles. Future preventive and clinical programs may benefit from stratifying individuals according to similar adversity profiles to improve intervention targeting and efficiency. This LCA study provided a person-centered identification of latent profiles of multiple depression risk factors and characterized their associations with depressive symptoms and neuroimaging features. Multiple robustness checks supported the stability of the class structure and downstream associations. Effect directions were generally consistent across alternative indicator specifications and missing-data strategies, with only negligible inconsistencies. Several limitations merit consideration. First, the UK Biobank MHQ subcohort is not representative of the general population; compared with the full UKB cohort and age-matched UK populations, MHQ participants tend to be more highly educated, have higher socioeconomic status, and be healthier, which may underestimate risk-factor prevalence and affect profile proportions (Davis et al., Reference Davis, Coleman, Adams, Allen, Breen, Cullen and Hotopf2020). Second, several variables were self-reported and thus subject to reporting bias, and the cross-sectional design precludes causal inference. In addition, dichotomizing indicators may have reduced measurement granularity and introduced information loss. Finally, imaging–transcriptomic analyses were constrained by the small donor base and mapping uncertainties; future studies with more donors and improved mapping approaches may provide more reliable and generalizable insights.
Conclusion
We identified three latent profiles of multiple depression risk factors. These profiles showed distinct depressive symptom patterns and neuroimaging signatures, highlighting heterogeneity in depression risk across the population and supporting the need for individualized risk assessment and intervention.
Supplementary material
The supplementary material for this article can be found at http://doi.org/10.1017/S0033291726104796.
Acknowledgements
The authors extend their appreciation to the UK Biobank investigators, personnel, and participants, together with the staff and analysts of the UK Biobank access management system. This study was performed utilizing the UK Biobank Resource under Application Number 78795.
Funding statement
This study was supported by the National Natural Science Foundation of China (82441005, 82441004, W2541022, 82330042, 82301687, 82501828, 82501802); STI2030-Major Projects-2021ZD0200702; National Key R&D Program of China (2023YFE0119400, 2025YFC2511200); Capital’s Funds for Health Improvement and Research (2024–1-4111); Beijing Natural Science Foundation (7254462,7264357); China Postdoctoral Science Foundation (2024 M760141); National Postdoctoral Program for Innovative Talents (BX20240029);The Being High-Level innovation and Entrepreneurship Talent Support Program (G202532216).
Competing interests
The authors have no conflicts of interest to declare.



 Open access

