


1. Introduction
Accompanied by the two-dimensional quantum electron gases (2DQEG) is confirmed to exist on the surface of the metals and semiconductor heterostructures. The interaction between charged particles and plasma targets has attracted a lot of attention in surface physics [Reference Abrahams, Kravchenko and Sarachik1–Reference Wang and Ma6]. The incident particles can also be used as probes to detect the properties of 2DQEG, or as a powerful tool of surface character modification.
In the study of the interaction between charged particles and plasma targets, people are particularly interested in the analytical calculation of energy loss [Reference Mišković, Segui, Gervasoni and Arista7] and the density distribution of the plasma targets [Reference Mišković, Liu, Goodman and Wang8]. Stopping power is used to describe the energy loss per unit length [Reference Wang and Ma6, Reference Maynard and Deutsch9–Reference Custidiano and Jakas15]. As an important physical quantity to study the interaction between charged particles and the plasma targets, a lot of experiments and theoretical studies have been done in the past decade [Reference Zaremba, Nagy and Echenique16–Reference Frank, Blažević and Grande28]. The stopping power of charged particles can be modulated by the incident velocity of charged particles [Reference Li, Song and Wang5], the amount of charge of charged particles, the density of plasma targets [Reference Li, Song and Wang5], varying altitude parameter between charged particles and 2DQEG [Reference Li, Song and Wang4, Reference Li, Song and Wang5, Reference Raphael and Gennes29], the external magnetic field [Reference Lafleur and Baalrud30, Reference Lafleur and Baalrud31], the spin effects [Reference Zhang, Jiang and Yi32], and so on.
In order to understand the interaction between charged particles and plasma targets in the presence of a laser field, a lot of theoretical studies have been carried out [Reference Arista, Galvão and Miranda33–Reference Wu, Luan and Wang39]. Within the dielectric formalism, Arist et al. [Reference Arista, Galvão and Miranda33] studied the influence of a strong laser field on the stopping power for charged particles in low-density nondegenerate plasmas, and the expression of stopping power is given when a laser field exists. The results show that the laser field reduces the stopping power of plasma and makes it anisotropic through the polarization of the electric field wave. Within the random-phase approximation theory, Nersisyan [Reference Nersisyan and Akopyan34] also investigated the stopping and acceleration effect of protons in a plasma in the presence of an intense radiation field and calculated the stopping power of charged particles in the high-frequency limit. With two-dimensional electrostatic particle-in-cell (2DPIC) simulation, Hu [Reference Hu, Song, Mišković and Wang35] studied energy loss of ion beam when plasma irradiated by a strong laser pulse and the dynamic polarization of plasma. Pertaining results make it clear that stopping power gets strongly modulated by the laser field.
However, these research methods are no longer applicable when studying the stopping power modulation by pump waves of charged particles moving above the 2DQEG. In the study of Nersisyan et al., when considering the interaction between laser and three-dimensional plasma, the expression of the vector potential A of electromagnetic waves was used [Reference Nersisyan and Akopyan34]. However, the vector potential expression of the electromagnetic wave A cannot be written for the interaction of 2DQEG and laser. Another feasible method to implement electromagnetic waves is to ignore the effect of the magnetic field and write down the expression for the electric field term of electromagnetic waves [Reference Mir, Shahid, Jamil, Rasheed and Shahbaz40]. The 2DPIC method cannot be used either to study the interaction between charged particles and 2DQEG. Because the charged particles are above the 2DQEG, a three-dimensional electrostatic particle-in-cell (3DPIC) method is required. However, the 3DPIC method is currently difficult to implement due to a large amount of calculation [Reference Hu, Song, Mišković and Wang35].
In this paper, a modified linear QHD is used to study the modulation effect of pump waves on the perturbation electron density and stopping power caused by the movement of charged particles above the 2DQEG. The outline of this article is as follows. In Section 2, the modified QHD is introduced to include the laser pump wave modulation and the two-dimensional electron exchange-correlation potential of high-density V xc2DH effects. The general expressions of perturbation electron density of 2DQEG and stopping power of incident charged particles are derived by the modified QHD theory. In Section 3, the numerical results of perturbation electron density of 2DQEG and stopping power of incident charged particles modulated by pump waves with various physical parameters (wavelength λ, amplitude Φ0, and time phase θ) are given. Section 4 gives a summary. Gauss system of units is adopted in this paper.
2. Quantum Hydrodynamic Model
2.1. Physic Model
The schematic diagram is given in Figure 1. 2DQEG is an idealized model, which corresponds to the electronic components on the surface or interface of metal or semiconductor in a very thin layer (only a few layers of atoms’ thickness). For the convenience of studying, it is generally considered that the thickness of such two-dimensional electron gas is taken negligible [Reference Stern and Howard41]. Consider an infinite 2DQEG composed of free electrons and motionless ions located on the plane z = 0, and use a Cartesian coordinate system to represent its position in the region z > 0 and z < 0. n 0 is the equilibrium density of electrons and ions. At equilibrium, 2DQEG density satisfies the relation ni = ne = n0 [Reference Zhang, Jiang and Yi32]. Considering that the quantum effect is more significant in the high-density electron gas, we take the equilibrium density of electrons and ions as n 0 = 5.69 × 1015cm−2, which is the density of aluminum surface [Reference Li, Song and Wang5].
The schematic diagram of the interaction between pump waves, charged particles, and 2DQEG.

Charged particles move in the x direction parallel to the 2DQEG plane, with a velocity of
 and a height of z 0 = 9λf away from the 2DQEG. Here, vB = e 2/ℏ is Bohr velocity,
 is Fermi wavelength, and e is the elementary charge. The density of charged particles with charge Z 1e can be expressed as
 , where r = r(x, y).
We assume that the pump waves are collimated, monochromatic, continuous electromagnetic waves with wavelength λ propagating in the +x direction. Along the +x direction, the pump wave with the wavelength from 0.1nm (γ rays) to 0.1cm (microwave) irradiates the 2DQEG. The electric field component of the pump wave acts on the 2DQEG as an external high-frequency electric field in the plane of x0y, and the reaction of the 2DQEG on the pump wave is without the scope of our consideration [Reference Hu, Song, Mišković and Wang35, Reference Zhang and Jiang42]. The electrons in the 2DQEG are affected by the pump wave electric field, which changes the spatial distribution of electrons in the 2DQEG. Then, the exciting electric field by electrons in 2DQEG acts on the incident particle, which affects the velocity of the incident particle, thus affecting the stopping power of incident particles. In terms of electric field, the pump waves can be expressed as
 , where k0 is the wave vector of pump waves [Reference Mir, Shahid, Jamil, Rasheed and Shahbaz40]. The time variable of the pump wave is t. The wavelength of the pump wave is λ = 1/k 0. ω 0 is the frequency of the pump wave, where
 , in which c = 2.998 × 10¹⁰ is the speed of light. The intensity of the pump wave can be calculated by
 [Reference Nersisyan and Akopyan34], and the maximum intensity of the pump wave is 1023W cm−2 in this paper. When k 0 is constant, the strength of the pump wave is varying with the pump amplitude Φ0.
2.2. Mathematical Model
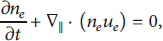
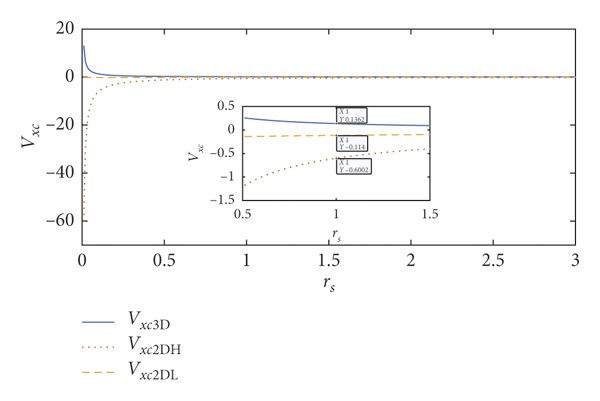
As a powerful research method, QHD theory is widely used in plasma research [Reference Zhang, Song, Zhao and Wang43–Reference Kumar and Ahmad45]. Li et al. [Reference Li, Song and Wang4, Reference Li, Song and Wang5, Reference Zhang, Zhao, Qi, Duan, Xiao and Yang46] conducted a series of studies on the stopping power of charged particles above the 2DQEG using linearized QHD theory, which is consistent with dielectric response theory and experimental results. In our research, the equilibrium electron density of 2DQEG will be disturbed by pump waves and injecting charged particles, generating charged fluid velocity field ue (r, t) and electron gas density ne (r, t). According to the linearized QHD theory, the density and velocity of electrons on the 2DQEG surface can be described by the continuity equation
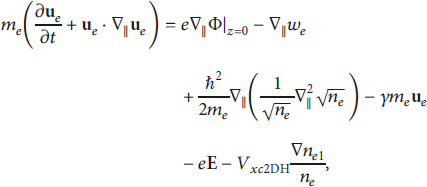
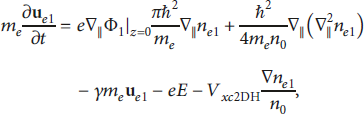
the momentum-balance equation
and Poisson’s equation

Here,
 , whereas in equation (3), the differentiation
 is unrestricted. Φ denotes total electrostatic potential built on wake potential Φind caused by the collective excitation of electron gas and the charged particle’s external potential. On the right-hand side of equation (2), the first term is the force of electrons on the 2DQEG surface due to the tangential electric field, and the second term is the force caused by the quantum statistical effect. Here,
 refers to the quantum statistical pressure term acting on electrons in 2DQEG, the third term is the force due to the quantum diffraction effects, the fourth term is the frictional force caused by the interaction between electrons and positive charge background where γ is the friction coefficient, the fifth term is the force on electrons owing to the electric field of pump wave, and the last term is the force on electrons due to electron exchange-correlation potential V xc2DH. The validity of QHD equations (1) and (2) implies that the off-diagonal components of the pressure tensor and viscosity remain negligible.
2.3. Exchange-Correlation Potential
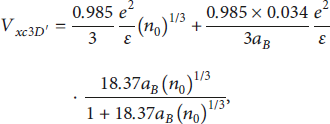
Exchange-correlation potential is an important quantum effect term. Mir et al. considered the exchange-correlation potential when studying degenerate plasmas [Reference Mir, Shahid, Jamil, Rasheed and Shahbaz40]. Haas derived a quantum fluid equation containing exchange correlation, which is described by an effective potential [Reference Haas47]. Pollack nd Perdew have made an in-depth study on the exchange-correlation potential of two-dimensional electron gas [Reference Pollack and Perdew48]. However, the exchange-correlation potential is not considered in the study of the interaction between incident particles and 2DQEG using the quantum hydrodynamic method so far. The three-dimensional electron exchange-correlation potential is expressed as follows:
where
 is effective Bohr atomic radius, in which ε = 1 is the relative dielectric constant and me is the electron mass [Reference Mir, Shahid, Jamil, Rasheed and Shahbaz40]. We adapt the dimension of the three-dimensional electron exchange-correlation potential to the dimension of the two-dimensional electron exchange-correlation potential based on [Reference Mir, Shahid, Jamil, Rasheed and Shahbaz40].
The two-dimensional electron exchange-correlation potential of low density is then expressed as follows [Reference Mir, Shahid, Jamil, Rasheed and Shahbaz40]:
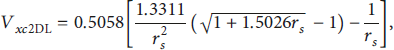
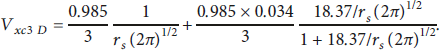
and the two-dimensional electron exchange-correlation potential of high density is expressed as follows [Reference Mir, Shahid, Jamil, Rasheed and Shahbaz40]:
where
 is the Wigner–Seitz radius associated with the 2DQEG density [Reference Pollack and Perdew48].
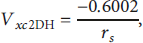
The V xc3D (solid line), the V xc2DL (dashed line), and the V xc2DH (dotted line) are shown in Figure 2. Here, the value of V xc3 D is positive, and the values of V xc2DL and V xc2DH are negative. It is reasonable to assume that two-dimensional electron exchange-correlation potential has completely different properties from its three-dimensional electron homologue. The Wigner–Seitz radius of 2DQEG that we are considering is rs = 1, the corresponding density is n 0 = 5.69 × 1015cm−2, and the corresponding exchange-correlation potentials are V xc3 D = 0.1362, V xc2DL = −0.114, and V xc2DH = −0.6002 (these are dimensionless values). In previous studies of the interaction between charged particles and 2DQEG, the exchange-correlation potential was ignored due to its small value. Here, the absolute value of V xc2DH is the largest compared with V xc3 D and V xc2DL and the absolute value of V xc2DH is almost six times as much as the absolute value of V xc3D and V xc2DL. It is necessary to consider V xc2DH in the research of interaction between incident charged particles and 2DQEG by using the QHD theory due to the high density in the quantum electron gas. This indicates that increasing density could enhance the exchange-correlation effect, as a function of the density. The exchange-correlation effect has been considered in quantum wells, GaAs/GaAlAs heterostructures, and silicon inversion layers, with the local density approximation method [Reference Stern and Das Sarma49, Reference Brey, Dempsey, Johnson and Halperin50].
The change of electron exchange-correlation potential with Wigner–Seitz radius of 2DQEG.
2.4. Linearized QHD Model
Let
 , where
 .
.
 ,
,
 , and
, and
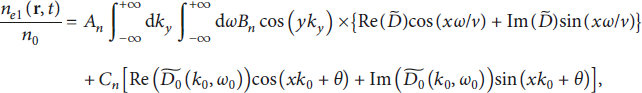
 are the first-order perturbed quantities of velocity, density, and potential, respectively. We linearize the above equation to obtain the perturbation electron density n e1 and the induced potential Φind [Reference Li, Song and Wang5]. Here are the linearized continuity equation
the momentum-balance equation
and Poisson’s equation

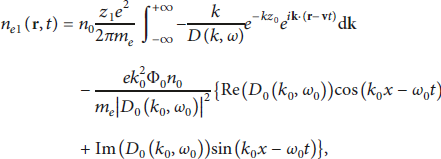
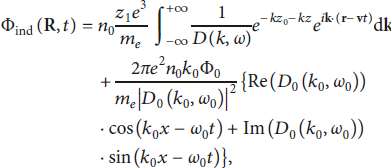
where Φ1 = Φext + Φind. Φext is the external potential of the incident particle. Φind is the induced potential by the perturbation electron density. Take the Fourier transform of the above linearized equations in space-time, and obtain the perturbation electron density n e1 and the induced potential Φind:
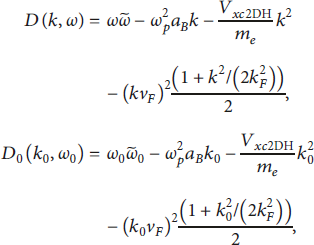
where
with
 . Bohr radius
 , Fermi velocity
 , Fermi wave-number
 , and electron plasma frequency
 . k = {kx, ky} is a two-dimensional wave vector. Consider that
 and the projectile velocity v and the x axis are going in the same direction, hence ω = kxv.
For convenience, we introduce the dimensionless variables:
 ,
,
 ,
,
 ,
,
 ,
,
 ,
,
 ,
,
 ,
,
 ,
,
 ,
,
 ,
,
 ,
,
 , and
, and
 . Thus, equation (11) can be reduced to
where
 ,
,
 ,
,
 ,
,
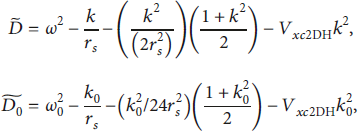
Here, t denotes time variable, ω 0 is constant when the wavelength λ is fixed, and θ = −ω 0t is used to modulate the phase, and it highlights the sine function factor oscillation of pump waves. Note that the introduced V xc2DH affects the electron density distribution by modifying the value of
 , determined through the Wigner–Seitz radius rs thus by the equilibrium density n 0. The second term of the reduced perturbation electron density is induced by the electric field of the pump wave in equation (14). Because the pump wave satisfies the relation k 0 = 1/λ, the second term of the reduced perturbation electron density is modulated by the wavelength λ, the amplitude Φ0, and the time phase θ. Furthermore, the stopping power S(v) determined by wake force can be given by the value of the gradient of the induced potential Φind [Reference Zhang, Jiang and Yi32]:
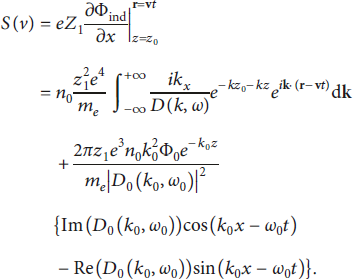
In the calculation above, the residue theorem is used. Using dimensionless variables, equation (16) can be reduced to
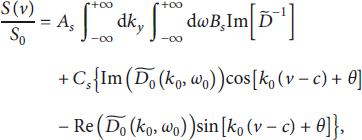
where
The stopping power is related to the velocity v of the incident particle. When the velocity variable v is extracted from the sine and cosine functions, the time variable t is also exposed. Similarly, to study the influence of the time variable t on the sine and cosine functions, we introduce the time phase θ, which means that the time variable t is changing the sine and cosine functions with
 in equation (16) while the time phase θ is changing the sine and cosine functions through θ in equation (17). Note that the second term of the stopping power is induced by the excited electric field of the pump wave in equation (16). The pump wave satisfies the relation ω0 = k 0c and 3k 0 = 1/λ, and hence, the second term of the stopping power is modulated by the wavelength λ, the amplitude Φ0, and the time phase θ.
In the next section, we will give the result of the effect of V xc2DH on the stopping power of the incident particle. To investigate the effect of pump wave on the perturbation electron density of 2DQEG and the stopping power of the incident particle, we calculate the perturbation electron density and the stopping power under different wavelength λ, amplitude Φ0, and time phase θ. In what follows, we take rs = 1, the collision frequency γ = 0.02ωP, incident particle as a proton Z1 = 1, and the distance between the incident particle and 2DQEG z 0 = 9λf, while the wavelength λ, the amplitude Φ0, and the time phase θ of the pump wave are varied.
3. Result and Discussion
3.1. Two-Dimensional Electron Exchange-Correlation Potential of High Density
In the past, Li et al. and Zhang et al. have done a lot of theoretical research studies on the stopping power of incident particles in the study of the charged particles moving above two-dimensional electron gases [Reference Li, Song and Wang4, Reference Li, Song and Wang5, Reference Zhang, Jiang and Yi32, Reference Zhang, Song and Wang38, Reference Zhang, Song, Zhao and Wang43]. On the basis of the work of Li et al. and Zhang et al., we investigate the effect of exchange-correlation potential on the stopping power of incident particles. In this paper, the stopping power of incident particles calculated without considering the exchange-correlation potential is consistent with the research results of Li et al. and Zhang et al.
As it can be assumed, V xc2DH modified the stopping power of the incident particle because V xc2DH has been considered in the momentum-balance equation, thereby changing the value of D and D 0 in equation (16) and modifying the stopping power of the incident particle. In order to verify the necessity of introducing V xc2DH to modifying QHD, Figure 3 presents the stopping power of the incident particle versus particle velocity under different conditions.
The stopping power of incident particles, respectively, with V xc3D = 0.1362, V xc2DH = −0.6002, and V xc2DL = −0.114. Here, Z 1 = 1, rs = 1, γ = 0.02, and Z 0 = 9.
Comparing the curve of stopping power without exchange-correlation potential (solid line), the curve of stopping power with V xc3D = 0.1362 (dashed line), the curve of stopping power with V xc2DL = −0.114 (dotted line), and the curve of stopping power with V xc2DH = −0.6002 (dash-dotted line) are shown in Figure 3. Considering the peak of the stopping power of the incident particle near V = 3.5VB in Figure 3, the value of stopping power without exchange-correlation potential exhibits an obvious difference with respect to stopping power featured by V xc3 D, V xc2DL, and V xc2DH. The value of stopping power without exchange-correlation potential is 0.01517S 0. The values of stopping power with V xc3D, V xc2DL, and V xc2DH, respectively, are 0.01506S 0, 0.01525S 0, and 0.01559S 0, which, respectively, are changed by 0.725%, 0.527%, and 2.77% relative to stopping power without Vxc (these are dimensionless values). The results show that the two-dimensional exchange-correlation potential, especially V xc2DH, influences the stopping power of incident particles. V xc2DH is adapted throughout the paper within subsequent results.
3.2. Amplitude of Pump Wave
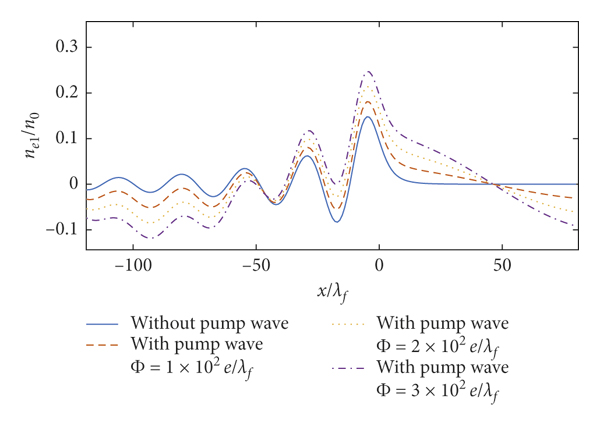
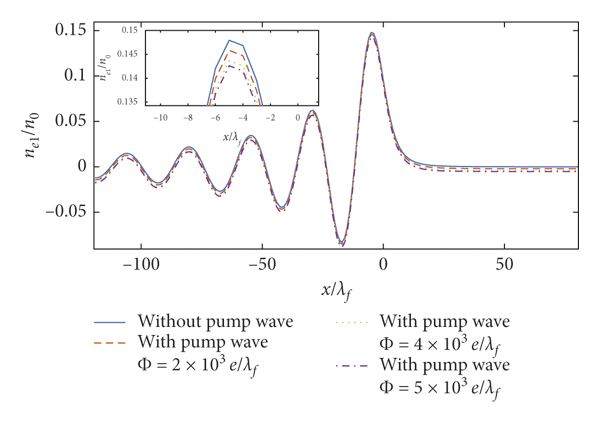
In order to study the modulation of pump wave amplitude Φ0 on the perturbation electron density and the stopping power, Figures 4 and 5 show the spatial distribution of the perturbation electron density as a function of x and the stopping power of the incident particle versus particle velocity under three different intensity conditions of the pump wave, where the wavelength is λ = 1.67 × 10⁻⁸ cm. The comparison of the perturbation electron density without the pump wave and with the pump wave for
 ,
,
 , and
, and
 , respectively, shows that the oscillation amplitude of the perturbation electron density increases when considering the pump wave in most cases and the oscillation amplitude of the perturbation electron density becomes larger as the amplitude of the pump wave increases in Figure 4. This is because the value of the second term in equation (14) is proportional to the factor of Φ0. But the oscillation amplitude of the perturbation electron density displays specific features near x = −29λf. This is due to the value of the incident particle external potential and induced potential by the perturbation electron density. The comparison of the stopping power without the pump wave and with the pump wave for
 ,
,
 , and
, and
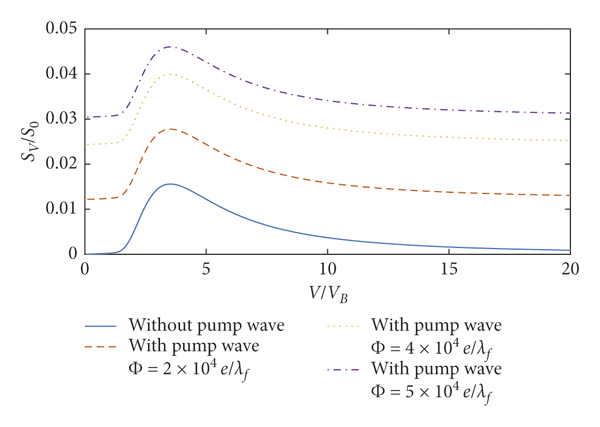
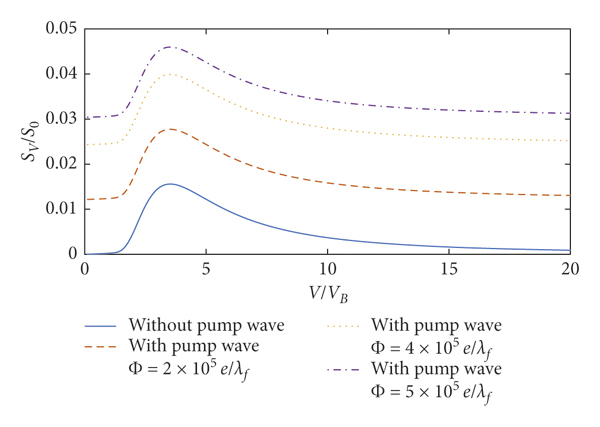
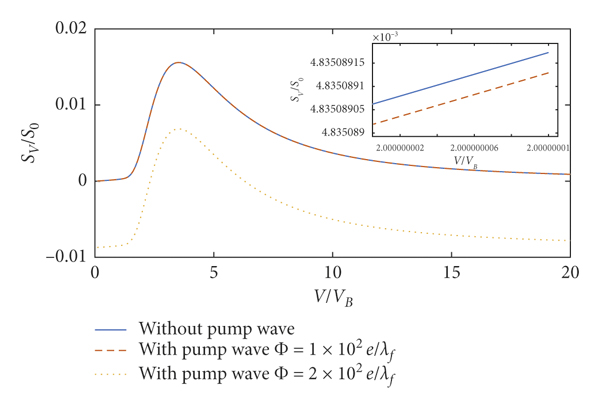
 , respectively, shows that the pump wave yields obvious modulation effects on the stopping power, and the intensity of this modulation is proportional to the amplitude of the pump wave in Figure 5. This is because the value of the second term in equation (17) is proportional to Φ0. In the low-velocity region (v < 8.3vB), the stopping power that peaks at v = 3.5vB with the pump wave for
 ,
,
 , and
, and
 , respectively, increases by 12.4%, 24.7%, and 37.1% relative to the case without the pump wave. Moreover, in the high-velocity region (v > 8.3vB), it is easy to see that the pump wave dominates the stopping power as the particle velocity increases compared to the stopping power quickly vanishing without the pump wave. The value of stopping power at v = 13.7vB with pump wave for
 decreases to −0.003772S 0. It is surprising that a negative stopping power [Reference Nersisyan and Akopyan34] is found due to the existence of the pump wave, different from our observation without the pump wave. The appearance of negative stopping power means that the particle drains energy from the 2DQEG.
2DQEG perturbation electron density. Here, Z 1 = 1, rs = 1, v = 2, γ = 0.02, Z 0 = 9, λ = 1.67 × 10⁻⁸ cm, and θ = 0.
Stopping power of the incident charged particle. Here, Z 1 = 1, rs = 1, γ = 0.02, Z 0 = 9, λ = 1.67 × 10⁻⁸ cm, and θ = 0.
Generally, when the pump wave does not exist, due to the disturbance of the electron density in 2DQEG caused by charged particles, negative charges will accumulate behind the charged particles in 2DQEG to excite the wake field, thereby reducing the speed of the charged particles. When the pump wave exists, in addition to the density disturbance of 2DQEG caused by charged particles, we also need to consider the density disturbance caused by the electric field component of the pump wave. Since the electric field of the pump wave changes periodically with time, the density disturbance caused by the electric field component of the pump wave will also change periodically. The deceleration and acceleration effects of the electric field excited by the perturbation density caused by the pump wave on the charged particles will change periodically with time. When the electric field excited by the perturbation density caused by the pump wave in 2DQEG has a deceleration effect on the charged particles, the stopping power of the charged particles will increase. When the electric field excited by the perturbation density caused by the pump wave accelerates the charged particles, the stopping power of the charged particles will decrease. When the acceleration of the electric field excited by the perturbation density caused by the pump wave has a stronger effect on the charged particles than the deceleration of wake field excited by the charged particles, the velocity of the charged particles will increase and negative stopping power appears. In other words, the polarity of wake field can be tuned in the presence of the pump wave, yielding the negative stopping power.
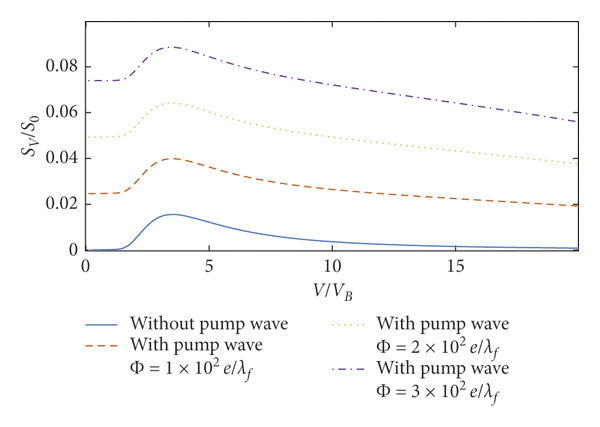
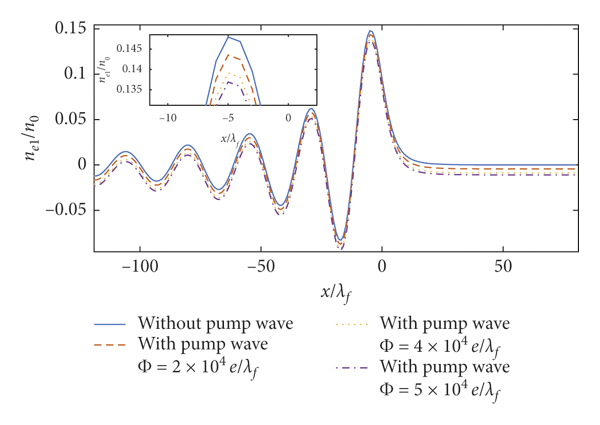
In the case of λ = 1.56 × 10⁻⁷ cm, the comparison of the perturbation electron density and stopping power without the pump wave and with the pump wave shows that the modulation effect on the oscillation amplitude of the perturbation electron density and stopping power is proportional to the amplitude of the pump wave in Figures 6 and 7. As the value of the second term in equations (14) and (17) increases with increase in Φ0, it is easy to see that the oscillation amplitude of the perturbation electron density at x = −5λf with the pump wave for
 ,
,
 , and
, and
 , respectively, increases by 22.2%, 44.5%, and 66.8% in Figure 6. At x > 10λf or x < −46λf, the pump wave with wavelength λ = 1.56 × 10⁻⁷ cm dominates the oscillation amplitude of the perturbation electron density compared to the perturbation electron density quickly vanishing without the pump wave. The stopping power at v = 3.5vB with the pump wave for Φ0 = 1 × 10²e/λf,
 , and
, and
 , respectively, increases to 0.03991S 0, 0.06422S 0, and 0.08854S 0 in Figure 7.
2DQEG perturbation electron density. Here, Z 1 = 1, rs = 1, v = 2, γ = 0.02, Z 0 = 9, λ = 1.56 × 10⁻⁷ cm, and θ = 0.
Stopping power of the incident charged particle. Here, Z 1 = 1, rs = 1, γ = 0.02, Z 0 = 9, λ = 1.56 × 10⁻⁷ cm, and θ = 0.
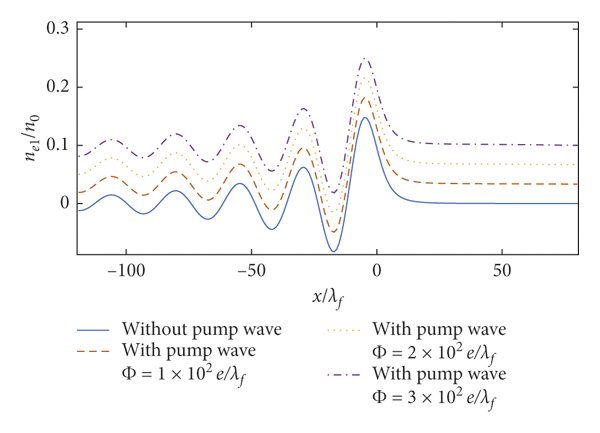
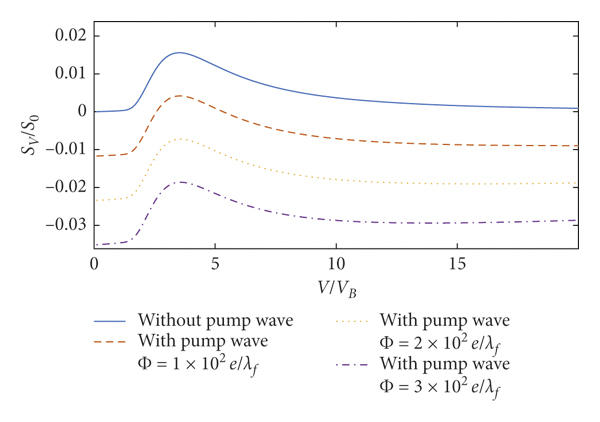
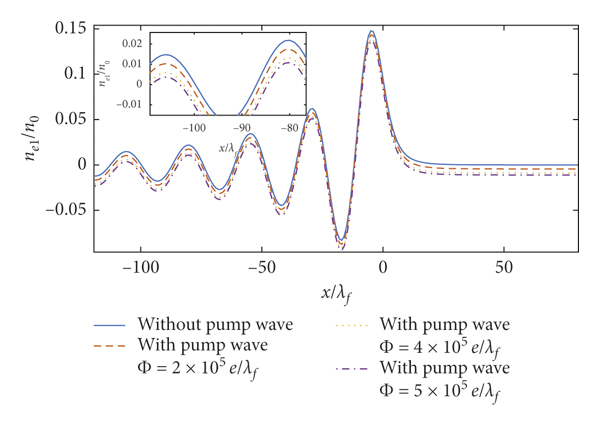
In the case of λ = 1.76 × 10⁻⁶ cm, the comparison of the perturbation electron density and stopping power without the pump wave and with the pump wave shows that the pump wave has an obvious modulation effect on the oscillation amplitude of the perturbation electron density and stopping power in Figures 8 and 9, and the modulation effect of pump wave strengthens as the amplitude of pump wave increases, which again arises from equations (14) and (17) second term proportional to Φ0. The modulation effect of the pump wave only changes the amplitude, not the shape of the perturbation electron density and stopping power. It is easy to see that the oscillation amplitude of the perturbation electron density at x = −5λf with the pump wave for
 ,
,
 , and
, and
 , respectively, increases by 22.9%, 45.8%, and 68.7% in Figure 8. The oscillation amplitude of the perturbation electron density increases with the pump wave amplitude. The amplitude of the stopping power at v = 3.5vB with pump wave for
 ,
,
 , and
, and
 , respectively, decreases to 0.004182S 0, −0.0007226S 0, and −0.01862S 0 in Figure 9. The oscillation amplitude of the stopping power rises as the amplitude of the pump wave increases. Interestingly, the negative stopping power is also found in Figure 9.
2DQEG perturbation electron density. Here,
 cm, and θ = 0.
Stopping power of the incident charged particle. Here,
 cm, and θ = 0.
Figures 10–15 show the perturbation electron density and stopping power with the pump wave for λ = 1.76 × 10⁻⁴ cm, λ = 1.76 × 10⁻² cm, and λ = 1.76 × 10⁻¹ cm. The results of Figures 12 and 14 are similar to that of Figure 10. And the results of Figures 13 and 15 are similar to that of Figure 11 because the variations of the second term in equations (14) and (17) remain small in the domain of
 and
and
 . The oscillation amplitude of the perturbation electron density increases as the amplitude of pump wave rises in Figures 10, 12, and 14. The effect of the pump wave on the stopping power strengthens as the amplitude of pump wave increases in Figures 11, 13, and 15.
2DQEG perturbation electron density. Here,
 cm, and θ = 0.
Stopping power of the incident charged particle. Here,
 cm, and θ = 0.

2DQEG perturbation electron density. Here,
 cm, and θ = 0.
Stopping power of the incident charged particle. Here,
 cm, and θ = 0.
2DQEG perturbation electron density. Here,
 cm, and θ = 0.
Stopping power of the incident charged particle. Here,
 cm, and θ = 0.
Therefore, the amplitude of the pump wave has a significant effect on the oscillation amplitude of the perturbation electron density and stopping power, while the oscillation amplitude of the perturbation electron density and stopping power rises with the pump wave amplitude. The amplitudes
 are realistic values in current experimental technologies and consistent with those used in [Reference Zhang, Zhai and Yi51].
3.3. Wavelength of the Pump Wave
The wavelength of the pump wave is an essential parameter for the modulation of the pump wave on the perturbation electron density and the stopping power. Comparing Figures 14 and 15, it is found that the influence of wavelength of the pump wave on the perturbation electron density and the stopping power is mainly reflected in the modulation of the shape of the perturbation electron density curve and the stopping power curve.
Let us consider the perturbation electron density curve and the stopping power curve for a short wavelength of the pump wave of λ = 1.67 × 10⁻⁸ cm. In the space range from −120λ f to 80λ f, the perturbation electron density shows a violent periodic oscillation, contrasted to the no pump wave case, as shown in Figure 4. The stopping power also has been modulated by the pump wave in the velocity range from 0vB to 20vB in Figure 5. The reason is that the second term contains the factor k 0 in equations (14) and (17), which is inversely proportional to the wavelength λ. So the perturbation electron density and the stopping power are strongly modulated by the pump wave.
Observe the perturbation electron density curve and the stopping power curve with a wavelength of λ = 1.56 × 10⁻⁷ cm. The number of oscillating periods of the perturbation electron density decreases over a range of −120λ f to 80λ f in Figure 6. The oscillation period of the stopping power is smaller than one period in the velocity range from 0vB to 20vB in Figure 7. This is because the k 0 value decreases in equations (14) and (17) as the wavelength λ is increasing. Therefore, the effect of the pump wave on the perturbation electron density and stopping power modulation is reduced compared to the wavelength λ = 1.67 × 10⁻⁸ cm.
With the wavelength of the pump wave λ = 1.76 × 10⁻⁶ cm, the perturbation electron density oscillates less than one period in the space range of −120λ f to 80λ f in Figure 8. The stopping power oscillation period is also shorter than one period in the velocity range from 0vB to 20vB in Figure 9. As the wavelength λ becomes longer, the value of k 0 becomes smaller. The pump wave modulation to perturbation electron density and stopping power is further reduced in the region of
 and
and
 .
.
When the amplitude of the pump wave is
 , the maximum value of perturbation electron density curves with wavelength λ = 1.67 × 10⁻⁸ cm, λ = 1.56 × 10⁻⁷ cm, and λ = 1.76 × 10⁻⁶ cm, respectively, is 0.2082n 0, 0.2469n 0, and 0.2497n 0 in Figures 4, 6, and 8. Those results show that the maximum value of the perturbation electron density increases in the region of
 with the wavelength which means that the wavelength of the pump wave not only modifies the shape of the curve but also the amplitude of the perturbation electron density. Comparing the stopping power curves when the amplitude of pump wave is
 in Figures 5, 7, and 9, the maximum value of stopping power with wavelength λ = 1.67 × 10⁻⁸ cm, λ = 1.56 × 10⁻⁷ cm, and λ = 1.76 × 10⁻⁶ cm, respectively, is 0.02137S 0, 0.08854S 0, and −0.01863S 0. The value of stopping power dramatically changes because k 0 varied when the wavelength is increasing.
As the wavelength of the pump wave increases, the pump wave modulates the shape of the perturbation electron density curve more and more weakly in the space range of −120λf to 80λf in Figures 10, 12, and 14. Similarly, as the wavelength of the pump wave increases, the shape of the stopping power curve is modulated more weakly by the pump waves in the 0vB to 20vB speed range in Figures 11, 13, and 15. The modulation of the wavelength of the pump wave to the shape of the perturbation electron density curve and the stopping power curve decreases as the wavelength increases, arising from the tiny second term change in equations (14) and (17).
3.4. Phase of Pump Wave
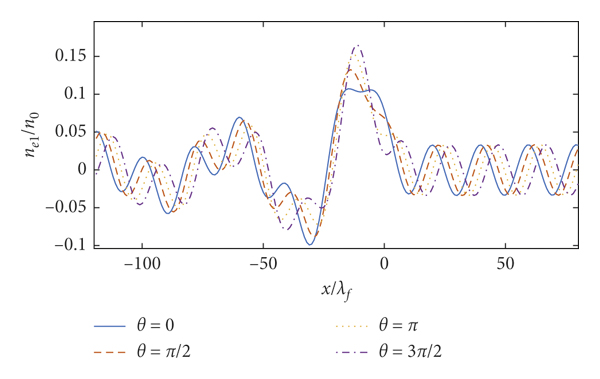
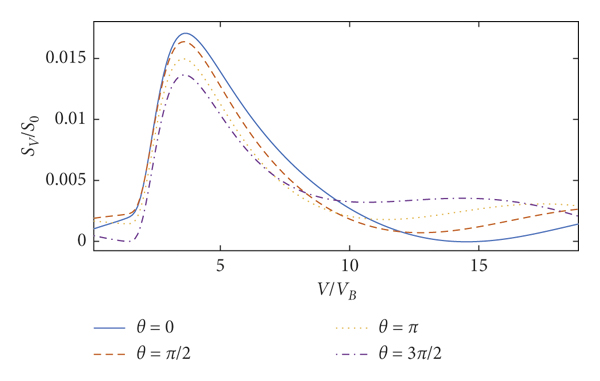
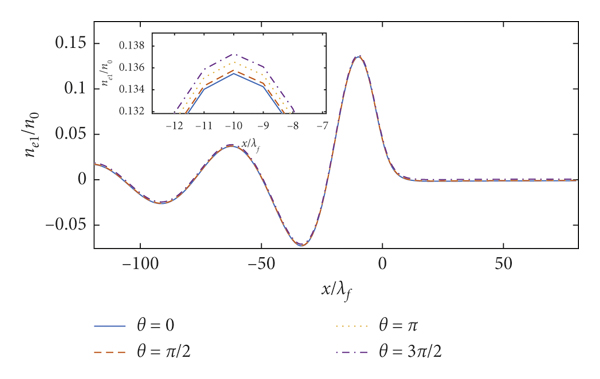
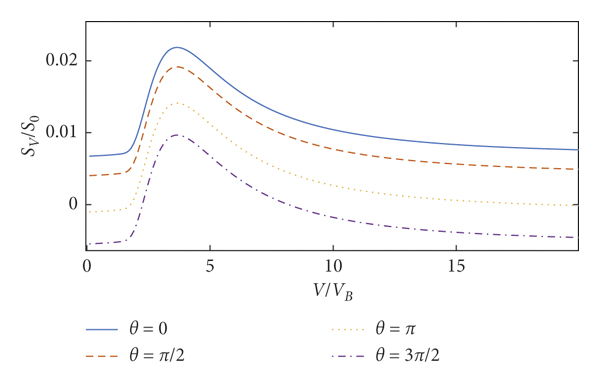
Finally, in order to study the effect of time phase θ on the perturbation electron density and stopping power, Figures 16–19 exhibit the perturbation electron density and stopping power with wavelength λ = 1.67 × 10⁻⁸ cm and λ = 1.76 × 10⁻⁴ cm for θ = 0 (solid line), θ = π/2 (dashed line), θ = π (dotted line), and
 (dash-dotted line). Here,
 . It is easy to see that the amplitude of perturbation electron density and stopping power oscillates periodically with different time phase θ in Figures 16–19. This is because the second term includes the parameter time phase θ in equations (14) and (17). Therefore, the time phase θ obviously impacts the perturbation electron density and stopping power.
2DQEG perturbation electron density. Here, Z 1 = 1, rs = 1, v = 2, γ = 0.02, Z 0 = 9, λ = 1.67 × 10⁻⁸ cm, and
 .
.
Stopping power of the incident charged particle. Here, Z 1 = 1, rs = 1, γ = 0.02, Z 0 = 9, λ = 1.67 × 10⁻⁸ cm, and
 .
.
2DQEG perturbation electron density. Here, Z 1 = 1, rs = 1, v = 2, γ = 0.02, Z 0 = 9, λ = 1.76 × 10⁻⁴ cm, and
 .
.
Stopping power of the incident charged particle. Here, Z 1 = 1, rs = 1, γ = 0.02, Z 0 = 9, λ = 1.76 × 10⁻⁴ cm, and
 .
.
It is worth pointing out that the negative stopping power in Figures 5, 9, and 19 we found is instantaneous, which is difficult to verify experimentally, and it is also difficult to apply. So we consider averaging the stopping power with respect to the time phase θ. After averaging the stopping power with respect to the time phase θ from 0 to 2π, we found that the pump wave with
 decreases the value of stopping power in Figure 20. This is because the value of averaged second term is negative in equation (17) with respect to the time phase θ. But amplitude reduction shows up as a relatively small one in connection to the too low pump wave intensity (Figure 20). This is because the intensity of pump wave is too low. Linearized QHD is valid only for low intensity of pump wave. The comparison of the stopping power without the pump wave and the average stopping power with pump wave for
 and λ = 1.76 × 10⁻⁴ cm demonstrates that the average stopping power decreases in the region of
 in Figure 20.
The average value of stopping power for time phase. Here, Z 1 = 1, rs = 1, γ = 0.02, Z 0 = 9, and λ = 1.76 × 10⁻⁴ cm.
It is an exciting result that the average stopping power of the incident particles is negative in the region
 and
and
 when λ = 1.76 × 10⁻⁴ cm and
 . The incident particles will gain energy and can be accelerated within the velocity range of
 and
and
 . Although this result is not strictly obtained by using the linearized QHD due to the amplitude of pump wave which is too large, this could predict qualitatively that the time averaged stopping power has indeed been affected by the pump waves.
In conclusion, the time phase of pump wave θ can adjust the value of perturbation electron density effectively and stopping power, and the averaging of the stopping power with respect to the time phase θ also has been impacted. Therefore, one can see that the perturbation electron density and stopping power depend on λ, Φ0, and θ, indicating that the pump wave using different parameters can modulate the perturbation electron density and stopping power of 2DQEG.
4. Summary
In this paper, considering the electron exchange-correlation potential V xc2DH in QHD, we have calculated the perturbation electron density and stopping power with the modulation of pump wave for a charged particle with a constant distance and speed moving above 2DQEG. In our calculation, we compare the stopping power with and without V xc2DH and show that it is necessary to consider V xc2DH in 2DQEG. Then, we compare the perturbation electron density and stopping power with different wavelength λ, amplitude Φ0, and time phase θ of the pump wave and show that it is meaningful to investigate the modulation effect of the pump wave on the perturbation electron density and the stopping power. The wavelength λ, the amplitude Φ0, and time phase θ of the pump wave can effectively modulate the value of the perturbation electron density and stopping power. The temporal averaged stopping power with respect to the time phase θ also has been influenced by pump waves.
The possible experimental equipment to verify the prediction includes three components: pump wave, charged particle beam, and 2DQEG. The pump wave can be provided by laser or microwave device, the plasma wake field [Reference Yao, Li and Cao52] can produce the charged particle beam, and 2DQEG has already been observed in experiments [Reference Qi and Zhang2, Reference Di Pietro, Ortolani and Limaj3]. All of them can be realized with present technology. At present, the intensity of laser systems provided by the laboratory has arrived 1024 ∼ 1026Wcm−2 [Reference Kemp, Fiuza and Debayle53]. Thus, the parameter of the pump wave considered here can be easily satisfied. We can verify the negative stopping power by measuring the velocity of the incident particle. For instance, charged particles move in the x direction parallel to the 2DQEG plane, with a velocity of v and a height of z 0 away from the 2DQEG, and the pump wave irradiates the 2DQEG along the +x direction. The wavelength of pump wave is λ = 1.76 × 10⁻⁴ cm and
 . The density of two-dimensional electron gases is n 0 = 5.69 × 1015cm−2. The velocity of incident particles is v = 2vB (vB = 2.18 × 108 cm/s), and the distance between incident particles and two-dimensional electron gases is z 0 = 9λf = 4.76 × 10⁻⁸cm. The measured particles flying out the right side of the 2DQEG will gain energy from the 2DQEG and get accelerated.
It is appropriate to investigate the stopping power modulation by low-intensity pump waves of the charged particle moving above two-dimensional electron gases using the linearized QHD, but linearized QHD is not strictly applicable to high-intensity pump waves. In future work, we attempt to further study the effect of high-intensity pump waves on the stopping power with nonlinear QHD.
Data Availability
The data that support the findings of this study are available from the corresponding author upon reasonable request.
Conflicts of Interest
The authors declare that they have no conflicts of interest.
Acknowledgments
This work was supported by the National Natural Science Foundation of China (11975174 and 11775090), the National Magnetic Confinement Fusion Energy Research Project (2017YFE0301805 and 2017YFE0301803), and the Fundamental Research Funds for the Central Universities (WUT: 2020IB023 and 2018IB011).


 Open access