Coffee is one of the most-traded commodities and highest-valued cash crops worldwide. Since coffee is mostly produced on small-scale holdings in developing countries, its production plays a vital role in the livelihoods of 25 million rural households in Asia, Africa, and Latin America. In India alone, it provides livelihoods for more than 150,000 growers and one million workers and their families (United Nations (UN) 2012) and small-scale holdings account for 70 percent of the nation's production (Coffee Board of India (CBI) 2015). Coffee became an important export commodity for India after its independence, and today, almost 80 percent of the coffee produced is exported (CBI 2015). Globally in 2012, India was the fifth-largest coffee producer in the world and the third-largest in Asia (Food and Agriculture Organization (FAO) 2012), contributing 4 percent of the world's total production (UN 2012).
The majority of the small-scale coffee producers in India are poor, and the worldwide coffee crisis in the early 2000s further impoverished them. During the crisis (Ponte Reference Ponte2002), many of India's smallholders suffered from hunger and took on large amounts of debt, and a few committed suicide (Chattopadhayay and John Reference Chattopadhayay and John2007). In response to volatile market prices, credit constraints, and supply shocks, several alternative market channels—fair trade, organic, Smithsonian bird-friendly, and Rainforest Alliance certification—have been promoted as possible solutions. These certification schemes are based primarily on environmental and social parameters. Fair trade certification, for example, is aimed at improving the living conditions of operators of certified farms, and organic and bird-friendly certification schemes promote organic agriculture and preservation of bird species on certified farms. Simultaneously, certification schemes recognize that profitability is the major driver of adoption of such certifications by smallholders and hence incorporate provisions for price premiums for certified farmers.
Another factor in development of certification schemes worldwide is demand by consumers in developed countries for environmentally friendly and socially responsible coffees (Rice Reference Rice2001, Basu, Chau, and Grote Reference Basu, Chau and Grote2003). Fair trade certification, which is one of the oldest and is the second-largest initiative after organic certification, is known for promoting social justice and having high standards in terms of development that favors small-scale producers (Raynolds, Murray, and Heller Reference Raynolds, Murray and Heller2007). Under the fair trade regime, small-scale coffee farmers in developing countries are supposed to benefit from long-term trading relationships, price premiums, social projects such as establishing schools and healthcare centers, flexible credit arrangements, and greater labor rights (Muradian and Pelupessy Reference Muradian and Pelupessy2005, Raynolds, Murray, and Heller Reference Raynolds, Murray and Heller2007).
Several empirical studies, conducted mostly in Latin America and Africa, have examined factors that influence adoption of fair trade certification and its impacts on household welfare in terms of incomes and consumption expenditures (Arnould, Plastina, and Ball Reference Arnould, Plastina and Ball2009, Jena et al. Reference Jena, Chichaibelu, Stellmacher and Grote2012, Ruben and Fort Reference Ruben and Fort2012, Chiputwa, Spielman, and Qaim Reference Chiputwa, Spielman and Qaim2015). The results have been mixed. Jena et al. (Reference Jena, Chichaibelu, Stellmacher and Grote2012) studied coffee-growers in Ethiopia and found that organic and fair trade certifications there did not contribute to incomes or reduce poverty but did have a significant impact on per capita consumption. Ruben and Fort (Reference Ruben and Fort2012) also found no significant gains in income for fair-trade-certified Peruvian coffee farmers. However, Arnould, Plastina, and Ball (Reference Arnould, Plastina and Ball2009) found small, uneven increases in household welfare in Peru, Guatemala, and Nicaragua. Recently, in a study in Uganda, Chiputwa, Spielman, and Qaim (Reference Chiputwa, Spielman and Qaim2015) found that fair trade certification had a significant positive impact on household living standards relative to organic and UTZ certification. All of these studies were based on cross-section data and used propensity score matching with either a binary or multiple treatments. Parvathi and Waibel (Reference Parvathi and Waibel2015, Reference Parvathi and Waibel2016), on the other hand, used panel data to analyze the impacts of organic and fair trade certification for farmers growing black pepper in India. Applying propensity score matching and an endogenous switching regression method, they found that participation in fair trade did not contribute to higher incomes for organic pepper farmers but did increase their asset levels.
Against this backdrop, we analyze farmers' decisions to participate in fair trade certification and the welfare impacts of participation in terms of income for small-scale coffee producers in the Araku valley of Andhra Pradesh in India. Using panel data for two years, this study is the first to capture dynamic impacts of coffee certification over time. We also employ an endogenous switching regression method that addresses self-selection and unobserved-variable bias. The regression creates a counterfactual scenario for the treatment and control groups and compares the results of the actual and counterfactual scenarios for each group, thus providing a credible treatment effect. Furthermore, we use quantile regression to capture possible heterogeneous effects of fair trade certification on income. To the best of our knowledge, this is the first study to evaluate the impacts of coffee certification in India using two methodologies. The results show that fair trade certification increased incomes for certified coffee farmers relative to farmers who did not obtain certification. Moreover, the proportional increase in income is greatest for farmers in the lower income quantiles, suggesting that relatively poor certified farmers have benefitted more than their richer counterparts.
Data and Methodology
Survey Site
The panel data for this analysis were collected via a survey of coffee growers in Araku valley of Andhra Pradesh, where coffee production comes almost entirely from smallholders. The valley has an elevation of 900–1,100 meters above sea level and annual rainfall of 1,000–1,200 millimeters. The total area under coffee production is about 20,000 hectares, mostly of Arabica beans, with average production of about 3,100 metric tons per year. The region's production system is unique; coffee there is entirely shade-grown and is intercropped with peppers, mangos, jackfruits, and vegetables.
Coffee producers in the Araku valley are primarily tribal people known locally as Adivasi who originally conducted slash-and-burn shifting cultivation of various crops prior to cultivating shade-grown coffee (CBI 2015). The Indian government promoted coffee-growing in the valley in 1995 through the Integrated Tribal Development Agency (ITDA) as a way for tribal communities to preserve local ecosystems and to provide a continuous, assured source of income to inhabitants of the community for basic amenities. Initially, CBI provided technical support. In 2001, a non-governmental organization (NGO) began working in the area and has since played a major role in providing technical support for collectively organizing coffee production, facilitating international certification, and assisting growers with marketing and exports. Coffee producers cannot be individually registered for fair trade certification so the NGO helped them to organize a producer cooperative in 2007. The cooperative was fair-trade certified in 2008 and was the first and the largest coffee cooperative in India to receive such certification (Mercereau and Vignault Reference Mercereau and Vignault2008). Hereafter, to simplify the discussion, we refer to the households simply as certified and uncertified based on their participation in the fair trade cooperative.
The structure of a value chain for fair trade coffee is composed of various actors and activities: supplying of inputs, production, processing, and marketing. The primary actor is the producer cooperative, which performs multiple functions for its members, including collecting the coffee and assisting with credit and some processing activities, such as drying, grading, and sorting. The beans collected from producers are sent to a centralized unit for further processing and are then directly exported as fair-trade certified coffee. This supply chain is shorter than conventional supply chains because of the relatively small number of parties involved.
Data Collection
The household survey used to collect the panel data was conducted in 2010 and 2011 and followed a multi-stage sampling procedure. First, we selected the Visakhapatnam district of Andhra Pradesh state since coffee is grown only in that district and then selected six subdistricts, also called mandals, where the cooperative was working. We then selected thirteen villages from the six subdistricts and randomly selected households from those villages in proportion to the size of the village following a random-walk method. The households were assigned to groups based on whether the household belonged to the cooperative and thus produced fair-trade-certified coffee. The structured questionnaire collected data on socio-economic and farm characteristics, household incomes and expenditures, certification status, services provided to the household by the cooperative, and sales channels used by the grower.
The 2010 survey involved 183 households with 86 growing certified coffee and 97 growing uncertified coffee. In 2011, we surveyed the same 183 households, now comprised of 105 certified growers and 78 uncertified growers (Table 1).
Table 1. Transition to Certification between 2010 and 2011

Methodology
Our variable of interest, participation in certification, is based on individual selections and could be correlated with unobservable characteristics such as individual farmers' degree of motivation or ability, which would also affect their incomes. A simple comparison that ignores such correlation could provide misleading results that attribute differences in income between certified and uncertified coffee-growers to certification even if participating in the fair trade cooperative had no effect on income. To account for both endogeneity and sample selection, we use an endogenous switching regression consisting of two stages. In the first stage, the model estimates the decision to participate in fair trade certification using a random utility framework. A utility-maximizing farmer chooses to participate in certification if the utility derived from participation, U Pi , is greater than the utility derived from nonparticipation (U NPi ). Since those utilities are unobservable, the utility gain (U Pi – U NPi ), denoted by P*, can be expressed in the latent variable model as a function of observable components and the error term:
where P is a binary variable for participation in fair trade certification that takes a value of 1 if the farmer chooses to participate and 0 otherwise, X is a vector of explanatory variables, β is a vector of coefficients to be estimated, and ε is the error term.
The observed variables in the model are household characteristics, physical assets, training, and financial resources. The influence of each of these variables on the participation decision is based on previous findings (Holzapfel and Wollni Reference Holzapfel and Wollni2014, Ayuya et al. Reference Ayuya, Gido, Bett, Lagat, Kahi and Bauer2015, Wollni and Zeller Reference Wollni and Zeller2007, Chiputwa, Spielman, and Qaim Reference Chiputwa, Spielman and Qaim2015, Parvathi and Waibel Reference Parvathi and Waibel2015, Khonje et al. Reference Khonje, Manda, Alena and Kassie2015) and is summarized in appendix 1. The household characteristics included in the model are age, education, gender, dependency ratio, and farming experience. We expect that education and training in farming will improve farmers' ability to make decisions about best practices and adopting new technologies and thus increase the probability of participation in certification. We also expect that experience with coffee cultivation will be positively associated with participation in fair trade certification because experience allows producers to gain knowledge over time to evaluate certification schemes. Land and livestock holdings serve as proxies for assets, and we expect that farmers who have greater capital can afford to take risks associated with adopting new practices and will be more likely to participate in fair trade certification. Access to nonfarm income also increases their risk-bearing capacity and is likely to have a positive effect on participation.
After estimating the effect of the variables on the likelihood of a farmer choosing to participate in certification, we analyze the relationship between household income (expressed as purchasing power parity in U.S. dollars (PPP$)) and the explanatory variables conditional on participation using ordinary least squares with a selection correction term:
where Y C and Y NC represent income for certified and uncertified households, respectively, and ε C and ε NC are the error terms.
The endogenous switching regression is estimated simultaneously using full information maximum likelihood, and endogeneity is modeled through correlation between the error terms (ε C , ε NC , and ε0), which is observed to have a trivariate normal distribution with zero mean. The covariate matrix is specified as
 $${\rm Cov\; }({\rm \varepsilon }_C,{\rm \varepsilon }_{NC},{\rm \varepsilon }_0) = \left[ {\matrix{ {{\rm \sigma }_C^{\rm 2} } & {{\rm \sigma }_{CNC}} & {{\rm \sigma }_{C{\rm 0}}} \cr {{\rm \sigma }_{CNC}} & {{\rm \sigma }_{NC}^{\rm 2} } & {{\rm \sigma }_{NC{\rm 0}}} \cr {{\rm \sigma }_{C{\rm 0}}} & {{\rm \sigma }_{NC{\rm 0}}} & {{\rm \sigma }_{\rm 0}^{\rm 2} } \cr } } \right]$$
where
![]() ${\rm \sigma} _C^{\rm 2}$
and
${\rm \sigma} _C^{\rm 2}$
and
![]() ${\rm \sigma} _{NC}^{\rm 2}$
are the variances of the error terms ε
C
and ε
NC
in outcome equations 2 and 3 and
${\rm \sigma} _{NC}^{\rm 2}$
are the variances of the error terms ε
C
and ε
NC
in outcome equations 2 and 3 and
![]() ${\rm \sigma} _{{\rm 0\; }} ^{{\rm 2\; }} $
is the variance of error term ε0 in selection equation 1.
${\rm \sigma} _{{\rm 0\; }} ^{{\rm 2\; }} $
is the variance of error term ε0 in selection equation 1.
For better identification of the model, an exclusion restriction is applied in which X i in equation 1 contains one selection instrument, training, that is not included in equations 2 and 3 (Wooldridge Reference Wooldridge2010). To test the validity of that instrument, we follow a simple falsification test suggested by Di Falco, Veronesi, and Yesuf (Reference Di Falco, Veronesi and Yesuf2011). The results of the test showed that training affected participation in fair trade certification (Table 5) but did not affect the incomes of uncertified households (see appendix 2), confirming the validity of training as the selection instrument.
Using this framework, we compare the expected income of certified households to their expected incomes in a counterfactual hypothetical case in which they are not certified. Table 2 presents the conditional expectations and counterfactual hypothetical cases, which are derived as follows.
Cases A and B in Table 2 represent the actual expectations (incomes observed in the sample) and cases C and D represent the counterfactual expected incomes.
Table 2. Conditional Expectations and Treatment

Note: A and B represent the observed expected log of monthly per capita income. C and D represent the counterfactual expected log of monthly per capita income. A = 1 if households are certified and 0 if households are not certified. Y C is the log of the monthly per capita income if households are certified, Y NC is the log of the monthly per capita income if households are not certified, TT is the effect of the treatment (certification) on the treated (households that are certified), and TU is the effect of the treatment (certification) on the untreated (households not certified).
The treatment effect on the treated (TT) is given by the difference between A and C.
Similarly, the treatment effect on the untreated is the difference between D and B.
Quantile Regression
We expect that certification will affect low-income and high-income households differently. Therefore, to capture the heterogeneity effect and comprehensively investigate the relationship between certification and income, we perform a quantile regression, which is a robust method for asymmetric distributions that allows estimation of the effects of predictor variables across quantiles of a dependent variable:
where
![]() $Q_{y_i}\lpar {\rm \tau \vert } X_i\comma \; \; {\rm \alpha} _i\rpar $
denotes the τth conditional quantiles of Y
i
given X
i
in the interval (0,1). The estimates are obtained by minimizing
$Q_{y_i}\lpar {\rm \tau \vert } X_i\comma \; \; {\rm \alpha} _i\rpar $
denotes the τth conditional quantiles of Y
i
given X
i
in the interval (0,1). The estimates are obtained by minimizing
Table 3 presents summary statistics of the variables used in the empirical model and Table 4 presents the difference in each explanatory variable for certified and uncertified households.
Table 3. Definitions and Summary Statistics of the Variables over Time
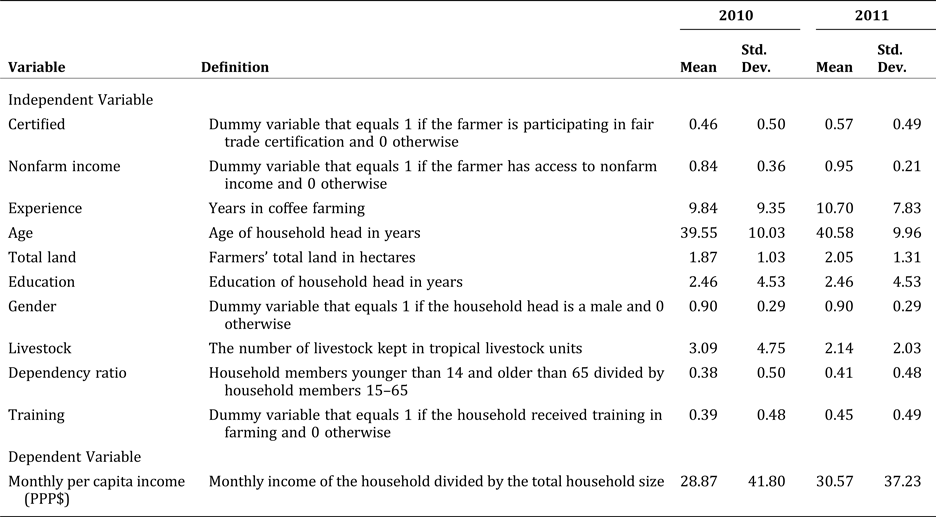
Table 4. Difference between the Explanatory Variables for Certified and Uncertified Households
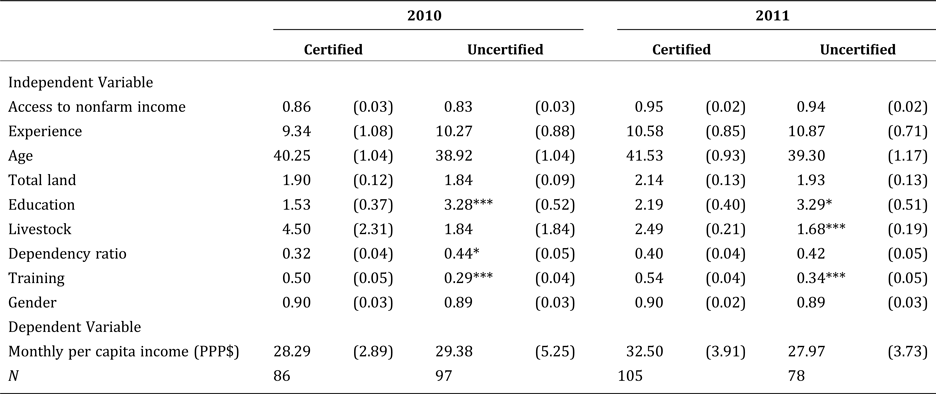
Note: The test of difference uses the t-test. Standard errors are shown in parentheses, and statistical significance is denoted by *** at the 1 percent level and * at the 10 percent level.
Results and Discussion
Adoption of Fair Trade Certification
Table 5 presents the results of the pooled probit model analyzing the determinants of participation in fair trade certification. The Wald chi-square test statistic (22.09) indicates that the explanatory variables are jointly statistically significant (p < 0.1). Farmers who receive training in farming are more likely to participate in fair trade certification than farmers who do not, a result that underlines the importance of training in promoting fair trade participation found by Wollni and Zeller (Reference Wollni and Zeller2007). Contrary to Parvathi and Waibel (Reference Parvathi and Waibel2015), we find that the coefficient of the livestock variable is statistically significant and positive, indicating that asset ownership has a positive and significant influence on fair trade participation, perhaps because livestock provides for diversification of the risk associated with adopting fair trade by providing cash or allowing coffee-growers to secure credit.
Table 5. Results of the Probit Model for Participation in Fair Trade Certification
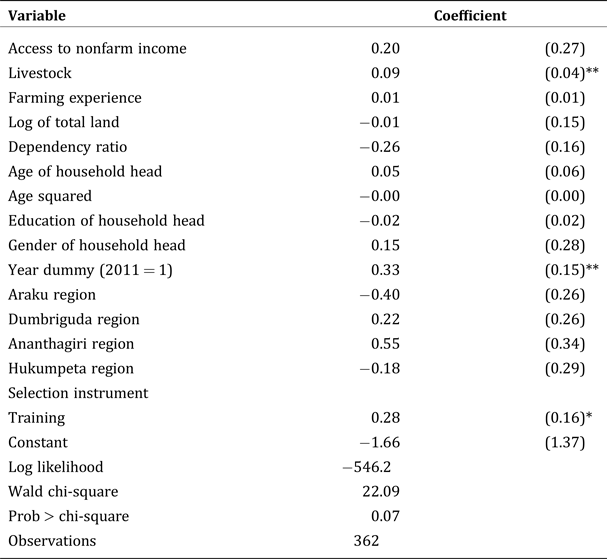
Note: Standard errors are shown in parentheses. Statistical significance is denoted by ** at the 5 percent level and * at the 10 percent level.
The probability of participation in fair trade certification increased significantly between 2010 and 2011, as indicated by the significant and positive coefficient of the year dummy variable. The amount of land, years of farming experience, access to nonfarm income, age and level of education of the household head, the household's dependency ratio, and the regional location variables do not significantly affect participation in fair trade certification.
Impacts of Certification on Income
The sampled households derived income from farm and nonfarm activities. Farm income consisted of sales of coffee and other crops (paddy, black pepper, and vegetables). Table 6 reports incomes for certified and uncertified farmers in 2010 and 2011 by type—crop, coffee, and nonfarm—expressed in purchasing power parity.
Table 6. Sources of Household Income

Note: The test of difference uses the t-test. Standard deviations are shown in parentheses. Statistical significance is denoted by ** at the 5 percent level and * at the 10 percent level.
In 2010, much of the income of certified and uncertified farmers came from nonfarm activities as 84 percent of the sampled farmers reported access to nonfarm earnings (Table 3). Certified farmers had significantly higher coffee incomes and produced and sold more coffee than uncertified farmers in 2010 and 2011 (see Tables 6 and 7). Their greater coffee production relates to larger areas of land (0.94 hectares versus 0.85 hectares for uncertified farmers) allocated to coffee and greater productivity from the same amount of land. Higher coffee productivity for certified farmers is also associated with efficient farming and the technical skills obtained from the cooperative. Their greater incomes from coffee can also be explained by higher prices received at the farm gate from private merchants (see Table 7).
Table 7. Coffee Sold and Prices Received by Certified and Uncertified Farmers
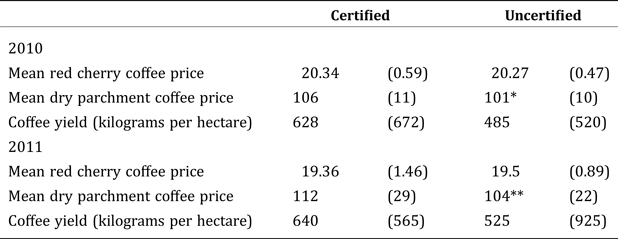
Note: The test of difference uses the t-test. Standard deviations are shown in parentheses. The statistical significance is denoted by ** at the 5 percent level and * at the 10 percent level.
Table 7 presents model estimates of yields and mean prices received by certified and uncertified producers in 2010 and 2011 for coffee cherries (unprocessed fruit consisting of the bean, parchment hull, pulp, and skin) and dry parchment coffee (skin and pulp removed). There is no significant difference in the mean price received by certified and uncertified farmers for coffee cherries in 2010. For dry parchment coffee, however, uncertified farmers, on average, received a 5 percent lower price than certified farmers. This difference can be explained by limited bargaining power. Since uncertified farmers have less possibilities of selling their coffee to the cooperative, they must mostly sell their dry parchment coffee to private merchants.
The mean prices for dry parchment coffee received by certified and uncertified farmers differed significantly in 2011 and were higher than the 2010 prices by about 6 percent for certified farmers and 3 percent for uncertified farmers. The price of red coffee cherries declined in 2011 by about 4.8 percent for certified farmers and 3.8 percent for uncertified farmers. The cooperative determines the price paid to the farmers based on the market price for coffee, which fluctuates, and the decline in the price in 2011 may primarily reflect market conditions.
In 2011, the mean total annual income for certified farmers rose (to PPP$ 1,600) while annual income for uncertified farmers declined slightly (to PPP$ 1,229). Coffee was the major source of income for certified and uncertified farmers, increasing in 2010 by 32 percent and 20 percent, respectively (see Table 6). The increases clearly derived from greater quantities of coffee sold and higher prices received from private merchants. Certified farmers again had significantly higher coffee incomes than uncertified farmers but also earned slightly more from crops while uncertified farmers earned less from crops in 2011.
The results show that nonfarm income decreased by about 26 percent for certified and uncertified farmers in 2011 despite an 11 percent increase in households' access to nonfarm income over time (Table 3). This result explains why farmers were highly motivated to grow coffee and relatively unmotivated to take on off-farm employment.
To examine the dynamic effects of fair trade certification further, we performed a descriptive analysis of the nineteen households that became certified during the study period (between 2010 and 2011). We assumed that these households had randomly selected to be certified based on unobservable characteristics but could not extend the econometric analysis due to the small sample size. Table 8 presents socio-economic characteristics calculated for those households for 2010 and 2011. We find that the mean income from coffee more than doubled after certification due to greater production and a higher mean price for coffee sold. Production increased by almost threefold in 2011 due to productivity more than doubling and greater allocations of land to coffee production, which signal the households' interest in coffee production. Greater use of inputs, training, and better management practices also contributed to higher coffee production. Furthermore, prices received for dry parchment coffee rose about 18 percent while income from crops and nonfarm activities decreased.
Table 8. Socio-economic Characteristics of the Nineteen Households that Transitioned to Certified Production during the Study Period
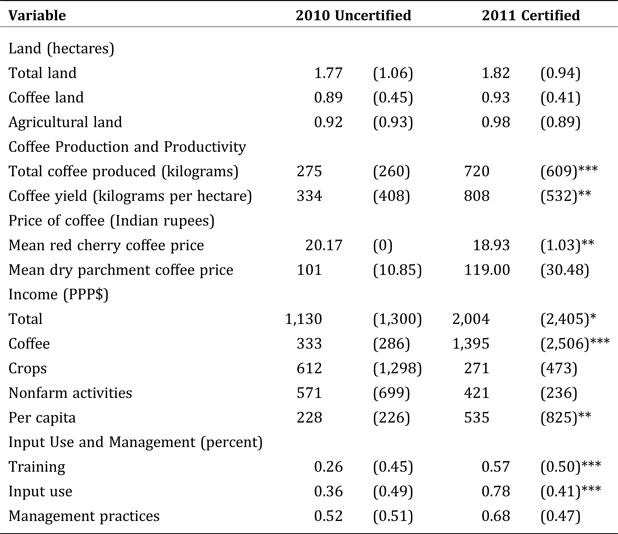
Note: Standard deviations are shown in parentheses. Statistical significance is denoted by *** at the 1 percent level, ** at the 5 percent level, and * at the 10 percent. The test of difference uses the Wilcoxon sign rank test and McNemar's test.
Table 9 presents the results of the endogenous switching regression model. The first column presents the income function for certified households and the second column presents the function for uncertified households. The results of the likelihood ratio test for joint dependence of the selection and outcome equations are not significant and thus validate use of the switching probit model as opposed to the bivariate probit model. The difference in the coefficients from the income equations for certified and uncertified households illustrates the presence of heterogeneity in the sample. The negative signs on ρ1 and ρ0 indicate that households that were less likely to participate in fair trade certification were more likely to have relatively low incomes due to unobservable household characteristics.
Table 9. Second-stage Determinants of Income
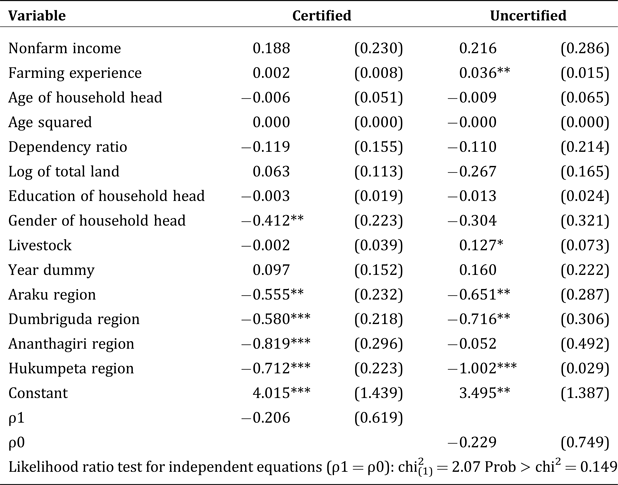
Note: Standard errors are shown in parentheses. The statistical significance is denoted by *** at the 1 percent level, ** at the 5 percent level, and * at the 10 percent level.
Years of farming had a positive effect on the household income of uncertified farmers. The number of livestock kept also positively influenced household income for uncertified farmers. For certified farmers, female-headed households had higher incomes than male-headed households. The three regional location variables were negatively correlated with income for certified and uncertified farmers.
Table 10 summarizes the results of simulated impacts of fair trade certification on income using the predicted mean incomes from the endogenous switching regression. The values for A and B along the diagonal represent the expected mean values for the log of monthly per capita income from the actual conditions: 3.07 and 2.72 for certified and uncertified farmers respectively. Comparing those results would be misleading; one might conclude that, on average, certified households earned about 11 percent more income than uncertified households. The final column presents the treatment effect of certification on income. A positive mean difference of C from A indicates that the certified households gained from being certified; statistically, their mean household income was 17 percent higher than it would have been if they had not been certified (the counterfactual). A similar conclusion is drawn from the positive mean difference of B from D; uncertified households would have earned higher incomes if they had been certified. The net impact of certification when the two results are combined is a positive income effect.
Table 10. Mean Treatment Effect from Fair Trade Certification

Note: Standard errors are shown in parentheses. Statistical significance at the 1 percent level is denoted by ***.
The results of the quantile regression are presented in Table 11. Participation in fair-trade certification has a statistically significant impact on income for the 25th, 50th, and 75th quantiles; the coefficients indicate that income increased by 32 percent in the 25th quantile, 27 percent in the 50th quantile, and 25 percent in the 75th quantile. These results demonstrate that participation in fair trade certification has the largest positive impact on the lower income quantile. Thus, fair trade certification benefits relatively poor farmers more than relatively rich farmers.
Table 11. Results of the Quantile Regression

Note: Standard errors are shown in parentheses. The statistical significance is denoted by *** at the 1 percent level, ** at the 5 percent level, and * at the 10 percent level.
Other Benefits from Certification
We found that many of the certified coffee-growers did not understand fair trade certification. When asked what certification meant to them, only 15 of the 86 certified participants in 2010 (17 percent) reported knowing about certification. In 2011, the number was somewhat higher but still quite low: 32 of the 105 households producing certified coffee (30 percent). This limited understanding may be related to a lack of education since the average number of years of schooling of farmers was 2.5, and the cooperative also might not have explained certification or disseminated information about it to the farmers.
We further asked coffee-growers to rank three major advantages of certification. Bonuses received, lack of marketing problems, and higher prices were reported most often. Of the 86 households in 2010, 19 reported bonuses, 9 reported no marketing problems, and 2 reported higher prices. Considerable progress had occurred by 2011, when 100 of the 105 participants reported bonuses and no marketing problems and 85 reported higher prices. When the cooperative makes a profit, the coffee-growers receive bonus payments that are based on the quantity of coffee they sold. An interview of a key informant and informal discussions with the growers suggested that the 2011 bonus amounted to four Indian rupees per kilogram of coffee.
One of the purported benefits of fair trade certification is a social premium for the community, such as support for the local school. The survey therefore asked the coffee-growers to report any such benefits to the community or their households from participation in certification. Some social benefits were reported by 19 households (23 percent) in 2010 and 39 households (37 percent) in 2011. Households acknowledged three types of community benefits in 2010 and 2011 (provision of school uniforms, life insurance, and vermi compost tanks) and a fourth (pumping machines) in 2011 (see Table 12). In both years, the trend of receiving a social benefit remained the same; 48 percent of the households received school uniforms (provided to girls), and receiving school uniforms ranked first in both years, followed by life insurance, which was received by 32 percent of households in 2010 and 28 percent of households in 2011. In 2010, 20 percent of the farmers benefitted from vermi compost tanks; that figure dropped to 18 percent in 2011. In 2011, 6 percent of the certified farmers reported receiving pumping machines.
Table 12. Percent of Certified Farmers Reporting a Social Benefit from Certification

Summary and Conclusion
By analyzing the impact of fair trade certification on small-scale coffee producers in India, this study contributes to filling a gap in the literature on the welfare impacts of coffee certification. The study uses a balanced panel data set collected by surveys in 2010 and 2011 of 183 households. In 2010, 86 of those households (47 percent) produced fair-trade certified coffee. In 2011, 19 of the previously uncertified households had moved to certified production.
The descriptive statistics show that, on average, certified farmers sold a larger quantity of coffee and received a significantly higher mean price than uncertified farmers for dry parchment coffee in 2010 and 2011. Similarly, the certified farmers had a significantly greater average income from coffee and greater total income (PPP$ 182) than uncertified farmers. Households that became certified between the 2010 and 2011 surveys increased both production and productivity and received higher prices for their coffee.
Our analysis of determinants of adoption of certification shows that ownership of livestock and opportunities for training were the most influential. The results from the endogenous switching regression that accounted for endogeneity and selection bias revealed that certification is significant in increasing households' monthly per capita income. There was a gain of 17 percent in income from opting to be certified compared to a counterfactual scenario in which certification did not occur. The results of the quantile regression provide additional evidence that certification has had a positive impact on the incomes of coffee farmers in the 25th, 50th, and 75th quantiles of the income distribution.
We further explored farmers' knowledge of fair trade certification and its potential benefits. Few of the participating farmers understood what certification meant—just 17 percent in 2010 and a somewhat larger 30 percent in 2011—but did report social benefits conferred by the program.
The results of our study establish that fair trade certification of coffee in India has played a positive role in improving the incomes of participating farmers. The benefits emanate mostly from providing coffee-growers with access to the certification program's marketing channel. The cooperative can negotiate a higher price than the farmers can obtain individually, and the fair trade network, by collecting the villagers' coffee, eliminates the cost of long-distance transportation for individual growers. Another key benefit is the cooperative's provision of credit at the beginning of the planting season. This is a crucial support. Numerous studies of coffee growers have demonstrated that lack of access to credit prohibits many of the farmers from making investments needed to improve their productivity (Jena et al. Reference Jena, Chichaibelu, Stellmacher and Grote2012). Communities also benefit from fair trade certification because the programs often provide social premiums such as support for schools and for farmers in general.
The positive synergy that fair trade certification has created in the study region points to the value of further strengthening this initiative through collaborative efforts by the cooperative and the local government. However, a caveat applies when generalizing fair trade's potential to improve livelihoods. The positive gains identified in this study may be associated with limited diversity of resources and assets among these tribal farmers. The cooperative would thus be able to generate gains in income by guiding the farmers into an organized market network. Sustaining those gains over the long term is a daunting task given the limited education of the farmers. Therefore, the cooperative likely will have to move from an external welfare program to an inclusive, structured farmers' association that can periodically address specific problems confronting the farmers and provide timely solutions.
APPENDIX
Appendix 1: Factors influencing adoption/participation in certification

Appendix 2: Test on validity of selection instrument


