

Group discussion is ubiquitous in American civic life. Americans meet to deliberate and reach collective decisions in a variety of settings, including juries, town meetings, local committees, civic forums, and voluntary associations. Approximately a quarter of Americans report attending a political meeting on local, town, or school affairs in the past year (Smith Reference Smith2013).
These institutions are not only prevalent; they are also supposed to embody core democratic ideals (Collins Reference Collins2021). Equal standing in the deliberation within these groups is one such ideal (Gutmann and Thompson Reference Gutmann and Thompson1996; Mansbridge Reference Mansbridge1983), long identified as a keystone of the American civic tradition (Tocqueville [1835–40] Reference Tocqueville1969).
However, in practice, group discussion may not always be characterized by equal standing. Social identities with less authority in society may also have less authority in discussions of public affairs (Beauvais Reference Beauvais, Bächtiger, Dryzek, Mansbridge and Warren2018; Sanders Reference Sanders1997; Young Reference Young2000). Race is a key dimension of social inequality in the United States. In fact, by some accounts, it is the single deepest cleavage in society and politics (Hutchings and Valentino Reference Hutchings and Valentino2004). It may thus pose significant barriers to equal standing in deliberation. For one, people of color (POC) tend to be numerically underrepresented when citizens come together to discuss matters of common concern (Nuamah and Ogorzalek Reference Nuamah and Ogorzalek2021; Sahn Reference Sahn2024; Schaffner, Rhodes, and Raja Reference Schaffner, Rhodes and La Raja2020). Furthermore, even if they are numerically represented, their mere presence may not suffice to guarantee deliberative equality (Einstein, Glick, and Palmer Reference Einstein, Glick and Palmer2019).
According to contemporary philosophers of democracy, equality in deliberation consists of at least two features. One is equal voice. Deliberation must facilitate the expression of diverse perspectives and interests. Social disadvantage should not create discursive disadvantage (Fraser Reference Fraser and Calhoun1992; Sanders Reference Sanders1997; Young Reference Young2000). People should feel free to speak their minds and to participate actively, regardless of their status in society. Another requirement is “deliberative uptake” (Bohman Reference Bohman1996; Scudder Reference Scudder2020). In the back-and-forth of deliberative exchange, the voices of all group members should be “actually heard and ultimately considered,” regardless of social status (Scudder Reference Scudder2020, 21). Voice and uptake matter because they are connected to authority: the expectation of influence. To achieve equal substantive representation in the decision, disadvantaged groups must have robust “authoritative representation”—discursive actions that shape “the expectation that a person, or group, can exercise power and influence others” (Mendelberg, Karpowitz, and Oliphant Reference Mendelberg, Karpowitz and Oliphant2014, 35). If a situation deters people of color from expressing their views, or prevents them from receiving a hearing, then being “in the room where it happens” may not suffice for equal representation.
A central question, then, is whether people of color have equal voice and whether their perspectives are equally considered during group discussion. However, the answer is unclear. While scholars have demonstrated a race gap in influence over group decisions (Karpowitz et al. Reference Karpowitz, Mendelberg, Elder and Ribar2023; Nuamah and Ogorzalek Reference Nuamah and Ogorzalek2021; Schaffner, Rhodes, and Raja Reference Schaffner, Rhodes and La Raja2020), we know little about the discursive process that allocates power differently by race.
Here, we address this question with novel data from small groups of citizens discussing how much corporations should be punished when they harm ordinary citizens. These groups are modeled on the civil jury setting, an important site of public decision making that often has political dimensions. Juries frequently consider damages against corporations that have violated rights or harmed vulnerable communities (Hans, Gastil, and Feller Reference Hans, Gastil and Feller2014). In this sense, in civil juries, marginalized groups have the potential to hold powerful actors accountable for actions that disproportionately harm them (Gifford and Jones Reference Gifford and Jones2016; Kahan et al. Reference Kahan, Braman, Gastil, Slovic and Mertz2007; Unnever, Benson, and Cullen Reference Unnever, Benson and Cullen2008).
We analyze data from 407 six-member groups, as well as a subset of 147 groups with more granular information available. Because individuals were randomly assigned to a group, the design eliminates selection confounds present in observational studies of racial diversity. While it is impossible to randomly assign individuals to race, researchers randomly assigned individuals to groups.Footnote 1 Thus, participants were unable to select into a group, the racial composition of the groups varied exogenously, and the effect of racial composition is causally identified. In addition, the large sample affords statistical power to detect differences by race. A final key advantage of the dataset is that it allows us to link transcripts of individuals’ speech with their private predeliberation preferences. This allows us to measure how often white participants and participants of color articulate their own preference—a vital measure of voice—and how often others mention those preferences—a key measure of uptake. In sum, this dataset can reveal racial differences in who speaks their own mind and how much others listen to them, a goal until now impossible due to the dearth of data on individual speech and preferences.
We do not claim that this sample generalizes to what actual juries do. In fact, our aim is not to study juries specifically. Rather, we use these data to understand race and authority in decision-making groups more generally. These data offer two important advantages over existing research. First, they yield rich and precise measures of voice and uptake unavailable in existing data we know of. Studies of juries, local meetings, and civic organizations have not linked the text of the discussion to individual prediscussion preferences. Without such data it is not possible to know who speaks their mind and how successful they are. Second, the requirement of unanimity in these groups may promote norms of listening to different perspectives, impartiality, and the quest for justice (Cramer Walsh Reference Cramer Walsh2007; Karpowitz and Mendelberg Reference Karpowitz and Mendelberg2014). If we uncover a racial gap here, where conditions are more favorable, then it is likely more severe in other situations.
We find that people of color are systematically disadvantaged during group deliberation. White individuals speak longer, mention their own preferences more often, and are more likely to speak at pivotal times. Though this design cannot isolate the causal effect of individual race, these patterns persist when controlling for other features of the individual and of deliberation, including education and income. We lack statistical power to separate people of color into their constituent ethnoracial groups, but results are similar when examining Hispanic Americans, who are the plurality in our sample.
We explore two mechanisms for racial gaps in voice: preferences and numerical representation. We find that the race gap in voice is not explained by preferences: while white and POC members tend to hold somewhat different preferences, the race gap remains when we control for preferences. However, preferences do matter for the race gap in uptake; members who disagree with their group receive more uptake if they are white.
The second mechanism we test, numerical representation, also has null effects: the race gap in voice persists even when the focal member is not the only person of color in the group. Moving from one to two POC members in a group of six does not mitigate the race gap in participation. Future work should investigate whether groups with equal or majority POC membership produce different outcomes. Even without such data, the results are informative, because they capture the typical range of racial composition in real groups in a white-majority country.
Finally, we find that these race gaps matter substantively, in that race shapes what people say. People of color are more likely to invoke words describing harms inflicted by corporations on plaintiffs and to make references to fairness. If they have less voice and uptake, this may mean less substantive representation of disadvantaged perspectives.
Though these data were gathered before the Black Lives Matter movement altered norms about race, there is reason to think these patterns are similar today, as we elaborate below. For example, a recent study of racial dynamics in interviews found that Black survey respondents are more likely to self-silence when speaking with a white interviewer than is the case with whites speaking with an interviewer of color, and this race gap is no weaker in more recent years (Wamble et al. Reference Wamble, Laird, McConnaughy and White2022).
These results make three contributions to the question of equal representation in politics and public affairs. First, they reveal substantial inequalities of authoritative representation by race. Race shapes unequal power not only by determining who is in the room and what they decide, but also by influencing who speaks their mind, and whose preferences shape other deliberators’ speech. These racial inequalities in deliberation may help to explain the severe racial inequities in representation in government, well documented in existing scholarship (Collins Reference Collins2021; Einstein, Glick, and Palmer Reference Einstein, Glick and Palmer2019; Karpowitz et al. Reference Karpowitz, Mendelberg, Elder and Ribar2023; Nuamah and Ogorzalek Reference Nuamah and Ogorzalek2021). That research has not been able to test the mechanism for lack of data on the discussion itself. Our findings suggest that even when people of color have access to government decision making, they may be stymied by barriers to voice and influence. Second, the evidence rules out the most obvious mechanism; the race gap in voice persists when we account for preferences. Third, the findings disconfirm a simple model of representation: these gaps persist even when people of color are not alone in a group. When it comes to race, a variety of civic and political spaces—town meetings, juries, local committees, and voluntary associations—may fail to meet democratic standards of equal standing in debates about fairness, harm, and responsibility, even under circumstances favorable to deliberation.
Equality of Voice and Authority
Ideals of equality and inclusion stand at the heart of theories of deliberative democracy (Bohman Reference Bohman1996; Habermas Reference Habermas and Rehg1996; Young Reference Young2000). As Mansbridge and colleagues (Reference Mansbridge, Bohman, Chambers, Christiano, Fung, Parkinson, Thompson, Warren, Parkinson and Mansbridge2012, 12) argue, the extent to which “multiple and plural voices, interests, concerns, and claims” are included in group decision making is “the central element of what makes deliberative democratic processes democratic” (emphasis added). An inclusive deliberation is one in which status inequalities, such as “the discriminatory effects of class, race, and gender inequalities” (Gutmann and Thompson Reference Gutmann and Thompson2004, 50), are minimized. As Cohen (Reference Cohen, Bohman and Rehg1997, 74) writes, in the deliberative ideal, “the existing distribution of power and resources does not … play an authoritative role in their deliberation” (emphasis added).
Critics of deliberative theory have argued that in practice, actual discussion falls short of this ideal. Discussion may mirror or even magnify existing authority structures (Fraser Reference Fraser and Calhoun1992; Young Reference Young2000). Social status affects the value accorded to the perspectives and the modes of expression of members of a social identity (Sanders Reference Sanders1997; Young Reference Young2000). Status differences may thus stymie the quest for deliberative inclusion.
Empirical evidence lends some support to this critical perspective, especially when the group’s structure enhances the disadvantages of social status. Lower-status group members tend to exercise less voice and are often afforded less authority (Ridgeway and Nakagawa Reference Ridgeway and Nakagawa2017). This marginalization takes many forms. Lower-status group members tend to speak less (Carli Reference Carli1989; Dubrovsky, Kiesler, and Sethna Reference Dubrovsky, Kiesler and Sethna1991; Karpowitz, Mendelberg, and Shaker Reference Karpowitz, Mendelberg and Shaker2012); they receive more negative interruptions and discursive microaggressions, and fewer discursive signals of social rapport (Dovidio et al. Reference Dovidio, Brown, Heltman, Ellyson and Keating1988; Johnson Reference Johnson1994; Mendelberg, Karpowitz, and Oliphant Reference Mendelberg, Karpowitz and Oliphant2014; Ng, Brooke, and Dunne Reference Ng, Brooke and Dunne1995); their perceived authority in the eyes of other group members is lower (Dovidio et al. Reference Dovidio, Brown, Heltman, Ellyson and Keating1988; Dubrovsky, Kiesler, and Sethna Reference Dubrovsky, Kiesler and Sethna1991; Karpowitz, Mendelberg, and Shaker Reference Karpowitz, Mendelberg and Shaker2012); their distinctive priorities and preferences are less likely to be taken up during discussion (Mendelberg, Karpowitz, and Goedert Reference Mendelberg, Karpowitz and Goedert2014; Ridgeway and Smith-Lovin Reference Ridgeway and Smith-Lovin1999); and they are less likely to influence other members’ preferences and the group’s decision (Karpowitz and Mendelberg Reference Karpowitz and Mendelberg2014; York and Cornwell Reference York and Cornwell2006). All these measures of voice, uptake, authority, and influence tend to move in concert, and all rise and fall with status in the deliberating group. In these ways, authoritative representation is constructed in the deliberation itself.
Racial Inequalities in Discussion Are Understudied
Previous political science research on deliberation is useful in documenting patterns of inequality in discussion and in demonstrating how social status inhibits authoritative representation. But it is almost entirely based on social categories other than race. Whether race is subject to these dynamics remains unknown. This is a significant omission. In a society fundamentally shaped by racial inequalities, a wide array of issues directly or indirectly implicate the distribution of life chances by race (Hutchings and Valentino Reference Hutchings and Valentino2004). Notably for our study, the race gap in business ownership and wealth is substantial (Herring and Henderson Reference Herring and Henderson2016), and this inequality shapes views of corporate power and malfeasance. In fact, race predicts support for addressing corporate harm better than income (Unnever, Benson, and Cullen Reference Unnever, Benson and Cullen2008). Thus, we aim to explore patterns of racial inequality in voice and authority.
To be sure, there is extensive prior work on race in group deliberations, especially in the literature on juries. However, according to a thorough recent review, despite the voluminous research on juror race, “considerably less research has focused on interacting juries” and what white and POC jurors actually say (Devine et al. Reference Devine, Clayton, Dunford, Seying and Pryce2001, 673). Few studies can reliably measure racial inequalities in participation: most lack sufficient numbers of POC participants and measures of voice, uptake, and preferences.
In addition, causally identified studies of jury racial composition are surprisingly rare, even in mock-jury settings where randomization is feasible. As one review noted, “[J]ury demographic composition has rarely been manipulated” (Devine et al. Reference Devine, Krouse, Cavanaugh and Basora2016, 679), restricting researchers’ ability to draw causal conclusions about the effects of racial diversity. The largest recent study of POC jurors we know of concluded, “[W]e … were limited in how we could draw inferences about the jury group composition, since we did not systematically vary it as an experimental condition” (Shaw et al. Reference Shaw, Lynch, Laguna and Frenda2021, 225). Very few studies have randomized or manipulated the group’s racial composition, and those that did so often lack statistical power or do not specifically examine voice and deliberative uptake (Karpowitz et al. Reference Karpowitz, Mendelberg, Elder and Ribar2023; Peter-Hagene Reference Peter-Hagene2019; Sommers Reference Sommers2006).Footnote 2
For our purposes, the most relevant prior research was conducted by Sommers (Reference Sommers2006), who varied jury composition between all-white six-person juries and juries with four white and two Black jurors.Footnote 3 The racially diverse juries deliberated more carefully, and their white jurors were more likely than those on all-white juries to believe in the innocence of the defendant. This suggests that jurors of color do exercise influence.Footnote 4 However, this study did not measure POC jurors’ voice and influence during the discussion (such as the racial balance of speakers, POC jurors’ power of agenda setting, how often POC jurors articulated their predeliberation preferences, or how much those preferences were taken up by others).Footnote 5
Beyond the mock-jury literature, studies of real juries are also limited in their ability to study deliberation itself.Footnote 6 Observational studies typically survey participants after the fact and ask about their perception or memory (Pennington and Dolliver Reference Pennington and Dolliver2021; Winter and Clair Reference Winter and Clair2018), or they survey third-party views (Clair and Winter Reference Clair and Winter2016; Ellis and Diamond Reference Ellis and Diamond2003). These research designs yield important insights, but they cannot rule out the potential biases from the typically high rates of missing data on cases and jurors, and from selective recall.Footnote 7
Studies of real juries are hampered in other ways as well. These studies by definition have no control over jury composition. Through peremptory challenges, people of color are often struck from jury service in precisely the cases where lawyers expect their presence may change the outcome (Eisenberg Reference Eisenberg2017; Fukurai and Krooth Reference Fukurai and Krooth2003). The consequence of this biased selection process is that the resulting jury composition is likely correlated with important aspects of the case, including the relevance of race to the case. Devine and colleagues (Reference Devine, Krouse, Cavanaugh and Basora2016), who have conducted some of the most extensive studies of racial composition on real juries, emphasize the difficulty posed by the high correlation between group racial composition and other features of cases. They conclude by noting “the nonexperimental nature of this study precludes any strong inferences … [and] statistical power was relatively low because of the loss of cases from missing data” (Reference Devine, Krouse, Cavanaugh and Basora2016, 679). In summary, few studies measure actual voice or how a jury’s demographic composition affects it.
Our contribution, then, is to assess racial inequalities in authoritative representation by directly examining patterns of voice and uptake during discussion. There is good reason to expect racial inequalities in voice and authority. For example, Einstein, Glick, and Palmer (Reference Einstein, Glick and Palmer2019) document substantial racial disparities in public comments at planning and zoning board meetings in Massachusetts. In the cities they studied, whites comprised 80% of the adult population but 95% of the commenters who spoke up by offering testimony at the meeting. Substantial racial disparities of voice persisted even in more diverse localities, and were accompanied by other markers of status inequalities, such as home ownership. Further, the underrepresentation of people of color among those who attend is consistent with their underrepresentation in the actions of local government; the preferences of people of color are less represented in the outcomes of local political institutions (Schaffner, Rhodes, and Raja Reference Schaffner, Rhodes and La Raja2020).
What this literature has not yet revealed is how race shapes the process of discussion and its content. The rate at which those in the room speak, articulate their own thoughts, and receive uptake remains unknown. We argue that race is likely to affect specific facets of voice and uptake that together produce authoritative representation. Race is a set of identity markers carrying strong signals of social status (Lerman and Weaver Reference Lerman and Weaver2014). The nation’s fraught history of racial inequality may construct the speech of people of color as less authoritative, with implications for their willingness to exercise voice and their ability to achieve influence and authority within the group.
Voice, Uptake, and Authoritative Representation
We begin with the act of speaking. People of color may engage in self-silencing in mixed-race conversations. They may mute the expression of their preferences, or express views other than their own, especially when they have reason to believe that their preferences may diverge from those of whites. Consistent with this possibility, Black survey respondents are more likely to mirror average white opinion when interviewed in person by white interviewers (White and Laird Reference White and Laird2020). Davis (Reference Davis1997, 309) attributes dynamics like these to the accumulated experience of day-to-day life in a society marked by racial stratification, which leads some people of color to “conceal their true political beliefs and place self-imposed limits on their freedom of expression” in conversation with whites.
Self-silencing has profound consequences for deliberators’ ability to exercise influence and generate authoritative representation. The more a group member speaks, the greater their chance to express their view and influence the deliberation. People who speak more are also perceived as more influential by other group members (Dubrovsky, Kiesler, and Sethna Reference Dubrovsky, Kiesler and Sethna1991; Karpowitz, Mendelberg, and Shaker Reference Karpowitz, Mendelberg and Shaker2012; Shelly et al. Reference Shelly, Troyer, Munroe and Burger1999). Accordingly, how much a person speaks is an important form of authority.
To be sure, not all words are substantive contributions to deliberation. A person who speaks but does not engage with the decision-making task may not have exercised meaningful voice. An additional measure of voice, then, is how often a person discusses the choices before the group. This includes their own preference, and any preferences articulated during discussion. Expressing one’s own preference for the outcome, though, is an especially important measure of voice. A perspective cannot move the group if it is never voiced in the first place. And the more a particular view is voiced, the more persuasive it is likely to be, and the more likely the group’s decision is to reflect that view (Karpowitz and Mendelberg Reference Karpowitz and Mendelberg2014; Kathlene Reference Kathlene1994).
Beyond direct preferences about the group’s decision, voice may also involve other elements of speech that express a speaker’s point of view and frame the group’s decision. For example, a participant may offer distinct perspectives, ideas, interests, claims, and considerations. The words deliberators choose to speak represent the values, criteria, and arguments the speaker believes are important to the group’s decision-making task. Young (Reference Young2000) argues that identity shapes these words, frames, and modes of communication, and that speaking them is a form of empowerment for marginalized identities. By articulating their perspectives and interests, people of color may lead others to understand “what takes place in different social locations and how social processes appear to connect and conflict from different points of view” (2000, 118). For this reason, we also explore the extent to which white and POC group members use different words or take up different topics when they speak.
Just as not all kinds of speech matter equally, speech does not matter equally at all points in a deliberation. A group member who speaks at the very beginning of a discussion has a chance to set the agenda; they can raise ideas or frame the question under discussion in ways that shape the rest of the deliberation (Dubrovsky, Kiesler, and Sethna Reference Dubrovsky, Kiesler and Sethna1991; Mendelberg, Karpowitz, and Goedert Reference Mendelberg, Karpowitz and Goedert2014). At the other end of the deliberation, the final few moments of a discussion may be critical. The considerations that are on the table at the point of collective decision making may carry more weight. Making one’s voice heard when a final decision is being reached is thus another potential form of voice.
Authoritative representation is not merely a function of the individual group member, however. How other deliberators engage the preferences of their peers also matters. As we noted, deliberative “uptake” occurs when the group engages and fairly considers the preferences of all group members (Sanders Reference Sanders1997; Scudder Reference Scudder2020). Discussion in which a POC deliberator’s preference is mentioned less often than a white member’s preference would constitute evidence of a potential loss of uptake.
The source of these disparities in group uptake also matters. Are they the result of white deliberators mentioning their own preferences more often? That would point to voice as the crucial conduit of authority. Or are they instead driven by a failure of members to consider POC and white preferences equally? That implies uptake is the key channel of authority. As we noted, there is evidence for this mechanism, and the mock-jury literature reinforces this notion. For example, a Black confederate was perceived as more emotional than a white confederate expressing the same angry message (Salerno, Peter-Hagene, and Jay Reference Salerno, Peter-Hagene and Alexander2019)
A final source of uptake disparity resides in the formal leadership of the group. In addition to exercising authority directly, formal leaders, such as chairs, moderators, or forepersons, may increase a member’s authority by devoting more of their speech to that member’s preference (Johnson Reference Johnson1994). Our final test, then, considers whether the group’s foreperson gives equal consideration to all preferences regardless of speaker race. If uptake disparity in the discussion is linked to foreperson uptake, this suggests formal leadership as a pathway to equal authoritative representation.
A Potential Mitigator of Racial Inequality in Discussion
Because authoritative representation is constructed during discussion and decision making, it hinges on the specific discursive practices within the group. Effective deliberative contexts could ameliorate unequal authoritative representation by signaling the equal status of all group members, inviting their full participation, and promoting the need to consider all perspectives (Cramer Walsh Reference Cramer Walsh2007). Important features of the group may exacerbate or mitigate discursive inequality and members’ ability to achieve authoritative representation.
The literature on unequal representation has pointed to group composition as one such feature. Some studies of race and representation suggest that the numerical underrepresentation of people of color may lead to substantive underrepresentation (Preuhs Reference Preuhs2006), perhaps because being in the numerical minority shapes a group’s status. Identity minorities may therefore be more hesitant to speak up or to divulge their authentic preferences when they find themselves in the group’s numerical minority. In studies of gender inequality, for example, this pattern is more prevalent in groups with few women (Karpowitz and Mendelberg Reference Karpowitz and Mendelberg2014). Likewise, voice could also be affected by a group’s racial composition.
Group composition may also affect how other deliberators respond to the perspectives of people of color. For example, according to Cramer Walsh (Reference Cramer Walsh2007), in race dialogue groups, whites are more open to Black viewpoints when their group includes a large number of Black group members, and racial minorities tend to speak more and express a distinctive point of view more frequently in such contexts. In other words, larger numbers of disadvantaged group members may facilitate both their willingness to speak up and the tendency of other group members to consider their perspectives fully and fairly. Conversely, discursive patterns can decrease the status and authority of low-status minority groups in the deliberation even further.
Hypotheses
Our theory of inequality in authoritative representation suggests several testable hypotheses. Our main expectation is that white members will exercise more voice and will receive more uptake than people of color. This inequality of authority could be evident in two ways. First, it may be seen in the extent to which whites and people of color speak, speak early and late, talk about the choices the group could make, and express their own preferences. Second, racial inequality may show up in uptake: the preferences of white members may occupy more of the group’s discussion, by occupying more of the discussion of fellow members or the formal leader.
We offer two additional hypotheses about factors that could shrink this racial gap. First, if the preferences of people of color diverge from those of whites, this may explain why their preferences receive less uptake. We test whether the racial gap diminishes when preferences are shared across lines of race. If the gap remains even in the face of controls for preferences, then that would be evidence of distinctly racial disparities. Second, racial gaps may be mitigated when more people of color are included in the group (Cramer Walsh Reference Cramer Walsh2007). We examine whether racially diverse groups empower POC members, leading to greater voice and uptake.
Our null hypothesis is that the race gap does not exist in any of these measures. In a setting such as ours, with unanimous rule and an emphasis on full and fair deliberation, the demand to consider all perspectives may empower each member to speak and allow them to be heard. This individual empowerment may create racial equality. Previous work has shown that unanimity can indeed mute status inequalities in groups where low-status individuals form the numerical minority (Karpowitz and Mendelberg Reference Karpowitz and Mendelberg2014). Thus, in this ideal setting, people of color may feel free to exercise voice and their fellow members may give their speech equal uptake (Gastil et al. Reference Gastil, Deess, Weiser and Simmons2010; Schwartzberg Reference Schwartzberg2018).
This type of context—norms of consensus and fair deliberation—is not a mere ideal: it exists in practice in a variety of settings. These include juries (Gastil et al. Reference Gastil, Deess, Weiser and Simmons2010), race dialogue groups (Cramer Walsh Reference Cramer Walsh2007), and small decision-making bodies that meet regularly (Mansbridge Reference Mansbridge1983). In other words, a favorable setting for racial equality of authoritative representation exists in a range of civic and political spaces. Whether racial equality might emerge in such settings is the subject of our analysis.
Data and Methods
We leverage a unique dataset to measure when white and POC members voice their views in deliberation, and how often others take up those views. Our design was preregistered at the Open Science Framework website.Footnote 8
Data
We analyze data from a mock-jury experiment that randomly assigned jury-eligible citizens from Phoenix, Arizona, to hundreds of six-member “juries” (Schkade, Sunstein, and Kahneman Reference Schkade, Sunstein and Kahneman2000; Sunstein et al. Reference Sunstein, Hastie, Payne, Schkade and Viscusi2002) tasked with making decisions about punitive damages against corporations in civil cases.Footnote 9
While race does not feature in these cases, we expect it can shape relevant experiences and political sensibilities about harm and fairness. And in fact, people of color in this sample privately indicated a predeliberation preference for much more serious punishment of harmful corporations: about $2 million more. This effect of race is larger than that of any other individual demographic characteristic, including gender, age, education, and income.Footnote 10
Past work has found that group racial composition shapes these decisions (Karpowitz et al. Reference Karpowitz, Mendelberg, Elder and Ribar2023). However, the content of these deliberations remains unexplored. Here we investigate racial patterns in speech behavior. The data include individual and group demographics, private predeliberation and postdeliberation preferences, and the group decisions. As described below, we merged these data with transcripts of the deliberations.
Each jury was instructed to decide on the punitive damages to be awarded in one of 15 legal cases. Each case was assigned to a roughly equal number of juries.Footnote 11 All cases were adapted from actual legal cases involving a corporate defendant found liable for some harm against an individual plaintiff. The gender and age of the plaintiffs varied across the cases, as did the type and severity of the corporation’s wrongdoing. For example, one case involved a man suffering skin damage from using a baldness cure; another involved a child being hospitalized after ingesting allergy medicine.Footnote 12 Juries received no information about the race of the plaintiff.
Participants were told a prior jury had already decided the corporation was liable using a “preponderance of the evidence” legal standard and determined compensatory damages, so they were only to decide on punitive damages. The judge’s instructions explained that the purpose of punitive damages is “to punish a defendant and to deter a defendant and others from committing similar acts in the future.”
Jury-eligible citizens in Phoenix were recruited by a survey research firm and paid $35 for their participation. Sessions occurred across five weekends, with hundreds of participants each weekend. Participants arrived at the study site, privately reported their demographic information, viewed videotaped narratives of their assigned case and read the same information in writing, and then recorded their private preferences about the appropriate punitive damages in the case using one of two randomly assigned scales (either dollars or severity rating). They were then randomly assigned to a six-person mock jury, instructed to choose a foreperson who would “preside over” the group’s deliberations, and asked to deliberate for up to 30 minutes before arriving at a unanimous decision (or declare themselves hung if they could not come to a decision). After this deliberation, participants recorded their private preferences on the same case using the other scale (dollars or severity ratings), and the jury deliberated again about the same case for up to 30 minutes to reach a decision on this scale. The median group deliberated for 27 minutes in total, and the transcripts suggest groups discussed their task thoroughly. We analyze the first round of deliberation, as second-round deliberations tended to be much shorter and less substantive, given that the jury was considering the same case a second time.
We paid transcribers to transcribe the audio recordings of the full text of each discussion. We have usable transcripts for 407 (out of 550 possible) juries. The primary reason some transcripts are not available is poor audio quality, making it impossible to generate a transcript or distinguish the voices. Unfortunately, the tapes, and thus the transcripts, do not label individuals with a unique, identifying speaker label. To link speakers with the experimental and self-reported data described above, we used cross-walk information common to both the transcripts and the data: legal case, deliberation order, participant gender (gleaned from the audio and from some names mentioned on the tape), and expressed preferences. To use expressed preferences for this purpose, research assistants listened to each stated preference in the audio, compared it to the predeliberation preference each member had recorded in their predeliberation questionnaire, and linked a voice to a juror.Footnote 13 Intercoder reliability for this identification process is high (Krippendorff’s α = 0.80).Footnote 14 Research assistants then assigned lines of speech uttered by a single speaker in the transcripts to a speaker identifier.Footnote 15 Through this process, we linked 956 people in 198 groups to speech in the transcripts. We do not find systematic differences in the demographics of participants who could and could not be linked to transcripts, except that women were less likely to be identified. Importantly, there are no differences in our ability to link white and POC participants to their speech. Footnote 16 Nevertheless, to avoid any potential bias from transcripts with many unidentified speakers, our individual-level analysis uses only the 767 individuals in the 147 groups for which at least 80% of the words are attributed to an identified speaker. We use the full dataset of 407 juries for group-level analysis.
These data were collected between 1999 and 2001. Though substantial time has passed, we see these data as informative about group deliberations today. Wamble and colleagues (Reference Wamble, Laird, McConnaughy and White2022) recently investigated the extent to which Black survey interviewees respond differently to interviewers of different races, finding little change over time. Survey respondents in the 2010s remained highly sensitive to the race of their conversational partner, just as they were decades earlier. This provides suggestive evidence that selective self-expression by racial context persists to a similar degree today as it did when these data were collected.Footnote 17
Measures
Individual race and group racial composition are our key predictors. Eighty-six percent of the participants are white, 6% are Hispanic, 3% are Black, and 5% identified with other races. Although this is a larger and more racially diverse sample than many studies of group decision making, it lacks power to examine each racial group separately. Thus, for the purposes of analysis, we pool all those who identity as racial or ethnic minorities and refer to them as people of color; as Pérez (Reference Pérez2021) shows, this is a meaningful identity category. Measured this way, there is sufficient variation in the racial composition of groups to allow us to estimate its effects: of the 407 groups with matched transcripts, 34% (137 groups) are all white, 48% (194) contain five whites and one person of color, 16% (66) have four whites and two people of color, and 2% (10) include three people of color or more (see section S2 of the online appendix for additional details).Footnote 18 Our findings hold when separately analyzing the most numerous people of color in our sample—Hispanic Americans—albeit with less precision due to lower power (see appendix section S11).Footnote 19
We develop measures of voice and authority to assess the concepts described above. Some are constructed from the speech of all deliberators. These rely on the full transcripts and are available for all individuals in the 407 groups for which transcripts are available. Others are constructed with text from individual speakers—the 767 identified individuals in the 147 groups for which at least 80% of the words are attributed to an identified speaker. Descriptive statistics for key measures can be found in appendix section S5.
With these data, we can calculate the amount and timing of each individual juror’s speech, and the frequency with which the juror’s preferred punishment is mentioned by themselves or others. This allows us to capture levels of voice and uptake for each white and POC juror. Because these measures are calculated at an individual level, they are not mechanically affected by the fact that white participants outnumber people of color within most groups. For example, if we measured the number of words spoken by all the white jurors in a group and all the POC jurors in the group, the words spoken by white jurors would be greater simply because there are more white jurors. Measuring the words spoken by each individual white juror and each individual POC juror means these totals are not mathematically inflated or deflated by racial composition.
As we discuss below, one key measure of authority is the extent to which the group discusses a member’s (privately recorded) predeliberation preference for punitive damages. Considering, choosing, rejecting, or compromising among these preferences is the heart of the group’s decision task. To measure preference mentions, we developed code that identifies scale points and dollar amounts in speech: for example, the number eight, or $500,000. These are the preferences group members considered in each round. We validated the code by comparing its results to the preferences coded by human coders, and find it produces acceptable false positive and negative rates of 5%–15% (see appendix section S4). This approach captures any mention of a preference, regardless of whether it is raised by someone advocating for or disagreeing with it. Both kinds of mentions indicate that a person’s preference is being introduced or considered as a possible outcome; thus, we are interested in both.
Our first measure of voice is speech length: the number of words spoken by the focal member. Second, we measure the number of times the focal member mentions any group member’s preference—an indication they are contributing to the process of reaching a decision by discussing specific possible outcomes. Third, we construct two measures of the timing of the focal member’s speech: whether the member speaks at the beginning or end of the deliberation, important points for influence. Specifically, we measure the “earliness” of a person’s participation by counting how far their first line of speech is from the beginning of the deliberation, and “lateness” by measuring how far their last line of speech is from the conclusion of the deliberation. More “influence”—a turn closer to the beginning or end—is denoted by higher numbers. Fourth, we measure how often the focal member mentions their own predeliberation preference. This is a crucial measure of voice, representing an effort to express one’s own authentic view and to exercise influence over the decision.
Next, we measure uptake. First, we count the number of times the focal member’s preference was mentioned by anyone in the group. The frequency with which a preference is discussed by the group represents the extent to which a person’s prior opinion is “taken up” during deliberation, or how much focus it receives. This measure uses the full dataset of nonidentified transcripts, maximizing our statistical power. The number of times a preference is mentioned is strongly correlated with the group’s decision (see appendix figure S3). Thus, this measure is directly tied to influence.
To isolate uptake from voice, we construct a second measure of uptake: how often a member’s predeliberation preference is mentioned by others in the group—omitting the focal member’s own mentions of that preference. Third, we repeat this uptake measure only for the foreperson’s mentions of the focal member’s preference. To be sure, if a person never mentions their own preference, others are less likely to take it up. We cannot correct this problem by conditioning on a juror’s mentions of their own preference, as this behavior is downstream of their racial identity, potentially biasing the estimated effect of race. Instead, we rely on other jurors’ mentions of a member’s preference, regardless of whether the member themselves voices it.
We use the subsample of individually identified speakers to measure all these variables except the total mentions of a focal member’s preference (which uses all jurors in groups with transcripts).
Finally, we move beyond preference mentions and construct other measures of possible racial differences in speech content. Specifically, we use two approaches. First, we use a frequency difference approach to find the sets of words that are most distinctive to both white and POC speakers (Grimmer, Roberts, and Stewart Reference Grimmer, Roberts and Stewart2022). Second, we employ structural topic modeling to examine the possibility that white and POC speakers raise different topics (Roberts et al. Reference Roberts, Stewart, Tingley, Lucas, Leder-Luis, Gadarian, Albertson and Rand2014). These measures characterize the effects of race on the broader content of deliberation, establishing the substantive significance of differences in voice or uptake.
Methods of Analysis
For each measure of voice in deliberation, we test (1) whether POC members have less voice than whites, (2) whether this race gap can be explained by differences in preferences, (3) whether the gap shrinks when accounting for other features of the deliberation (such as its length), and (4) whether the gap is mitigated when POC members are assigned to more diverse groups. We estimate ordinary least squares models, regressing measures of voice and uptake on individual race. To test issue (1), we include only individual race and fixed effects for legal case and for assigned order (severity rating first or dollars first). These variables remain in all models. We omit other individual demographic controls to avoid conditioning on variables that are affected by race. Models controlling for education, gender, age, and income are in appendix section S10; results are similar.
Models testing issue (2) add three measures of the focal member’s preference: their predeliberation preference, their absolute distance from their group’s median predeliberation preference, and how many others in their group share their exact preference (see appendix section S5 for descriptive statistics). These controls test whether the race gap is due to the fact that POC members hold preferences that are more punitive, further from the group median, or less often held by others. Appendix section S8 reports analyses with different controls for relative distance.
In the models testing issue (3), we add controls for features of the discussion that could explain the race gap but are endogenous to the deliberation. These include speech length and whether the focal member is the foreperson, as these mechanically shape speech behavior. We interpret these models with caution given the endogeneity, regarding them as merely suggestive of mechanisms. For example, juries chose the foreperson, and white jurors were more than twice as likely to be chosen.Footnote 20
Finally, to test whether disadvantage is mitigated in more diverse groups, we return to a basic model and add an interaction between individual race and group racial composition in the model testing issue (4). (Models including the interaction and all controls are in appendix section S6.) Because participants were randomly assigned to the group, we avoid selection effects in the group’s racial composition and can evaluate the causal effect of increasing racial representation. We measure racial composition using categorical variables for each possible group composition: six white, five white, and four or fewer white jurors. This avoids imposing the assumption that participation changes linearly as the number of white jurors in a group increases. It allows us to detect whether racial composition affects behavior differently when decreasing from six to five whites compared to decreasing from five to four or fewer whites.
We calculate robust standard errors clustered at the group level. Because all outcome variables are right-skewed, we take the natural log of each.Footnote 21 In addition to reporting each main finding, we summarize them in a final figure for ease of interpretation (see figure 3). This figure can guide readers through the complexities of each result.
Results
Speech Length and Timing
To analyze individual speech outcomes, we use the 767 individuals in the 147 groups for which at least 80% of the words are attributed to an identified speaker.
We first examine the relationship between an individual’s race and the amount they speak. Table 1 presents regression models of the logged number of words. The first model includes only individual race and fixed effects for scenario (the legal case) and scale (dollars or ratings). The results in column 1 of table 1 suggest that white members speak more: the coefficient of 0.606 means a white member speaks 141 more words than a POC member. This is a substantial difference, representing an increase of 39% above an even share of the typical deliberation length.
Length of Speech (in Words)

Note: * p $ < $
0.05; ** p
$ < $
0.05; ** p $ < $
0.01; *** p
$ < $
0.01; *** p $ < $
0.001.
$ < $
0.001.
Columns 2 and 3 turn to possible explanations. Because white members are more likely to have others who share their preference (appendix section S7), they may feel more encouraged to speak. Column 2 adds controls for predeliberation preferences. While some of these variables predict length, the coefficient on race is not diminished. The third column adds an indicator for whether the participant was chosen as foreperson, which could necessitate speaking longer, and for group speech length. The race effect remains large and significant in the presence of these variables. Thus, even after controlling for preferences, for formal authority (foreperson status), and for deliberation length, the racial disparity persists.
The final column adds an interaction between race and racial composition, to test whether the effect of race diminishes in more diverse groups. In that case, the coefficient on white × five-white group would be positive. This would indicate that the race gap in groups with five whites and one person of color is larger than the race gap in the omitted category of groups with fewer than five whites and at least two people of color. However, this coefficient is insignificant. That is, the racial disparity is not affected by adding a second or third person of color.Footnote 22
Next, we consider the number of times a member mentions any member’s preferences, including their own. These mentions allow participants to shape the decision by raising specific options the group could choose or reject. As table 2 shows, white members indeed mention more preferences than POC members. Again, this racial disparity is not explained by preferences. It also holds when we control for the person’s total speech length and their foreperson status.Footnote 23 Neither is the gap affected by adding a member of color: the interaction term with racial composition is small and not significant. Not only are white members speaking more, they are more often “in the thick” of the deliberative process, mentioning specific choices for the group to consider.
Deliberator Mentions of Any Preference

Note: * p $ < $
0.05; ** p
$ < $
0.05; ** p $ < $
0.01; *** p
$ < $
0.01; *** p $ < $
0.001.
$ < $
0.001.
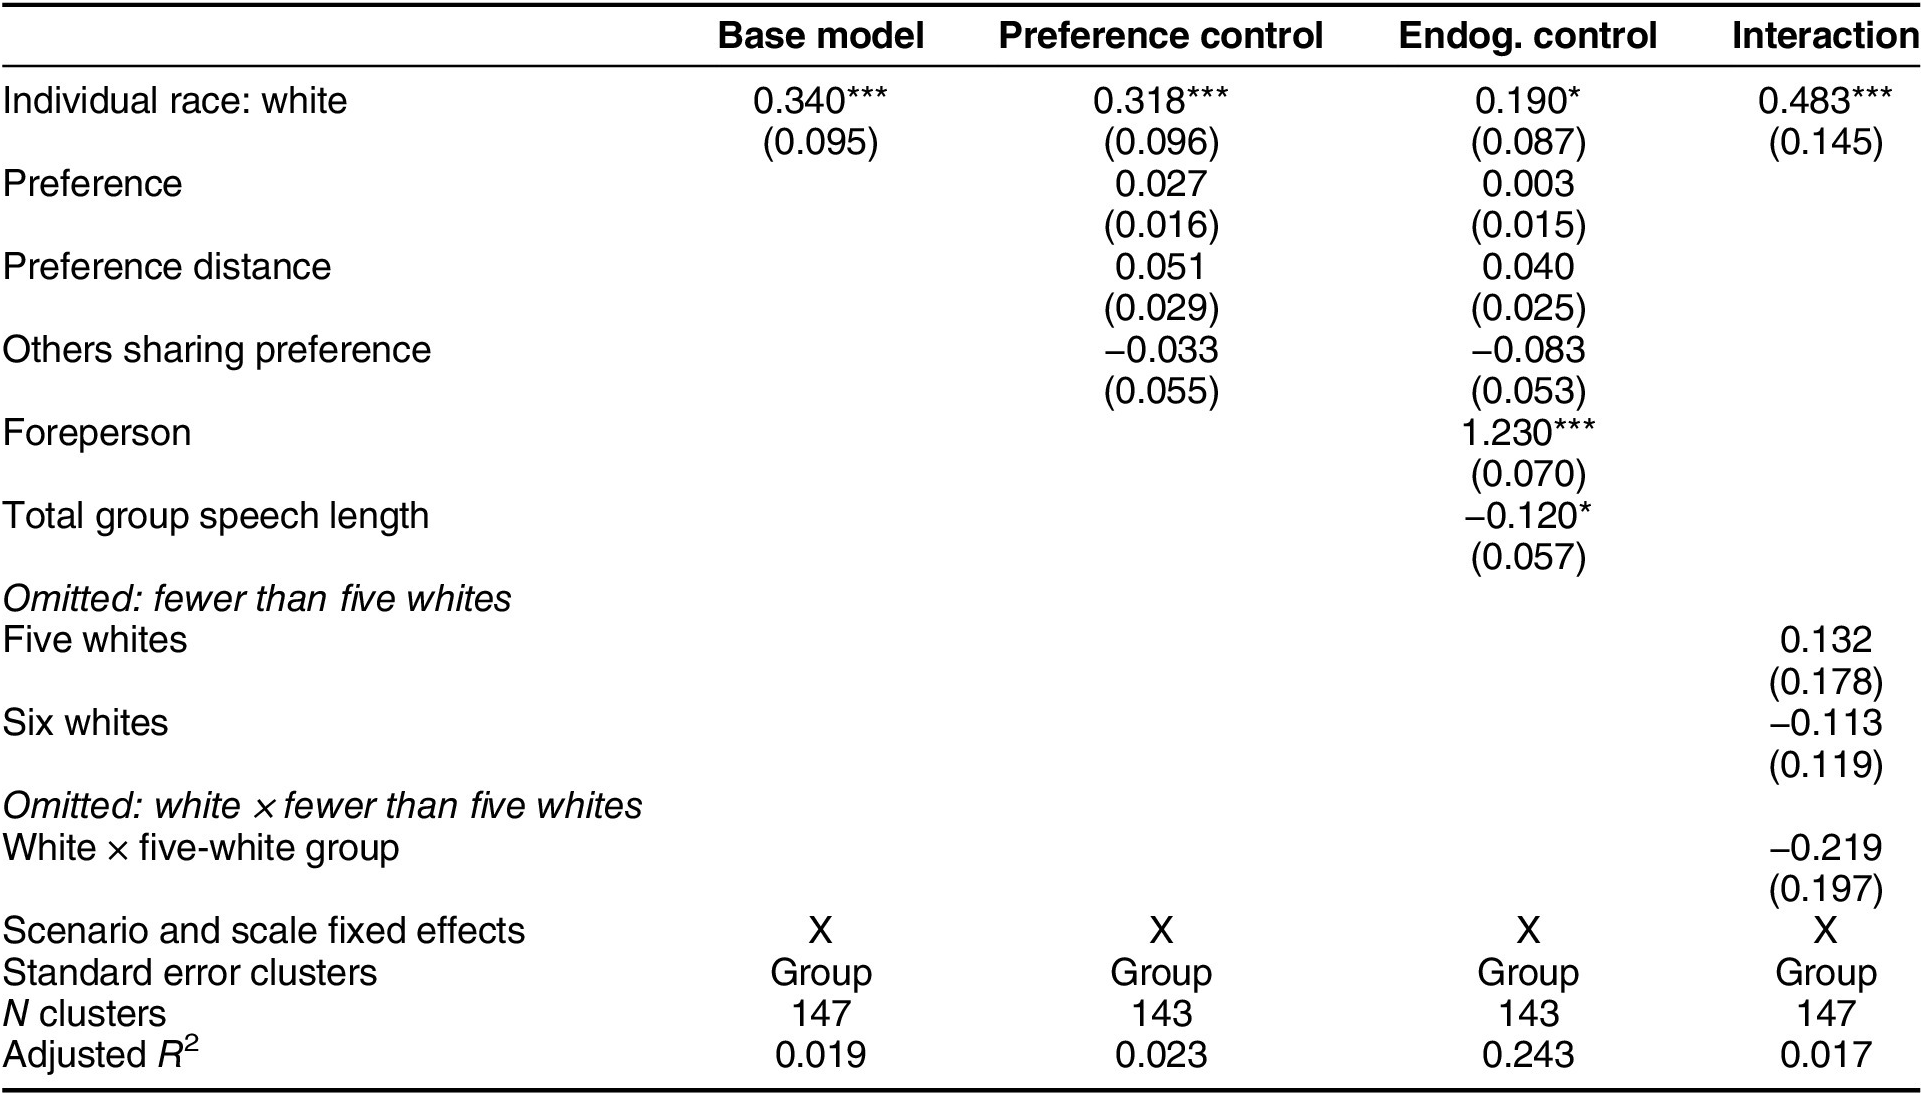
This pattern recurs in the timing of speech. Table 3 shows results for the first speech turn relative to the beginning of the deliberation, and table 4 shows results for their last speech turn relative to the end. In both cases, we reverse the outcome so positive coefficients indicate more voice. Table 3 suggests that whites speak earlier than people of color. This gap is undiminished by preference controls (second column). The gap is partly explained by foreperson status (third column); however, white members were much more likely to be chosen as foreperson, so foreperson status should be viewed as a possible mediator of race rather than representing an alternative explanation to race. Finally, the gap does not close in more diverse groups (fourth column).
Position of First Speech Turn (Distance from Beginning of Deliberation)

Note: * p $ < $
0.05; ** p
$ < $
0.05; ** p $ < $
0.01; *** p
$ < $
0.01; *** p $ < $
0.001.
$ < $
0.001.
Position of Last Speech Turn (Distance from End of Deliberation)
Note: * p $ < $
0.05; ** p
$ < $
0.05; ** p $ < $
0.01; *** p
$ < $
0.01; *** p $ < $
0.001.
$ < $
0.001.
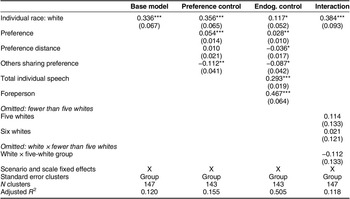
As table 4 shows, this pattern persists for speaking near the conclusion. White members’ last turn comes four turns closer to the end of deliberation. Again, preferences do not explain the gap, and being a foreperson shrinks but does not erase it. Again, there is no significant interaction with racial composition. If getting the “last word” means greater influence, white participants may be more involved in shaping the decision.
Preference Mentions
We now turn to uptake, a critical component of authority. We first examine the number of times a person’s preference is mentioned in the full deliberation, using data from all 2,442 participants in the 407 groups with transcripts. Though this analysis does not allow us to pinpoint which juror mentions a person’s preference, it is the only analysis that can take advantage of the full set of transcripts. We then turn to the subset of people linked to their individual speech to analyze uptake by the focal member’s fellow members and by the focal member’s foreperson.
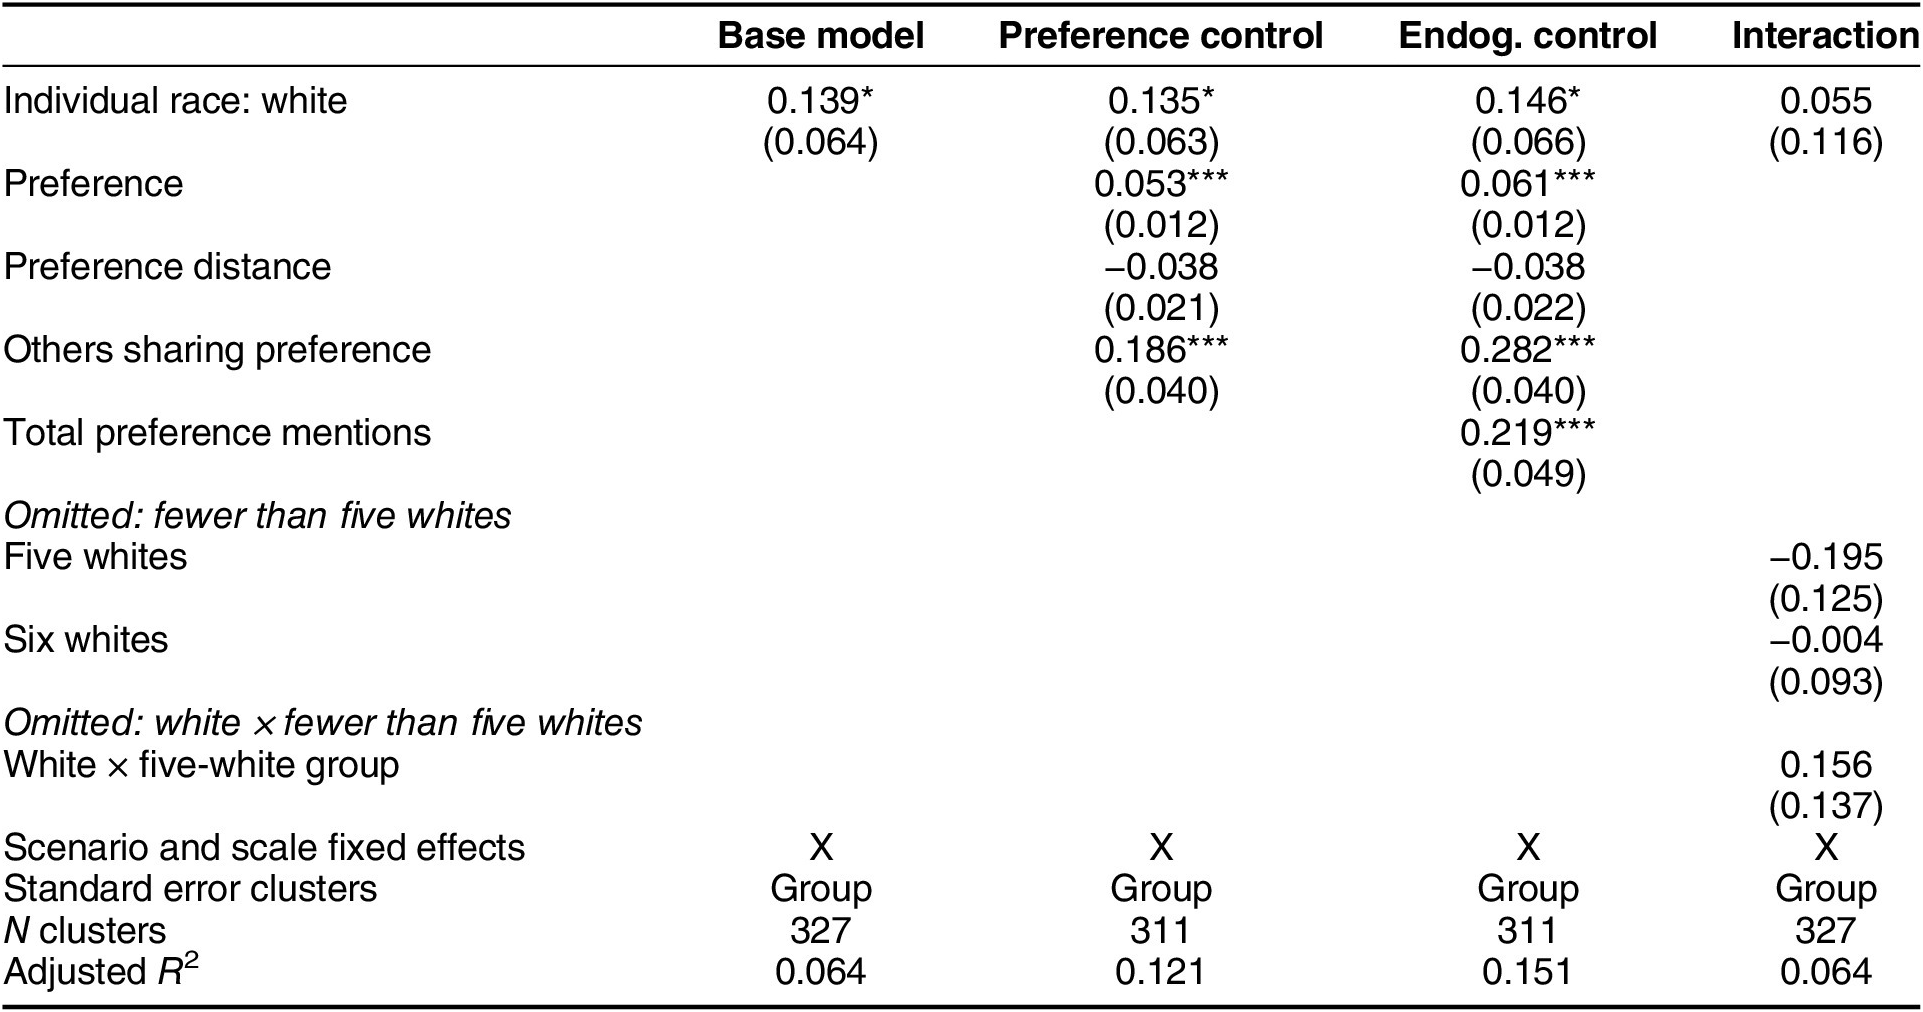
Table 5 shows the number of times a person’s preference is mentioned by their group. As before, we test whether there is a race gap, and whether it declines as we add controls.Footnote 24 In the third column, we add a control for the total number of preference mentions by the group (excluding the focal members). Finally, in the fourth column, we test whether the race gap shrinks in more racially diverse groups.
Number of Group Mentions of Individual Preference

Note: * p $ < $
0.05; ** p
$ < $
0.05; ** p $ < $
0.01; *** p
$ < $
0.01; *** p $ < $
0.001.
$ < $
0.001.
The first column of table 5 shows that white participants’ preferences are mentioned significantly more by the group.Footnote 25 The coefficient of 0.139 means white participants have their preference mentioned nearly one time more, a sizable gap since the average member’s preference is mentioned only five times. In the second and third columns, the race gap is not muted by controls for preferences, nor by the group’s total number of preference mentions. Whites’ advantage remains more than half the size of the effect of having one additional person share one’s preference. In column 4, the race gap shrinks to near zero in groups with fewer than five whites (that is, groups with at least two people of color); however, the interaction term is not significant, meaning the race effects in more and less diverse groups are indistinguishable. We therefore cannot definitively conclude that more diverse groups mitigate the race gap.
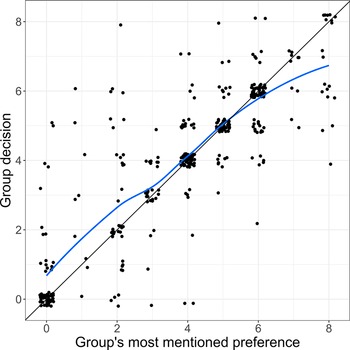
The total number of times a preference is mentioned is substantively important to the outcome of group discussions. Figure 1 illustrates this by plotting a group’s most mentioned preference against its eventual decision. About 60% of groups choose the preference the group mentioned most, and 80% come within one scale point.Footnote 26 Thus, when white members’ preferences receive more uptake, they are more likely to be reflected in the final outcome. This finding highlights the importance of authoritative representation as a conduit between who is in the room and what the room decides.
Group Decision by Group’s Most Mentioned Preference
Notes: Figure based on ratings deliberations; 20% jitter was added to observations to illustrate point density. Blue line represents LOESS fit, and black line represents 45° line.

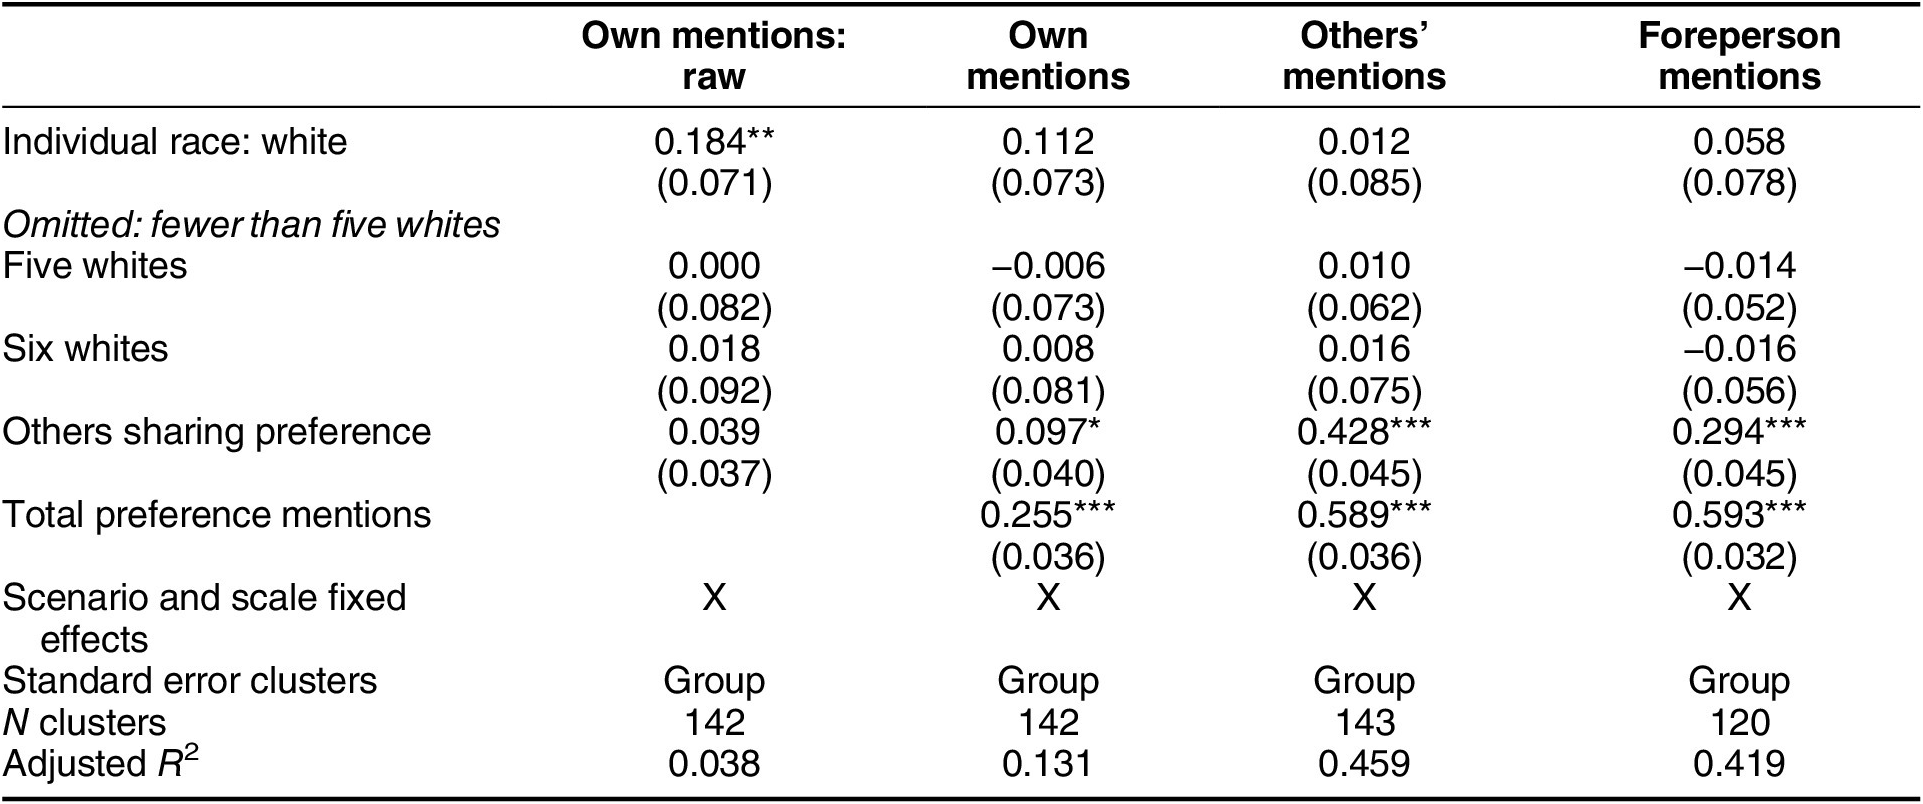
Why might whites’ preferences receive more discussion? Are white participants mentioning their own preferences more, or do their preferences receive more uptake by other members or by forepersons? To answer these questions, we return to the individual speech dataset and analyze who mentions each preference. Table 6 models three different outcomes: the number of times a person mentions their own preference, the number of times a person’s preference is mentioned by others, and the number of times a person’s preference is mentioned by the foreperson. All models control for the number of members with the focal member’s preference.
Number of Times Focal Person’s Preference Is Mentioned by Specific Members

Note: * p $ < $
0.05; ** p
$ < $
0.05; ** p $ < $
0.01; *** p
$ < $
0.01; *** p $ < $
0.001.
$ < $
0.001.
The first model shows that white members mention their own preferences significantly more than POC members. Is this because white participants are especially likely to talk about their own preference, or is it simply because they mention all preferences more often? The second model, in column 2, shows that this relationship weakens with a control for the total number of times a participant mentions any preference. This result suggests that white participants mention their own preferences more because they talk about more preferences overall. Alternatively, perhaps they mention more preferences because they are more likely to mention their own.
The third column turns from own mentions to others’ mentions of the focal member’s preference—a key measure of uptake. Here we see a null race effect: whites’ preferences are not mentioned more often by other members.Footnote 27 Likewise in column 4, there is no race gap in foreperson uptake of the focal preference.Footnote 28
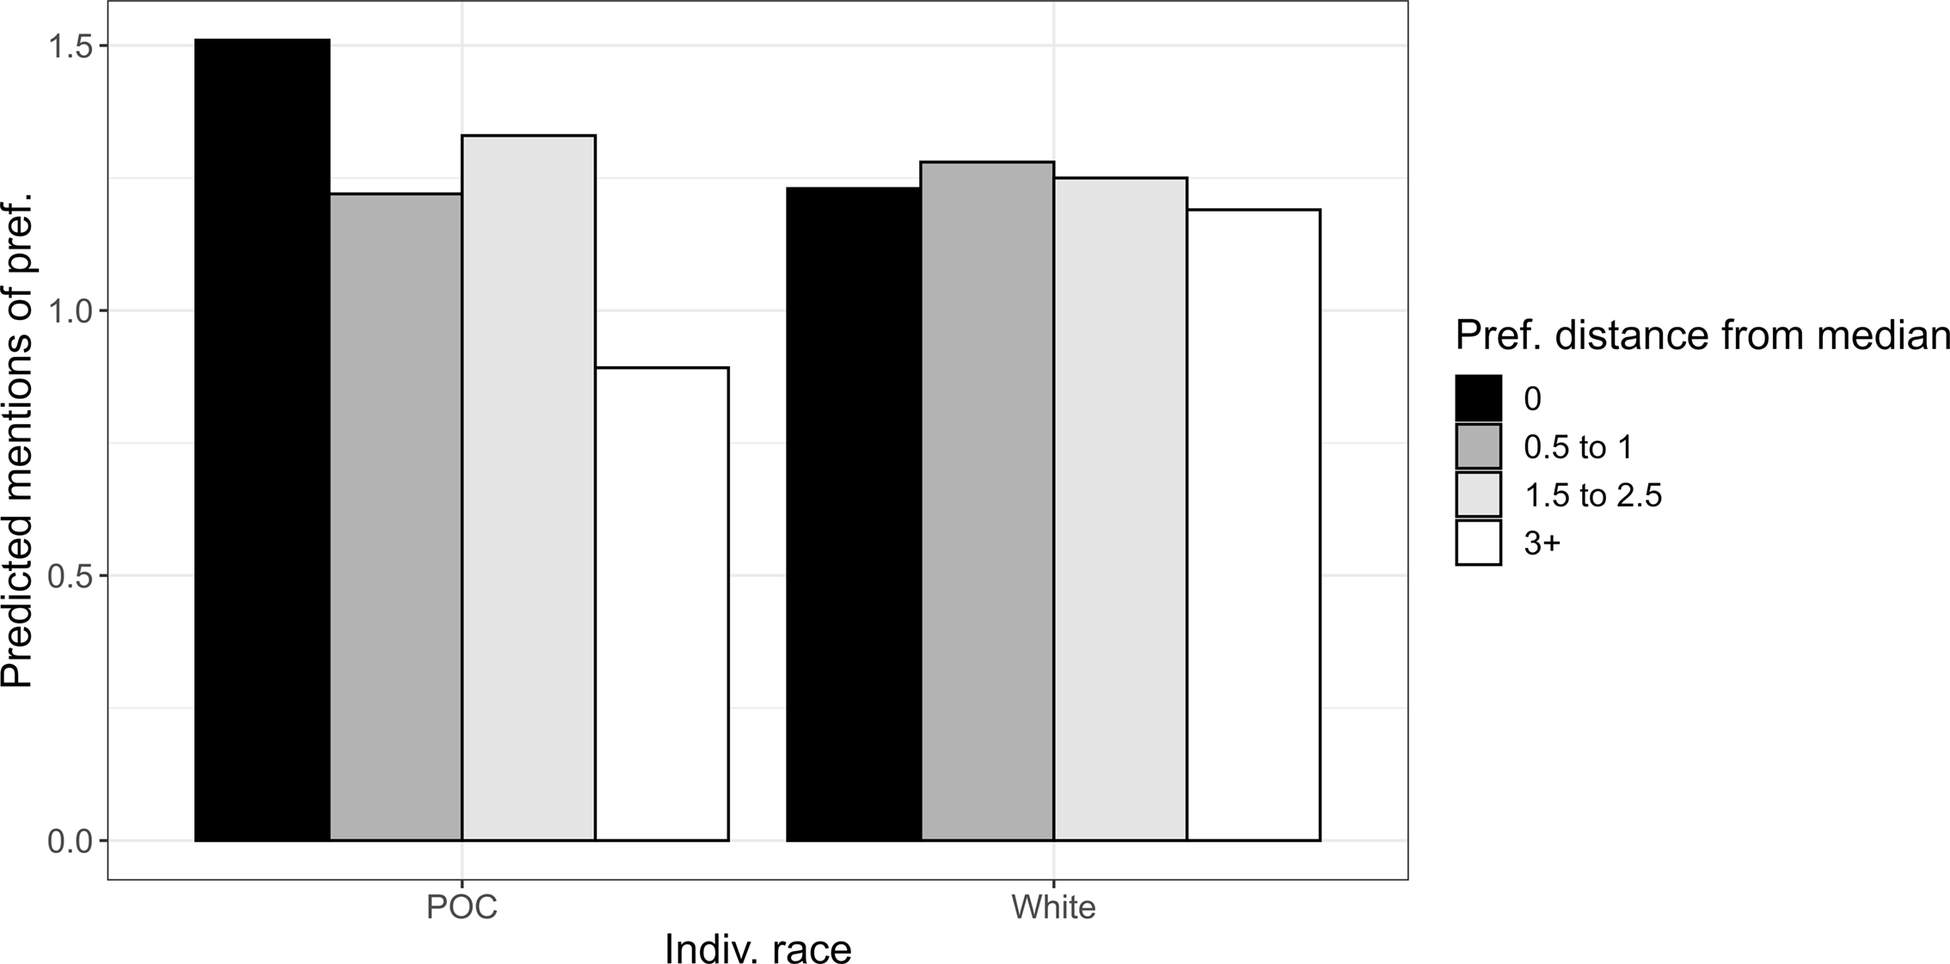
However, the null effect of race on preference mentions by other members conceals important variation based on individuals’ preferences.Footnote 29 Figure 2 shows the predicted number of times the focal preference is mentioned by others, by race, and by the distance from the median preference. While their preferences do receive uptake when they happen to match the predeliberation preferences of the other group members, POC members receive less uptake when they are far from the median. By contrast, white group members receive relatively high levels of uptake regardless of the relationship between their preferences and the group’s median. This conditional effect of race is not only large but statistically precise, as seen in appendix table S6.Footnote 30 POC members are uniquely disadvantaged when their preferences diverge from their group’s—that is, in the situation where their unique point of view could make the most difference.
Predicted Mentions of a Person’s Preference by Others in Their Group
Notes: Predictions are calculated separately by individual race and distance from the predeliberation median. All other variables are held at their means.

In all, these results point to two important mechanisms for unequal uptake. First, the frequent mentions of whites’ preferences in the discussion are driven by voice—by whites’ greater tendency to mention preferences themselves. Second, when people of color diverge from the group, their lower uptake in discussion is directly driven by the failure of group members to engage those preferences.
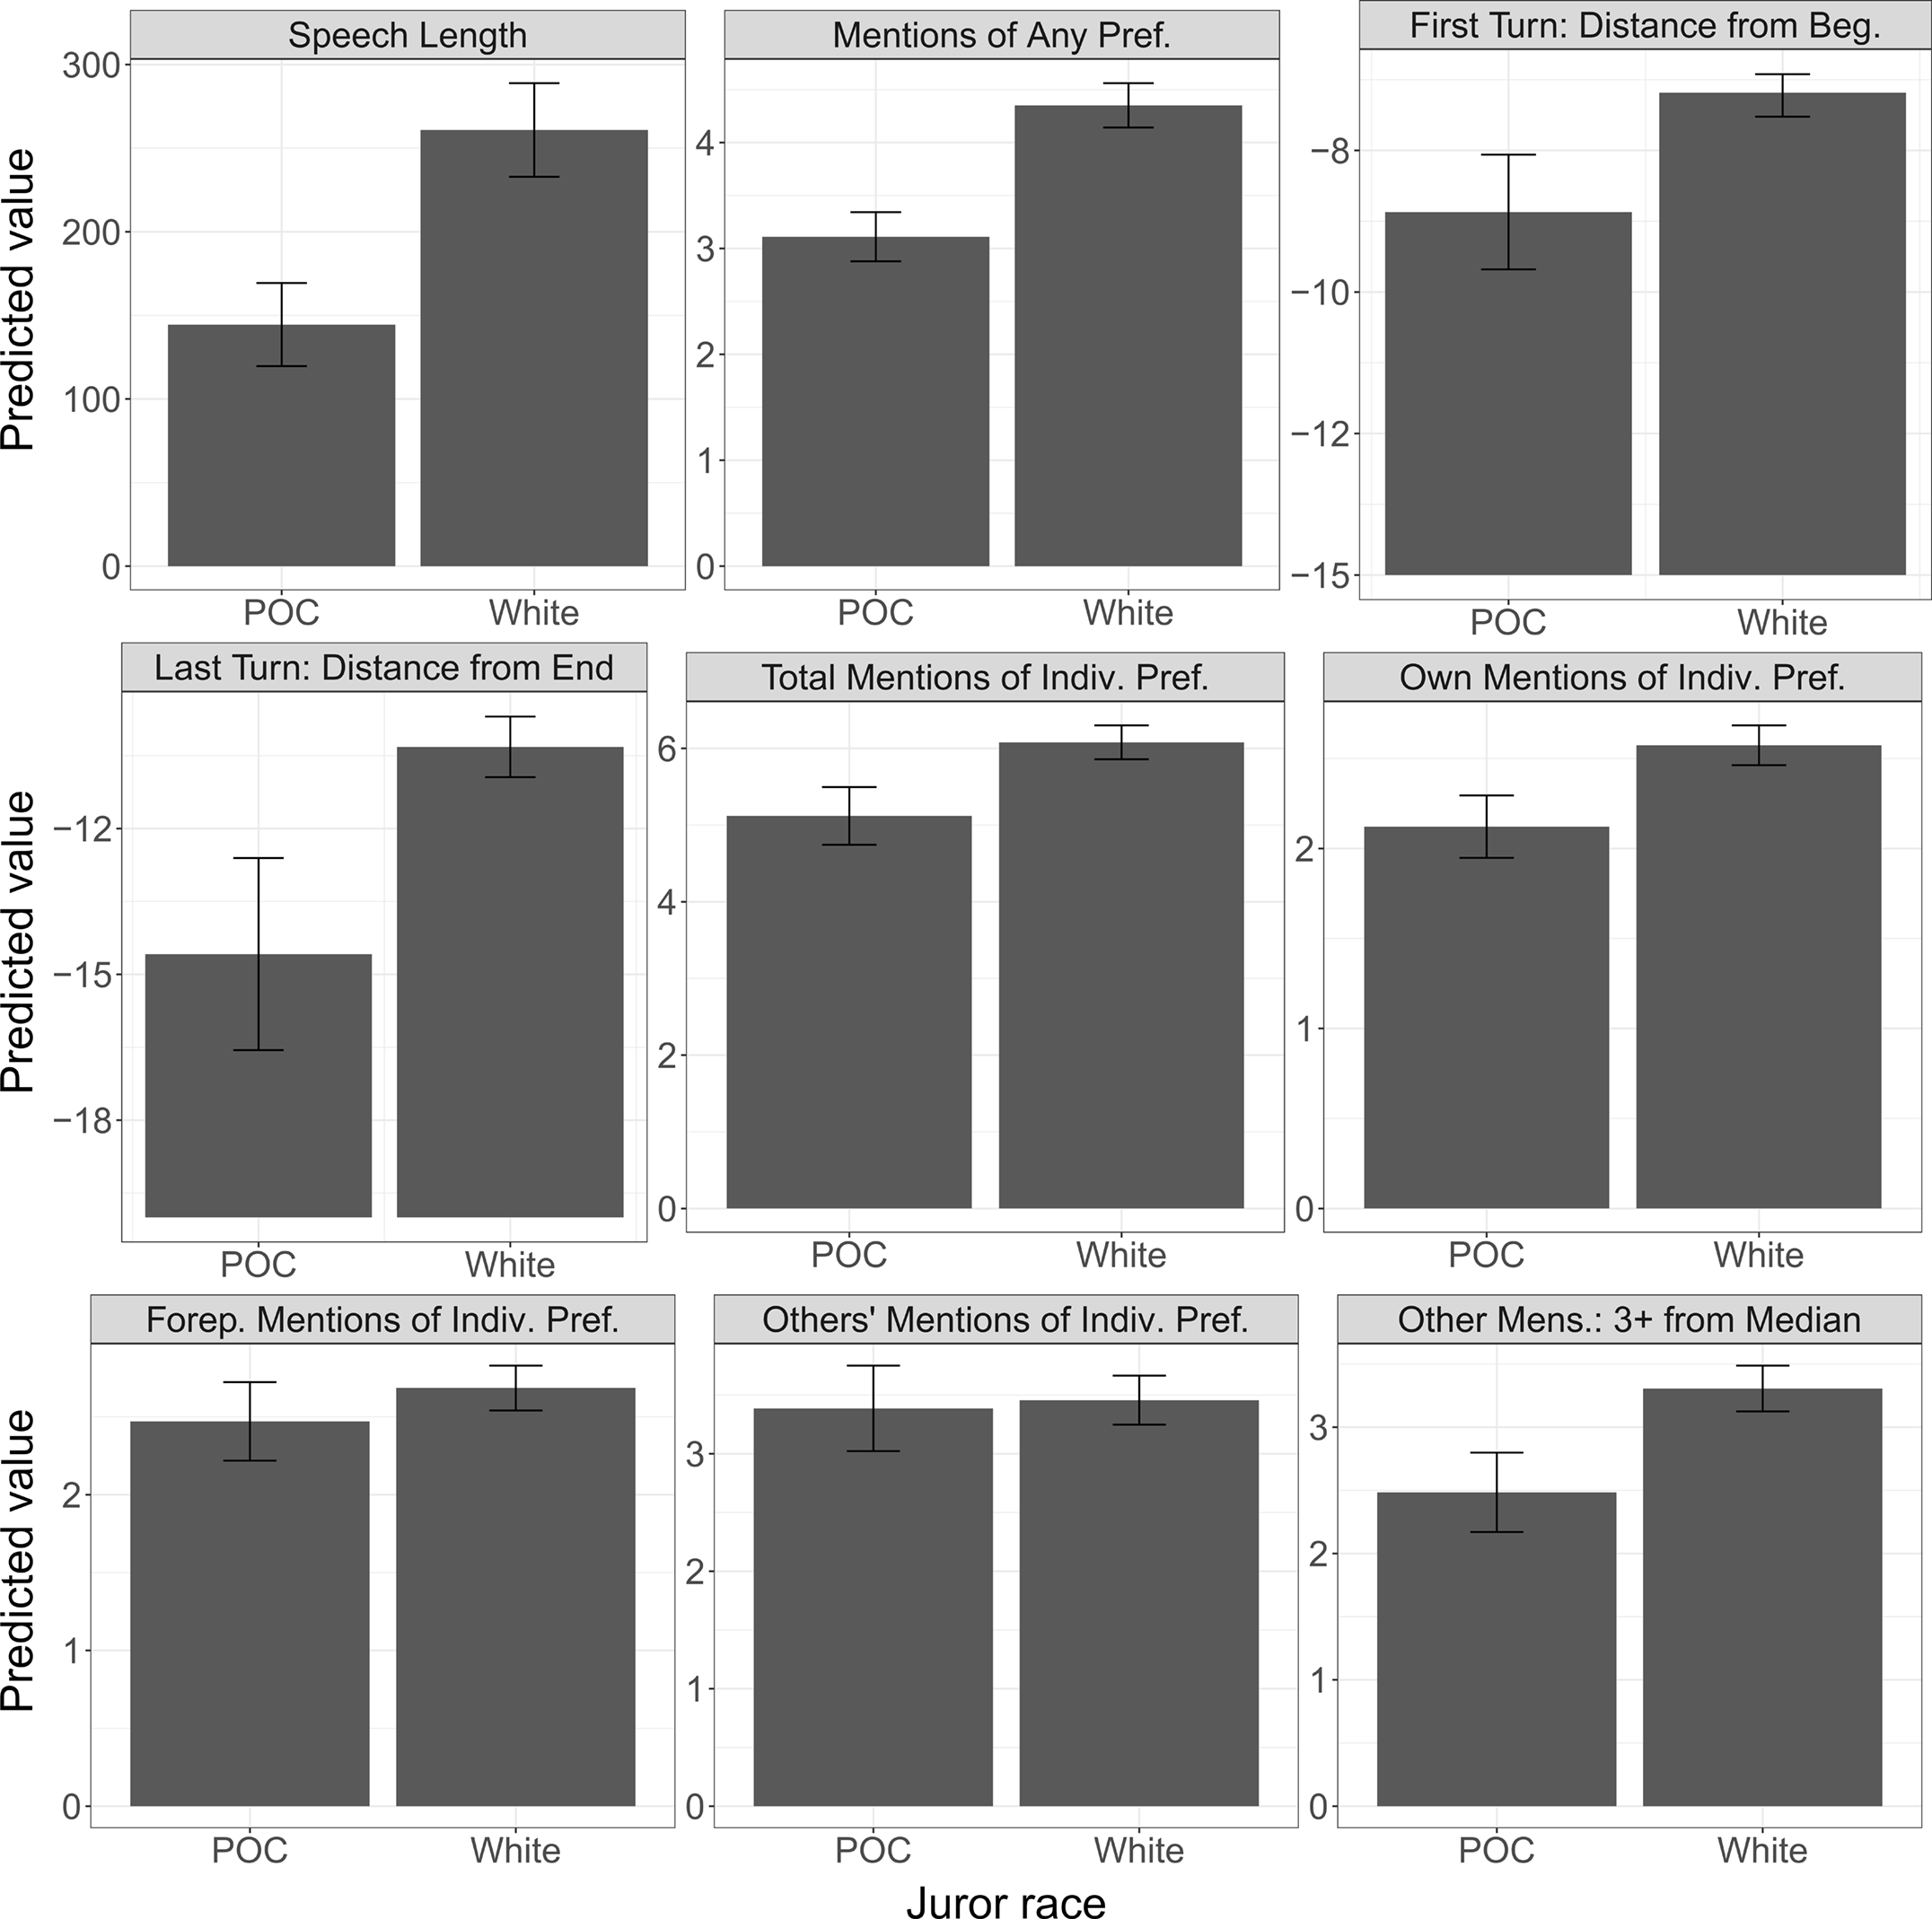
Figure 3 summarizes our findings. We use the most basic model in each analysis to generate predicted values for each measure, for white and POC participants.Footnote 31 As the figure illustrates, white participants consistently participated more and in more influential ways in deliberation. For the first six measures, white participants exercised significantly more voice: speech length, mentions of any preference, the distance of their first turn from the beginning of the deliberation, the distance of their last turn from the end, the total number of times their preference was mentioned by their group, and the number of times they mentioned their own preference. The final two measures—uptake by others and by the foreperson—do not show a significant race gap, but a race gap in uptake does emerge when people of color diverge from their group.

Speech Content
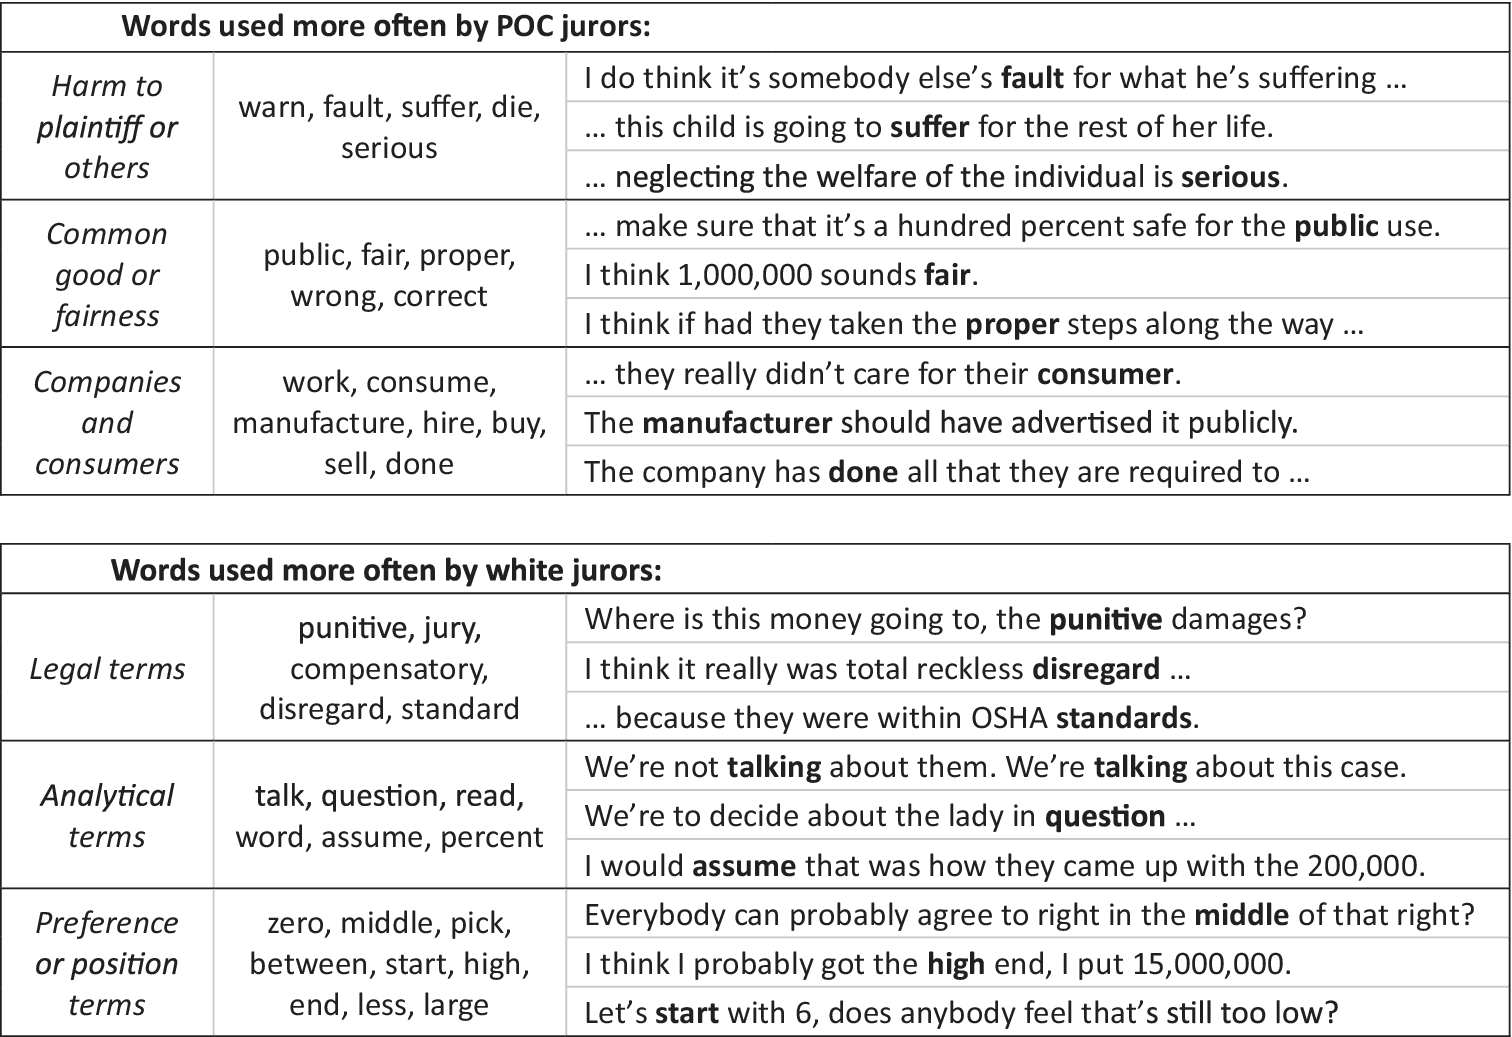
Do these race gaps matter to substantive representation? To address this question, we examine differences in the content of speech by white and POC participants. First, we identify individual words that are used more often by POC or white deliberators (Benoit Reference Benoit, Curini and Franzese2020; Grimmer, Roberts, and Stewart Reference Grimmer, Roberts and Stewart2022). Appendix section S13 details how we processed the texts and identified distinctive words, and contains full lists of words that are most distinctive to white and POC speakers. Following standard practice, we used these lists, along with our reading of how these words were used in context, to identify patterns in word frequency (Nelson Reference Nelson2020). Figure 4 presents these patterns by listing relevant words and representative sentences in which deliberators used those words.
Selected Words Used More Often by White and POC Deliberators

POC deliberators were more likely to use words discussing the harm done to the plaintiffs or others similar to them. For example, “suffer” falls in the 19th percentile of words used by white participants, but the 42nd percentile of words used by people of color. These differences are consistent with the fact that people of color preferred stronger punishment for the corporation inflicting the suffering. Their greater rhetorical emphasis on harm may have been an attempt to explain their views about the importance of holding the company accountable for the consequences of its actions. POC participants were also more likely to use words related to fairness, like “fair,” “proper,” and “wrong,” as well as words referencing consumers, companies, and their obligations.
In turn, white participants were more likely to invoke legal words, referencing terms from the case materials, such as “reckless disregard” and “compensatory damages.” They also used analytical terms that framed the debate or the facts, and terms related to specific preferences. The latter is consistent with our earlier finding that white participants were more likely to mention specific preferences. Whites’ greater use of analytical and legal terms, and greater propensity to state and to frame punishment preferences, is consistent with a more concerted attempt to exercise authority in the discussion.
As a final measure of content, we employ structural topic modeling to search for racial differences in discussion topics.Footnote 32 Unlike the word frequency analysis, topic modeling identifies clusters of words that co-occur in the speech of some deliberators but not others (Roberts et al. Reference Roberts, Stewart, Tingley, Lucas, Leder-Luis, Gadarian, Albertson and Rand2014). We estimated 10 models, each containing 30 topics. We found only one topic present in multiple models that differed by race. This topic relates to forepersons’ discussions of their administrative tasks. In all, then, white and POC participants did not mention different topics.Footnote 33
In sum, while members approached the cases in similar ways, they exhibited subtle but meaningful differences in the considerations they emphasized. These differences raise the stakes of the authority gaps we observed. People of color expressed some different ideas in their speech. If they did not speak as often, those ideas got shorter shrift in the discussion.
Discussion
Authority in deliberation is an important face of power and a key facet of substantive representation. Our aim has been to assess the existence of race gaps in that authority.
In many ways, the situation we study should be a favorable one for egalitarian deliberation, with its unanimous decision rule and the widespread expectation that members should listen to each other, assess facts impartially, and reach just decisions (Schwartzberg Reference Schwartzberg2018). Nevertheless, even in this setting, we find substantial race gaps. Using data on actual voice and uptake in discussion, we find that such groups fall short of the ideal of equality. White members speak more and are more likely to discuss preferences and to speak at key moments. These patterns are consistent with the conclusion that white participants are more likely to set the deliberative agenda and to have the final say. These racial disparities are not merely an artifact of having preference allies. Nor do they consistently disappear by adding another person of color to the group.
Not only do white members exercise more voice, they also enjoy more uptake in the discussion. That is, the preferences of people of color are much less discussed. The crucial circumstance for deliberation is when a member disagrees with their group, and it is there that white members are most clearly advantaged by their race: other members discuss whites’ divergent preferences more often than the divergent preferences of people of color. This finding also suggests a possible source of the race gap in voice. POC members may hesitate to attempt to exercise authority if they accurately perceive their speech will not be well received by a white-majority group. However, this notion requires additional tests before it can become a firm conclusion.
If race shapes voice and authority, does that matter to the substance of the discussion? The evidence here suggests it may indeed matter. POC and white members use some different language when they speak—suggesting that when people of color participate less, a distinctive perspective is lost from the deliberation. To be sure, people do not approach the task at hand in fundamentally different ways, and the topics they address do not differ by race. However, POC members are more likely than white members to emphasize words indicating the harm corporations may inflict on ordinary people and to raise considerations of fairness.
Taken together, our results suggest the importance of authority during discussion. The concept of authority matters to theories of deliberation, in that status gaps in authority disrupt the deliberative ideal of the “forceless force” of the better argument and equal standing in the exchange of reasons and evidence. How authority is instantiated during deliberation should thus feature much more prominently in the deliberation literature. These results also speak to research on representation. Scholarship has already shown that racialized communities are physically underrepresented in settings where vital decisions are made about their interests (Einstein, Glick, and Palmer Reference Einstein, Glick and Palmer2019; Nuamah and Ogorzalek Reference Nuamah and Ogorzalek2021). And it has already found that white members exercise more influence over group decisions (Karpowitz et al. Reference Karpowitz, Mendelberg, Elder and Ribar2023). This study contributes a missing piece to this picture: race also shapes representation during the discursive process of reaching decisions.
Methodologically, this study also advances scholarship in three ways. The variables we developed to measure authority offer insights into how status becomes instantiated in discussion. Random assignment to groups, coupled with transcripts of what was said, allows us to test the effect of racial diversity on discussion. Finally, linking the content of discussion with private views allows us to measure how well discussion represents genuine preferences.
That said, this study is only one step on the road to a more complete view of how race shapes group discussion. Though our dataset includes a large number of groups, we are not able to link every transcript line to an individual. While the linkage process did not introduce systematic biases, missing data limit our statistical power in some analyses.
Likewise, although our sample is larger than existing studies of race and discussion, it lacks enough individuals of color to assess how dynamics change when people of color form the majority, or when people of color are not pooled into one category of analysis. These important questions should be addressed in future work. There is reason to think white jurors may participate more even when in the minority: by controlling for the number of jurors sharing someone’s preference, we show that even white jurors with few allies sharing their preferences participate more often than POC jurors in the same predicament (see also Karpowitz et al. Reference Karpowitz, Mendelberg, Elder and Ribar2023).
In addition, the results should be replicated with observational and qualitative data drawn from naturally occurring groups. Our design leverages the advantages of internal validity; its predictable disadvantage of external validity should be addressed in future research.
In addition, our study examines group deliberation within the context of a jury, which features a defined task with specific rules and expectations, such as the unanimity requirement, the presence of a foreperson who “presided” over the group’s work, and formal instructions from the judge about the jury’s purpose and the relevant features of the law. More work remains to be done to explore other contexts and institutional features of small-group decision making, such as different decision rules, group tasks, leadership structures, and methods of facilitation or moderation.
Finally, there is still more to learn about the dynamics of deliberative interaction. Are the preferences discussed in a positive, negative, or neutral way? When people of color speak up, do white deliberators’ responses build or sap the authority of POC speakers? These are some of the important elements of voice and authority we were not able to measure (Karpowitz and Mendelberg Reference Karpowitz and Mendelberg2014).
While a first step, this study indicates the need to carefully examine and better understand deliberative equality and inequality in the words people speak. In deliberation, authority is produced through acts of discursive participation. We have shown that people of color experience systematic disadvantage in voice and authority that is not resolved merely by adding another person of color to the group. Better understanding of the nature of that disadvantage—and how to ameliorate it—is worth further research.
Supplementary material
To view supplementary material for this article, please visit http://doi.org/10.1017/S1537592724002068.
Data Replication
Data replication sets are available in Harvard Dataverse at: https://doi.org/10.7910/DVN/6OJZQL (Elder, Karpowitz, and Mendelberg Reference Elder, Karpowitz and Mendelberg2025).
Acknowledgments
We thank David Schkade for generously providing access to the data. Abdullah Aydogan, David Ribar, Grace Bates, Risa Gelles-Watnick, Tori Gorton, Katherine Hose, Hanying Jiang, Jacob Lunt, Camden Reese, Natalie Reese, and Rebecca Wright contributed outstanding research assistance. A previous draft of this manuscript was presented at the annual meeting of the American Political Science Association, and we thank Fabian Neuner for helpful and constructive comments at the conference. We also thank the editors and anonymous reviewers for their encouragement, thoughtful insights, and suggestions for further improvement. This research was supported by grants from the Russell Sage Foundation (Grant ID G-2111-34915), the John Simon Guggenheim Fellowship, Princeton University, and Brigham Young University. The authors declare that they have no competing interests.
Data Availability Statement
Code used to produce all of the analysis in the manuscript and supplementary materials can be found at https://doi.org/10.7910/DVN/6OJZQL. This archive also includes the data needed to produce all the results. For speech content data, many of the original transcripts contained the first and/or last names of study participants. The versions of the transcripts in this archive were altered to preserve the anonymity of the participants, while still allowing readers and code processes to consistently identify individuals throughout transcripts: for each name in the transcript, we randomly selected a unique replacement name to substitute throughout the text. For example, every time the name “Jane” appears in a transcript, it would be replaced with “Mary.” Because different names can be treated slightly differently by various text processing steps, point estimates calculated using the altered transcripts deviate slightly from the estimates in the published paper, though all substantive patterns observed in the original analysis are robust to these changes.
Please contact the authors for access to the original transcripts and the key file used to replace names, pending scientific review and a completed material transfer agreement. Requests for the transcript data should be submitted to the corresponding author.


 Open access