


1. Introduction
Industrial wood pellets are recognized as a renewable energy source in several countries and have increasingly supplemented (or even displaced) fossil fuels in power generation. European nations have been especially proactive, repurposing coal-fired power plants to use wood pellets for electricity and heat production (Dale et al. Reference Dale, Kline, Parish, Cowie, Emory, Malmsheimer, Slade, Smith, Wigley, Bentsen, Berndes, Bernier, Brandão, Chum, Diaz-Chavez, Egnell, Gustavsson, Schweinle, Stupak, Trianosky, Walter, Whittaker, Brown, Chescheir, Dimitriou, Donnison, Goss Eng, Hoyt, Jenkins, Johnson, Levesque, Lockhart, Negri, Nettles and Wellisch2017; Rodriguez Franco Reference Rodriguez Franco2022). The widespread use of wood pellets for energy production in the European Union (EU) has increased its reliance on imports, mostly from Russia, Belarus, Ukraine, and the United States (Trade Data Monitor 2025). The EU now ranks among the world’s largest importers of wood pellets, with annual imports exceeding $1 billion in recent years (Trade Data Monitor 2025; United Nations 2025).
Russia invaded Ukraine in February 2022, deepening tensions with the EU (Meissner Reference Meissner2024). Sanctions have been the primary response by the EU (Giumelli Reference Giumelli2024; Pertiwi Reference Pertiwi2024). In 2022, the EU placed four types of sanctions on Russia: individual sanctions, economic sanctions, diplomatic measures, and visa measures. Wood pellets were included in the sanction package that was adopted in April 2022, which banned imports of wood products from Russia and its ally, Belarus (European Council 2024; Ireland Reference Ireland2024). Although not directly involved in the conflict, Belarus faced sanctions due to its support for the invasion (Welt Reference Welt2023).
Although Russia and Belarus accounted for more than 40% of total wood pellet exports to the EU prior to the sanctions, imports from both countries plummeted in 2022 and were nearly zero throughout 2023 and 2024 (Ireland Reference Ireland2024; Trade Data Monitor 2025). This sharp decline raises important questions about the impact of sanctions and how the conflict and resulting trade barriers have affected competing exporters in the EU market. These developments are not isolated; they reflect broader dynamics in international trade, where economic sanctions often produce uneven outcomes, where some countries face trade losses while others may benefit from shifting demand.
In this study, we quantify the impacts of the Russia-Ukraine conflict on the United States and other major wood pellet exporters in the EU market. We first estimate EU import demand using a differenced version of the Almost Ideal Demand System (AIDS) model to examine competition across exporting countries (Deaton and Muellbauer Reference Deaton and Muellbauer1980; Seale, Marchant, and Basso Reference Seale, Marchant and Basso2003). An important objective is to assess how economic sanctions reshaped international trade flows. Trade disruptions pose a challenge for modeling import demand, as prices are unobservable when trade does not occur (Arnade, Pick, and Gehlhar Reference Arnade, Pick and Gehlhar2005). Common approaches to handling zero trade flows and unobserved prices in demand analysis include aggregating observations to higher levels, thereby eliminating zeros, or excluding zero‑trade observations from the estimation sample (Muhammad Reference Muhammad2013). However, aggregation masks underlying substitution behavior, while deleting zero observations risks sample‑selection bias and inconsistent demand estimates (Heckman Reference Heckman1979). To address this issue, we use a choke-price procedure to account for periods of zero trade and unobserved prices (Kuchler and Arnade Reference Kuchler and Arnade2016; Muhammad Reference Muhammad2013; Muhammad and Valdes Reference Muhammad and Valdes2019). By imputing choke prices when imports ceased, this approach preserves data continuity, allowing for the sanction period to be included in the estimation. This is important because periods of tightly binding sanctions provide the clearest insight into their economic consequences.
When a product is unavailable, the relevant economic price is its reservation or choke price, which is the price sufficiently high to drive demand to zero (Feenstra Reference Feenstra2010; Hicks Reference Hicks1940). In this context, sanctions can be represented as an increase in the effective price of targeted imports, sufficient to suppress trade entirely. This captures the implicit additional cost of bypassing or overriding the embargo, allowing trade costs to be inferred as the wedge between the choke price and average price (Kuchler and Arnade Reference Kuchler and Arnade2016).
Drawing on recent empirical analyses of sanctions and trade disruptions (Bukhari et al. Reference Bukhari, Iqbal and Khan2024; Rauf and Aslam Reference Rauf and Aslam2025; Sarfraz Reference Sarfraz, Bukhari and Zafar2025), this paper makes an important contribution by quantitatively examining how geopolitical conflict and accompanying sanctions can reconfigure trade patterns within a strategically important market. Methodologically, the paper contributes to our understanding of exporter competition under extreme policy outcomes by using a procedure that can account for trade disruptions within the context of source-differentiated import demand. While this modeling approach is well established when analyzing seasonal disruptions in trade (Kuchler and Arnade Reference Kuchler and Arnade2016; Muhammad Reference Muhammad2013; Muhammad and Valdes Reference Muhammad and Valdes2019), its application to economic sanctions is particularly novel, providing a framework to assess their tariff equivalent. This is important given the growing use of sanctions as a policy tool, offering policymakers clearer insight into trade, welfare, and the consequences of conflict‑driven economic policies.
Few studies have examined wood pellet demand and trade. Noted exceptions include Atasoy and Zhang (Reference Atasoy and Zhang2025) and Sun and Niquidet (Reference Sun and Niquidet2017), both of which examine EU wood pellet import demand using closely related demand frameworks. Jonsson and Rinaldi (Reference Jonsson and Rinaldi2017) assessed how increased demand for wood pellets in the EU affected global markets but used a spatial equilibrium model. Kristöfel et al. (Reference Kristöfel, Strasser, Schmid and Morawetz2016) estimated the supply and demand for wood pellets in a particular EU country (Austria) using a simultaneous equations model. Oh and Suh (Reference Oh and Suh2024) examined wood pellet exports and imports in Asia, noting that countries like Vietnam, Malaysia, and Indonesia experienced a surge in wood pellet production and exports, while countries like South Korea experienced a significant increase in imports. Although work has begun to address wood pellet trade, empirical research examining exporter competition remains limited, underscoring the need for further analysis.
The remainder of this paper proceeds as follows. In the next section, we provide background information on the EU wood pellet sector, highlighting the influence of policies, key trading partners, import trends, and price dynamics. Following that, we introduce the empirical model and estimation procedure, which includes a framework for analyzing import demand under trade disruptions. Next, we present the results. This includes an assessment of qualitative outcomes, estimated expenditure and price effects, and trade losses and gains using implied tariff measures. Finally, we conclude by summarizing key findings and implications.
2. Background
The demand for imported wood pellets in the EU is driven by a policy framework that treats woody biomass as carbon neutral, where renewable energy mandates, coupled with subsidies and incentives, have created a market for wood pellets over other types of renewable energy (Flach and Bolla Reference Flach and Bolla2023; Sikkema et al. Reference Sikkema, Steiner, Junginger, Hiegl, Hansen and Faaij2011). The primary driver of EU demand and import growth is the Renewable Energy Directive (RED), first established in 2009 to promote the use of renewable energy sources across member states (European Commission 2025). This legal framework is aimed at improving the development of clean energy in all sectors of the EU economy. The first target was a 20% share of renewable energy by 2020. In 2018, the EU revised the RED (REDII) to a higher renewable energy target of 32% by 2030 (European Commission 2025). The directive was further updated in 2023 (REDII+) to 42.5% by 2030 (Flach and Bolla Reference Flach and Bolla2024). In addition to RED policies, the “Clean Energy for all Europeans” package was introduced in 2019 to strengthen the infrastructure to handle the transition towards cleaner energy (Büscher, Holtermann, and Lang Reference Büscher, Holtermann and Lang2022). The European Green Deal, which set a goal for the EU to be carbon neutral by 2050, was also introduced in 2019 (Flach and Bolla Reference Flach and Bolla2024, Reference Flach and Bolla2023). Together, these measures have sustained the demand for wood pellet imports.
Although wood pellets are recognized as renewable and an alternative to fossil fuels (Parish et al. Reference Parish, Herzberger, Phifer and Dale2018), there are opposing views. Supporters view wood pellets as a carbon-neutral energy source based on carbon accounting, which assumes that emissions from burning biomass are offset by forest regrowth. That is, while the burning of wood pellets releases carbon dioxide into the atmosphere, their production (via tree growth) sequester and capture carbon, offsetting the released (Hanssen et al. Reference Hanssen, Duden, Junginger, Dale and Van Der Hilst2017; Ireland Reference Ireland2018; Schlesinger Reference Schlesinger2018). Critics, however, have pointed to limitations in carbon accounting, pollution from wood pellet production facilities, increased emissions from combustion, deforestation, and the use of whole-tree biomass for production rather than forest byproducts (Drouin Reference Drouin2015; Schlesinger Reference Schlesinger2018; Speare-Cole Reference Speare-Cole2021). However, proponents argue that when wood pellets are sourced sustainably and managed responsibly, they can contribute to reducing greenhouse gas emissions (Hanssen et al. Reference Hanssen, Duden, Junginger, Dale and Van Der Hilst2017). Despite concerns, industrial wood pellets remain a strategically important component of the EU’s renewable energy portfolio (Flach and Bolla Reference Flach and Bolla2024, Reference Flach and Bolla2023).
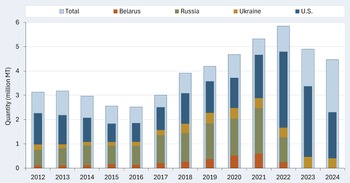
The EU relies significantly on wood pellet imports to meet domestic demand. Production and consumption vary widely across member states, reflecting not only differences in resource endowments but also country‑specific policy initiatives (Thrän et al. Reference Thrän, Schaubach, David, Martin, Thuy, Fabian, Olle and Patrick2019; Flach and Bolla Reference Flach and Bolla2024). Demand is primarily met by a small group of major exporting countries: Russia, Belarus, Ukraine, and the United States (Sikkema et al. Reference Sikkema, Steiner, Junginger, Hiegl, Hansen and Faaij2011). Figure 1 shows the evolution of EU wood pellet imports from these sources over time, highlighting key trends in trade volume. From 2016 to 2021, these partner countries experienced substantial growth. Despite the sanctions, total import volume peaked in 2022, increasing from 2.5 million metric tons (MMT) in 2016 to more than 5.8 MMT by 2022, an increase of 131.8%. During this period, imports of U.S. wood pellets increased by around 303.7% reaching 3.1 MMT by 2022, and imports from Ukraine increased by 142.7%. From 2016 to 2021, imports from Belarus and Russia grew 310.7% and 143.3%, respectively, reaching 0.59 MMT and 1.9 MMT. As shown in the figure, imports from Russia and Belarus declined from peak levels in 2021 to near-zero quantities in 2023 and 2024 as sanctions effectively curtailed trade with both countries. The United States emerged as the dominant supplier during this period.
EU wood pellet imports by source: 2012–2024.
Source: Trade Data Monitor® (2025).
Note: Wood pellets are defined according to the Harmonized System (HS) for classifying traded products: HS 4401.31 wood pellets. MT is metric tons.

Figure 1. Long description
A stacked bar graph compares E U wood pellet imports by source from 2012 to 2024. The horizontal axis represents the years from 2012 to 2024, and the vertical axis represents the quantity in million metric tons. The graph includes five data series represented by different colors: Total (light blue), Belarus (orange), Russia (green), Ukraine (yellow), and U S (dark blue). Each bar is divided into segments corresponding to the contributions from each country. Notable trends include a general increase in total imports over time, with significant contributions from Russia and the U S. In 2022, there is a noticeable drop in imports from Russia and Belarus due to sanctions, while imports from the U S and Ukraine increase. The graph highlights the impact of geopolitical events on wood pellet imports.
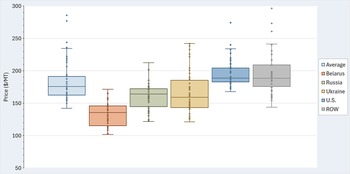
In the EU, import prices varied significantly across Belarus, Russia, Ukraine, the United States, and ROW. Figure 2 contains box plots of import prices by source (not adjusted for inflation), where the boxes denote the interquartile range and the error bars represent the minimum and maximum “non‑outlier” values. As shown in Figure 2, Belarus had the lowest average price at $138.00/MT during the study period (Q1 2012–Q4 2024), followed by Russia at $162.00/MT. Ukraine’s average was $172.00/MT, while the U.S. and ROW had the highest averages at $195.00/MT and $197.00/MT, respectively. Notably, 2022 marked a peak year for Belarus, Russia, Ukraine, and ROW, with all four reaching their highest annual average prices that year. Belarus peaked at $192.74/MT, Russia at $198.00/MT, Ukraine at a striking $287.74/MT, and ROW at $266.34/MT. The U.S., however, reached its highest price of $233.06/MT in early 2023, indicating a delayed but significant response to global supply disruptions. Overall, there was an upward trend in prices starting in 2022, with the U.S. and ROW stepping in as alternative sources following the decline in imports from Russia and Belarus.
Wood pellet import prices in the EU by source: Q1 2012–Q4 2024.
Source: Trade Data Monitor® (2025).
Note: Wood pellets are defined according to the Harmonized System (HS) for classifying traded products: HS 4401.31 wood pellets. MT is metric tons. The boxes represent the median intake value and interquartile range (IQR); error bars represent the minimum and maximum values, exclusive of outliers.

3. Model and estimation
3.1. Import demand model
Wood pellets are assumed differentiated by country of origin and treated as imperfect substitutes across exporting countries. Although wood pellets can be homogeneous in their physical characteristics, they may still be treated as source-differentiated in analysis. This assumption is reasonable given that import preferences and trade policies are often exporter specific. Even if a commodity is not physical different based on its country of origin, accounting for source remains essential for accurately capturing dynamics across exporting countries (Muhammad Reference Muhammad2012).
Let p and q denote the price and quantity of imported wood pellets, and the subscripts g and h denote the exporting source. We can denote the price and quantity of wood pellets from country g as p
g
and q
g
, respectively. Let the total expenditure on all wood pellet imports be represented as $E={\sum }_{g=1}^{n}E_{g}$
, where E
g
= p
g
q
g
is the value of imports from country g and n is the total number of exporting countries in the system. If we denote the import share for an exporting country as
$E={\sum }_{g=1}^{n}E_{g}$
, where E
g
= p
g
q
g
is the value of imports from country g and n is the total number of exporting countries in the system. If we denote the import share for an exporting country as $s_{g}={E_{g} \over E}$
, the first-differenced AIDS model can be specified as follows (Muhammad Reference Muhammad2013; Seale, Marchant, and Basso Reference Seale, Marchant and Basso2003):
$s_{g}={E_{g} \over E}$
, the first-differenced AIDS model can be specified as follows (Muhammad Reference Muhammad2013; Seale, Marchant, and Basso Reference Seale, Marchant and Basso2003):
 $$\Delta s_{gt}=\alpha _{g}\Delta \ln \left({E_{t} \over P_{t}}\right)+\sum \limits_{h=1}^{n}\gamma _{gh}\Delta \ln p_{ht}+\phi _{1g}\cos \left({2\pi t \over 4}\right)+\phi _{2g}\sin \left({2\pi t \over 4}\right)+\mu _{gt}$$
Δs
gt
= s
gt
− s
gt − 1 is the differenced import share, Δln E
t
= ln E
t
− ln E
t − 1 and Δln p
ht
= ln p
ht
− ln p
ht − 1 are the total expenditure and hth import price in log differences, and Δln P
t
is the Divisia price index: $\Delta \ln P_{t}={\sum }_{g=1}^{n}\overline{s}_{gt}\Delta \ln p_{gt}$
, where
$\Delta \ln P_{t}={\sum }_{g=1}^{n}\overline{s}_{gt}\Delta \ln p_{gt}$
, where $\overline{s}_{gt}=0.5(s_{gt}+s_{gt-1})$
is the average import share between periods t and t−1. The cosine and sine terms are added to account for seasonality or cyclical patterns in the data (Arnade, Pick, and Gehlhar Reference Arnade, Pick and Gehlhar2005; Muhammad Reference Muhammad2013).Footnote
1
The differenced AIDS model is linear in coefficients and is therefore easy to estimate, and first differencing variables for empirical analysis alleviate problems of nonstationarity (Matsuda Reference Matsuda2005). Unlike demand models that require logged quantities, the AIDS model can accommodate zero trade values (Muhammad Reference Muhammad2013).
$\overline{s}_{gt}=0.5(s_{gt}+s_{gt-1})$
is the average import share between periods t and t−1. The cosine and sine terms are added to account for seasonality or cyclical patterns in the data (Arnade, Pick, and Gehlhar Reference Arnade, Pick and Gehlhar2005; Muhammad Reference Muhammad2013).Footnote
1
The differenced AIDS model is linear in coefficients and is therefore easy to estimate, and first differencing variables for empirical analysis alleviate problems of nonstationarity (Matsuda Reference Matsuda2005). Unlike demand models that require logged quantities, the AIDS model can accommodate zero trade values (Muhammad Reference Muhammad2013).
α
g
, γ
gh
, φ
1g
, and φ
2g
are fixed parameters to be estimated, and μ
gt
is a random disturbance term. According to theory, the following parameter restrictions should hold true: $\sum _{g}\alpha _{g}=\sum _{g}\gamma _{gh}=\sum _{g}\phi _{1g}=\sum _{g}\phi _{2g}=0$
(adding-up);
$\sum _{g}\alpha _{g}=\sum _{g}\gamma _{gh}=\sum _{g}\phi _{1g}=\sum _{g}\phi _{2g}=0$
(adding-up); $\sum _{h}\gamma _{gh}=0$
(homogeneity); and γ
gh
= γ
hg
(symmetry) (Seale, Marchant, and Basso Reference Seale, Marchant and Basso2003). These restrictions are imposed on the model for estimation.
$\sum _{h}\gamma _{gh}=0$
(homogeneity); and γ
gh
= γ
hg
(symmetry) (Seale, Marchant, and Basso Reference Seale, Marchant and Basso2003). These restrictions are imposed on the model for estimation.
From Equation (1), we can derive the marginal import share: $\vartheta _{g}={\partial E_{g} \over \partial E}=\alpha _{g}+s_{g}$
, which is the additional expenditure on imports from country g given a unit increase in aggregate import expenditures, and the conditional expenditure elasticity:
$\vartheta _{g}={\partial E_{g} \over \partial E}=\alpha _{g}+s_{g}$
, which is the additional expenditure on imports from country g given a unit increase in aggregate import expenditures, and the conditional expenditure elasticity: $\varepsilon _{g}={\partial E_{g} \over \partial E}{E \over E_{g}}={\vartheta _{g} \over s_{g}}=1+{\alpha _{g} \over s_{g}}$
, which is the same relationship but in percentage terms. From Equation (1), we can also derive the uncompensated own- (g = h) and cross- (g ≠ h) price elasticity as follows (Chalfant Reference Chalfant1987; Green and Alston Reference Green and Alston1991):
$\varepsilon _{g}={\partial E_{g} \over \partial E}{E \over E_{g}}={\vartheta _{g} \over s_{g}}=1+{\alpha _{g} \over s_{g}}$
, which is the same relationship but in percentage terms. From Equation (1), we can also derive the uncompensated own- (g = h) and cross- (g ≠ h) price elasticity as follows (Chalfant Reference Chalfant1987; Green and Alston Reference Green and Alston1991):
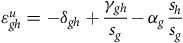 $${\varepsilon }_{gh}^{u}=-\delta _{gh}+{\gamma _{gh} \over s_{g}}-\alpha _{g}{s_{h} \over s_{g}}$$
Note that δ gh is the Kronecker delta where δ gh = 1 when g = h and 0 otherwise.
3.2. Choke price procedure
The choke price procedure is a methodological approach for addressing zero trade flows and unobserved prices in demand analysis. This procedure is particularly useful in cases when trade is disrupted, either due to prohibitive policies or other market disruptions. By estimating the price at which import demand would fall to zero (the choke price), we can incorporate zero-trade observations into the analysis (Muhammad Reference Muhammad2013).
To derive the choke price, we start with a general own-price elasticity equation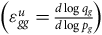 $\left({\varepsilon }_{gg}^{u}={d\log q_{g} \over d\log p_{g}}\right)$
. This can be rearranged to get the following relationship:
$\left({\varepsilon }_{gg}^{u}={d\log q_{g} \over d\log p_{g}}\right)$
. This can be rearranged to get the following relationship: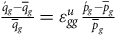 ${\acute{q}_{g}-\overline{q}_{g} \over \overline{q}_{g}}={\varepsilon }_{gg}^{u}{\acute{p}_{g}-\overline{p}_{g} \over \overline{p}_{g}}$
. This indicates that we can relate proportional deviations from the average quantity
${\acute{q}_{g}-\overline{q}_{g} \over \overline{q}_{g}}={\varepsilon }_{gg}^{u}{\acute{p}_{g}-\overline{p}_{g} \over \overline{p}_{g}}$
. This indicates that we can relate proportional deviations from the average quantity $(\overline{q}_{g})$
to proportional deviations from the average price
$(\overline{q}_{g})$
to proportional deviations from the average price $(\overline{p}_{g})$
. Setting
$(\overline{p}_{g})$
. Setting $\acute{q}_{g}$
= 0 and then solving for
$\acute{q}_{g}$
= 0 and then solving for $\acute{p}_{g}$
results in the following:
$\acute{p}_{g}$
results in the following:
 $$\acute{p}_{g}=\left({{\varepsilon }_{gg}^{u}-1 \over {\varepsilon }_{gg}^{u}}\right)\overline{p}_{g}$$
Equation (3) is the choke price, that is, the price at which the quantity decreases from its mean value to zero. Equations (1), (2), and (3) can be used in a stepwise estimation procedure (Kuchler and Arnade Reference Kuchler and Arnade2016; Muhammad Reference Muhammad2013).
3.3. Deriving implied tariffs
By comparing the choke price to an observed average price, we can infer the implicit trade barrier. This approach would be similar to the price-wedge approach discussed in previous studies (Yue, Beghin, and Jensen Reference Yue, Beghin and Jensen2006). The implied tariff rate (τ) for a sanctioned country is straight forward: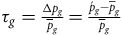 $\tau _{g}={\Delta p_{g} \over \overline{p}_{g}}={\acute{p}_{g}-\overline{p}_{g} \over \overline{p}_{g}}$
. This states that the implied tariff for Russia or Belarus will be the proportionate difference in their choke price (p´
g
) and average price
$\tau _{g}={\Delta p_{g} \over \overline{p}_{g}}={\acute{p}_{g}-\overline{p}_{g} \over \overline{p}_{g}}$
. This states that the implied tariff for Russia or Belarus will be the proportionate difference in their choke price (p´
g
) and average price $(\overline{p}_{g})$
. The implied tariff for a non-targeted country is as follows (Becko Reference Becko2024):
$(\overline{p}_{g})$
. The implied tariff for a non-targeted country is as follows (Becko Reference Becko2024):
 $$\tau _{h}={\Delta p_{h} \over p_{h}}={{\varepsilon }_{hg}^{u} \over {\varepsilon }_{hh}^{u}}{\Delta p_{g} \over \overline{p}_{g}}$$
Note that Equation (4) captures the relationship between the sanctioned country and a non-targeted country through their cross-price effect $\left({\varepsilon }_{hg}^{u}\right)$
. When imports are substitutes
$\left({\varepsilon }_{hg}^{u}\right)$
. When imports are substitutes $\left({\varepsilon }_{hg}^{u} \gt 0\right)$
, τ
h
< 0, which indicates an implied subsidy (i.e., negative tariff).
$\left({\varepsilon }_{hg}^{u} \gt 0\right)$
, τ
h
< 0, which indicates an implied subsidy (i.e., negative tariff).
Differences in actual trade values before and after the sanction could also be used to derive implied tariffs. If observed quantity differences are due to recent trade actions, then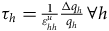 $\tau _{h}={1 \over {\varepsilon }_{hh}^{u}}{\Delta q_{h} \over q_{h}}\forall h$
(Becko Reference Becko2024). The product of the inverted own-price elasticity and proportionate quantity change gives the price change needed for that quantity change:
$\tau _{h}={1 \over {\varepsilon }_{hh}^{u}}{\Delta q_{h} \over q_{h}}\forall h$
(Becko Reference Becko2024). The product of the inverted own-price elasticity and proportionate quantity change gives the price change needed for that quantity change: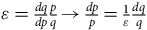 $\varepsilon ={dq \over dp}{p \over q}\rightarrow {dp \over p}={1 \over \varepsilon }{dq \over q}$
. However, take the following general equation: q = f(u) where u = p(1+τ); p is the price and τ is the tariff rate. If we define the own-price elasticity (ϵ) as
$\varepsilon ={dq \over dp}{p \over q}\rightarrow {dp \over p}={1 \over \varepsilon }{dq \over q}$
. However, take the following general equation: q = f(u) where u = p(1+τ); p is the price and τ is the tariff rate. If we define the own-price elasticity (ϵ) as ${\partial f \over \partial u}{u \over q}$
, we get the following relationship:
${\partial f \over \partial u}{u \over q}$
, we get the following relationship: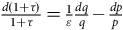 ${d(1+\tau ) \over 1+\tau }={1 \over \varepsilon }{dq \over q}-{dp \over p}$
. This suggests that the implied tariff associated with an observed quantity change should be adjusted to account for actual price movements:
${d(1+\tau ) \over 1+\tau }={1 \over \varepsilon }{dq \over q}-{dp \over p}$
. This suggests that the implied tariff associated with an observed quantity change should be adjusted to account for actual price movements:
 $$\tau _{h}={1 \over {\varepsilon }_{hh}^{u}}{\Delta q_{h} \over q_{h}}-{\Delta p_{h} \over p_{h}}$$
Equation (5) represents the implied tariff derived from observed changes in trade flows, while Equation (4) is based on choke prices and estimated trade relationships. The difference between these two measures underscores the difference between actual market responses and expected outcomes based on historical substitution patterns. Implied tariffs from actual trade data reflect the economic impact of sanctions and can be interpreted as real trade costs. In contrast, implied tariffs from the choke price procedure could be interpreted as expected trade costs based on the estimated cross-price elasticities. Comparing these measures enables an assessment of how observed trade flows aligned with anticipated trade shifts.
3.4. Data and estimation
We used quarterly import data (Q1 2012–Q4 2024) from the World Trade Atlas® Database to estimate EU wood pellet import demand by source. We considered the following product category for the analysis: HS 4401.31 wood pellets. The exporting countries included the analysis are the following: Russia, Belarus, Ukraine, the United States, and ROW.
We estimate the import demand system represented by Equation (1) using the generalized Gauss-Newton method in TSP (version 5.0), which is a maximum likelihood procedure for equation systems (Hall and Cummins Reference Hall and Cummins2009). We test for autoregressive disturbances using a procedure for singular equation systems (Beach and MacKinnon Reference Beach and MacKinnon1979). We estimate the model using the full data series, which includes the sanction period.
Equations (1), (2), and (3) are estimated using a stepwise procedure, repeated until convergence. Equation (1) is first estimated using average prices $(\overline{p}_{g})$
for Belarus and Russia. Average prices are then used as imputed prices for all zero observations to estimate the model. The model estimates are then used to derive the corresponding own-price elasticities according to Equation (2). Using the elasticity values, we then derive new choke prices using Equation (3), which are used as updated imputed prices for the second estimation round. The process is repeated until the difference between the updated values and previous values are zero.
$(\overline{p}_{g})$
for Belarus and Russia. Average prices are then used as imputed prices for all zero observations to estimate the model. The model estimates are then used to derive the corresponding own-price elasticities according to Equation (2). Using the elasticity values, we then derive new choke prices using Equation (3), which are used as updated imputed prices for the second estimation round. The process is repeated until the difference between the updated values and previous values are zero.
Muhammad (Reference Muhammad2013) notes that this procedure converges to the same choke price and own-price elasticity value regardless of assumed starting values. Results of the choke price procedure are reported in Table 1. The model converged after seven estimation rounds, resulting in choke prices of $189.01/MT for Belarus and $238.46/MT for Russia. The corresponding uncompensated own-price elasticities are −2.33 and −1.98, respectively. Average import prices prior to the sanctions were $132.08/MT for Belarus and $157.88/MT for Russia. The corresponding own price elasticities at average prices are −2.00 and −1.07. It could be argued that the sanctions made import demand more elastic, but not in the sense of preference changes. By restricting access to specific suppliers, the sanctions increased substitution toward alternative sources, raising the effective elasticity of import demand facing sanctioned exporters.
Results of choke price procedure

Table 1. Long description
The table presents data on the choke price procedure for Belarus and Russia across seven estimation rounds. It includes columns for estimation round, country, starting elasticity, choke price in dollars per metric ton, ending elasticity, and the difference between starting and ending elasticity. The table has seven rows for each country, detailing the values for each estimation round. For example, in the first round, Belarus has a starting elasticity of -2.00, a choke price of $195.30, an ending elasticity of -2.09, and a difference of -0.10. Russia, in the same round, has a starting elasticity of -1.07, a choke price of $231.53, an ending elasticity of -2.17, and a difference of -1.09. The table continues this pattern for all seven rounds, showing the changes in elasticity and choke price for both countries.
Notes: Standard errors are in parenthesis. Choke prices are $US per metric ton (MT). Difference is based on the ending and starting elasticities.
4. Empirical results
4.1. Changes in exporter competition
Table 2 summarizes changes in EU wood pellet imports by source between 2021 and 2023/24, highlighting significant shifts in trade patterns, volumes, and prices. We exclude 2022 because sanctions were imposed mid-year. 2020 is excluded due to the pandemic. Between these two periods, total EU import value increased from approximately $905 million to $1.08 billion, representing a 19.7% increase. This occurred despite a decline in aggregate import quantities of nearly 12%. The difference between value and quantity reflects a substantial increase in prices, with the average price (across all countries) increasing by 35.7%, from $170/MT to $231/MT.
Import comparisons before (2021) and after (2023/24) sanctions

Table 2. Long description
The table compares changes in EU wood pellet imports by source between 2021 and 2023/24. It includes data for the World, Belarus, Russia, Ukraine, U.S., and ROW. The table has six columns: Source, Variable, 2021, 2023/24, Change, and % Change. The variables include Value ($ million), Quantity (MMT), and Price ($/MT). Row 1: World, Value ($ million), 2021, 905.11, 2023/24, 1083.56, Change, 178.44, % Change, 19.72. Row 2: World, Quantity (MMT), 2021, 5.32, 2023/24, 4.68, Change, -0.63, % Change, -11.91. Row 3: World, Price ($/MT), 2021, 170.19, 2023/24, 230.96, Change, 60.77, % Change, 35.70. Row 4: Belarus, Value ($ million), 2021, 64.65, 2023/24, 0.04, Change, -64.62, % Change, -99.95. Row 5: Belarus, Quantity (MMT), 2021, 0.59, 2023/24, 0.00, Change, -0.59, % Change, -99.95. Row 6: Belarus, Price ($/MT), 2021, 108.90, 2023/24, N/A, Change, N/A, % Change, N/A. Row 7: Russia, Value ($ million), 2021, 304.80, 2023/24, 0.03, Change, -304.77, % Change, -99.99. Row 8: Russia, Quantity (MMT), 2021, 1.88, 2023/24, 0.00, Change, -1.88, % Change, -99.99. Row 9: Russia, Price ($/MT), 2021, 162.08, 2023/24, N/A, Change, N/A, % Change, N/A. Row 10: Ukraine, Value ($ million), 2021, 68.02, 2023/24, 89.57, Change, 21.55, % Change, 31.68. Row 11: Ukraine, Quantity (MMT), 2021, 0.41, 2023/24, 0.44, Change, 0.03, % Change, 6.22. Row 12: Ukraine, Price ($/MT), 2021, 165.36, 2023/24, 202.95, Change, 37.60, % Change, 22.74. Row 13: U.S., Value ($ million), 2021, 346.35, 2023/24, 555.87, Change, 209.53, % Change, 60.50. Row 14: U.S., Quantity (MMT), 2021, 1.78, 2023/24, 2.40, Change, 0.62, % Change, 34.88. Row 15: U.S., Price ($/MT), 2021, 194.45, 2023/24, 229.96, Change, 35.51, % Change, 18.26. Row 16: ROW, Value ($ million), 2021, 121.29, 2023/24, 438.05, Change, 316.75, % Change, 261.14. Row 17: ROW, Quantity (MMT), 2021, 0.65, 2023/24, 1.85, Change, 1.19, % Change, 183.30. Row 18: ROW, Price ($/MT), 2021, 186.23, 2023/24, 238.11, Change, 51.88, % Change, 27.86.
Source: Trade Data Monitor® (2025).
Note: 2023/24 is the annual average for the two periods. Wood pellets are defined according to the Harmonized System (HS) for classifying traded products: HS 4401.31 wood pellets. ROW is rest of world.
These aggregate changes mask significant differences across exporting countries. Imports from Belarus and Russia, which together accounted for a sizable share of EU wood pellet imports in 2021, declined by nearly 100% in both value and quantity by 2023/24. Imports from Belarus fell from $64.7 million (0.59 MMT) to virtually zero, while imports from Russia declined from $305 million (1.88 MMT) to negligible levels.
In contrast, the EU substantially increased wood pellet imports from alternative suppliers. U.S. wood pellet shipments to the EU expanded markedly, with import values rising by over 60% and quantities increasing by nearly 35%. Ukraine also experienced growth, with a moderate increase in quantity, alongside rising prices. The most pronounced expansion occurred among imports from ROW, where quantities nearly tripled and values more than quadrupled, indicating both supply reallocation and price escalation.
The combined import value from Russia and Belarus exceeded that of the United States beginning in 2021. However, as imports from these countries declined to zero or negligible levels in 2023/24, the United States substantially increased its share of EU wood pellet imports: from 38.3% in 2021 to 51.3% in 2023/24. Ukraine also expanded its presence in the EU market, although the increase was modest. Particularly notable is the growth in imports from ROW countries, which collectively accounted for 40.4% of EU wood pellet imports in 2023/24, compared with just 13.4% in 2021. Overall, Table 1 highlights a pronounced shift in EU wood pellet import demand away from sanctioned suppliers toward the United States and ROW exporters, coinciding with supportive policies, supply tightening induced by the sanctions, and rising prices.
4.2. Import demand estimates
The next step is to translate these observed changes in trade patterns into implied trade cost measures, expressed as tariff‑ and subsidy‑equivalent values. Because these trade cost measures are constructed from estimated own‑ and cross‑price elasticities, it is necessary to first examine and discuss the elasticity estimates, which form the basis for interpreting the magnitude of the implied trade costs and their economic significance.
Table 3 reports expenditure, own‑price, and cross‑price elasticity estimates, offering direct insight into the trade effects of sanctions imposed on Russia and Belarus. These results should be interpreted with some caution, as the sanction period may have altered underlying demand and substitution patterns relative to normal market conditions. Expenditure elasticities are positive and statistically significant across all suppliers, though their magnitudes differ substantially. Imports from Russia and Belarus exhibit expenditure elasticities of 0.36 and 0.37, respectively, indicating that total import growth translated into less‑than‑proportional increases from these countries. In contrast, the United States displays a markedly higher expenditure elasticity of 1.69, suggesting that increases in EU spending disproportionately favored U.S. exporters during the data period.
Selected elasticity estimates for EU wood pellet import demand

Table 3. Long description
The table presents elasticity estimates for wood pellet import demand across various countries. It includes six rows and four columns. The columns are labeled as Country, Expenditure, Own-price, Cross-price (Belarus), and Cross-price (Russia). The row labels are Belarus, Russia, Ukraine, U.S., and ROW. Each cell contains numerical values with some including standard errors in parentheses. Notable trends include positive expenditure elasticities for all countries, with the U.S. showing the highest value at 1.69. Own-price elasticities are negative for all countries, indicating inverse relationships. Cross-price elasticities vary, with some positive and some negative values, reflecting different substitution patterns.
Note: Asymptotic standard errors are in parentheses. *** 0.01 significance level; ** 0.05 significance level; and * 0.10 significance level. ROW is rest of world.
Own‑price elasticities are negative and elastic in magnitude for all suppliers. For Belarus and Russia, own‑price elasticities of −2.33 and −1.98 imply that a 10 percent increase in prices would reduce import volumes by roughly 23% and 20%, respectively. These large values imply that even relatively modest tariff‑equivalents (on the order of less than 50%) could substantially curtail, or potentially eliminate, trade with these countries. Own‑price elasticities for the United States and Ukraine are negative and statistically significant, with estimates of −1.68 and −2.32, respectively. Interestingly, demand from ROW countries is the least elastic (−1.04) (Table 3).
The cross‑price elasticities can inform substitution patterns driven by sanctions. Ukrainian exports exhibit a positive and statistically significant elasticity of 1.55 with respect to Russian prices and 0.47 with respect to Belarusian prices, indicating strong substitution toward Ukrainian suppliers. Other than Ukraine, cross‑price elasticities involving Russia and Belarus are small and statistically insignificant, suggesting limited competitive interaction between the two sanctioned exporters. Given the relatively large and statistically significant cross‑price elasticities, increases in Russian and Belarusian wood pellet prices would ordinarily be expected to benefit Ukraine through substitution toward Ukrainian exports. However, as shown in the previous section, this substitution did not materialize. Instead, the sanctions primarily benefited exporters in the United States and ROW, while imports from Ukraine remained relatively unchanged. This divergence from historical substitution patterns is likely attributable to war‑related disruptions to production capacity and trade logistics in Ukraine, which constrained its ability to expand supply in response to shifting market conditions (Steinbach Reference Steinbach2023).
4.3. Import changes and implied tariffs
Table 4 presents data and implied tariff estimates for the wood pellet exporting countries across two time periods: 2019–2021 and 2022–2024. The latter starts in Q3 2022 to account for the months in 2022 before the sanctions. The analysis and comparisons are based on average quarterly trade values and quantities. We provide two measures of implied tariffs: one based on observed trade and another derived from choke prices. The implied tariff derived from choke prices reflects what trade cost should have been given historical trade patterns and substitution behavior, while the actual trade-based tariff captures what occurred in the market.
Impact of trade sanctions on EU wood pellet import demand

Table 4. Long description
The table presents data on wood pellet import demand and implied tariffs for various countries over two periods: 2019-2021 and 2022-2024. It includes six columns: Country, Quarterly average ($ million) for 2019-2021 and 2022-2024, Quarterly average (thousand MT) for 2019-2021 and 2022-2024, Implied tariff (%) (Actual trade), and Implied tariff (%) (Choke price). The table has six rows for different countries and a total row. Row 1: Belarus, 15.3, 0.0, -99.9, 124.4, 0.1, -99.9, 43.0 [30.4, 73.0]†, 0.43. Row 2: Russia, 66.6, 1.9, -97.1, 405.4, 9.0, -97.8, 49.4 [34.0, 90.14], 0.51. Row 3: Ukraine, 16.9, 27.1, 60.8, 106.9, 114.3, 6.9, -50.2 [-51.7, -49.5], -42.7 [-67.6, -22.9]. Row 4: U.S., 68.0, 150.3, 121.1, 360.3, 651.6, 80.8, -70.0 [-108.0, -55.2], -9.1 [-21.9, 9.0]. Row 5: ROW, 35.1, 109.1, 211.0, 185.3, 440.7, 137.9, -166.2 [-260.8, -71.7], -5.9 [-34.2, 38.4]. Row 6: Total, 201.8, 288.4, 42.9, 1,182.3, 1,215.7, 2.8.
†The average does not include the first of 2022.
‡95% confidence intervals are in [brackets], derived via Monte Carlo simulations.
Note: ROW is rest of world. The implied tariffs based on choke prices for Belarus and Russia are calculated from the proportional difference between average observed prices and the choke prices listed in Table 2. Because these values are derived directly from price comparisons rather than simulation, no confidence intervals are reported.
A striking feature of the data is the complete collapse in trade with Belarus and Russia, clearly attributable to sanctions. Both countries experienced near-total declines in exports to the EU between the two periods. For instance, the quarterly average for Russia was around $67 million in 2019–2021 but decreased to less than $2 million in 2022–2024. Imports from Belarus fell from around $15 million per quarter to near zero during this period. The implied tariffs based on actual trade are extremely high (43.0% and 49.4%, respectively), suggesting significant barriers to trade. The implied tariffs reflect the impact of sanctions by capturing the gap between expected trade under normal market conditions and the reduced trade observed under sanction-imposed restrictions. Since the choke price method assumes trade falls to zero, the implied tariffs for Belarus and Russia based on choke prices are nearly identical to those based on actual trade flows.
Note that negative tariffs indicate subsidies. Ukraine, the United States, and ROW have benefited from the sanctions. Ukraine’s trade value increased by 60.8% (from $16.9 million to $27.1 million per quarter) and quantity by 6.9%, despite the ongoing conflict. The percentage increase in trade value for Ukraine relative to the modest increase in quantity indicates a significant rise in price. Thus, the benefit to Ukraine has not necessarily been increased sales but rather maintaining similar volumes at significantly higher prices. This results in implied subsidy estimates of 50.2% (actual trade) and 42.7% (choke price). The relatively small difference between the two measures implies that actual trade after the sanctions closely follows expectations.
Unlike Ukraine, the United States experienced an increase in both value (121.1%) and quantity (80.8%), increasing from $68 million (360.3 thousand MT) per quarter in 2019–2021 to $150.3 (651.6 thousand MT) per quarter in 2022–2024. In this case, however, there is a substantial gap between the implied tariff from actual trade (−70.0%) and that based on estimated choke prices (−9.1%). Note that the implied tariff and its confidence interval based on choke prices do not fall within the confidence range of the implied tariff derived from actual trade flows, indicating a significant difference between expected and observed trade. This suggests a purposeful shift in sourcing away from the sanctioned countries. A similar trend is observed for countries grouped under ROW, which experienced even more dramatic growth, 211.0% in value and 137.9% in quantity. The implied tariff based on actual trade is a striking −166.2%, while the choke price tariff is only −5.9%, indicating that actual trade conditions were significantly more favorable than expected based on prior substitution.
4.4. Policy implications
These findings have important implications for renewable energy strategy and the use of trade sanctions in the EU. First, the results demonstrate that sanctions imposed on Russia and Belarus were highly effective in suppressing trade, but not without market consequences. The near‑complete collapse of imports from these countries was accompanied by substantial increases in import prices and a tightening of supply conditions. Average import prices rose sharply following the sanctions, and total import values increased despite a decline in quantities, indicating higher procurement costs for renewable energy inputs. These outcomes suggest that the sanctions raised the effective cost of compliance with decarbonization objectives.
Second, the reallocation of trade toward alternative suppliers, including the United States and a diverse set of smaller exporters, highlights the ability to adapt sourcing under disruption but also reveals limits to substitution. While imports from non‑sanctioned suppliers expanded, these adjustments were accompanied by higher prices and, in some cases, deliberate sourcing beyond historically dominant exporters. This suggests that market responses cannot be fully explained by price‑based substitution alone and may reflect strategic diversification motivated by energy security concerns. It is important to note that despite strong substitution, Ukraine’s export capacity was severely constrained by war‑related disruptions to production, infrastructure, and Black Sea and overland transport routes, limiting its ability to expand wood pellet shipments to the EU (Ahn, Kim, and Steinbach Reference Ahn, Kim and Steinbach2023; Steinbach Reference Steinbach2023).
Third, these findings have direct relevance for EU renewable energy policies, particularly those embedded in the Renewable Energy Directive (RED) and the European Green Deal. Policies that promote woody biomass as a renewable energy source implicitly rely on stable and affordable international supply chains. The experience following the 2022 sanctions illustrates that geopolitical risks can undermine these assumptions, raising costs for utilities and potentially affecting the pace or cost‑efficiency of the energy transition.
5. Conclusion
We examined EU demand for imported wood pellets by source country, applying a demand system framework and a choke price procedure to account for the impact of economic sanctions on Belarus and Russia. The results indicated that EU demand is highly elastic, meaning that price increases lead to disproportionately larger declines in import volumes. Using model estimates, we analyzed trade patterns across two distinct periods (before and after sanctions) to capture the effects of market disruptions and strategic shifts in sourcing. Ukraine, the United States, and ROW countries emerged as key alternative suppliers, with import prices from these regions rising sharply in response to reduced imports from Russia and Belarus.
Implied tariff comparisons served as a useful lens for understanding market dynamics. The estimates, calculated from both actual trade flows and choke prices, provided valuable insight into how trade costs evolved under sanctions. For Russia, Belarus, and Ukraine, the close alignment between the two tariff measures suggests that the observed changes in imports were consistent with expectations based estimated demand relationships. In contrast, the divergence between actual and choke price tariffs for the United States and ROW indicates intentional shifts in sourcing. In some instances, importers were willing to pay higher prices to secure supplies from alternative sources. This suggests that the response to sanctions involved not only increasing imports from major trading partners but also broadening the supplier base to include emerging exporters.
Data availability statement
The data supporting the findings of this study are available from Trade Data Monitor®. Restrictions apply to the availability of these data, which were accessed under proprietary license for this study.
Acknowledgements
The authors gratefully acknowledge the editor, Aleks Shaefer, and two anonymous reviewers for their valuable comments and suggestions, as well as the USDA National Needs Fellowship program for financial support.
Funding statement
This work was partially supported by funding from the United States Department of Agriculture, National Institute of Food and Agriculture, National Needs Fellows Program. Project title: Training a New Generation of Leaders in International Agricultural Trade and Development [Award No. 2022-38420-38614].
Competing interests
The authors declare that they have no competing interests related to this research.



 Open access

