

INTRODUCTION
Mumps is a viral infection of humans which primarily affects the salivary glands [Reference Dayan1]. Although it is generally a mild childhood disease, with peak incidence in those aged 5–9 years, up to 10% of mumps patients develop aseptic meningitis [Reference Galazka, Robertson and Kraigher2, 3]. A less common but more serious complication is encephalitis, which can result in death or disability, while other adverse effects include permanent deafness, orchitis and pancreatitis [Reference Galazka, Robertson and Kraigher2, 3]. In most parts of the world, the annual incidence of mumps in the absence of immunization is in the range of 100–1000 cases/100 000 population, with epidemic peaks every 2–5 years [3]. Natural infection with this virus is thought to confer lifelong protection [3].
Seasonal variation in the incidence of mumps has been reported in different areas. Of these, a seasonal pattern has been detected in the USA, with significant peaks in April [Reference Shah4]; more cases occur in winter and spring than in summer and autumn in the Ukraine [Reference Hrynash, Nadraga and Dasho5]; frequency is higher in winter and spring with epidemic peaks in Jordan [Reference Batayneh and Bdour6]; and incidence is highest in the spring, next highest in autumn, and lowest in summer in Taiwan [Reference Liu7]. The seasonality of the disease suggests that weather factors might play an important role in its incidence and indicates the possibility of multiple functional pathways. However, few studies have investigated the impact of weather factors and variability on the incidence of mumps with adjustment for the mutual confounding between weather factors and potential confounding by other seasonally varying factors. In addition, few studies have focused on how this relationship affects children, despite the fact that children are considered particularly vulnerable to climate change or extreme weather events.
Here, we investigated the possible relationship of weather variability with paediatric mumps cases in children aged <15 years using surveillance data from 2000 to 2008 in Fukuoka, Japan.
METHODS
Data sources
The number of mumps cases in children aged <15 years is reported on a weekly basis from 120 sentinel medical institutions within Fukuoka Prefecture, in the southwest of Japan [Reference Onozuka, Hashizume and Hagihara8]. Mumps is defined by clinical factors in combination with positive serology, in accordance with the Act on Prevention of Infectious Diseases and Medical Care for Patients Suffering Infectious Diseases [9]. Clinical definitions include the acute onset of unilateral or bilateral tender, self-limited swelling of the parotid or other salivary glands of at least 2 days' duration without other apparent cause. Serological methods include detection of mumps-specific IgM, IgG, RT–PCR and molecular genotyping; in addition, detection of mumps virus based on immunohistochemical techniques has been supplanted by the more rapid, sensitive, and specific technique of RT–PCR [Reference Reid10, Reference Hviid, Rubin and Muhlemann11]. Clinical data are recorded and reported by sentinel volunteers to the Fukuoka Institute of Health and Environmental Sciences, the municipal public health institute of the Fukuoka Prefectural Government. We also obtained data on daily average temperature and relative humidity in the prefecture from the Japan Meteorological Agency. Weekly means for average temperatures and relative humidity were calculated from the daily records.
Statistical analysis
We examined the relationship between the number of weekly mumps cases in children and temperature and humidity using negative binomial regression to account for over-dispersion in the data [Reference McCullagh and Nelder12]. To account for the seasonality of mumps cases that were not directly due to the weather, the model included Fourier terms up to the sixth harmonic. Fourier terms can be used to re-create any periodic signal (such as a consistent seasonal pattern) using a linear combination of sine and cosine waves of varying wavelength [Reference Stolwijk, Straatman and Zielhuis13]. The number of harmonics defines the lowest wavelength reproduced (i.e. the level of seasonal adjustment), with six harmonics corresponding to a wavelength of 9 weeks (one-sixth of a year). Indicator variables for the years of the study were incorporated into the model to allow for long-term trends and inter-annual variations. We also observed that there were two large epidemics in 2001 and 2004–2005 (Fig. 1). Thus, indicator variables for these two epidemics were incorporated into the model to remove temporal variations. Rainfall was also initially considered, but as no evidence was seen of an association with the number of cases (P>0·1), it was not included in the final analysis. To allow for autocorrelations, an autoregressive term at order 1 was incorporated into the models [Reference Brumback14]. Plots of model residuals, predicted and observed time-series plots, and partial autocorrelation function of the residuals (Supplementary Data, Fig. S1) suggested that this was an adequate adjustment for seasonal trends.
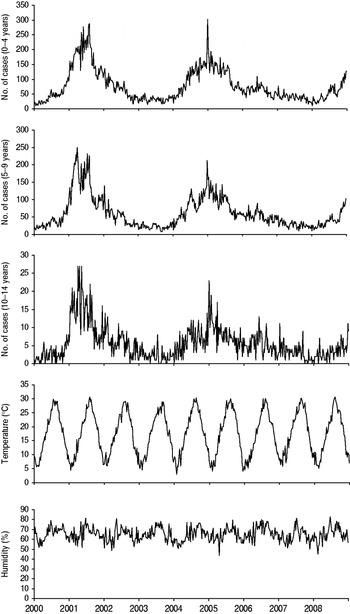
Seasonal variation in the weekly number of mumps cases by age, temperature, and relative humidity in Fukuoka, Japan, 2000–2008.
Temperature models
Based on the results of exploratory analyses with lowest deviance of the models, we considered lags (delays in effect) of up to 2 weeks when analysing the influence of temperature on the number of mumps cases. In initial analyses designed to identify the broad shape of any association, we fitted a natural cubic spline (3 d.f.) [Reference Durrleman and Simon15] to the average over lags of 0–2 weeks. We also included humidity as a natural cubic spline (3 d.f.) in the model to control confounding, with lags of 0–2 weeks.
The choice of model (linear or threshold) [Reference Armstrong16] was based on our comparison of deviance in the models derived from likelihood ratio tests [Reference Daniels17]; models with lower deviance are preferred. When a difference in values of deviance between linear and the best-fit threshold models was <3·84 (χ2 value for 1 d.f. at the P=0·05 level), the linear model was chosen for simplicity. Values of deviances suggested that the deviance between the linear and threshold models changed little; thus, we assumed that linear models without a threshold were appropriate for assessing the effects of weather variability on mumps cases.
Using the simple linear model, we then examined lag effects in more detail by fitting linear unconstrained distributed lag models comprising temperature terms at each lag period, which could be as long as 2 weeks.
Humidity models
To evaluate the impact of relative humidity, we fitted a natural cubic spline (3 d.f.) to the average humidity over lags of 0–2 weeks. We also included temperature as a natural cubic spline (3 d.f.) in the model to control confounding, with lags of 0–2 weeks. The lag period was set at 0–2 weeks, as with the temperature models. Because the plots of the smoothed relationships with humidity suggested a broadly linear positive relationship, we then fitted a linear model to estimate the effect (slope) [Reference Daniels17]. With the simple linear model, we then examined lag effects in more detail by fitting linear unconstrained distributed lag models comprising humidity terms at each lag period, which could be as long as 2 weeks.
To investigate whether the results were sensitive to the levels of control for seasonal patterns, the analyses were repeated using Fourier terms up to the third and twelfth harmonics per year. All statistical analyses were conducted using Stata version 11.0 (Stata Corporation, USA).
RESULTS
We analysed a total of 67 000 (100%) mumps cases aged <15 years from 2000 to 2008, of which 36 127 (53·9%) were aged 0–4 years, 28 285 (42·2%) aged 5–9 years, and 2588 (3·9%) aged 10–14 years. Table 1 lists descriptive statistics for the number of patients and weather variables. Analysis of the weekly reported cases of mumps revealed that the seasonal peak in cases was not identical from year to year (Fig. 1). We then analysed our data to look for relationships with temperature and humidity.
Characteristics of the weekly number of mumps cases by age and meteorological data in Fukuoka, Japan, 2000–2008
Relationship with temperature
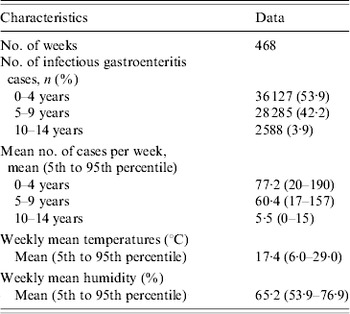
Figure 2 shows the relationship between the relative risk of mumps and temperature. The crude relationship showed no evidence that temperature was associated with mumps (Supplementary Data, Fig. S2). However, after adjusting for seasonal variations, between-year variations, temporal variations of two large epidemics, and humidity, a positive relationship was identified between the relative risk of mumps cases and temperature during a lag of 0–2 weeks (Fig. 2).
Relationship between relative risk of mumps scaled to mean weekly number of cases and temperature over lags of 0–2 weeks. Relationship adjusted for relative humidity, seasonal variations, between-year variations, and temporal variations of two large epidemics by age group [(a) 0–4 years, (b) 5–9 years, and (c) 10–14 years]. The centre line in the graph shows the estimated spline curve, and the upper and lower lines represent the 95% confidence limits.
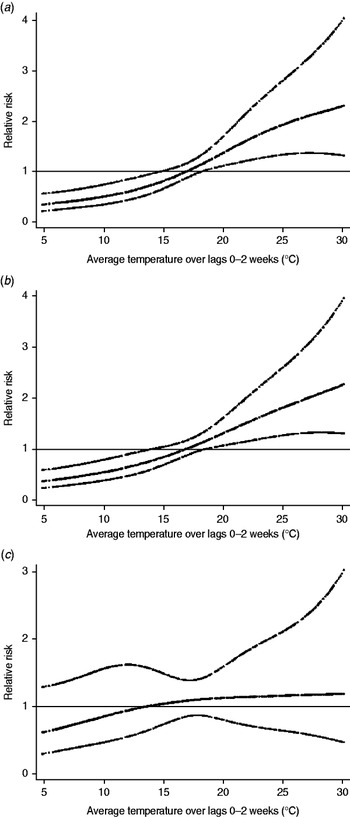
For each 1°C increase, the number of mumps cases increased by 7·5% (95% CI 4·0–11·1) in all children, and by 7·7% (95% CI 3·9–11·5) in those aged 0–4 years, 7·6% (95% CI 3·9–11·3) in those aged 5–9 years, and 3·7% (95% CI −1·8 to 9·5) in those aged 10–14 years. In the distributed lag model, the effect of temperature was significant for lags of 0 and 1 week in the 0–4 years group, and 0 and 2 week in the 5–9 years group (Fig. 3).
Percent change and 95% confidence intervals in the number of mumps cases by temperature. Values per 1°C increase at each lag (unconstrained distributed lag models) in the (a) 0–4 years, (b) 5–9 years, and (c) 10–14 years age groups.
Relationship with humidity
Figure 4 shows the relationship between the relative risk of mumps and humidity. In the crude relationship, the potential risk of mumps increased as humidity increased from the lowest relative humidity level (Supplementary Data, Fig. S3). However, after adjusting for seasonal variations, between-year variations, temporal variations of two large epidemics, and temperature, we observed a significant increase in the number of cases of mumps, with a 1% increase in relative humidity for lag periods between 0 and 2 weeks, as indicated by the positive linear slope with high humidity (Fig. 4).
Relationship between relative risk of mumps scaled to the mean weekly number of mumps cases and relative humidity over lags of 0–2 weeks. Relationship adjusted for temperature, seasonal variations, between-year variations, and temporal variations of two large epidemics by age group [(a) 0–4 years, (b) 5–9 years, and (c) 10–14 years]. The centre line shows the estimated spline curve, and the upper and lower lines the 95% confidence limits.
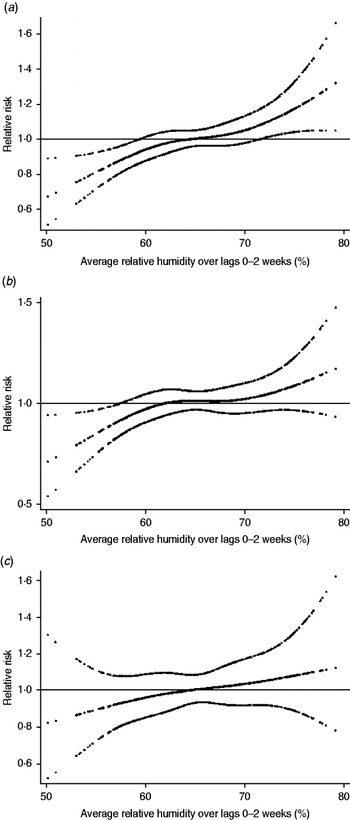
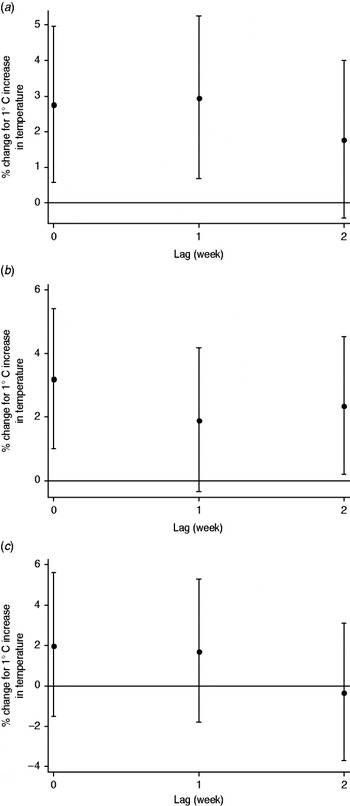
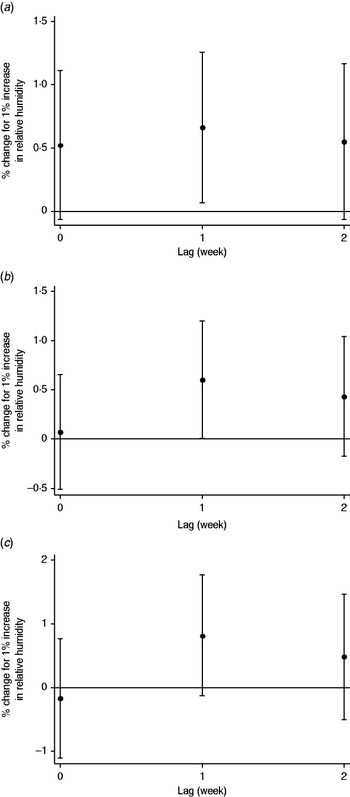
For each 1% increase, the number of mumps cases increased by 1·4% (95% CI 0·5–2·4) in all children, and by 1·7% (95% CI 0·7–2·7) in those aged 0–4 years, 1·1% (95% CI 0·1–2·1) in those aged 5–9 years, and 0·9% (95% CI −0·7 to 2·5) in those aged 10–14 years. In the distributed lag model, the effect of humidity was significant for lags of 1 week in the 0–4 years group, and of 1 week in the 5–9 years group (Fig. 5).
Percent change and 95% confidence intervals in the number of mumps cases by relative humidity. Values per 1% increase at each lag (unconstrained distributed lag models) in the (a) 0–4 years, (b) 5–9 years, and (c) 10–14 years age groups.
Halving (three harmonics) or doubling (12 harmonics) the degree of seasonal control in sensitivity analyses only minimally changed the estimated effects of temperature and humidity. The temperature model adjusted for humidity in the 0–14 years group yielded increases of 7·7% (95% CI 1·8–14·1) with three harmonics and 7·6% (95% CI 1·4–14·2) with 12 harmonics, while the humidity model adjusted for temperature in this group yielded 3·3% (95% CI −0·2 to 7·0) with three harmonics and 4·1% (95% CI 0·5–7·9) with 12 harmonics.
DISCUSSION
Our results yielded several notable findings. Most importantly, they suggest that, after adjustment for potential confounding by temperature (humidity models only), humidity (temperature models only), seasonal pattern, inter-annual variation, and temporal variations of two large epidemics the number of mumps cases increased with either an increase in temperature or relative humidity. This increase was strongest in children aged <5 years, and progressively decreased with age. Our combined temperature and humidity results demonstrate the importance of weather factors in the prevalence of mumps infections in children.
In contrast to our present findings, a previous study suggested that mumps was not associated with warmer and drier weather [Reference Hubalek18]. This discrepancy might be due to the effects of seasonally varying factors and mutual confounding between weather factors, which were controlled for in the present but not the previous study. The present findings also suggest that two important weather parameters, temperature and humidity, might quantitatively explain short-term associations after controlling for seasonal pattern, inter-annual pattern, and temporal variations of two large epidemics.
Using the distributed lag model, the temperature effects appeared immediately at a shorter lag period (0 week), and were generally positive at later lags. In contrast, the humidity effects were significantly positive at a lag of 1 week. These results may be related to the fact that mumps has a long incubation period and that outbreaks are detected late. The incubation period is about 15–24 days (median 19 days) [Reference Richardson19], and recent data suggest an infected person is contagious from 2 days before to 5 days after the onset of symptoms [Reference Polgreen20]. Mumps virus can, however, be isolated from saliva as early as 7 days before and up to 9 days after the onset of symptoms [Reference Ennis and Jackson21]. More cases of mumps are reported clinically than are confirmed and notified by the laboratories. While mumps may have a number of classical symptoms and signs on presentation, clinicians may confirm diagnoses by either serum IgM serology or non-invasive salivary IgM testing. Testing at the appropriate time in the clinical course is important to avoid apparently conflicting results [Reference Reid10, Reference Cunningham22, Reference Whyte23]. These characteristics may also indicate the need for more precise modelling of any lag effects of temperature and humidity on disease risk.
Our age-specific analyses showed that the marked weather variability effect occurred in children aged 0–4 and 5–9 years. In addition, the effect of temperature and humidity was not significant for each lag in the 10–14 years age group. With regard to mumps infections, previous epidemiological studies have indicated that mumps is spread through the community mainly through school children with secondary spread through family members [Reference Meyer24]. Moreover, previous serosurveys indicated that protective maternal antibody is passively transferred to the infant and that its half-life is about 35–40 days [Reference Sato25]. Further, several seroepidemiological studies showed a steep increase in mumps antibody level beginning from ages 2 or 3 years, acquisition of natural antibodies by 50% of 4- to 6-year-olds, and seropositivity of 90% of the population by 14–15 years [26-29]. Thus, our results probably reflect the pattern of spread of mumps and acquisition of serum antibodies to mumps by children as they age.
Methodologically, most previous studies extrapolating the weather–mumps relationship from seasonal patterns of mumps were subject to the influence of other factors that cause departures from the typical seasonal patterns, such as inter-annual and seasonal patterns. In contrast, our results were not subject to confounding bias by such factors. Although we did not have access to data about the specific causes of mumps, a previous study has suggested that seasonal variation in contact rate might be affected by the social behaviour of children [Reference London and Yorke30]. A recent epidemiological study indicated that physical activity during adolescence is lower during winter and increases during warmer months [Reference Belanger31]. Warmer weather might be associated with behavioral patterns such as increased contact in children, which could in turn promote mumps infection.
The levels of mumps vaccine coverage might affect mumps infections. The WHO/UNICEF Joint Reporting Form data showed that a total of 109 (57%) of 192 Member States included mumps vaccine in their routine national immunization programmes as of 2004 [32]. In Japan, incorporation into the vaccination schedule started in 1988 but was discontinued in 1993 because several cases developed aseptic meningitis [Reference Sasaki and Tsunoda33]. Mumps vaccine coverage has remained low in Japan, in the range of 30–40%, and WHO/UNICEF has classified Japan as a no-mumps vaccine state [32]. Further investigation of the effects of vaccination would be a critical topic for future study.
Several limitations of this study warrant mention. First, surveillance data for mumps do not capture all cases in the community. This under-reporting can occur anywhere in the reporting chain, from the initial tendency of a patient to seek healthcare to the recording of the case in the disease registry. The degree of under-reporting also may vary between epidemic and non-epidemic periods. Second, sentinel medical institutions were recruited on a voluntary basis, but this does not pose a threat to validity of the comparisons over time, which is the subject of this study.
Among practical implications of the present findings, elucidation of the effects of weather variability on the epidemiology of infectious diseases is important for disease control by public health officials. The results of this study may help public health officials predict epidemics and prepare for the effects of climatic changes on the epidemiology of mumps through implementation of preventive public health interventions, such as alerting health workers, aggressive community-based campaigns to promote vaccination, weather forecasts for early warning, and planning additional control programmes for mumps.
In conclusion, this study found quantitative evidence that the number of mumps cases in children increased significantly with increased average temperature and relative humidity.
NOTE
Supplementary material accompanies this paper on the Journal's website (http://journals.cambridge.org/hyg).
ACKNOWLEDGEMENTS
The study was supported in part by a Grant-in-Aid for Scientific Research from the Ministry of Health, Labour and Welfare, Japan. We thank the Fukuoka Prefectural Government, Department of Public Health and Medical Affairs, Division of Public Health for their painstaking efforts in infectious disease surveillance in Fukuoka, Japan.
DECLARATION OF INTEREST
None.


