


1. INTRODUCTION
The release of naturally triggered persistent deep slab avalanches, subsequently simply called avalanches, occurs due to the influence of certain weather parameters on the snowpack. They often release from overburden loading from snowfall or wind-transported snow that increases stress intensities and strain rates. They also release due to elevated strain rates caused by warming of the upper snowpack because of strong shortwave radiation (solar) or warm air temperatures. To forecast such events, weather monitoring is important for avalanche professionals and outdoor activities. Weather forecasts are often used in western Canada because of the lack of weather stations representative of avalanche start zones. Weather stations can be tens to hundreds of kilometres apart and they may not be close to backcountry operations, such as helicopter skiing lodges or mining sites. Further, the weather stations are more common at or below the treeline whereas avalanche start zones are often at or above the treeline. We assess the advantages and limitations of weather models for forecasting naturally triggered deep slab avalanches.
Current numerical weather prediction models provide detailed simulated weather parameters for node points within kilometres of most mountainous locations in western Canada. The reliability of the forecast varies depending on the model itself, which may work well for certain locations or for certain parameters. Historically, models in mountainous terrain were generally more difficult to create than those in gentler terrain because of topographic effects (e.g. Kim and others, Reference Kim, Eckermann and Chun2003). With time, finer-scaled models were created, which better forecast the weather in regions of high relief.
The Canadian Meteorological Centre of Environment Canada created the Global Environmental Multiscale (GEM) numerical weather prediction model to forecast the weather, address climate change and for air quality prediction (Côté and others, Reference Côté1998). The grid spacing was variable, ranging from ~35 to 1100 km, so that forecasts could be created at the synoptic scale with more detail over Canada. The GEM model was subsequently updated with a 24 km grid version (Bélair and others, Reference Bélair2000) to address precipitation amounts in the summer from convection. In 2004, an updated version was implemented, named GEM15 (also known as Regional Deterministic Prediction System), with a 15 km grid (Mailhot and others, Reference Mailhot2006). The primary improvements of this model were the finer grid spacing and an improved physics package. A limited-area model (LAM) of GEM with a high resolution of 2.5 km, was tested in 2007 (Yang and others, Reference Yang2010), herein called GEM-LAM (Erfani and others, Reference Erfani2005) (also known as High Resolution Deterministic Prediction System). This model was implemented to better model topography and ground cover, physical processes and weather systems from the synoptic to the local scales. The western domain of the model only covered the southern portion of British Columbia and Alberta.
Bellaire and others (Reference Bellaire, Jamieson and Fierz2011, Reference Bellaire, Jamieson and Fierz2013) compared some modelled weather parameters from GEM15 with observations from an automatic weather station at Mt. Fidelity in the Columbia Mountains of British Columbia, Canada. They focused on precipitation, as it is one of the most difficult parameters to predict in complex high-relief terrain. They found that precipitations amounts >1 mm, were generally overestimated by GEM15. They attribute some of this overestimation to the fact that the station was located on the upwind side of the mountain range, where GEM15 overestimates precipitation (Mailhot and others, Reference Mailhot2006). The forecasting model GEM15 was further used by Bellaire and Jamieson (Reference Bellaire and Jamieson2013) to simulate mountain snowpacks. Precipitation, radiation, air temperature and relative humidity parameters were compared with weather station data at Mt. Fidelity. They indicate that air temperature modelled by GEM15 has a cold bias in winter months and that precipitation is underestimated in January and February but overestimated in March, compromising snowpack simulations. In a similar study, Horton and others (Reference Horton, Bellaire and Jamieson2014) used outputs from GEM15 to model surface hoar growth at Mt. Fidelity. They used the modelled parameters of air temperature, relative humidity, wind speed, incoming longwave radiation, incoming shortwave radiation and precipitation. They found that GEM15 inputs modelled observed surface hoar growth well, although not as accurately as did weather station data.
Schirmer and Jamieson (Reference Schirmer and Jamieson2015) compared precipitation amounts modelled by GEM15 and GEM-LAM with weather station data from 196 stations in mountainous regions. They completed objective quantitative analyses for winter months, similar to those performed by Bélair and others (Reference Bélair2009) for summer and autumn months across Canada and the USA. Schirmer and Jamieson found that both GEM models underestimated precipitation amounts in winter. The only exception was for snowfall amounts <~7 cm of snow, where the models overestimated precipitation amounts. GEM-LAM better predicted the observed amounts for all precipitation categories than GEM15.
Collecting and analyzing weather data are an important aspect of every avalanche operation in western Canada. The goals of our study were to determine the practical use of weather station and weather model data for avalanche forecasting in western Canada and to determine typical weather parameter values prior to the release of persistent deep slab avalanches. Part I of this two-part study first examined weather station data to determine typical weather parameter values observed prior to the natural release of persistent deep slab avalanches (Conlan and Jamieson, Reference Conlan and Jamieson2016). Median precipitation amounts were 15 and 38 cm for 24 h and 3 d cumulative amounts, respectively. Wind loading was generally low because of low wind speed values. A model of absorbed shortwave radiation on the days of release, SWarm, predicted a median warming value of 5.2°C, 10 cm into the snowpack. Also, the median maximum air temperature on the days of release was 5°C.
In the second part of this study, our objective was to examine the same weather parameters from weather model outputs. First, typical weather parameter values were determined for avalanches with known primary cause-of-release from the GEM15 model. Next, the modelled values were compared with those from the weather station data. Last, the GEM-LAM model was evaluated to assess if it produced better results than GEM15.
2. METHODS
Days and locations of persistent deep slab avalanches that released naturally in western Canada and that were difficult-to-forecast were obtained for our study. The same avalanche dataset as Part I (Conlan and Jamieson, this issue) was used, which included, 161 avalanches from the Information Exchange (InfoEx) operated by the Canadian Avalanche Association. Further, 14 avalanches that were accessed by Conlan and others (Reference Conlan, Tracz and Jamieson2014) were used in the dataset along with subsequent field visits, all between 2006 and 2014, for a total of 175 avalanches. This is two avalanches fewer than in Part I, because modelled weather data were not available for two avalanches that occurred prior to 2006. The avalanches were classified based on their primary cause-of-release, either precipitation loading, wind loading, solar warming, or air temperature warming. The primary cause-of-release was known for 36 of these avalanches, as determined by avalanche professionals working near the start zones.
For our study, the weather preceding avalanches that released in the winters of 2012 to 2014 were modelled with both GEM15 and GEM-LAM, whereas the avalanches between 2006 and 2012 were only modelled with GEM15. The GEM-LAM grid had a spacing of 2.5 km between node points and the output included hourly weather data. The GEM15 model had a grid spacing of 15 km between node points and output weather data every 3 h. Both models were simulated over a DEM that included the mountains of southwestern Canada. The node points that were used to represent the start zones of the avalanches were chosen based on distance to start zones as well as elevation differences. First, the closest four node points to the start zone were compared. Of these, the node point with the closest elevation to that of the avalanched start zone was used, as the model outputs depend on elevation. With this method, the node points were <15 km from the start zones and from most of the weather stations associated with the avalanches.
For both models, weather parameters included air temperature, wind speed, wind direction, precipitation amounts and cloud cover. Surface wind speeds were obtained for 10 m above the ground. Precipitation was calculated as mm of water in the GEM models. For comparison with manual weather stations that report snowfall in cm of snow, precipitation amounts were converted to cm of snow using a new snow density of 100 kg m−3, as performed in many weather forecasts (Roebber and others, Reference Roebber, Bruening, Schultz and Cortinas2003). Air temperature, wind speeds and precipitation amounts were corrected for elevation differences between the node point and the start zone. Corrections followed those found by Liston and Elder (Reference Liston and Elder2006), which were also applied to GEM data by Schirmer and Jamieson (Reference Schirmer and Jamieson2015).
Snowpack warming from daytime incoming shortwave radiation was modelled using SWarm (Bakermans and Jamieson, Reference Bakermans and Jamieson2009). SWarm is a model created from linear regression of a variable based on daily maximum incoming shortwave radiation and it estimates the daily maximum amount of warming (°C), 10 cm into the snowpack (estimated RMSE of 1.6°C). SWarm output is dependent on the age of surface snow, since albedo decreases with age and the amount of absorbed shortwave radiation increases. A threshold value of 1 cm of snow was used, since the GEM models tend to overestimate small amounts of precipitation (Schirmer and Jamieson, Reference Schirmer and Jamieson2015). Sky cover as a percentage of cloud cover obtained from the GEM models and the aspect, incline and coordinates of each avalanche start zone were used.
Wind loading potential from wind-transported snow was calculated using the wind speed and wind direction from the GEM models, in the same manner as in Part I of this study. For a separate comparison, wind speeds were also increased by a factor of 3, thereby increasing some of the calculated wind loading amounts. The scale value of 3 was chosen by best fitting the modelled wind speeds to those from automatic weather stations in a subset of the treeline and alpine terrain in the Columbia Mountains of western Canada.
Data were obtained for the day of the release and the preceding 14 d. The data for each avalanche were collected finishing at 1600 to 1700 local time on the day of release to correspond to the typical observational times of the InfoEx dataset in Part I. The same parameters as in Part I of this study were analyzed. Additionally, the highest 12 h air temperature decrease on the day of each release was assessed with GEM15 data.
A multivariate classification tree was created for the 36 avalanches with known primary cause-of-release. For each case in a dataset, a classification tree uses one or more predictor variables to predict the class of a categorical response variable to which each case belongs (Breiman and others, Reference Breiman, Friedman, Stone and Olshen1984). To create the tree, the most significant parameters were first identified. To do so, the distributions of the parameters for each primary cause-of-release group were compared with each other using the Kruskal–Wallis one-way analysis of variance test (Kruskal and Wallis, Reference Kruskal and Wallis1952). This is a nonparametric test that measures if two or more independent samples are from the same distribution. Significant differences were determined when p < 0.05. Further, the parameters were assessed by combining some of the primary cause-of-release groups; for each parameter, the prominent primary cause-of-release group was compared with the combination of the other three groups. As an example, the solar warming group was compared with the other three groups for the SWarm parameters. The Mann–Whitney U test (Wilcoxon, Reference Wilcoxon1945; Mann and Whitney, Reference Mann and Whitney1947) was used for this comparison. This is a nonparametric test that measures if one distribution is stochastically greater than another. From such analyses, the most significant parameters were input to the classification tree. A minimum split of 10 cases was applied to match the number of branches that were captured in Part I.
The weather parameters were compared between the two GEM models and the weather station data from Part I. Statistical comparisons between the three data sources were conducted using the Kruskal–Wallis one-way analysis of variance test. Statistical comparisons between GEM15 and the weather station data were assessed with the Wilcoxon signed-rank test (Wilcoxon, Reference Wilcoxon1945). This is a nonparametric test for two matched samples to measure if the ranks of the two population means differ. Last, three examples of situations where discrepancies were observed between the two weather sources are discussed.
3. RESULTS
3.1. GEM15 modelled weather
GEM15 modelled parameters for the 36 persistent deep slab avalanches with known primary cause-of-release are presented in Table 1. The precipitation loading group experienced the highest median 24 h and multi-day cumulative precipitation amounts. Similarly, the highest median maximum precipitation rate on the days of release of 1.3 cm h−1 was observed for this group. Sky cover was often modelled to be low for the precipitation loading group and associated SWarm values were also relatively low, with a median of 3.3°C, 10 cm into the snowpack.
Summary statistics of GEM15 modelled weather parameters for deep slab avalanches of known primary cause-of-release
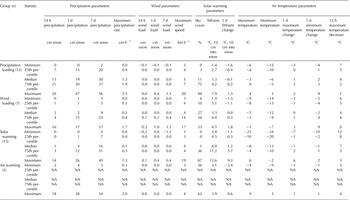
The wind loading group experienced the highest maximum 24 h and cumulative wind loading potential amounts. However, the majority of the amounts were close to 0 cm of snow. No substantial differences were observed for the maximum wind speeds on the days of release for the four groups, with a maximum modelled speed of 20 km h−1.
The solar warming group had the lowest median sky cover and the highest median SWarm value of 8°C, 10 cm into the snowpack. Low 24 h and multi-day cumulative precipitation amounts were observed for most of the avalanches in this group. Low minimum and maximum air temperatures were observed for many of these avalanches, with the lowest medians observed for both categories. Similarly, the largest median 12 h temperature decrease was observed for this group.
The air temperature warming group only consisted of two avalanches, for which the parameters varied substantially. One avalanche occurred when the modelled air temperature was low and snowfall was heavy. The other avalanche occurred with modelled air temperatures up to 9°C at the start zone and minimal snowfall over the preceding 7 d.
3.2. GEM15 Classification tree
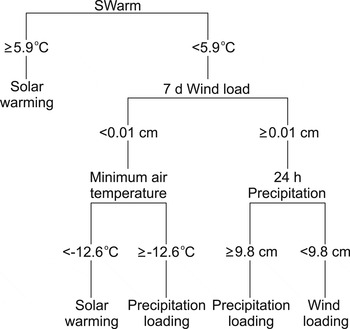
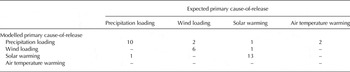
The parameters used to create the classification tree included 24 h precipitation, 7 d wind loading potential, maximum 24 h precipitation rate, minimum 24 h air temperature and SWarm modelled warming on the days of release. The developed classification tree (Fig. 1) correctly classified 81% of the avalanches with known primary cause-of-release with GEM15 data. The tree used SWarm as the primary split with a value of 5.9°C, 10 cm into the snow. This separated much of the solar warming group from the other primary cause-of-release groups. The second split was 7 d wind loading amount. Two further splits occurred, including the minimum air temperature and 24 h precipitation. All four primary cause-of-release group had at least one avalanche that was not properly classified (Table 2). Five of the seven improperly classified avalanches, including both air temperature increasing avalanches, were improperly classified as being in the precipitation loading group.
Multivariate classification tree for 36 deep slab avalanches of known primary cause-of-release using GEM15 data. The classification groups are precipitation loading, loading from wind-transported snow, solar warming and air temperature increase. A minimum split of ten was applied in combination with the lowest cross-validated error. Minimum air temperature, SWarm and 24 h precipitation are for the days of avalanche releases.
Expected and modelled grouping of avalanches with known primary cause-of-release. The expected primary cause-of-releases were determined from avalanche professionals, whereas the modelled amounts were determined from the multivariate classification tree
This tree only classified 56% of the 175 avalanches the same as the tree created in Part I of the study for their respective datasets. This is partly because the GEM15 classification tree did not classify any air temperature increasing avalanches. Consequently, the tree in this study was not used to further classify the avalanches with unknown release type, as was performed in Part I. This is because the new tree would classify some of the avalanches differently than the weather station classification tree, thereby making comparisons difficult. Instead, the primary cause-of-release groups were compared only for the 36 avalanches with known primary cause-of-release. This facilitated a comparison of potential threshold values that may cause the release of persistent deep slab avalanches. However, all 175 avalanches were used to compare GEM15 and the weather station data to determine similarities and differences.
3.3. Comparison of weather parameters between GEM15 and weather stations
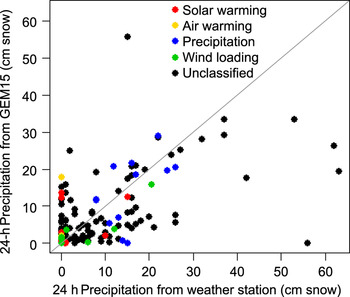
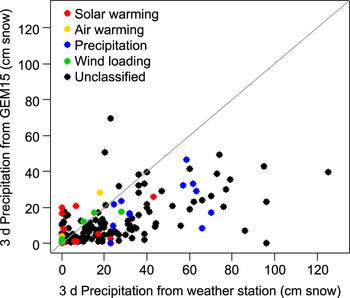
The model outputs of certain weather parameters from GEM15 were compared with weather measurements recorded at weather stations in Part I of the study for the 175 avalanches. Distributions of the differences between the GEM15 outputs and the weather station data are summarized in Table 3. Precipitation amounts on the days of release were generally higher for the weather stations compared with GEM15 (Fig. 2). This is particularly noticeable for snow amounts above ~20 cm. This trend continues with cumulative daily sums and becomes quite apparent with multi-day amounts (Fig. 3), with a median difference of 16 cm of snow with the 7 d cumulative precipitation (Table 3). The distributions of the GEM15 precipitation amounts and the weather station amounts were significantly different for all multi-day cumulative precipitation amounts (all p < 0.01). The avalanches with precipitation loading as their primary cause-of-release generally had higher cumulative precipitation amounts than the other groups. However, GEM15 output predicted <10 cm of snowfall on the days of release for four of these avalanches with two being close to zero (Fig. 2). Multi-day cumulative amounts were always less than observed at the weather stations for this release type group (Fig. 3). Although precipitation amounts were generally higher for weather stations compared with the GEM15 model, the maximum precipitation rates on the days of release were often higher for GEM15 (median of 0.3 cm h−1) than for the weather stations (median of 0.0 cm h−1).
Modelled (GEM15) and measured (weather station) cumulative precipitation amounts over the 24 h prior to avalanche release. Grey line indicates 1 to 1. Coloured data points have known primary cause-of-release, whereas black points are unclassified avalanches.
Modelled and measured cumulative precipitation amounts over the 3 d prior to release. Plot format is the same as in Figure 2.
Descriptive statistics of the differences between the GEM15 output and the weather station data for each respective avalanche. A positive value denotes that the weather station data were higher. Bold parameter values indicate that the two data sources were statistically different (p < 0.05 from Wilcoxon signed-rank test)
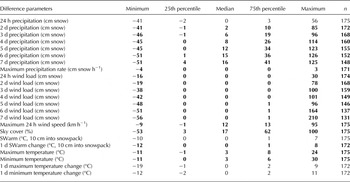
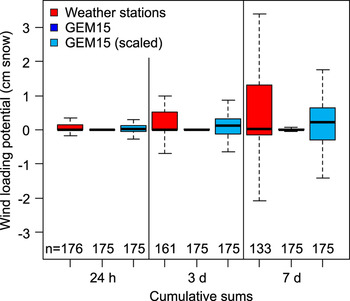
Higher maximum 24 h wind speeds were generally observed at the weather station compared with the GEM15 output (Table 3). All cumulative wind loading potential distributions were significantly different between the GEM15 model and the weather station data (p < 0.01 for 24 h to 5 d, p = 0.01 for 6 d, p = 0.04 for 7 d). The spreads of the distributions of the weather station data were consistently larger than the GEM15 data (Fig. 4), even when multiplying the GEM15 wind speeds by a scale factor of 3. The avalanches with wind loading as the primary cause-of-release had low calculated wind loading potential amounts from GEM15.
Boxplots of cumulative wind loading potential sums for weather station data, modelled GEM15 data, and scaled (3-times wind speed) GEM15 data. The number of observations (n) for each group is reported below each boxplot. Black line indicates the median, boxes span the first and third quartiles, and whiskers span the lowest datum and the highest datum within 1.5-times the lower and upper quartiles, respectively. Outliers are not displayed.
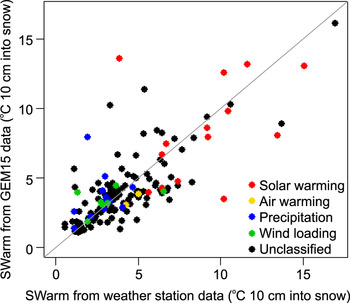
For SWarm modelled snowpack warming on the days of release, there was no significant difference between their distributions (p = 0.7) (Table 3). The avalanches with solar warming as the primary cause-of-release had high SWarm values for both data sources (Fig. 5).
Modelled solar warming from SWarm on the days of release from the two data sources. Plot format is the same as in Figure 2.
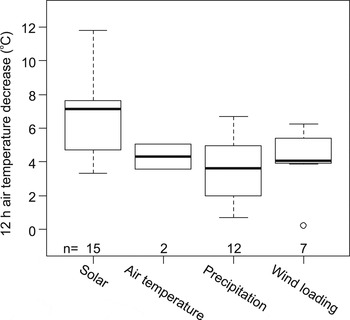
Both of the medians of the minimum air temperatures and the maximum air temperatures on the days of release were lower for GEM15 than for the weather station data (Table 3). The distributions were significantly different for the two data sources (both p < 0.01) (Fig. 6). For the 12 h temperature decrease from GEM15, the solar warming group had the highest amount of variation and the precipitation loading group had the smallest amount of variation (Fig. 7).
Boxplots of minimum and maximum air temperatures on the days of release for weather station data and for modelled GEM15 data. The number of observations (n) for each group is reported below each boxplot. Black line indicates the median, boxes span the first and third quartiles, whiskers span the lowest datum and the highest datum within 1.5-times the lower and upper quartiles, respectively, and outliers are displayed as open circles.

Boxplots of the maximum 12 h air temperature decrease on the days of release for avalanches with known primary cause-of-release (along x-axis), modelled by GEM15. Higher numbers indicate a larger temperature decrease. Each boxplot represents data from a particular primary cause-of-release group. Boxplot format is the same as in Figure 6.
3.4. GEM15, GEM-LAM and weather station comparison
Weather data for 16 avalanches were available from GEM-LAM. The data were assessed between the GEM15 and GEM-LAM models and compared with the weather station data. All 14 d of data were used in the comparison for each respective avalanche, irrespective of timing in relation to the days of release. The results of some parameters that might favour the release of natural avalanches are listed in Table 4. The upper three quartiles of the 24 h precipitation amounts were highest for GEM-LAM and lowest for GEM15 and the three distributions were significantly different (p < 0.01). The simulated output of wind speeds 10 m above ground surface from either GEM model was not representative of field conditions or weather station data. Low speeds were typically modelled, generally below 10 km h−1, which corresponds to low wind loading amounts. This produced almost all wind loading potential values of 0 cm of snow. The medians of the 24 h wind loading distributions of both GEM models were similar to the weather station dataset but the three groups were significantly different (p = 0.04).
Comparison of weather parameters for 14 d preceding avalanche releases for, GEM15, GEM-LAM and weather station data. Bold parameter values indicate that the groups were significantly different from one another (p < 0.05 from Kruskal–Wallis one-way analysis of variance test)
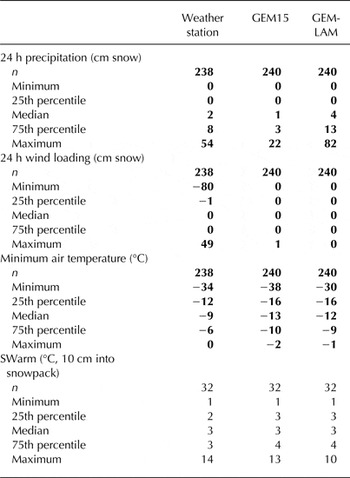
The distributions of the minimum air temperature were similar for the two weather models. The medians of the modelled distributions were lower than the weather station median, resulting in a significant difference between the three distributions (p < 0.01). Of the sources, GEM15 was the coldest (Table 4). SWarm values were comparable across the three sources, with no statistical differences calculated between their distributions (p = 0.2). The SWarm dataset was smaller because sky cover data were only obtained for the day of the release and the preceding day for the weather stations.
4. DISCUSSION
4.1. GEM15 modelled weather
The highest median precipitation amounts and median maximum precipitation rates were observed, as expected, for the precipitation loading group (Table 1). Relatively high air temperatures on the days of release were often observed within this group, possibly because of warm air associated with many snow storms.
The wind loading potential amounts were all low because of the low wind speeds modelled by GEM15. No negative wind loading potential amounts were observed in this group, indicating that there were no cases where wind speeds were elevated, but the wind direction was such that it would make the start zone windward. This suggests that, many of the avalanches in this group may have experienced some wind loading had the modelled wind speeds been higher.
The solar warming group not only had the highest SWarm values but also low precipitation amounts and high temperature fluctuations. This is consistent with most winter days in western Canada during clear sky conditions where nights are cold due to radiation cooling and days are warm due to incoming shortwave radiation. The highest median 1 d SWarm change was observed in this group, indicating either clearing conditions leading up to the release or lower albedo values from consecutive clear days without new snowfall.
Much variability was observed for the two avalanches that likely released because of air temperature warming. One of the two avalanches was consistent with what was expected; warm minimum and maximum air temperatures and little precipitation. The other avalanche was inconsistent with this and is later discussed as a case study.
Some of the parameter values from Table 1 could be used by avalanche professionals as approximate GEM15 thresholds for naturally released persistent deep slab avalanches in western Canada. The cumulative precipitation amounts and SWarm values are likely of the highest quality from this dataset because more avalanche days were available for these two groups. The air temperature increasing group did not produce reliable values, likely because of the small dataset. Further avalanches with this release type are required to determine realistic thresholds associated with their release. The wind loading group also did not produce meaningful results because the wind loading potential values were unrepresentative of field conditions.
4.2. Scaling of GEM15 modelled wind speeds
The modelled wind speeds were remarkably low for all node points in our study. The average wind speed was 4 km h−1 for all data. Such wind speeds produce wind loading amounts close to 0 cm of snow and are therefore not representative of wind loading in mountainous terrain. To better represent field conditions, a scale factor of 3 was tested.
The scale factor improved some wind loading potential amounts. The distributions of the weather station and the scaled wind loading potential amounts were not significantly different (p = 0.06 for 24 h, p = 0.1 for 3 d, p = 0.2 for 7 d). However, the spread of the distributions of the two sources still varied substantially, with more variability observed for the weather station data. This was most apparent with multi-day cumulative sums (Fig. 4). This is because all values close to 0 km h−1 changed little with scaling, which applies to the majority of the GEM15 data. Only three avalanches had high enough wind speeds on the days of release to create 24 h wind loading potential amounts >1 cm of snow. This scaling method is therefore not adequate to represent wind speeds in mountainous terrain. Further scaling tests were not conducted because of the differing shapes of the distributions. However, the modelled wind speeds still contained trends and was therefore selected as a split in the multivariate classification tree.
Wind direction is an important factor with the wind loading potential calculation. For example, a wind loading potential amount of 0 cm of snow would result if the wind direction was exactly 90° different than the start zone aspect. In our study, wind direction was largely unimportant because of the low wind speeds. With higher speeds, obtaining representative wind directions at the start zones will be required to adequately quantify wind loading potential.
4.3. GEM15 Classification tree
The use of a SWarm value for the primary split in the tree is reasonable because the solar warming group was the most significantly different from the combination of the remaining groups for SWarm on the days of release (p < 0.01). The following splits to separate the remaining groups are intuitive, as they generally corresponded to the group types (i.e. precipitation, wind loading, air warming), with high wind loading amounts separating the wind loading group and high precipitation amounts separating some of the precipitation loading avalanches (Fig. 1). The two avalanches that likely released from air temperature warming were not correctly classified by the tree, largely because of their weather values. For one of these avalanches, GEM15 had a maximum 24 h air temperature of 9°C and minimum 24 h air temperature of 3°C. However, the other release had a maximum 24 h air temperature of −4°C and minimum 24 h air temperature of −9°C. This produced a large spread that the tree could not correctly classify. Other misclassifications occurred but were less influential than the warming group, which only had two avalanches.
The classification tree in Figure 1 and the tree for the weather station data in Part I exhibit some similarities. Both trees used SWarm values as the primary split and the thresholds were only 1.1°C apart. Both models used cumulative wind loading potential amounts as a split. The 7 d cumulative wind loading potential of 0.01 cm (0.4 cm with scaling) was low but the scaled value is more comparable with the 5 d amount of 0.5 cm from the weather station tree. However, from such values it is apparent that both studies did not produce representative wind speeds and wind-transported snow amounts for alpine and treeline terrain. The 24 h precipitation sum was also used for both models, with comparable thresholds of 10 cm in this study and 7 cm in Part I. Although both trees have similarities, it is expected that the tree produced in Part I would better classify naturally triggered persistent deep slab avalanches because it explained more variance (87% compared with 81%), particularly for those that release from air temperature increasing. However, the tree created from GEM15 data may be useful for operations that do not have adequate weather station data.
Using the classification trees from Part I and this study may be helpful for avalanche professionals in western Canada, as the threshold values that were used to separate the avalanche groups could identify the primary cause-of-release for potential avalanches at their particular operations. Once the primary cause-of-release is predicted, avalanche professionals can identify certain terrain and weather characteristics that favour the release of such avalanches.
4.4. Comparison of weather parameters between GEM15 and weather stations
The lower precipitation amounts for GEM15 compared with those of the weather stations can be attributed to two reasons. The first is that GEM15 appears to under-predict precipitation amounts. Schirmer and Jamieson (Reference Schirmer and Jamieson2015) indicate that this is the case for daily snow amounts >~7 cm. This is consistent with the observations in our study; high cumulative snowfall amounts over consecutive days were generally much greater at weather stations compared with the model outputs. However, some of the discrepancy could be attributed to the conversion of the data. GEM15 reported precipitation as mm of water, whereas the weather stations reported snowfall as cm of snow. For comparison, the GEM output was converted to cm of snow using an average density of 100 kg m−3. This may not be adequate for some of the data, particularly in colder climates where new snowfall densities are often less (Judson and Doesken, Reference Judson and Doesken2000). Using lower density values, such as 80 kg m−3, will increase the amount of cm of snow for the GEM15 data, possibly becoming more similar or even higher than the weather station data. A conclusion from Part I was that, the weather station precipitation amounts were likely low estimates of start zone amounts because of elevation differences. If this were true, model outputs with elevation corrections should have higher precipitation amounts than the weather stations. To test this, a comparison of the modelled amounts and weather stations that report precipitation as snow w.e. is recommended. We also speculate that the higher resolution GEM-LAM model may produce amounts that are higher than the weather stations as it tends to predict higher precipitation amounts than GEM15.
The wind loading potential amounts were difficult to compare between the two data sources because of the consistent low values modelled by GEM15. That being said, the avalanches with the highest modelled amounts from GEM15 had low calculated amounts from the weather stations. This indicates that some discrepancies exist between the modelled wind speeds and perhaps directions and those observed at the weather stations. The wind directions were difficult to compare for two reasons. The first was that many of the directions were not available for the weather station data because the wind speeds were reported as calm. The second was that GEM15 outputs six wind directions for each day and averaging them is often not meaningful (e.g. averaging a due east and a due west directions). Nonetheless, wind direction was largely not important in our study because of the unrealistically low wind speeds. We hypothesized that GEM15 would provide relatively realistic wind speeds because the weather station data were generally unrepresentative of the start zone locations. Although this was not observed for the data in our study, other parameter outputs from GEM15 may be more useful, such as higher level wind measurements. Further, the higher resolution GEM-LAM model may provide more realistic parameter values than the coarser GEM15. Further studies examining wind directions from the model against those observed in alpine start zones would also be beneficial.
The similar distributions of the SWarm modelled warming amounts for the two data sources suggests that forecasts from GEM15 can be effectively used to estimate how much solar warming may influence snowpack instability. However, GEM overestimated the amount of solar warming compared with the weather stations for some cases and underestimated it for others. This could be due to differing cloud cover amounts or different amounts of consecutive days without snow. Although GEM15 tends to underestimate high snowfall amounts, Schirmer and Jamieson (Reference Schirmer and Jamieson2015) indicate that small precipitation amounts are often overestimated by the model. An overestimation of small amounts will decrease the number of days without snowfall, thereby reducing SWarm estimates. Another possible cause of discrepancies is the timing of measurements. SWarm was analyzed using average cloud cover data between ~0700 and 1900 h local time. Weather station data were generally obtained from averaging sky cover observations at 0600 and 1600 h. These differences may be the cause of some of the discrepancies. It is also possible that GEM15 may have incorrectly predicted the timing of some weather systems, thereby affecting the SWarm values.
For air temperatures, it is logical that GEM15 modelled lower air temperatures because of the elevation correction from the modelled node point elevations to the alpine start zone elevations. Apart from this, consistencies in warming and cooling trends were generally observed between GEM15 and the weather stations. This was most apparent with the minimum air temperature on the days of release. Discrepancies observed could be from differences between the modelled and actual timing of moving air masses. The 12 h air temperature decrease highlights temperature trends for avalanches that release from different mechanisms. The highest air temperature decreases were generally observed for the solar warming group and the smallest occurred for the precipitation loading group. The solar warming group likely experienced high temperature fluctuations from cold nights and warm days. Days that experience substantial precipitation loading, on the other hand, generally occur under cloudy skies, often from a low pressure weather system. Such conditions generally moderate air temperatures, unless a front is arriving. This is likely why less variability in the 12 h temperature decrease was observed for the precipitation loading group.
The values for GEM15 determined in our study can be used by avalanche professionals who analyze GEM15. Since there are differences between the data sources, the GEM15 parameter values should not be used as threshold values for data obtained from other sources, such as other weather models or from weather stations. Doing so would either increase the number of non-forecasted events or increase the number of false alarms. Since many differences were observed between GEM15 and weather station parameters, each data source should be analyzed separately. However, hazard assessments may consider when individual parameters from either source are critical.
4.5. GEM15, GEM-LAM and weather station comparison
Prior to completing this study, the highest precipitation values were hypothesized to be from the GEM models, since the weather stations were generally at or below the treeline, whereas many of the start zones were in alpine terrain. Since both the GEM15 and GEM-LAM modelled values were corrected for elevation differences between the node and the start zone location, the amounts were expected to be higher than from the weather stations that were generally at lower elevations. The 24 h precipitation distribution of the GEM-LAM model was higher than the weather stations but the distribution of the GEM15 precipitation amounts was less than both other distributions. This indicates that GEM15 probably under-predicts precipitation amounts, even with elevation corrections. It is therefore likely that precipitation amounts at the start zones of these deep slab avalanches were greater than modelled by GEM15. Comparably, Schirmer and Jamieson (Reference Schirmer and Jamieson2015) found that GEM15 precipitation amounts were less than indicated by both GEM-LAM and weather station data.
The surprisingly low modelled wind speeds and corresponding wind loading potential amounts are a concern for trying to use such models for avalanche forecasting. Other modelled wind parameters such as the 40, 80, or 120 m above surface wind speeds may better represent surface wind speeds in GEM15. These parameters were not available for historical GEM15 data so they were not assessed in our study. GEM-LAM includes such parameters, so future analyses should assess the possibility of using these or other wind speed parameters. Further, newer models, such as GEM-LAM, are of finer resolution, allowing for a better representation of the relief. This in itself would provide more realistic wind parameters (Erfani and others, Reference Erfani2005). For example, Vionnet and others (Reference Vionnet, Bélair, Girard and Plante2014) analyzed winds with differing model grid spacing in the GEM-LAM model and found large improvements with decreasing grid spacing in the Rocky Mountains of western Canada.
The SWarm input parameters include slope angle, slope aspect, day of the year, sky cover for that day and number of days without new snow. The only two parameters that varied between each avalanche for the three data sources were the sky cover and snowfall. In general, there was consistency between the data sources for whether precipitation had fallen or not. Sky cover exhibited some variability between the models and the weather station data, but many values were similar. These inputs produced SWarm values that were similar between the three sources, without any significant differences calculated between the groups (p = 0.2). The similarities are likely because of the constant parameters of slope angle, aspect and day of the year in addition to relatively similar sky cover amounts. This indicates that the weather models should generally be adequate in estimating whether solar warming may influence the snowpack in the coming days. However, field conditions during the day of interest should still be analyzed for a better representation.
Similar to precipitation, air temperature values were anticipated to be lower for the GEM models than for the weather stations. This is again likely because of elevation, with lower temperatures generally observed at higher elevations.
4.6. Examples of GEM15 modelled discrepancies
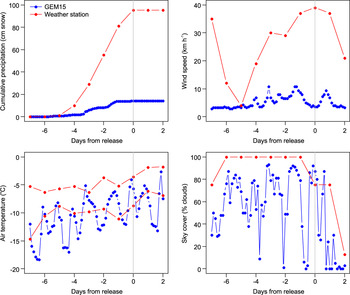
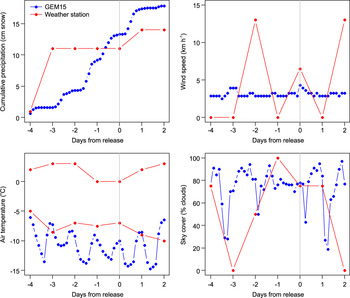
A number of the avalanches with known primary cause-of-release had GEM15 data that were substantially different from corresponding values at their nearby weather stations. One such example was an avalanche that occurred due to precipitation loading in the Rocky Mountains of western Canada. The weather station recorded substantial snowfall on the day of the release and over the preceding 5 d (Fig. 8), caused by a large storm system from the Pacific Ocean. The GEM15 model predicted some snowfall 1–4 d prior to the release but no snowfall on the day of the release itself. Other parameters exhibited similar trends between the GEM15 model output and the weather station, including air temperature, wind speeds and cloud cover (Fig. 8), although thorough comparisons were difficult because of differing reporting intervals. Two possible reasons for the discrepancy in precipitation amounts are that the GEM15 model forecasted the weather system to have passed before the day of the release, or that the model predicted the system to have dropped most of its precipitation in the western mountain ranges prior to reaching the Rocky Mountains. The data do not provide much evidence towards one or the other. The modelled and observed sky cover were mostly cloudy during the day of the release along with the preceding days, with the exception of a few clearing periods as modelled by GEM15, perhaps between distinct frontal systems. Both the model and observations indicated clearing for the days after the release, showing reasonable consistency. For the first scenario, the modelled cloud cover on the day of the release could be from lingering clouds after the front passed. For the second scenario, it could be associated with the large weather system but without much associated precipitation. This often occurs in the Rocky Mountains, where much of the snow falls in the Coast Mountains and the Columbia Mountains prior to reaching the Rockies (Ahrens, Reference Ahrens2009).
Prominent weather parameters from weather station data and modelled GEM15 data preceding (negative) and proceeding (positive) the day of release for an avalanche that was likely triggered from precipitation loading. The vertical grey line indicates the day of release.
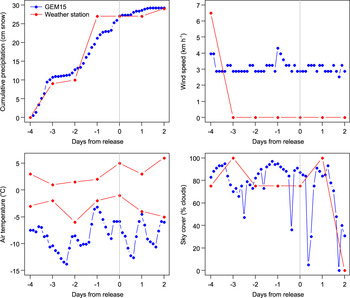
Another example of improperly modelled weather parameters occurred near an avalanche in the Columbia Mountains of western Canada. This avalanche was reported to have released because of high air temperatures at the start zone. The weather station nearby reported a warming trend leading to the release, with the maximum air temperature on the day of the release being 5°C (Fig. 9). The weather station was located at a lower elevation than the start zone but above freezing air temperatures were also observed in the field at higher elevations. This warming trend was not forecasted in the GEM15 model, with cooler maximum air temperatures simulated on the day of release compared with the preceding day. The model forecasted substantially lower air temperatures than observed for much of the preceding week. Most of the other weather parameters were correctly modelled with a small exception of precipitation. GEM15 anticipated snow during the day of the release, whereas no snow was observed at the weather station. It is therefore possible that GEM15 predicted a precipitation event, possibly a cold front, which did not occur. Although high temperatures were observed at the weather station during the days leading up to the release, all precipitation was in the form of snow.
Prominent weather parameters from weather station data and modelled GEM15 data preceding (negative) and proceeding (positive) the day of release for an avalanche that was likely triggered from air temperature warming. The vertical grey line indicates the day of release.
A final example of a model discrepancy occurred in the Columbia Mountains for which the primary cause-of-release was solar warming. The GEM15 model output indicated that broken clouds were expected on the day of the release, which was also observed at the weather station and in the field. The other important factor for SWarm is precipitation, which differed between the model and weather station. No snow was recorded at the weather station over the preceding 3 d but GEM15 indicated over 10 cm of snow over the same time period (Fig. 10). This caused the SWarm model to reduce the amount of modelled solar warming because of higher albedo values. As this was not actually the case for the start zone, the modelled warming values were lower for GEM15 data compared with the weather station data. This scenario was also an issue for another avalanche that likely released due to solar warming. This highlights how solar warming does not only depend on direct shortwave radiation but on the condition of the snow surface as well.
Prominent weather parameters from weather station data and modelled GEM15 data preceding (negative) and proceeding (positive) the day of release for an avalanche that was likely triggered from solar warming. The vertical grey line indicates the day of release.
These examples show that the GEM15 model may not always properly simulate the magnitude or timing of weather systems. However, many of the other avalanches had reasonably forecasted weather. Avalanche professionals can use such weather models to aid in their forecasts of changing snow conditions but they should also use other sources for weather data, such as weather stations and field observations.
4.7. Advantages and limitations of weather models for avalanche forecasters
From our analysis, we identified some advantages of using GEM15 and GEM-LAM data. First, the regional summaries are easily accessible online. They are also freely available in raw format for any node point, which is advantageous to some operations because weather stations can be expensive to purchase, install and maintain. The model forecasts provide avalanche professionals with valuable information, particularly for those in data-sparse regions without representative weather stations. Further, the models continuously produce results, whereas weather station data may be influenced by natural disturbances such as riming of sensors. This is particularly important in mountainous terrain where stations must be continually maintained to ensure that data are representative. The models generally perform well at determining if and when systems are approaching, which is largely valuable to avalanche professionals when performing hazard forecasts. With the results from our study, avalanche forecasters with persistent deep slab avalanche problems can analyze daily model forecasts and determine if threshold values may be reached. If thresholds are met, hazard assessments can be modified accordingly.
A limitation of the use of such models in relation to persistent deep slab avalanches is that they are a black box and may therefore forecast incorrect weather patterns. This may be particularly true for some locations in western Canada that experience microclimates. The model resolutions are currently not adequate at modelling small-scale variations in mountainous terrain (e.g. north slope vs south slope or gully vs ridge) and can therefore not be used for such scenarios. Small-scale weather systems and terrain variations largely affect the snowpack and applied stresses, suggesting that the weather models should only be used at larger spatial and temporal scales. Using the online model output also requires a data connection, which is difficult for some backcountry operations. With proper understanding of the advantages and limitations of such models, they are a valuable source of weather information that should be used in conjunction with other data sources.
5. Concluding remarks
An analysis of Environment Canada's GEM weather models was conducted to determine the relevance of model parameters for forecasting naturally triggered persistent deep slab avalanches and to determine thresholds that may be applicable for avalanche forecasters in western Canada. The parameters analyzed included precipitation, wind speed and wind direction in the form of wind-transported snow potential, cloud cover in the form of solar warming of the snowpack and air temperature. The dataset included weather preceding 175 avalanches in western Canada between 2006 and 2014. The key parameters from regional and high resolution models were compared for 16 avalanches. A multivariate classification tree that classified avalanches by their primary cause-of-release was created for 36 avalanches of known primary cause-of-release. The weather parameters preceding all 175 avalanches were analyzed and compared with the GEM15 model output and with measurements at weather stations near the start zones.
The classification tree using GEM15 data was similar to the one based on weather station data, with a primary split of modelled solar warming of 5.9°C, 10 cm into the snowpack on days of release. The tree correctly classified 81% of the avalanches with known primary cause-of-release that were used to build the tree.
In general, the GEM15 model predicted less snowfall than the weather stations. The GEM-LAM model predicted more snowfall than both, the GEM15 and the weather stations. Previous research concluded that both models under-predicted precipitation for high snowfall amounts. This was apparent in our study for the GEM15 model, particularly for cumulative amounts over many days. Surface wind speeds from the GEM15 model were too low to be representative of field conditions. This produced wind-transported snow potential amounts that were close to 0 cm of snow for most of the days that deep slab avalanches released. The air temperatures for the weather models were generally lower than those at the weather station. Much of this is likely because of the elevation corrections applied to the modelled parameters, as the stations were generally at lower elevations than the start zones. There was no significant difference between the SWarm values from the weather station and the GEM models. This indicates that the GEM models may be effective at predicting potential solar warming and its effect on snow stability in future days.
Within our analysis, the GEM15 model simulated weather parameters that were generally less representative of the start zone locations than the weather stations. The weather models were often good at representing large-scale weather systems, although the timing was occasionally off. The model's ability to simulate some local-scale weather was limited. This is particularly true for GEM15. GEM-LAM, which has been available since 2012, often better simulated the weather in mountainous terrain, likely because of the finer-scaled DEM that better represents the terrain. Future models with even finer grid spacing are expected to produce more representative weather data. In particular, an improvement of modelled wind speeds will largely aid in studies such as this one, as wind is important in the distribution of snow over terrain.
Avalanche professionals can use the classification tree to predict the likely cause of release for avalanches with unknown cause. This may allow them to determine threshold values to better predict avalanches in their particular forecasting area. Avalanche forecasters may apply the thresholds from our study to GEM15 output. The thresholds should not be used for any other data source, but they may prove to be good predictors for persistent deep slab avalanches in western Canada when using GEM15 data. Many false alarms may occur when using such thresholds, but the cost of a non-forecasted event may be far greater than a false alarm for difficult-to-forecast persistent deep slab avalanches. To reduce the number of false alarms, data from these weather models should be used in conjunction with other data sources, such as weather stations. Including multiple data sources in a decision support tool may better predict persistent deep slab avalanches.
ACKNOWLEDGEMENTS
We thank Stéphane Bélair of Environment Canada, Simon Horton, and Michael Schirmer for their help in obtaining the weather model data. We are grateful to the subscribers of the InfoEx for collecting the data. We thank Ben Shaw at the Canadian Avalanche Association for providing the InfoEx dataset. For financial support, thanks to the Natural Sciences and Engineering Research Council of Canada, Parks Canada, HeliCat Canada, the Canadian Avalanche Association, Mike Wiegele Helicopter Skiing, Canada West Ski Areas Association, Backcountry Lodges of British Columbia Association, the Association of Canadian Mountain Guides, Teck Mining Company, Avalanche Canada, the Canadian Ski Guide Association, Backcountry Access, the B.C. Ministry of Transportation and Infrastructure Avalanche and Weather Programs, the Canadian Avalanche Foundation, and TECTERRA. We thank scientific editor Ed Adams and two anonymous reviewers for providing useful comments that improved the quality of this manuscript.


 Open access

