


An abundance of research suggests that partisan opponents misperceive one another in myriad ways (Fernbach and Van Boven, Reference Fernbach and Van Boven2022; cf. Heit and Nicholson, Reference Heit and Nicholson2016). These misperceptions have troubling downstream consequences—fueling partisan animosity, democratic backsliding, and political violence (e.g., Mernyk et al., Reference Mernyk, Pink, Druckman and Willer2022). Studies examining these misperceptions typically ask participants to estimate where the “average” or typical Democrat and Republican stand on a particular matter—e.g., a policy issue or their feelings toward members of the other party (for a review, see Fernbach and Van Boven, Reference Fernbach and Van Boven2022). More rarely, studies ask participants to estimate what percentage of partisans have some dichotomous trait (e.g., are Black; Ahler and Sood, Reference Ahler and Sood2018) or hold some dichotomous attitude (e.g., believe abortions should be legal; ibid.).
This research has been enormously useful. Yet, we worry that existing misperception measures miss crucial information. In particular, they cannot capture individuals’ perceptions of how diverse partisans’ attitudes are in terms of valence and intensity. “Average” estimates reduce the attitudes of millions to a single point. Percentage-point measures provide some sense of attitude diversity, but cannot differentiate partisans who hold the same position more or less intensely. Hence, what is needed is a measure that allows participants to provide information about the distribution, direction, and intensity of others’ attitudes.
Misperceptions of attitude diversity are likely important to democracy in at least three ways. First, the perceived diversity of out-partisans’ attitudes likely affects compromise and cooperation. If one believes that out-partisans are unified in their opposition to a policy proposal, for example, compromise about that proposal may seem impossible (e.g., Shi et al., Reference Shi, Zhuang and Wang2010). When policy compromise seems impossible, Americans may worry that out-partisans will violate democratic norms to achieve their policy goals (Braley et al., Reference Braley, Lenz, Adjodah, Rahnama and Pentland2023). Second, the perceived diversity of out-partisans’ attitudes may shape how threatening the out-party seems to democracy: A unified enemy faction may be perceived as more effective and thus threatening (Hogg, Reference Hogg2007).
Third, the perceived diversity of attitudes held by out-partisans and in-partisans may affect the attitudes Americans are willing to adopt or express. People gravitate away from the policy attitudes of the out-party and toward those of their in-party (e.g., Nicholson, Reference Nicholson2012). If one perceives out-partisans to hold a wide range of attitudes about an issue, they may adopt an extreme attitude to differentiate themselves from the out-party (Hogg, Reference Hogg2007). Alternatively, if one perceives in-partisans to hold diverse attitudes about an issue, they may feel free to adopt many attitudes (Noelle-Neumann, Reference Noelle-Neumann1974).
Before these possible relationships can be explored, researchers must validate an adequate measure of perceived attitude diversity and quantify the accuracy of these perceptions. These are the goals of this paper. We build upon a few studies that have asked participants to draw histograms representing Democrats’ and Republicans’ attitudes on policy issues (Judd et al., Reference Judd, Van Boven, Huber and Nunes2011; Lyons and Sokhey, Reference Lyons and Sokhey2017). This approach is promising. However, abundant evidence suggests that most people struggle to interpret histograms (Boels et al., Reference Boels, Bakker, Van Dooren and Drijvers2019). Thus, it is unclear whether participant-drawn histograms meaningfully represent participants’ perceptions or are manifestations of innumeracy, inattention, or even “partisan cheerleading” (Bullock and Lenz, Reference Bullock and Lenz2019).
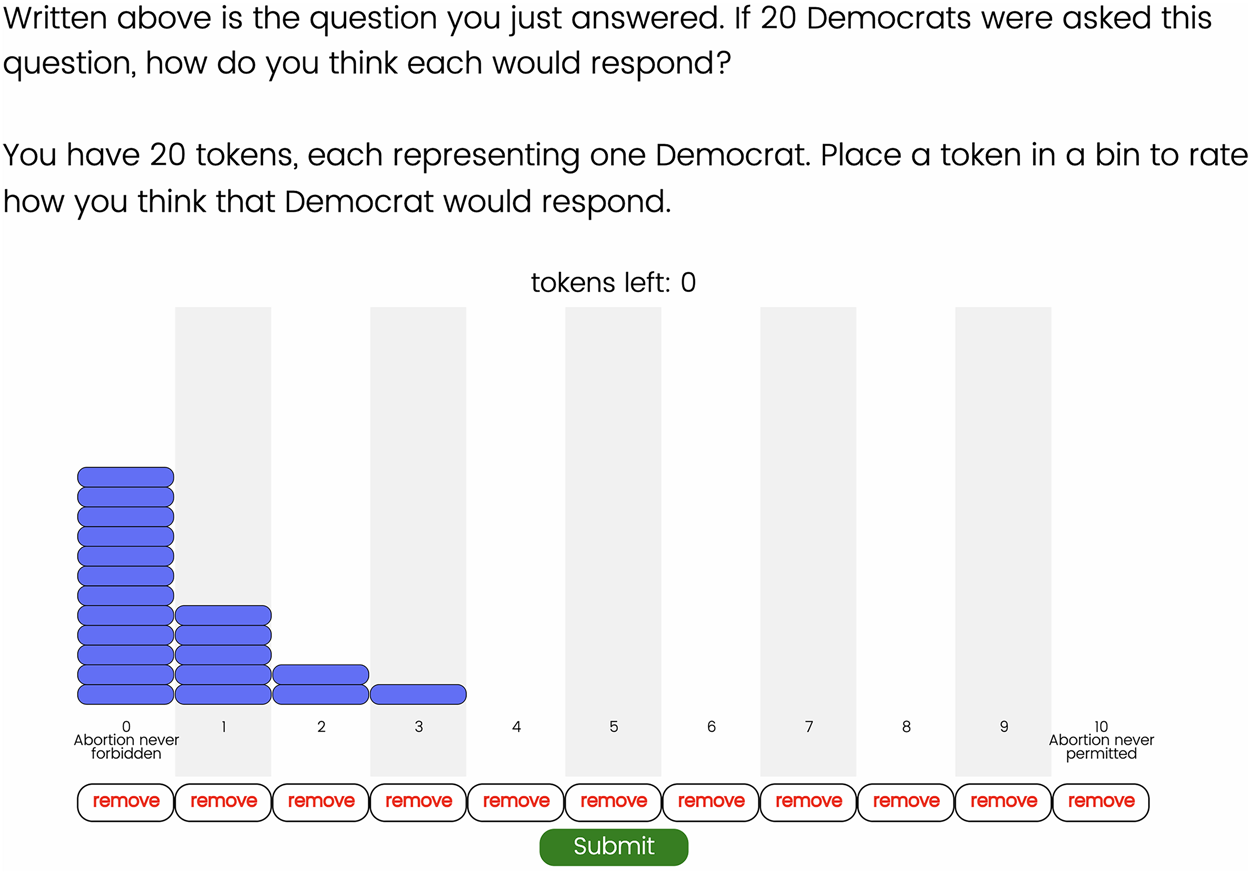
We use five studies with large samples of American adults (n = 9405) to validate a more intuitive measure of perceived attitude diversity, to describe these perceptions, and to compare these perceptions to those derived from canonical measures of perceived polarization. Instead of teaching unfamiliar participants about histograms, we simply asked each participant to provide their attitude about a policy issue, using a typical policy scale. Then, we asked them to intuit how 20 Democrats and 20 Republicans would respond to the same question using tokens (see Figure 1). This allowed each participant to build a “perceived distribution” of partisans’ attitudes without understanding histograms. We calculate the mean and standard deviation of this distribution to estimate a participant's perceptions of the average partisan and within-party attitude diversity. Notably, however, our method lets researchers use any distributional feature (e.g., medians, ranges) to describe participants’ perceptions.
After indicating their own attitude about a randomly selected policy issue, participants in our five studies indicated where they thought 20 Democrats and/or 20 Republicans stood on the same policy issue, using the above tool. We call this a “perceived distribution.”
We show that participants broadly interpret our perceived distribution task correctly: participants draw intuitive distributions in response to straightforward, non-political questions. The accuracy of participants’ perceptions of within-party attitude diversity does not vary with participant numeracy or randomized monetary incentives. Additionally, the shape of participants’ perceived distributions correlates with important downstream consequences—namely, warmth toward the out-party, comfort socializing with the out-party, and perceptions of out-party support for violating democratic norms.
Having validated our measure, we re-evaluate American partisans’ perceptions of other partisans’ attitudes. We find that Democrats and Republicans under-estimate—by more than a factor of two—the diversity of each party's policy attitudes. However, contrary to existing research that uses point estimates to measure perceived polarization, we find that partisans over- and under-estimate the extremity of average members of each party with similar frequency. That is, they do not consistently over-estimate how radical the average Democrat or Republican is. Thus, past findings of perceived polarization may be, in part, a measurement artifact. At the very least, our interpretation of canonical measures must change.
In summary, our study both challenges past research documenting the scope and consequences of perceived polarization and opens the door to new interventions aimed at mitigating democratic ills.
1. Data and methods
We use five studies with large samples of American adults (n = 9405). All studies had a similar procedure. Participants were randomized to answer questions about one of several possible topics. In all studies, participants considered one of three policy issues: abortion access, border control, and gun control. We selected these issues because they are likely to exhibit perceived polarization: they are salient and perceived to be highly partisan, though most Democrats and Republicans take relatively moderate positions on each issue. For validation, study 4 added two non-political topics: the relative skill of the Red Sox and Yankees baseball teams and preferences for the colors blue and pink.
In each study, participants first offered their attitude about the topic selected for them, using an 11-point scale. Then, in random order, participants provided their perceptions of two groups’ attitudes about the same topic. Those randomized to answer questions about a policy issue placed the attitudes of Democrats and Republicans. In study 4, those asked about baseball placed the attitudes of “die-hard Red Sox fans” and “die-hard Yankees fans.” Finally, those who asked about colors placed the attitudes of Americans and Canadians.
In studies 1 and 4, all participants provided their group-attitude perceptions via our perceived distribution task (see Figure 1). In other studies, some participants were randomized to provide a point estimate representing the “average” group member's attitude, consistent with canonical research on perceived polarization (Fernbach and Van Boven, Reference Fernbach and Van Boven2022). Additionally, study 2 randomized some participants to complete an incentivized version of our perceived distribution task, whereby participants were told they could receive cash incentives for completing this task accurately.
Finally, at the end of each study, participants completed questions measuring several attitudes about Republicans and/or Democrats that previous research suggests are affected by policy-attitude perceptions: how warm they felt toward Democrats and Republicans, how comfortable they were socializing with out-partisans, and/or how likely most out-partisans would support violating democratic norms. Wording for all questions can be found in our online appendix.
The sample for study 1 (n = 2069) was quota-matched to represent American adults on age, gender, education, Census region, and race. This sample was acquired from Bovitz Forthright, which recruits online panelists via addressed-based probability sampling and online ads. All other studies were conducted with convenience samples from Amazon Mechanical Turk (MTurk) or CloudResearch. To ensure response quality from MTurk participants, we sampled exclusively from CloudResearch's “approved panelists,” who have a proven track record and have over a 95 percent response approval rate. Sample demographics and additional details about the data collection procedure for each study can be found in our online appendix.
2. Results
2.1. Validating the perceived distribution task
Figure 2a shows how participants in each of our five studies typically perceived the distribution of Democrats’ and Republicans’ attitudes on three policy issues: abortion access, border control, and gun control. Each “typical” distribution was generated by averaging the number of tokens participants collectively placed at each scale point. The solid lines represent the actual distribution of Democrats’ and Republicans’ attitudes on each policy issue, determined using a demographically representative sample of American partisans (study 1).
Panel a depicts the “typical” perceived distribution drawn by participants in each study. Each distribution is generated by averaging the number of tokens participants collectively placed at each scale point. The solid lines represent the actual distribution of Democrats and Republicans’ attitudes on each policy issue from study 1. In study 4, participants were randomized to draw one of two sets of non-political distributions. Some participants drew die-hard Red Sox fans’ and die-hard Yankees fans’ beliefs about the relative skill of the two baseball teams (panel b). Others drew Americans’ and Canadians’ preferences for the colors blue and pink (panel c).
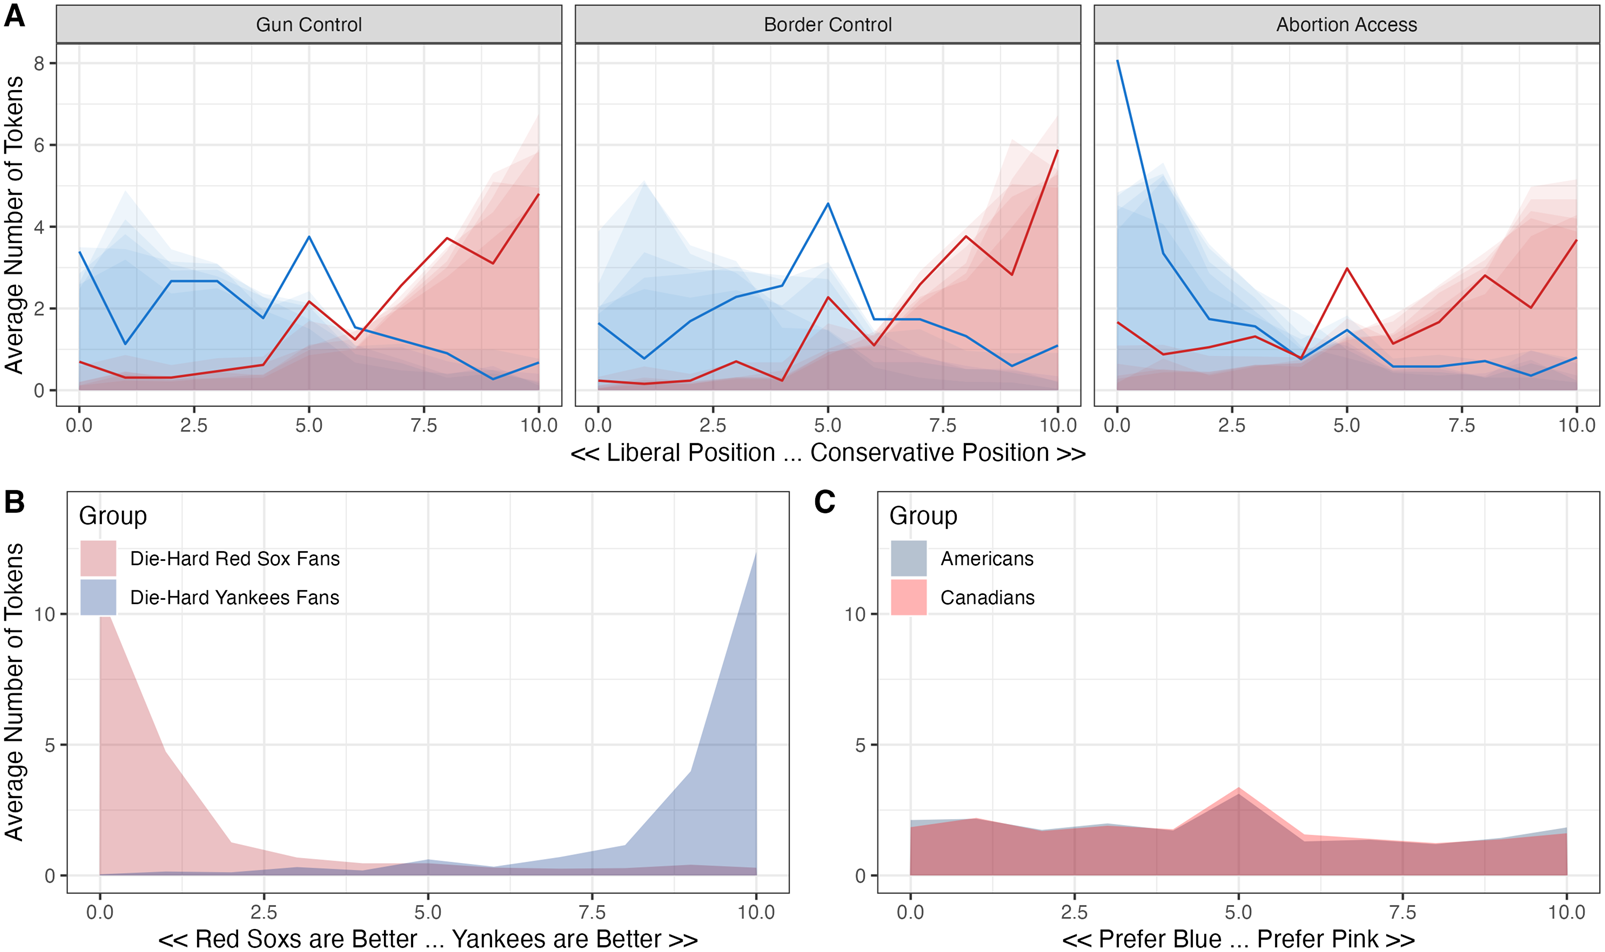
As shown in each facet of Figure 2a, the perceived distributions for each issue are generally consistent across our studies. We measured this consistency by calculating the overlap between the curves of the same political party's attitudes, on the same policy issue, from every pair of samples. On average, 89 percent (SD = 0.05) of the area under the curves overlapped, indicating that our task reliably produces similar distributions across samples. Importantly, however, these “typical” distributions hide considerable variation in individual participants’ perceived distributions, as we discuss later.
To ensure that participants properly interpreted the perceived distribution task, we had participants draw straightforward, non-political distributions (study 4). Some were randomized to represent the beliefs of die-hard Red Sox and Yankees fans about the relative skill of the two baseball teams. Quite sensibly, these participants drew narrow and extreme distributions (Figure 2b). By contrast, other participants were randomized to represent Americans’ and Canadians’ preferences for the colors blue and pink, and these participants reasonably drew wide and moderate distributions (Figure 2c).Footnote 1
We also used an existing numeracy scale (Schwartz et al., Reference Schwartz, Woloshin, Black and Welch1997) to assess whether numerate participants draw substantially more accurate perceived distributions (study 1). Compared to those at the bottom of the numeracy scale, participants at the top of the numeracy scale did not draw perceived distributions with more accurate standard deviations (b = −0.03, SE = 0.05, ${\rm p} = 0.58$ ). However, numerate participants did draw perceived distributions with slightly more accurate means: moving from the bottom to the top of the numeracy scale was associated with a perceived distribution mean roughly half a scale point, on an 11-point scale, closer to reality (b = −0.49, SE = 0.09, ${\rm p}< 0.001$
 ).
).
In sum, participants seem to understand our perceived distribution task. However, one might worry that participants might misrepresent their perceptions of Democrats’ and Republicans’ attitudes, to make their in-party seem more open-minded or moderate than the out-party (a form of “partisan cheerleading”; Bullock and Lenz, Reference Bullock and Lenz2019). To address this concern, we randomized some participants to receive monetary incentives for drawing accurate distributions (study 2).Footnote 2 As shown in our online appendix, these incentives did not affect the standard deviations of participants’ perceived distributions. They did, however, induce participants to draw distributions with less extreme means in some cases (b′s = −1.78 to −0.02). This effect is consistent with other research on how monetary incentives affect responses to political questions, including point estimates representing partisans’ policy attitudes (Bullock and Lenz, Reference Bullock and Lenz2019).
Finally, we assessed the criterion validity of our perceived distribution task and examined whether within-party attitude diversity predicts important consequences—over and above perceptions of the average partisan. Point-estimate reports of where the “average” partisan stood correlate highly with the means of participants’ perceived distributions ($r = 0.84$ , ${\rm p}< 0.001$
 , study 5). In other words, those who report the “average” partisan to be more extreme also draw perceived distributions with more extreme means.
Moreover, perceived distribution means correlate with previously documented consequences of misperception. We estimate the associational “effects” of perceived diversity after controlling for extremity perceptions (and vice versa). We compile the data across our five studies and regress (1) warmth toward the out-party, (2) comfort socializing with the out-party, and (3) perceptions of the out-party's support for violating democratic norms on the means and standard deviations of participants’ perceived distributions. Perceived out-party support for democratic norms is measured by asking participants whether most out-partisans would support ignoring court rulings, reducing voting stations, or using violence for political gain. As a point of comparison, we also include partisan identity strength as an independent variable. We use covariates that control for study, policy issues, participant demographics (including partisanship), and participants’ own policy attitudes.
Figure 3 visualizes the results of these regressions. As expected, the more stereotypically extreme a participant perceives out-partisans to be, the less they like the out-party (d = −0.17, ${\rm p}< 0.001$ ) and the less comfortable they feel socializing with the out-party (d = −0.10, ${\rm p}< 0.05$
 ). Also consistent with previous research, perceiving out-partisans as stereotypically extreme is associated with greater concern that the out-party supports violating democratic norms (d = 0.19, ${\rm p}< 0.001$
 ).
).
This figure visualizes standardized regression coefficients describing the relationship between previously documented consequences of partisan misperceptions and the perceived diversity of out-partisans’ attitudes (i.e., the standard deviation of participants’ perceived distributions), the perceived extremity of the average out-partisan (i.e., the mean of participants’ perceived distributions), and participants’ partisan identity strength.
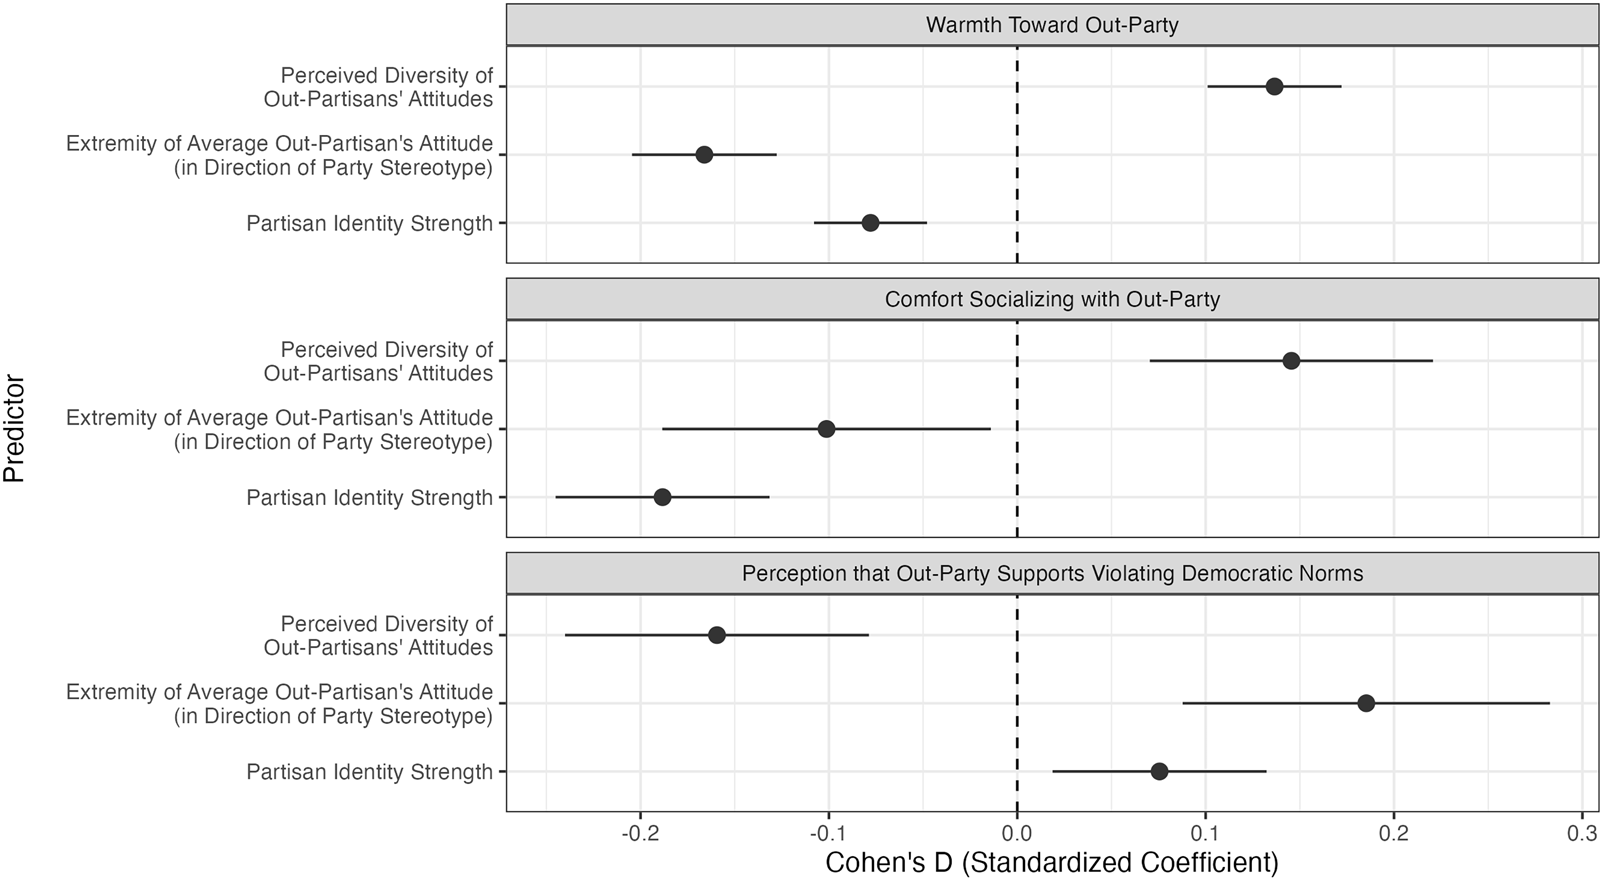
Yet, even after controlling for perceptions of extremity, perceived within-party attitude diversity also predicts these outcomes. The more diverse the out-party's attitudes are perceived to be, the more participants like the out-party (d = 0.14, ${\rm p}< 0.001$ ) and feel comfortable socializing with the out-party (d = 0.15, ${\rm p}< 0.001$
 ). Additionally, perceiving the out-party as having more diverse attitudes is associated with lesser concern that the out-party supports violating democratic norms (d = −0.16, ${\rm p}< 0.001$
 ).
).
In sum, our evidence suggests that the perceived distribution task is a reliable and valid way of measuring American partisans’ perceptions of other partisans’ attitudes about policy issues. Moreover, it shows that perceived diversity can explain variation in downstream consequences that perceived extremity cannot. Indeed, perceived diversity has a comparable associational “effect” on downstream consequences after controlling for perceived extremity. How accurate, then, are these perceptions?
2.2. Accuracy of participants’ perceptions
Perceptions of within-party diversity. One might think that Figure 2a—which visualizes the perceived distributions typically drawn by participants across our five studies—suggests that American partisans have generally accurate perceptions of other partisans’ policy attitudes. However, these “typical” distributions are drawn by averaging the number of tokens participants collectively placed at each scale point. As such, these distributions benefit from the “miracle of aggregation” (Page and Shapiro, Reference Page and Shapiro1992). That is, highly inaccurate estimates from individuals, when averaged, can produce highly accurate aggregate estimates, so long as individuals’ errors are uncorrelated.
To more usefully characterize the accuracy of American partisans’ perceptions, we turn to our demographically representative sample (study 1). Figure 4a shows the distribution of standard deviations as calculated from each participant's perceived distributions. The solid lines represent the actual standard deviation of each party's attitudes, and the dotted lines represent the average standard deviation of perceived distributions drawn by participants.
Panel a depicts study 1 participants’ perceptions of within-party diversity in policy attitudes—i.e., the standard deviation of participants’ perceived distributions—by policy issue and participant partisanship. Solid lines depict the actual standard deviation of partisans’ attitudes. Dotted lines depict the average standard deviation of participants’ perceived distributions. Panel b depicts study 1 participants’ perceptions of the average Republican's and Democrat's policy attitude—i.e., the average of participants’ perceived distributions—by policy issue and participant partisanship. Solid lines depict the actual attitude of the average partisan. Dotted lines depict the average of participants’ perceived distribution averages.
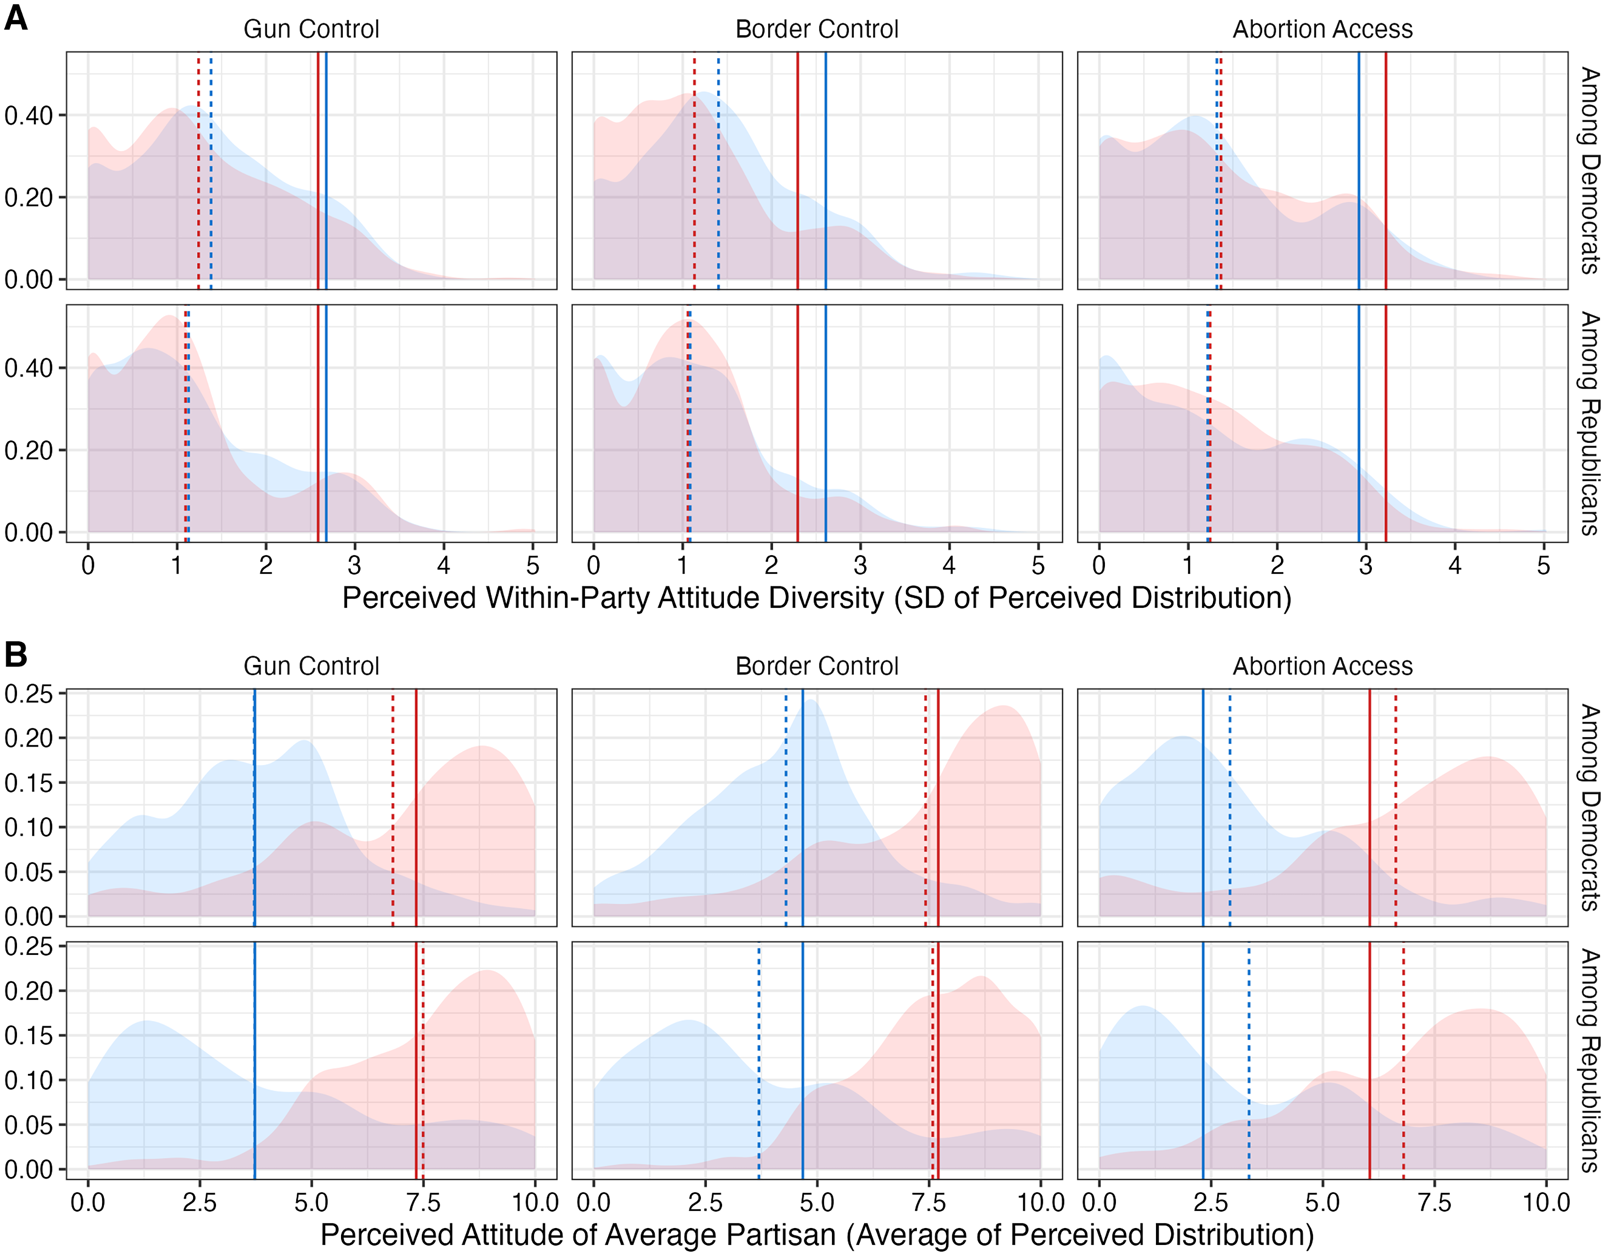
American partisans under-estimate—by more than a factor of two—the diversity of each party's attitudes. To begin, Democrats and Republicans perceive each other's policy attitudes to be far more homogenous than they are in reality. Across policies, Democrats under-estimated the standard deviation of Republicans’ attitudes by 1.46 points (SE = 0.03). Similarly, Republicans under-estimated the standard deviation of Democrats’ attitudes by 1.59 points (SE = 0.04). Perhaps more surprisingly, American partisans homogenize their own party's attitudes to a similar extent. Democrats under-estimate the standard deviation of their own party's policy attitudes by 1.37 points (SE = 0.03). Likewise, Republicans under-estimate the standard deviation of other Republicans’ policy attitudes by 1.55 points (SE = 0.04).
Perceptions of the “average” partisan. Our perceived distribution task also enables us to re-examine the scholarly consensus about perceived polarization, which has traditionally been estimated using point estimates representing the “average” Democrat and Republican. Figure 4b depicts the distribution of Americans’ perceptions of the average member of each party. Once again, solid lines represent reality: the actual attitude of the average member of each party. The dotted lines represent the result of averaging across Americans’ perceptions of the average Republican or Democrat.
Counter past evidence using point-estimate questions, American partisans do not consistently over-estimate how extreme the policy attitudes of the average Republican or Democrat are. When using the distribution task, Americans over- and under-estimate the extremity of average partisans to a roughly equal extent: Looking across policy issues, Democrats did not over-estimate the extremity of Republicans ($\bar {x} = -0.07$ , SE = 0.07) or other Democrats ($\bar {x} = -0.07$
 , SE = 0.06). Similarly, Republicans did not over-estimate the extremity of Democrats ($\bar {x} = 0.02$
 , SE = 0.11). However, Republicans did slightly over-estimate the extremity of other Republicans by about a quarter of a scale point on an 11-point scale ($\bar {x} = 0.24$
 , SE = 0.08, p < .01).
Question-wise differences in estimates of perceived polarization. This lack of perceived polarization is initially surprising, given existing findings that partisans do over-estimate polarization (Fernbach and Van Boven, Reference Fernbach and Van Boven2022). To verify that our unique results were a function of the perceived distribution task, not arbitrary differences in sample composition or study timing, we conducted another experiment (study 2).Footnote 3 We randomized participants to draw perceived distributions or to indicate the stances of “most” Democrats and Republicans using point estimates, consistent with previous research on perceived polarization. In our online appendix, we show that referring to “most” out-partisans versus the “average” out-partisan does not affect the extremity of responses to the point-estimate question.
As shown in Figure 5a, the point-estimate question produces larger estimates of perceived polarization. When asked to provide point estimates, partisans report a 5.7–6.4 point gap between the policy attitudes of the “average” Democrat and Republican on an 11-point scale (SEs = 0.16 − 0.17). By contrast, when asked to draw a distribution, this gap collapses to 4.8–5.2 points (SEs = 0.15–0.17). Thus, perceived polarization in policy attitudes appears far more extreme when partisans are asked to provide a point estimate representing the “average” partisan's view. The estimates derived from our perceived distribution task are more consistent with reality: actual polarization on our three policy issues, as represented by solid vertical lines, ranged from 3.0 to 3.7 points.
Panel a depicts estimates of perceived polarization derived from a point-estimate question that is typical of existing research versus our perceived distribution task. Panel b depicts generalized additive model (GAM) lines of the relationship between when a participant placed a token in our perceived distribution task and the extremity of that token (in the direction of the party stereotype). For example, if a participant, when representing the attitudes of Democrats, placed a token close to the far-left position on an issue, that token would be considered “extreme.”
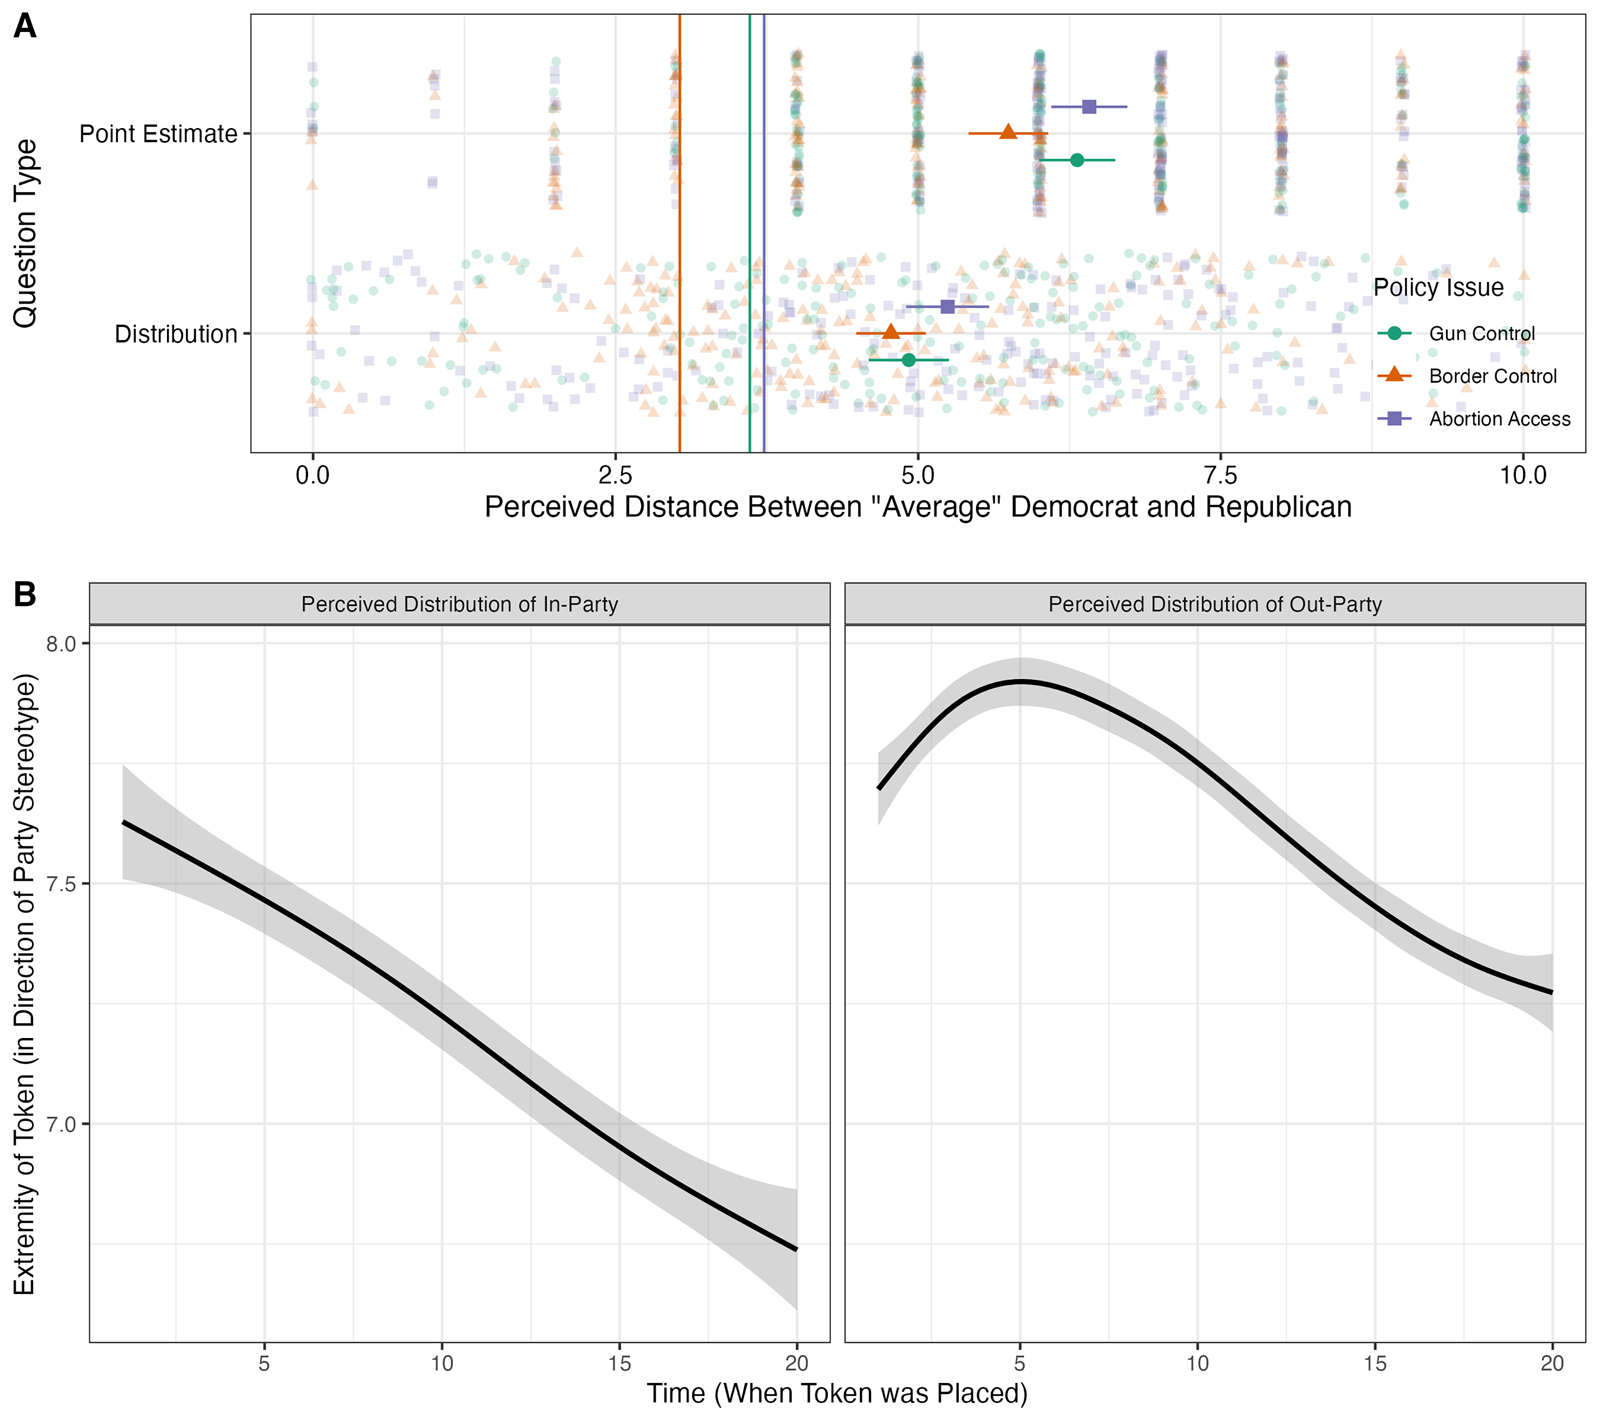
Why might our perceived distribution task yield more modest estimates of perceived polarization? When asked to represent partisans’ policy attitudes, Americans likely “sample” partisan exemplars from memory (Zaller and Feldman, Reference Zaller and Feldman1992; Ahler and Sood, Reference Ahler and Sood2023), and policy extremists may be more accessible in memory (Levendusky and Malhotra, Reference Levendusky and Malhotra2016). Because they are quick to answer, point-estimate questions likely over-represent extreme and accessible exemplars (i.e., stereotypes). Indeed, Figure 5b shows that participants tended to place extreme tokens (exemplars) first when completing our perceived distribution task (studies 4–5). This is true regardless of whether the participant is depicting the attitudes of in-partisans or out-partisans.
3. Discussion
Misperceptions of attitude diversity are likely important to democracy: the perceived diversity of attitudes held by out-partisans and in-partisans may affect the attitudes Americans are willing to adopt or express (Noelle-Neumann, Reference Noelle-Neumann1974; Nicholson, Reference Nicholson2012). If one believes that out-partisans are unified in their opposition to a policy issue, compromise on that issue may seem impossible (e.g., Shi et al., Reference Shi, Zhuang and Wang2010). When policy compromise seems impossible, Americans may worry that out-partisans will violate democratic norms to get their way (Braley et al., Reference Braley, Lenz, Adjodah, Rahnama and Pentland2023). Yet, existing measures cannot capture individuals’ perceptions of how diverse partisans’ attitudes are, in terms of valence and intensity.
We fill this gap by providing a reliable, valid, and intuitive measure of perceived attitude diversity: the “perceived distribution.” We show that participants broadly interpret our perceived distribution task correctly. They draw intuitive distributions in response to different questions. The accuracy of participants’ perceptions of within-party attitude diversity does not vary with participant numeracy or randomized monetary incentives. Additionally, the shape of participants’ perceived distributions correlates with important downstream consequences, even after controlling for perceived extremity.
Our perceived distribution task provides a unique picture of American partisans’ misperceptions about other partisans’ attitudes: we find that Democrats and Republicans vastly under-estimate the diversity of each party's policy attitudes. These misperceptions are correlated with partisan animosity and perceived out-party threat. Indeed, perceived diversity uniquely explains a comparable amount of variation in downstream consequences as perceived extremity. Of course, given different issues, our results may have looked somewhat different. For instance, Americans may perceive a greater within-party attitudinal diversity about controversial but non-partisan issues (e.g., data privacy).
Moreover, contrary to previous research, we find little evidence that partisans consistently over-estimate the extremity of the “average” Republican's or Democrat's attitudes about policy issues. Rather, their tendency to over- and under-estimate the extremity of average partisans is roughly equal. Importantly, the three issues we examine—abortion access, border control, and gun control—are salient and perceived as highly partisan. Thus, the absence of perceived polarization in our data is particularly surprising. Differences in findings derived from canonical measures versus our perceived distribution task can be explained by two facts: (1) policy extremists may be more accessible in memory, and (2) point-estimate questions are quick to answer. Thus, extreme, top-of-mind exemplars—not wholistic perceptions of the party—may drive responses to point-estimate questions.
This is not to say that these extreme, top-of-mind exemplars are not consequential. Insofar as politics is characterized by quick thinking and evaluation, these exemplars could influence political decision-making (Ahler and Sood, Reference Ahler and Sood2023; Weitzel and Sood, Reference Weitzel and Sood2024). However, we should revise our understanding of what canonical measures capture. In existing research, perceived polarization refers to perceptions of the political parties as a whole—not accessible exemplars within those parties (Fernbach and Van Boven, Reference Fernbach and Van Boven2022). If Americans truly perceived Democrats and Republicans as polarized, wholistically speaking, that perception should manifest in our perceived distribution task. Yet, it does not. Thus, canonical measures of “perceived polarization” may be more accurately described as measuring differences in partisan stereotypes.
These findings change our understanding of perceived polarization: The greatest error that American partisans make when intuiting the policy attitudes of other partisans is under-estimating the diversity of these attitudes, not over-estimating the extremity of these attitudes. To be sure, changing what partisan exemplars are accessible in Americans’ memories may continue to be a useful way to address democratic ills (e.g., Voelkel et al., Reference Voelkel, Chu, Stagnaro, Mernyk, Redekopp, Pink, Druckman, Rand and Willer2023). However, novel interventions might also remind Americans of the relatively diverse and moderate out-partisans that they already know. Likewise, encouraging political media to provide a more accurate picture of each party's attitudes may help to reduce misperceptions of within-party attitude diversity and create a healthier democracy (Levendusky and Malhotra, Reference Levendusky and Malhotra2016; Novoa et al., Reference Novoa, Echelbarger, Gelman and Gelman2023).
Supplementary material
The supplementary material for this article can be found at https://doi.org/10.1017/psrm.2024.36.
To obtain replication material for this article, see https://doi.org/10.7910/DVN/RX37FT.


 Open access