


Introduction
Although there are a number of studies on the physico-chemical properties and peroxidase-like activity of ferric heme b (= hemin) in micellar and vesicular systems, the current knowledge in this field is still rather limited. The reason for this primarily lies in the complexity of these systems and the many factors that determine the properties, for example the type of micelle- or vesicle-forming amphiphile used, its concentration, and the presence of other compounds that are expected to influence the catalytic power of hemin in a positive way. Some of the challenges that should be explored further emerge from a compilation of the results obtained so far. More fundamental studies toward a better understanding will help to judge the potential of hemin–micelle or hemin–vesicle systems as simple molecular assemblies for dedicated analytical or synthetic applications. In this Introduction and in the next section, clarifications about the terminology and abbreviations used are important, since they will be applied throughout the entire review.
The term heme (American English) or haem (British English) refers to a coordination complex consisting of a central iron ion which (i) is coordinated to a porphyrin moiety as tetradentate ligand and (ii) may consist of one or two axial ligands (Fig. 1a) (Moss et al., Reference Moss, Smith and Tavernier1995). Heme is a metalloporphyrin in which the metal ion is iron, i.e. heme is an example of an iron porphyrin.
(a) Chemical structure of heme consisting of an iron ion which is coordinated to the four nitrogen atoms of a planar macrocyclic porphyrin ring. The simplest porphyrin structure is shown, often called ‘porphin’, the parent structure of all porphyrins, with indication of the α- and β-positions of one of the four pyrrole units. A and B are the two axial ligands at the 5th and 6th coordination sites, respectively. In depictions of heme, A and B often are omitted, although they are essential for the biophysical properties of free heme and for the catalytic properties of heme as a prosthetic group in heme proteins. (b) Using the ‘1–24 atom numbering system’ for porphin (Moss, Reference Moss1988), all C-atoms at positions 2, 3, 7, 8, 12, 13, 17, and 18 are connected to H-atoms; the base form of one of the two tautomers (before complexation with an iron ion) is drawn. All porphyrins are built from four pyrrole rings that are bridged via methine units and consist of 18 π-electrons that are delocalized (marked in bold). The two tautomers differ with respect to the location of the two N-bonded H-atoms, trans (shown) versus cis (Moss, Reference Moss1988). The methine units with C-atoms 5, 10, 15, and 20 are called meso-positions. In porphyrins different from porphin, one or more H-atoms in the β-positions of the pyrrole groups, at C-atoms 2, 3, 7, 8, 12, 13, 17, and/or 18, or at the methine carbons 5, 10, 15, and/or 20 are substituted by an organic residue. For naturally occurring porphyrins present in biological hemes, substitutions are possible at all mentioned positions. (c) Chemical structure of one of the four possible tautomers of the base form of protoporphyrin IX (= H2PPIX). As compared to the parent porphyrin structure shown in (b), a methyl group is at C2, C7, C12, and C18, an ethenyl (= vinyl) group at C3 and C8, and a propionic acid group at C13 and C17. To specify the four pyrrole rings, they are designated A, B, C, and D, as indicated. Upon metalation with Fe(II) or Fe(III), the two protons connected to the two nitrogen atoms in H2PPIX are released and the corresponding metalloporphyrin heme b is formed, (PPIX)FeII or [(PPIX)FeIII]+, see Fig. 2.

Chemical structures of δ-aminolevulinic acid, uroporphyrinogen III, heme a, heme b (= iron protoporphyrin IX), and heme c. For the three known pathways of the biosynthesis of heme b (Kořený et al., Reference Kořený, Oborník, Horáková, Waller and Lukeš2022), δ-aminolevulinic acid and uroporphyrinogen III are the common intermediates. Biosynthetically, heme a and heme c are related to heme b (see Layer et al., Reference Layer, Reichelt, Jahn and Heinz2010; Hederstedt, Reference Hederstedt2012; San Francisco and Kranz, Reference San Francisco and Kranz2014; Niwa et al., Reference Niwa, Takeda, Kosugi, Tsutsumi, Mogi and Miki2018; Fan et al., Reference Fan, Grimm and Layer2019; Layer, Reference Layer2021; Kořený et al., Reference Kořený, Oborník, Horáková, Waller and Lukeš2022). Fe2+ coordinated to PPIX is called ferrous heme b, abbreviated as (PPIX)FeII, or (por)FeII (with por = PPIX). Fe3+ coordinated to PPIX is called ferric heme b, abbreviated as (PPIX)FeIII or (por)FeIII (with por = PPIX). Ferric heme b is also called hemin (Dunford and Stillman, Reference Dunford and Stillman1976). Often, the term ‘hemin’ is specifically used for (PPIX)FeIII(Cl), while (PPIX)FeIII(OH) is called hematin (or α-hematin) (see Omodeo-Salè et al., Reference Omodeo-Salè, Monti, Olliaro and Taramelli2001; Egan et al., Reference Egan, Chen, de Villiers, Mabotha, Naidoo, Ncokazi, Langford, McNaughton, Pandiancherri and Wood2006; Asher et al., Reference Asher, de Villiers and Egan2009; Huy et al., Reference Huy, Shima, Maeda, Men, Hirayama, Hirase, Miyazawa and Kamei2013). Although shown in their neutral form, the two carboxylic acids of heme a, b, and c will be present in deprotonated form as well, depending on the local environment. DFT (density functional theory) calculations for free (PPIX)FeIII (= hemin) provided pK a values of 4.3 (= pK a1) and 5.6–6.4 (= pK a2) (see Durrant, Reference Durrant2014). Note that in this article, we do not distinguish between heme b (present as a prosthetic group in certain heme proteins) and heme B (the isolated, apoprotein-free form). Such distinction was suggested by Puustinen and Wirkström (Reference Puustinen and Wikström1991).
The general term porphyrin is used for the unsubstituted parent structure of all porphyrins shown in Fig. 1b, previously and often still called porphin, as well as for substituted porphyrins. The latter include any molecule made up of the core structure with C-bound hydrogen atoms (12 possible positions) substituted by alkyl, alkenyl, or other organic moieties (Park et al., Reference Park, Hong, Lee and Jang2021; Senge et al., Reference Senge, Sergeeva and Hale2021).
All porphyrins consist of a cyclic tetrapyrrole unit in which four pyrrole rings are linked at their α-positions (see Fig. 1a) via four methine bridges (–CH=, (Moss, Reference Moss1988)), forming a planar, aromatic macrocycle of 18 delocalized π-electrons. These delocalized electrons are responsible for the characteristic light absorption in the near ultraviolet and visible regions of the spectrum (Gouterman, Reference Gouterman1961), see below.
In addition to porphyrins, there are also a number of porphyrin derivatives (also called porphyrinoids) in which the core structure deviates from the one shown in Fig. 1b, for example with methylene bridges (–CH2–) instead of methine bridges, or with pyrrole rings that are linked without a bridging unit at all, as in the case of vitamin B12 (Moss, Reference Moss1988; Moss et al., Reference Moss, Smith and Tavernier1995, Kim et al., Reference Kim, Oh, Osuka and Kim2022).
For the most abundant porphyrin types present in biological hemes, all hydrogen atoms at the β-positions of the four pyrrole units (see Fig. 1a) are substituted. Depending on the chemical structures of the substituents and on their positions, different heme types result, called heme a, heme b, or heme c (Fig. 2), just to mention three of the most important ones (see e.g. Walker and Simonis, Reference Walker and Simonis2006). Differences between the three heme types exist in the substitutions at positions C3, C8, or C18. Heme c has two covalent thioether linkages to the apoprotein at C3 and C8 (made by cysteine residues of the protein). In the case of heme a, a hydroxyfarnesyl group is present at position C3, which makes the lipophilic part of heme more lipophilic than in the case of heme b. In addition, there is a formyl group at C18 that is easily oxidized to a carboxyl group, making heme a less stable than heme b upon extraction from biological systems (Hederstedt, Reference Hederstedt2012).
Hemes with substitutions at the methine positions are also known, but they will not be considered here. The focus of this review is on heme b (see Fig. 2). In heme b, the porphyrin to which an iron ion is coordinated is called protoporphyrin IX, abbreviated as PPIX (Fig. 1c). In the chemical structure of PPIX shown in Fig. 1c, the C-atoms are numbered according to the IUPAC/IUB recommendations of 1986 (Moss, Reference Moss1988; Moss et al., Reference Moss, Smith and Tavernier1995). The full numbering is given for the parent porphyrin structure shown in Fig. 1b.
Regardless of the great importance of PPIX (metalated and non-metalated), other porphyrin structures than PPIX as well as different porphyrinoids exist in living systems and play essential roles, including (i) in photosynthesis, (ii) for electron transfer processes, and (iii) as prosthetic groups in enzyme-catalyzed oxidation reactions (Lemberg, Reference Lemberg1954; Battersby, Reference Battersby2000; Dayan and Dayan, Reference Dayan and Dayan2011; Senge et al., Reference Senge, Sergeeva and Hale2021). This enormous importance of metalloporphyrins in biological systems explains the great interest in these metal-organic complexes. According to Senge et al. (Reference Senge, Sergeeva and Hale2021), from a purely physico-chemical point of view, the parent unsubstituted porphyrin structure shown in Fig. 1b is the most difficult porphyrin to work with, mainly due to its insolubility in many solvents, i.e. its strong propensity to self-associate into aggregates (Senge and Davis, Reference Senge and Davis2010). For this and other reasons, many different types of non-natural porphyrins have been synthesized in the past (Zipplies et al., Reference Zipplies, Lee and Bruice1986; Sitte and Senge, Reference Sitte and Senge2020; Park et al., Reference Park, Hong, Lee and Jang2021; Senge et al., Reference Senge, Sergeeva and Hale2021). They are being used as free porphyrins or as metalloporphyrins for fundamental studies, analytical and medical applications, as well as for the fabrication of functional materials (Berg et al., Reference Berg, Selbo, Weyergang, Dietze, Prasmickaite, Bonsted, Engesaeter, Angell-Petersen, Warloe, Frandsen and Høgset2005; Huang et al., Reference Huang, Song, Rieffel and Lovell2015; Sitte and Senge, Reference Sitte and Senge2020; Park et al., Reference Park, Hong, Lee and Jang2021; Shi et al., Reference Shi, Zhang and Linhardt2021). In biological systems, heme is essential for the survival of virtually all types of organisms, including bacteria (Gallio et al., Reference Gallio, Fung, Cammack-Najera, Hudson and Raven2021). Heme is indispensable for the functioning of thousands of different proteins. More recently, evidence has been presented for the role of heme in ‘heme-responsive sensors’ that are involved in many important physiological functions, including heme-dependent transcriptional and translational regulation, tRNA synthesis, microRNA processing, heme-based potassium cation-channel regulation, and heme-based protein degradation (Shimizu et al., Reference Shimizu, Lengalova, Martínek and Martínková2019; Krüger et al., Reference Krüger, Keppel, Sharma and Frunzke2022). It is likely that hemes played at least some of these roles already in early cells, and porphyrins and hemes might have been present in prebiotic times, promoting photochemical processes and catalyzing chemical transformations in precellular compartment systems (often called ‘protocells’) (see e.g. Chen and Walde, Reference Chen and Walde2010; Monnard and Walde, Reference Monnard and Walde2015; Joyce and Szostak, Reference Joyce and Szostak2018; Toparlak and Mansy, Reference Toparlak and Mansy2019; Gözen et al., Reference Gözen, Köksal, Põldsalu, Xue, Spustova, Pedrueza-Villalmanzo, Ryskulov, Meng and Jesorka2022; Imai et al., Reference Imai, Sakuma, Kurisu and Walde2022).
Heme b is the simplest and most common heme type in biological systems (Bertini et al., Reference Bertini, Gray, Stiefel and Valentine2007). Therefore, often when ‘heme’ is mentioned in the literature without specification of the heme type, heme b is actually meant (see e.g. Kořený et al., Reference Kořený, Oborník, Horáková, Waller and Lukeš2022). There are three known biosynthesis routes that lead to heme b, with δ-aminolevulinic acid and uroporphyrinogen III (Fig. 2) as common intermediates (Layer, Reference Layer2021; Kořený et al., Reference Kořený, Oborník, Horáková, Waller and Lukeš2022). It seems that this diversity in heme b biosynthesis pathways is the result of an evolutionary optimization. In any case, heme b is present as a prosthetic group in the active site of many different types of heme proteins (also called hemoproteins) that perform astonishingly diverse functions, see the next section.
In ferrous heme b, Fe(II) is complexed to PPIX. Three different ways of abbreviating ferrous heme b are Fe(II)PPIX (= ferrous protoporphyrin IX), (PPIX)FeII, or (por)FeII, with ‘por’ standing for the porphyrin PPIX. These, or similar, abbreviations are often used in the literature (see e.g. Dunford, Reference Dunford2010; Campomanes et al., Reference Campomanes, Rothlisberger, Alfonso-Prieto and Rovira2015). In ferric heme b, Fe(III) is complexed to PPIX, abbreviated as Fe(III)PPIX (= ferric protoporphyrin IX), (PPIX)FeIII, or (por)FeIII (again with ‘por’ = PPIX). Ferric heme b is also known as hemin (Dunford and Stillman, Reference Dunford and Stillman1976), see Fig. 2. One way of specifying the type of axial ligands coordinating to the central iron ion as well as discriminating between mono- and bis-coordination (5th or 5th and 6th coordination sites, ligands A and B in Fig. 1a) is as follows: (PPIX)FeIII(Cl) in case one likes to emphasize that one chloride ion coordinates to ferric heme b; (PPIX)FeIII(OH) to indicate coordination of one hydroxyl group, or (PPIX)FeIII(DMSO,DMSO) for indicating the coordination of two dimethylsulfoxide (DMSO) molecules. Often the term ‘hemin’ is used exclusively for (PPIX)FeIII(Cl), while (PPIX)FeIII(OH) is called hematin (or α-hematin) (see Omodeo-Salè et al., Reference Omodeo-Salè, Monti, Olliaro and Taramelli2001; Egan et al., Reference Egan, Chen, de Villiers, Mabotha, Naidoo, Ncokazi, Langford, McNaughton, Pandiancherri and Wood2006; Asher et al., Reference Asher, de Villiers and Egan2009; Huy et al., Reference Huy, Shima, Maeda, Men, Hirayama, Hirase, Miyazawa and Kamei2013; de Villiers and Egan, Reference de Villiers and Egan2014; Kuter et al., Reference Kuter, Mohunlal, Fitzroy, Asher, Smith, Egan and De Villiers2016). In this review, we do not make this differentiation. Hemin stands for any type of (PPIX)FeIII, independent from the chemical structure of the axial ligand(s). In experimental work, often (PPIX)FeIII(Cl) is used as a commercially available source of ferric heme b, sold as ‘hemin’. Dispersing (PPIX)FeIII(Cl) in aqueous NaOH solution will result in a rapid exchange of the chloride ion at the 5th coordination site forming (PPIX)FeIII(OH,H2O) or (PPIX)FeIII(OH,OH) (see Brown and Lantzke, Reference Brown and Lantzke1969).
In the following, we will first provide a brief overview of some heme proteins and their biological roles to illustrate the diversity of their functions. Then we will focus on the catalytic activity of selected heme b-containing enzymes (mainly heme b peroxidases). Afterward, two selected physico-chemical properties of hemin when dispersed or dissolved in an aqueous medium or in non-aqueous solvents will be discussed, followed by a summary of the current knowledge about the properties of hemin in micellar and vesicular systems. In that section it will be outlined why studies on the catalytic activity of hemin in the presence of micelles or vesicles are of interest. Some of the arguments discussed are in direct relation to the content of the succeeding section, which deals with the possible prebiotic presence of heme on the early Earth before life emerged from non-living forms of matter, at the origin of life. The final section provides conclusions about the entire field covered and a brief outlook on challenges that should be addressed in future studies. Figure 3 lists topics of interest in relation to research on heme b, including those highlighted in this review. A similar compilation of research topics could also be made for other hemes, as well as for metal-free porphyrins.
Topics of interest in research on heme b (or other heme types), as highlighted in this review: (i) activity of heme b proteins in biological systems in terms of dependence of the activity on the oxidation state of the iron ion, the structure of the apoprotein, and the local environment of the protein-embedded heme group; (ii) physico-chemical properties of free heme b in aqueous and non-aqueous media; (iii) possible prebiotic formation of heme b; and (iv) preparation of heme b-based systems for mimicking the activity of heme b proteins. Understanding the physico-chemical properties of heme b helps understanding diseases caused by free heme b, designing heme b-protein mimics, and contributes to the discussion of scenarios concerning possible role(s) heme b might have played in prebiotic times.

Understanding the biophysical properties of free heme b is particularly useful for developing synthetic heme b-based catalytic systems that mimic the function of heme b proteins but do not contain a protein scaffold. Micellar and vesicular systems containing hemin belong to this category, see later Fig. 15.
The different roles of hemes in biological systems
Overview
The mere fact that the heme group – heme b, heme c, or another heme type – has many different functions in biological systems (in eukaryotes as well as in prokaryotes) not only underscores its importance, possibly already in early forms of life, but is also fascinating from a purely physico-chemical perspective. The key component of all hemes is the central iron ion with its ability to release or accept electrons, i.e. its redox properties, when an electron from ferrous bivalent iron is released to form ferric trivalent iron in a one-electron oxidation reaction, (por)FeII → (por)FeIII + 1 e−, with ‘por’ standing for any type of porphyrin, or when trivalent ferric iron is reduced to ferrous iron, (por)FeIII + 1 e− → (por)FeII. In addition, in catalytically active heme proteins the formation of tetravalent ferryl iron, oxoiron(IV), FeIV(=O) (see George and Irvine, Reference George and Irvine1956; Huang and Groves, Reference Huang and Groves2018) is an essential step, obtained in the case of heme peroxidases by a two-electron oxidation from ferric heme: (por)FeIII + H2O2 → (por+•)FeIV(O) + H2O (Dunford, Reference Dunford2010), see below.
Although iron is the second most abundant metal on Earth after aluminum (Williams and da Silva, Reference Williams and da Silva1997), free Fe2+ or Fe3+ are very toxic, and their concentrations in biological systems must be kept low; reactive oxygen species can form, for example the hydroxyl radical (HO•) or the superoxide radical anion (O2•−) (see Crielaard et al., Reference Crielaard, Lammers and Rivella2017; Eid et al., Reference Eid, Arab and Greenwood2017; Muckenthaler et al., Reference Muckenthaler, Rivella, Hentze and Galy2017; Shimizu et al., Reference Shimizu, Lengalova, Martínek and Martínková2019; Katsarou and Pantopoulos, Reference Katsarou and Pantopoulos2020). Upon complexation of Fe2+ and Fe3+ to porphyrins, for example PPIX, the formed iron porphyrin complex remains toxic. Some of the reasons for the toxic effect of free hemin are (i) its interaction with biological membranes causing changes in the fluidity and permeability (Kumar and Bandyopadhyay, Reference Kumar and Bandyopadhyay2005; Qutub et al., Reference Qutub, Uzunova, Galkin and Vekilov2010), and (ii) the hemin-catalyzed degradation of proteins and the formation of modified lipids including lipid peroxides, resulting in an alteration of the membrane properties (Kumar and Bandyopadhyay, Reference Kumar and Bandyopadhyay2005; Robinson et al., Reference Robinson, Dang, Dringen and Bishop2009). This explains why the concentration of free heme b in living systems (ca. 25–300 nM in mammalian cells, see Donegan et al., Reference Donegan, Moore, Hanna and Reddi2019) is tightly regulated by O2-dependent heme oxygenase systems and through the formation of non-toxic heme–protein complexes (involving e.g. albumin) (Kumar and Bandyopadhyay, Reference Kumar and Bandyopadhyay2005; Unno et al., Reference Unno, Matsui and Ikeda-Saito2007; Matsui et al., Reference Matsui, Unno and Ikeda-Saito2010).
There are various dedicated biological functions of heme, enabling (i) certain oxidation reactions to occur selectively (e.g. in the case of heme peroxidases, catalases, cytochrome P450, or nitric oxide (NO) synthase), (ii) electron transfer reactions (e.g. in the case of cytochrome c), or (iii) the transport and storage of gaseous molecules (the case of hemoglobin (Hb) and myoglobin (Mb)). The hemes may even act (iv) as signaling agents in heme-responsive sensors, or (v) as heme-based gas sensors. This diversity of functions in contemporary forms of life might provide a hint for the importance of hemes in early cells and possibly before the first cells emerged. These diverse functions of hemes in biological cells are illustrated with a few examples.
Conceptually, the involvement of heme in the different biological functions can be grouped in two categories.
The first category consists of heme proteins with either a covalently bound heme group (e.g. heme c in cytochrome c), or a non-covalently associated heme group (e.g. heme b in Mb, Hb, horseradish peroxidase (HRP), catalase, NO synthase (NOS), indoleamine 2,3-dioxygenase (IDO), or cytochrome P450), see Fig. 4. All these heme b proteins have different functions, see Table 1. In the case of heme-based gas sensors, which also belong to this category, binding of a gaseous molecule to the heme group in the ‘sensor module’ (a specific domain of the protein) results in a change of the activity at the ‘catalytic module’ (another, spatially separated domain of the protein). This occurs due to bound gas molecule-induced conformational changes that are transmitted from the ‘sensor module’ via the ‘transducer module’ (a third protein domain) to the ‘catalytic module’. Soluble guanylate cyclase (sGC) is one such example (Kang et al., Reference Kang, Liu, Wu and Chen2019), schematically shown in Fig. 5. In this case the sensor molecule is NO, and binding occurs to ferrous heme b.
(a) Crystal structures of selected examples of heme proteins containing heme b: sperm whale myoglobin (Mb), horse deoxy hemoglobin (Hb), human catalase, horseradish peroxidase (HRP), human indoleamine 2,3-dioxygenase, the heme domain of rat neuronal nitric oxide synthase (NOS), and human cytochrome P450. (b) Details of the active site of the crystal structure of HRP, with (PPIX)FeIII (= hemin) non-covalently bound to a hydrophobic pocket formed by the apoprotein. The two carboxylates of hemin are localized at the periphery of HRP. The positions of the proximal His170, distal His42, and distal Arg38 and the existence of an extended H-bond network are emphasized, as reported by Smulevich et al. (Reference Smulevich, Feis and Howes2005) (see also Veitch, Reference Veitch2004; Battistuzzi et al., Reference Battistuzzi, Bellei, Bortolotti and Sola2010). The H-bond between His170 and Asp247 (Smulevich et al., Reference Smulevich, Paoli, Burke, Sanders, Thorneley and Smith1994) seems to contribute to the reactivity of HRP by increasing the electron donating properties of His170 (see Ortmayer et al., Reference Ortmayer, Fisher, Basran, Wolde-Michael, Heyes, Levy, Lovelock, Anderson, Raven, Hay, Rigby and Green2020). (b) Reprinted with permission from Smulevich et al. (Reference Smulevich, Feis and Howes2005), Copyright 2005 American Chemical Society.

Example of a heme-based gas sensor: soluble guanylate cyclase (sGC). (a) Schematic representation of the conformational changes during the activation of human sGC by gaseous nitric oxide (NO) generated by NOS from l-Arg and O2 (see Table 1), as reported by Kang et al. (Reference Kang, Liu, Wu and Chen2019). sGC is a heterodimeric protein complex composed of one α-subunit and one β-subunit; H-NOX is the sensor domain (‘sensor module’), which consists of ferrous heme b, (PPIX)FeII (labeled ‘Haem’), able to bind NO (and O2 or CO, similarly to Hb and Mb). NO binding to β1 H-NOX triggers structural rearrangements and conformational changes that affect the catalytic domains (CD, ‘catalytic module’), resulting in a boosting of the catalytic activity of sGC (see Derbyshire and Marletta, Reference Derbyshire and Marletta2012; Herzik et al., Reference Herzik, Jonnalagadda, Kuriyan and Marletta2014; Kang et al., Reference Kang, Liu, Wu and Chen2019). The other two domains shown are the PAS (Per/ARNT/Sim) domain and the CC (coiled-coil) domain (‘transducer module’). (b) Ribbon drawing for the heme-binding domain β1 H-NOX in sGC of the moth Manduca sexta, as reported by Montfort et al. (Reference Montfort, Wales and Weichsel2017). (PPIX)FeII is shown as stick representation. C-atoms are drawn in black, N atoms in blue, and O atoms in red. His105 is the proximal axial ligand that coordinates to Fe(II). After binding of NO to (PPIX)FeII, the bond between Fe(II) and the proximal His105 is broken, which results in conformational changes (Herzik et al., Reference Herzik, Jonnalagadda, Kuriyan and Marletta2014; Montfort et al., Reference Montfort, Wales and Weichsel2017; Wittenborn and Marletta, Reference Wittenborn and Marletta2021). The reaction catalyzed by sGC in the CD domain is: GTP (guanosine 5′-triphosphate) → GMP (cyclic guanosine 3′,5′-monophosphate) + PPi (inorganic pyrophosphate = diphosphate) (see Denninger and Marletta, Reference Denninger and Marletta1999). Reproduced with permission from (a) Kang et al. (Reference Kang, Liu, Wu and Chen2019), Springer Nature and (b) Montfort et al. (Reference Montfort, Wales and Weichsel2017), Mary Ann Liebert, Inc.

Examples of the biological function of selected heme proteins containing heme b (Bertini et al., Reference Bertini, Gray, Stiefel and Valentine2007; Efimov et al., Reference Efimov, Basran, Thackray, Handa, Mowat and Raven2011; Ortiz de Montellano, Reference Ortiz de Montellano and Lyubimov2012; Poulos, Reference Poulos2014; Huang and Groves, Reference Huang and Groves2018; Cinelli et al., Reference Cinelli, Do, Miley and Silverman2020)

The second category, to which the heme-responsive sensors belong, consists of proteins that do not have a heme group, but instead carry a binding site for heme (Shimizu et al., Reference Shimizu, Lengalova, Martínek and Martínková2019; Krüger et al., Reference Krüger, Keppel, Sharma and Frunzke2022). Upon binding of free heme to this binding site, conformational changes in the protein occur, resulting in a change of the protein properties. One example is the membrane-embedded potassium ion channel Kv1.4, as schematically shown in Fig. 6 (Sahoo et al., Reference Sahoo, Goradia, Ohlenschläger, Schönherr, Friedrich, Plass, Kappl, Hoshi and Heinemann2013; Burton et al., Reference Burton, Kapetanaki, Chernova, Jamieson, Dorlet, Santolini, Moody, Mitcheson, Davies, Schmid, Raven and Storey2016; Shimizu et al., Reference Shimizu, Lengalova, Martínek and Martínková2019). Binding of heme b to Kv1.4 results in conformational changes that prevent closing of the channel so that the permeation of potassium ions for the heme b-bound channel protein is increased if compared to the same channel protein without heme b.
Example of a membrane-bound heme-responsive sensor: voltage-gated K+ (Kv) channel Kv1.4. (a) Cartoon representation of the interaction of free ferrous or free ferric heme b, (PPIX)FeII or (PPIX)FeIII (red diamond symbol), with membrane-bound Kv1.4, as summarized by Burton et al. (Reference Burton, Kapetanaki, Chernova, Jamieson, Dorlet, Santolini, Moody, Mitcheson, Davies, Schmid, Raven and Storey2016), based on the experimental results reported by Sahoo et al. (Reference Sahoo, Goradia, Ohlenschläger, Schönherr, Friedrich, Plass, Kappl, Hoshi and Heinemann2013). Heme b binds to the N-terminal domain of the channel protein and impairs an inactivation process that is known to occur in the absence of heme b. In this way, heme b acts as a regulator of the potassium ion channel activity of Kv1.4. The investigations showed that the heme b-responsive binding motif in the N-terminal domain most likely involves His16 and His35, as well as Cys13. Heme b binding induces a conformational constraint that prevents the N-terminal inactivation domain from reaching its receptor site at the vestibule of the channel pore (see Sahoo et al., Reference Sahoo, Goradia, Ohlenschläger, Schönherr, Friedrich, Plass, Kappl, Hoshi and Heinemann2013). The cell membrane is depicted in pale blue and the intracellular side is at the bottom. The light purple rectangles depict the conduction pore of the Kv1.4 channel. The dark purple rectangles are the voltage sensor domains in the Kv1.4 channel. Other transmembrane domains have been omitted for simplicity (see Burton et al., Reference Burton, Kapetanaki, Chernova, Jamieson, Dorlet, Santolini, Moody, Mitcheson, Davies, Schmid, Raven and Storey2016). (b) Using a recombinant 61 amino acid long peptide with the sequence of the N-terminal inactivation domain and NMR spectroscopy, the peptide conformation and the binding of heme b to the peptide through the imidazole rings of His16 and His35, coordinated at the 5th and 6th coordination positions of Fe(II) or Fe(III), is illustrated. Adopted from Sahoo et al. (Reference Sahoo, Goradia, Ohlenschläger, Schönherr, Friedrich, Plass, Kappl, Hoshi and Heinemann2013). Reproduced with permission from (a) Burton et al. (Reference Burton, Kapetanaki, Chernova, Jamieson, Dorlet, Santolini, Moody, Mitcheson, Davies, Schmid, Raven and Storey2016) and (b) Sahoo et al. (Reference Sahoo, Goradia, Ohlenschläger, Schönherr, Friedrich, Plass, Kappl, Hoshi and Heinemann2013).

The fact that heme proteins composed of the very same heme group can have diverse activities is surprising at first glance, but can be understood by considering the molecular complexities of the heme-binding domain of the different apoprotein structures in which the heme group is embedded. These local apoprotein features must be taken into account if one aims to mimic a certain heme b protein function by placing heme b in a non-natural environment. Selected examples of heme b-containing proteins are given in Fig. 4 and Table 1. There are at least five factors which determine the activity at the heme group of heme b proteins.
The first factor is the oxidation state of the iron ion. For the binding of O2 to heme b in Hb, Mb, or IDO, the iron ion must be in ferrous state, i.e. heme b must be (PPIX)FeII, embedded in the appropriate environment of the apoprotein (see Jensen and Ryde, Reference Jensen and Ryde2004; Jensen et al., Reference Jensen, Roos and Ryde2005; Shikama, Reference Shikama2006). The same is true for NOS, when NO binds to heme b, or for cytochrome P450, when O2 binds. Since in both cases, the resting state of the enzyme contains ferric heme b, (PPIX)FeIII, a reduction of (PPIX)FeIII to (PPIX)FeII must precede the binding of these gaseous molecules to the enzymes (Guengerich, Reference Guengerich2018; Jeffreys et al., Reference Jeffreys, Girvan, McLean and Munro2018; Tejero et al., Reference Tejero, Hunt, Santolini, Lehnert and Stuehr2019; Cinelli et al., Reference Cinelli, Do, Miley and Silverman2020). In the case of the catalytic cycle of cytochrome P450, for example, ferric heme b of the resting state of the enzyme is first reduced to the ferrous state, involving NADH (nicotinamide adenine dinucleotide, reduced form) or NADPH (nicotinamide adenine dinucleotide phosphate, reduced form) and a reductase. Moreover, after binding of O2 to the intermediate (PPIX)FeII, for an oxidation of the substrate to occur, a further reduction of (PPIX)FeII containing bound O2 is required by the delivery of an electron from an electron donor partner (Ortiz de Montellano, Reference Ortiz de Montellano and Lyubimov2012; Jeffreys et al., Reference Jeffreys, Girvan, McLean and Munro2018). Then, after protonation, O2 is heterolytically cleaved, resulting finally in the oxidation of the substrate, e.g. octane is oxidized to octan-1-ol (‘R’ and ‘RO’, respectively in Table 1). Overall, the catalytic cycle of cytochrome P450 is very complex and, therefore, it is very challenging to mimic it in vitro with a heme b system that lacks the apoprotein and the other cofactors and enzymes required for the functioning of the enzyme in vivo. The same can be said for NOS as an example. In the case of HRP, however, the catalytic cycle is ‘simpler’ since ferric heme b, (PPIX)FeIII of the resting state can directly be activated (oxidized) by H2O2 as a terminal oxidant (Berglund et al., Reference Berglund, Carlsson, Smith, Szöke, Henriksen and Hajdu2002; Dunford, Reference Dunford2010), see Fig. 7a. Therefore, there are many attempts to mimic the activity of HRP by using isolated ferric heme b (= hemin).
Peroxidase cycle of HRP. (a) Schematic representation of the three steps of the peroxidase cycle of heme peroxidases like HRP (see e.g. Torres et al., Reference Torres, Bustos-Jaimes and Le Borgne2003; Campomanes et al., Reference Campomanes, Rothlisberger, Alfonso-Prieto and Rovira2015; Cvjetan et al., Reference Cvjetan, Kissner, Bajuk-Bogdanović, Ćirić-Marjanović and Walde2022). Step 1 is the two-electron oxidation of HRP in its resting state (with the ferric heme b group, (por)FeIII, por = PPIX) by H2O2, which yields compound I (por+•)FeIV(O), with a π-cation radical on the porphyrin ring. In this first step, H2O2 must be able to reach Fe(III) at the distal site. In step 2, compound I oxidizes the reducing substrate (R-H, e.g. phenol, see Table 1) in the solvent-exposed δ-region of the heme group in an one-electron oxidation reaction to yield the substrate radical R• (e.g. phenol radical, see Table 1) and compound II (por)FeIV(O) or (por)FeIV(OH)+ (see Derat and Shaik, Reference Derat and Shaik2006; Campomanes et al., Reference Campomanes, Rothlisberger, Alfonso-Prieto and Rovira2015). With step 3 – another one-electron oxidation of R-H at the δ-region of the heme group – the cycle is closed and the resting state of HRP is again obtained. Overall stoichiometry: 2RH + H2O2 → 2R• + 2H2O. (b) Key intermediate ‘compound I’. Illustration of the coordination of the proximal His170 to oxoferryl PPIX as a radical cation (green) (see Moody and Raven, Reference Moody and Raven2018). (c) Mechanism of the formation of compound I in HRP, occurring at the distal side of (por)FeIII, as described by Rodriguez-López et al. (Reference Rodríguez-López, Lowe, Hernández-Ruiz, Hiner, García-Cánovas and Thorneley2001) for neutral or basic pH (neutral His42). (b) Reproduced with permission from Moody and Raven (Reference Moody and Raven2018), Copyright 2018 American Chemical Society. (c) Adapted with permission from Rodriguez-López et al. (Reference Rodríguez-López, Lowe, Hernández-Ruiz, Hiner, García-Cánovas and Thorneley2001), Copyright 2001 American Chemical Society.
The second factor is the chemical structure of the electron donating functional group of the amino acid side chain of the apoprotein that coordinates to the heme group axially at the 5th coordination site, the ‘proximal side’, for example a thiol of a cysteine (e.g. in the case of cytochrome P450 or NOS), the imidazole group of a histidine (e.g. in the case of Hb, Mb, HRP, or IDO), or the phenolic hydroxy group of a tyrosine (e.g. in the case of human catalase), see Table 1.
The third factor is the functional groups present at the ‘distal side’ of the heme group, opposite to the proximal side. In the case of HRP, the side chains of a distal histidine and a distal arginine are important for the efficient oxidation of ferric heme b by H2O2 to compound I (a powerful oxidant), with a FeIV=O oxoferryl group in the center of the porphyrin and a π-cation radical on the porphyrin PPIX, (por+•)FeIV(O) (Fig. 7b). The reported reduction potential of the compound I/compound II couple is 880–900 mM (referenced to the standard hydrogen electrode) (see Torres and Ayala, Reference Torres and Ayala2010).
The fourth factor is the accessibility of the heme group for the substrate molecules that need to reach the heme group. One example is the accessibility of H2O2 at the 6th coordination site of heme b in HRP in the first step of the catalytic cycle (Rodríguez-López et al., Reference Rodríguez-López, Lowe, Hernández-Ruiz, Hiner, García-Cánovas and Thorneley2001) (Fig. 7c). The apoprotein structure in the vicinity of the distal side of the heme group allows the oxidizing substrate, H2O2, to approach Fe(III). Furthermore, if the 6th coordination site would be blocked by a strongly coordinating ligand (Durrant, Reference Durrant2014), H2O2 would not be able to bind to the iron ion, so that the required formal transfer of two electrons from the heme group to the bound O-atom and a heterolytic cleavage of the peroxo (–O–O–) bond in H2O2 to form compound I, (por+•)FeIV(O) (Vidossich et al., Reference Vidossich, Fiorin, Alfonso-Prieto, Derat, Shaik and Rovira2010) would not occur, see Fig. 7c. The formation of compound I as an intermediate of the peroxidase cycle of HRP, as well as the formation of compound II is reflected in the absorption spectrum of HRP in the Soret and Q-band regions of the spectrum, see Fig. 8. The reported reduction potential of the compound II/Fe(III) couple is 870–900 mV (referenced to the standard hydrogen electrode) (see Torres and Ayala, Reference Torres and Ayala2010).
(a) UV/vis absorption spectra of the resting state of HRP (‘native’) and of the two intermediates of the peroxidase cycle, compound I (‘I’) and compound II (‘II’), as reported by Dunford (Reference Dunford2010). The Soret-band region of the spectrum is shown on the left-hand side, the much less intense Q-band region on the right-hand side. Native HRP is brown, compound I is green, and compound II is red. The molar absorptions are given for HRP isoenzyme C (HRPC), the most abundant isoenzyme of HRP, λ 403 (native HRP) = 1.02 × 10⁵ M−1 cm−1 (see Dunford, Reference Dunford2010). Similar spectra were obtained at pH = 5 by Sumithran et al. (Reference Sumithran, Sono, Raner and Dawson2012) and at pH = 10.7 by Hewson and Hager (Reference Hewson and Hager1979). Furthermore, Smith et al. (Reference Smith, Sanders, Thorneley, Burke and Bray1992) showed that the absorption spectrum of native (glycosylated) HRPC (measured at pH = 7.0) and the peroxidase activity are very similar to the spectrum of recombinant (non-glycosylated) HRPC; indicating an insignificant influence of the glycosidic chains on the structural properties of the heme group and on the activity of purified HRP, at least at pH = 7.0. (b) Dependence on pH of the UV/vis absorption spectrum of H170A hHRP (10 μM), a mutant of native HRP in which the proximal histidine (His170, see Fig. 4b) was replaced by alanine, as reported by Newmyer (Reference Newmyer1996) and Newmyer et al. (Reference Newmyer, Sun, Loehr and Ortiz de Montellano1996); ‘hHRP’ indicates the presence of a terminal polyhistidine tag in the mutant. Solid line: pH = 4, (0.1 M acetate); dotted line: pH = 5 (0.1 M phosphate); short dashed line: pH = 6 (0.1 M phosphate); long dashed line: pH = 7.0 (0.1 M phosphate) (see Newmyer, Reference Newmyer1996). The strong pH-dependency of the spectrum seems to reflect binding of distal His42 and H2O or HO− to Fe(III) (see Newmyer et al., Reference Newmyer, Sun, Loehr and Ortiz de Montellano1996). The pattern in the Q-band region indicates hexacoordination of Fe(III), see Fig. 18a. (a) Reproduced with permission from Wiley. (b) Reprinted with permission from Newmyer et al. (Reference Newmyer, Sun, Loehr and Ortiz de Montellano1996), Copyright 1996 American Chemical Society.

The fifth factor is the local heme b environment in terms of (i) the hydrophilic parts of heme b that are exposed to the bulk aqueous solution, (ii) electrostatic interactions between amino acid residues of the apoprotein and the two propionic acid groups of heme b, and (iii) the hydrophobicity as well as the local charges around the porphyrin core of heme b. All of these interactions, together with the second and third factors mentioned above, have a significant influence on the redox potential of heme b. For heme proteins, the impact of each factor on the redox potential was ranked as follows: axial coordination (280 mV), metalloporphyrin type (245 mV), heme burial (36–138 mV, up to 500 mV), and local charges (40–135 mV, up to 200 mV) (Reedy and Gibney, Reference Reedy and Gibney2004; Torres and Ayala, Reference Torres and Ayala2010). It is expected that HRP-mimicking catalysts, such as heme b in micellar or vesicular systems, will depend on each of these factors. It remains to be investigated how these factors can be adjusted in an apoprotein-free system in vitro in order to obtain a heme b-based catalytic system of the desired redox potential, and catalytic performance.
In addition to the actual oxidation state of the iron ion in heme proteins, the iron's spin state is a characteristic property of iron porphyrins. In the case of ferric heme b, (PPIX)FeIII, with one or two axial ligands, three spin states are known for the five d electrons of Fe(III) (Scheidt and Reed, Reference Scheidt and Reed1981). They are the low-spin S = 1/2 state [(dxy)2 (dxz, dyz)3], the high-spin S = 5/2 state [(dxy)1 (dxz, dyz)2 (dz 2)2 (dx 2–y 2)0], and the intermediate-spin state. The intermediate-spin state is either a pure intermediate S = 3/2 state [(dxy)2 (dxz, dyz)2 (dz 2)1 (dx 2–y 2)0] or an admixed-intermediate S = 3/2, 5/2 state due to spin–orbit coupling, see Scheidt and Reed (Reference Scheidt and Reed1981) for details. The spin state in ferric heme b is determined by the axial ligands and the environment. The stronger the ligand field, the greater the d-orbital splitting and the more likely a low-spin state will be obtained (Scheidt and Reed, Reference Scheidt and Reed1981). This is independent of whether the heme is part of a heme protein or whether it is a synthetic heme complex. Strong axial ligands lead to low-spin hexacoordinated hemes, e.g. (PPIX)FeIII(Im,Im) (Scheidt and Reed, Reference Scheidt and Reed1981) or (PPIX)FeIII(pyr,pyr) (Ncokazi and Egan, Reference Ncokazi and Egan2005). Weaker axial ligands, typically anionic ones (e.g. chloride) lead to high-spin pentacoordinated hemes (Scheidt and Reed, Reference Scheidt and Reed1981). Since the main determinant of the spin state is the axial ligand field, there is a correlation between the spin state and the length of the bond between the iron ion and the N atoms coordinating to the iron (Nporphyrin). A short Fe–Nporphyrin bond means a strong bond, resulting in a low-spin state; a long Fe–Np orphyrin bond means a weak bond, resulting in a high-spin state, see the examples given by Scheidt and Reed (Reference Scheidt and Reed1981).
For gaining insight into the spin state of native, glycosylated (or recombinant, non-glycosylated) HRP, detailed resonance Raman spectroscopy measurements of solutions of recombinant HRP isoenzyme C (HRPC) dissolved in an aqueous buffer solution of pH ≈ 7 were carried out at T = 296 K (room temperature) and at T < 200 K (Smulevich et al., Reference Smulevich, English, Mantini and Marzocchi1991, Reference Smulevich, Paoli, Burke, Sanders, Thorneley and Smith1994, Reference Smulevich, Feis and Howes2005). The measurements involved the analysis of the C=C stretching frequency of the two vinyl groups of PPIX after excitation in the Soret- or Q-band regions of the absorption spectrum. The overall conclusion from these measurements was that Fe(III) of the heme group of HRP at room temperature is a pentacoordinated mixed-spin state (Huang et al., Reference Huang, Maberge, Szigeti, Fidy and Schweitzer-Stenner2003; Smulevich et al., Reference Smulevich, Feis and Howes2005). This state is, for example, characterized by an absorption spectrum similar to a pentacoordinated high-spin heme, but with shorter wavelength π → π* transitions at 630–635 nm due to the porphyrin to iron charge transfer transitions (Smulevich et al., Reference Smulevich, Feis and Howes2005). According to Smulevich et al. (Reference Smulevich, Feis and Howes2005), the spin state of HRP at pH ≈ 7 and room temperature ‘reflects a quantum mechanical admixture of intermediate (S = 3/2) and high (S = 5/2) spin states and is unusual in biological systems’. For an alkaline HRP solution (pH = 12), the absorption and resonance Raman spectra were characteristic of mainly hexacoordinated low-spin heme (due to the coordination of hydroxide ions to the iron and a strong H-bond between the axial hydroxide ligand and distal His42 and/or Arg38) (Feis et al., Reference Feis, Marzocchi, Paoli and Smulevich1994).
As a general conclusion drawn from the spin-state analysis of mutants of heme peroxidases, it seems that there is not necessarily a direct correlation (see Laberge et al., Reference Laberge, Szigeti and Fidy2004) between spin state and the catalytic activity of a heme enzyme; important is the role of the key amino acid residues involved in the catalytic cycle (including also the important amino acid side chains at the distal side of the heme group and the presence of an extensive network of H-bonds coupling the distal and proximal sides) (Smulevich et al., Reference Smulevich, Feis and Howes2005). The following section deals with the role of the amino acids at the heme's proximal and distal sides in HRP.
The importance of proximal His170 and distal His42 in HRP
One model to explain the role of proximal His170 and distal His42 and Arg38 in the first step of the catalytic peroxidase cycle of HRP is the ‘push–pull’ mechanism (Sono et al., Reference Sono, Roach, Coulter and Dawson1996; Shinomiya et al., Reference Shinomiya, Araki, Momotake, Kotani, Kojima and Yamamoto2019), see Fig. 9. A pair of electrons is donated from the imidazole group of His170 to the ferric iron ion of heme b. This ‘push’ effect seems to contribute to the stabilization of higher oxidation states of the iron ion during catalysis, most likely compound II (Ortmayer et al., Reference Ortmayer, Fisher, Basran, Wolde-Michael, Heyes, Levy, Lovelock, Anderson, Raven, Hay, Rigby and Green2020). On the other hand, during the catalytic cycle, distal His42 accepts a proton from the O-atom of Fe-bound H2O2 that is close to the iron ion and transfers it to the other O-atom of H2O2 after heterolytic cleavage of its peroxo bond to generate H2O, which then diffuses away (Fig. 7c). Furthermore, Arg38 facilitates the heterolytic –O–O– bond cleavage through stabilization of the developing negative charge of the distal O-atom during the bond cleavage. Thus, the ‘pull’ effect is provided by combined interactions involving His42 and Arg38. The experiments carried out by Ortmayer et al. (Reference Ortmayer, Fisher, Basran, Wolde-Michael, Heyes, Levy, Lovelock, Anderson, Raven, Hay, Rigby and Green2020) suggest that the ‘pull’ effect is related to an increased proton affinity of ferryl oxygen of compound II.
‘Push–pull mechanism’ to explain the role of proximal His170 and distal His42 and Arg38 in the formation of HRP compound I, as reported by Sono et al. (Reference Sono, Roach, Coulter and Dawson1996). The cleavage of the –O–O– bond in H2O2 positioned at the distal site occurs heterolytically. See also Shinomiya et al. (Reference Shinomiya, Araki, Momotake, Kotani, Kojima and Yamamoto2019) and Ortmayer et al. (Reference Ortmayer, Fisher, Basran, Wolde-Michael, Heyes, Levy, Lovelock, Anderson, Raven, Hay, Rigby and Green2020) and text for details. Reprinted with permission from Sono et al. (Reference Sono, Roach, Coulter and Dawson1996), Copyright 1996 American Chemical Society.

For the preparation of any type of artificial ‘HRP-mimicking’ systems, the ‘push–pull’ mechanism for the formation of the key intermediate compound I makes it clear that the local environment and coordination state of ferric heme b at the distal side is equally important as the situation at the proximal side. The key amino acids are proximal His170 (coordinating to the ferric iron) and distal His42 (not coordinating, but acting as acid/base catalyst), see Figs 4b and 7. Other amino acids nearby are also important (see e.g. Dunford, Reference Dunford2010). How well the local environment on the proximal and distal sides of heme b in HRP can be imitated with a HRP-mimicking system is the key question for any application of such systems that are based on a peroxidase-like catalytic activity.
To stress the importance of the environment in which ferric heme b is embedded in HRP, some of the results of the elegant experiments reported by Newmyer, Ortiz de Montellano, and collaborators in 1995 and 1996 are worth recalling (Newmyer and de Montellano, Reference Newmyer and de Montellano1995; Newmyer et al., Reference Newmyer, Sun, Loehr and Ortiz de Montellano1996). A mutant of HRPC lacking proximal His170, called H170A, was prepared and analyzed (Newmyer et al., Reference Newmyer, Sun, Loehr and Ortiz de Montellano1996). His170 (H170) was replaced with an alanine (A). The mutant contained an oligohistidine tag for easier purification, indicated as ‘hHRP’. The UV/vis absorption spectrum of H170A hHRP was measured (see Fig. 8b) and compared with native HRP (Fig. 8a) and hHRP. While the spectrum of native HRP and hHRP (recombinant HRPC with a His tag) did not change with pH, the spectrum of H170A hHRP showed a clear pH dependence, and the maximum of the Soret band at pH = 5–7 was shifted to higher wavelength (‘red-shifted’) by 9–11 nm if compared to hHRP. This indicated that Fe(III) was hexacoordinated, with two strongly binding axial ligands rather than a single one in native HRP (His170) (Newmyer et al., Reference Newmyer, Sun, Loehr and Ortiz de Montellano1996). The authors suggested that the two strongly binding axial ligands were His42 and H2O or HO−. In any case, blocking both coordination sites must result in low peroxidase activity since compound I cannot be formed efficiently according to the mechanism shown in Fig. 7c. The determined rate constant for the formation of compound I was in the case of H170A hHRP about 5 orders of magnitude lower than for native HRP or hHRP. Very low peroxidase activity of H170A hHRP was measured by using as reducing substrate either guaiacol (5 mM at pH = 6.0) or ABTS (2,2'-azino-bis(3-ethylbenzothiazoline-6-sulfonic acid), 5 mM at pH = 5.0) in the presence of 0.5 mM H2O2 (see later Fig. 19 for the chemical structures of ABTS and guaiacol). H170A hHRP displayed only 0.003% of the guaiacol and 0.004% of the ABTS peroxidase activity of native HRP (Newmyer et al., Reference Newmyer, Sun, Loehr and Ortiz de Montellano1996). The rate of formation of compound I and the overall peroxidase activity of H170A hHRP could, however, be partially restored by adding saturating concentrations of imidazole (≈25 mM) to yield 0.8% (for guaiacol) and 0.5% (for ABTS) of the activity of native HRP (Newmyer et al., Reference Newmyer, Sun, Loehr and Ortiz de Montellano1996). This activity was still much lower than in the case of native HRP, but higher than the one of H170A without added imidazole.
In a second related work, Newmyer and Ortiz de Montellano prepared two mutants lacking distal His42, H42A hHRP and H42V hHRP (V = valine) (see Newmyer and de Montellano, Reference Newmyer and de Montellano1995). The determination of the peroxidase activity at pH = 7.0 and T = 25 °C with guaiacol (5.1 mM) as a reducing substrate and H2O2 (0.5 mM) showed that the initial rates of guaiacol oxidation was ≈104 fold lower than in the case of native HRP of hHRP; the rate of formation of compound I was even ≈106 fold lower for the mutants as compared to native HRP or hHRP (Newmyer and de Montellano, Reference Newmyer and de Montellano1995). This clearly demonstrated the importance of His42 for efficient compound I formation and for efficient guaiacol oxidation. Trials to increase the peroxidase activity of the mutant H42A hHRP by adding imidazole showed only a modest increase that leveled off with increasing imidazole concentration, indicating the formation of inactive hexacoordinated heme b (Newmyer and de Montellano, Reference Newmyer and de Montellano1996). With 2-methylimidazole or 1,2-dimethylimidazole (for the chemical structures, see later Fig. 18), the situation was much better because coordination to Fe(III) was not possible, the added deprotonated form of 2-methylimidazole or 1,2-dimethylimidazole acting as an acid/base catalyst (Newmyer and de Montellano, Reference Newmyer and de Montellano1996). The partial ‘rescue’ of the peroxidase activity of H42A hHRP by added 1,2-dimethylimidazole was demonstrated by using guaiacol or ABTS as reducing substrates; the native HRP or hHRP still being 10–100 times more active than the mutant with added 1,2-diimidazole (see Newmyer and de Montellano, Reference Newmyer and de Montellano1996).
In another investigation of a HRPC mutant lacking distal His42, H42L hHRP (L = leucine), evidence was presented that the peroxo bond in H2O2 is cleaved homolytically and not heterolytically, resulting in the formation of hydroxy radials (HO•) and compound II (Rodríguez-López et al., Reference Rodríguez-López, Lowe, Hernández-Ruiz, Hiner, García-Cánovas and Thorneley2001). Instead of compound I, another intermediate might form with a oxoferryl moiety and a protein radical, (por)FeIV(O) R•, called compound I*, instead of a porphyrin radical cation (por+•)FeIV(O) (Fig. 7) (see Rodríguez-López et al., Reference Rodríguez-López, Lowe, Hernández-Ruiz, Hiner, García-Cánovas and Thorneley2001).
Overall, the primary and secondary structures of the apoproteins in heme b proteins determine the local environment of heme b and thus its chemical properties. The second, third, and fifth factors mentioned above are thus interdependent and as such determined by the apoprotein structure, which is the outcome of million years of biological evolution. Therefore, it is not surprising that it is difficult to replace a sophisticated proteinaceous heme b environment by non-natural apoprotein mimics for achieving a similar catalytic performance of heme b as in the case of native heme b proteins under their respective physiologically optimal conditions.
Concerning the use of heme b in a functional state in a non-natural environment, such as surfactant micelles or artificial vesicle membranes, for potential synthetic or analytical applications, the challenge is to find conditions that mimic to some extent one of the many situations of active (monomeric) heme b embedded in a protein environment. Depending on the biological activity of heme b one is interested in, finding such conditions might be very demanding. One of the activities that raised the most interest to mimic with heme b-based non-natural systems is the peroxidase activity of HRP or other heme peroxidases, see Fig. 7a. As outline below, many approaches have been undertaken already, not only by using micelles or vesicles for providing the hydrophobic environment of ferric heme b at the active site of HRP (see later Fig. 15). Before summarizing some of these approaches, two physico-chemical properties of free ferric heme b are important to mention: (i) the aggregation state in aqueous media and in organic solvents, and (ii) the spectroscopic properties in the UV and vis regions of the absorption spectrum. Some of the key findings concerning both properties are summarized in the next section.
Two of the physico-chemical properties of ferric heme b
Aggregate formation
Among the different physico-chemical properties of ferric heme b (= hemin), its propensity to form aggregates in aqueous solution is arguably the most important one. One of the first reports on the hemin insolubility in water dates back to the 1940s (Morrison and Williams, Reference Morrison and Williams1941). A couple of decades later, it was found that the peculiarity of hemin is not its insolubility in water but rather the existence of multiple structurally different aggregation states: monomeric hemin, π–π dimer, μ-oxo dimer, or large stacks (also called π–π stacks) of μ-oxo dimers (de Villiers et al., Reference de Villiers, Kaschula, Egan and Marques2007; Asher et al., Reference Asher, de Villiers and Egan2009; de Villiers and Egan, Reference de Villiers and Egan2014), see Fig. 10. Depending on the exact experimental conditions, one of the four aggregation states will be predominant. Each aggregation state has its characteristic physico-chemical properties. Out of the four aggregation states shown in Fig. 10, only monomeric hemin can be catalytically active (Brown et al., Reference Brown, Dean and Jones1970; Kremer, Reference Kremer1973), while aggregated hemin exhibits negligible catalytic activity. This was, for example, demonstrated with the seminal experiments of Brown et al. (Reference Brown, Dean and Jones1970) in which the decomposition of H2O2 in the presence of hemin under different conditions was measured, so-called ‘catalatic activity’. The key conclusion from these experiments is also important for those interested in preparing HRP mimics based on free hemin: experimental conditions must be applied under which hemin is monomeric. Therefore, the main challenges are: (i) knowing which experimental parameters affect the aggregation state of hemin, and (ii) knowing how to adjust these parameters to obtain predominantly monomeric hemin. In the following, we will first explain the features of each of the four aggregation states of hemin. Second, we will summarize literature data that correlate experimental conditions with the dominating aggregation state of hemin, with particular emphasis on conditions under which monomeric hemin prevails. Third, characteristic UV/vis spectroscopic features of each aggregation state will be covered.
Depiction of the equilibria between four different hemin aggregation states in aqueous solution, as reported by Asher et al. (Reference Asher, de Villiers and Egan2009) and de Villiers and Egan (Reference de Villiers and Egan2014): monomer, π–π dimer, μ-oxo dimer, and large aggregates of μ-oxo dimers. Note that the scheme refers to situations at pH = 10, i.e. with fully ionized propionic acid groups. The situation gets more complicated if the pH value is below the pK a values of the two carboxylic acid groups (pK a1 = 4.3, pK a2 = 5.6–6.4, see Durrant (Reference Durrant2014) and the legend of Fig. 2). In addition, with a decrease in pH, the ligands coordinating at the 5th and 6th coordination sites change from the hydroxyl group (−OH) to water (H2O) (see Crespo et al., Reference Crespo, Tilley and Klonis2010). Adapted with permission from Asher et al. (Reference Asher, de Villiers and Egan2009), Copyright 2009 American Chemical Society.

Monomeric hemin, as the name implies, is in a non-aggregated state, resembling ferric heme b in the resting state of many contemporary heme enzymes, such as HRP (see Berglund et al., Reference Berglund, Carlsson, Smith, Szöke, Henriksen and Hajdu2002; Dunford, Reference Dunford2010; Poulos, Reference Poulos2014; Huang and Groves, Reference Huang and Groves2018). The two types of dimers, π–π and μ-oxo, differ in the way of interaction between two hemin molecules. In the case of the π–π dimer, there is π–π interaction between two hemin molecules, while in the case of the μ-oxo dimer, an oxygen atom bridges two hemin molecules via their iron atoms. In both types of dimers, the carboxylic acid/carboxylate moiety are pointing in opposite directions, see Fig. 10. In the past, it was initially thought that only μ-oxo dimers exist. However, later on it was clearly shown that under certain conditions π–π dimers can also form (de Villiers et al., Reference de Villiers, Kaschula, Egan and Marques2007; Asher et al., Reference Asher, de Villiers and Egan2009). Large aggregates of μ-oxo dimers form when μ-oxo dimers stack via the non-coordinated sides of the porphyrins by π–π interactions.
In addition to the π–π and μ-oxo dimers mentioned so far (Fig. 10), a third hemin dimer type is known, a μ-propionato dimer, see Fig. 11. A biocrystalline material called ‘hemozoin’ (malaria pigment) and comprising this dimer type exists inside the digestive vacuole of Plasmodium falciparum (pH ≈ 4.5–4.8) (Ketchum et al., Reference Ketchum, Olafson, Petrova, Rimer and Vekilov2013; de Villiers and Egan, Reference de Villiers and Egan2014) and other blood-feeding parasites, after the parasite has invaded red blood cells (erythrocytes in humans). The parasite causes the release of ferrous heme b, (PPIX)FeII, from the erythrocytes' Hb. Upon rapid oxidation to ferric heme b, (PPIX)FeIII, crystallization in a lipidic environment (vacuole membrane or intravacuolar lipid bodies) occurs. In vitro experiments have shown that a lipidic environment promotes such crystallization, and the synthetic material is referred to as β-hematin (and in some cases, hematin anhydride) (see Egan et al., Reference Egan, Chen, de Villiers, Mabotha, Naidoo, Ncokazi, Langford, McNaughton, Pandiancherri and Wood2006; Egan, Reference Egan2008; Orjih et al., Reference Orjih, Mathew and Cherian2012; Huy et al., Reference Huy, Shima, Maeda, Men, Hirayama, Hirase, Miyazawa and Kamei2013; Ketchum et al., Reference Ketchum, Olafson, Petrova, Rimer and Vekilov2013; Coronado et al., Reference Coronado, Nadovich and Spadafora2014; de Villiers and Egan, Reference de Villiers and Egan2014; Vekilov et al., Reference Vekilov, Rimer, Olafson and Ketchum2015; Kuter et al., Reference Kuter, Mohunlal, Fitzroy, Asher, Smith, Egan and De Villiers2016). This crystallization appears to be a ‘strategy’ of the parasite to prevent its own destruction, which would occur if dissolved (PPIX)FeIII would interact with the plasma membrane of the parasite, thereby causing membrane lysis (Fitch et al., Reference Fitch, Chevli, Kanjananggulpan, Dutta, Chevli and Chou1983).
(a) Two unit cells of the crystal structure of β-hematin (= hemozoin), as determined by Pagola et al. (Reference Pagola, Stephens, Bohle, Kosar and Madsen2000). The crystal consists of cyclic μ-propionato dimers that are stabilized by two Fe–O coordination bonds (Fe1–O41), while two dimers are linked by hydrogen bonds (through O36 and O37), as reported by Pagola et al. (Reference Pagola, Stephens, Bohle, Kosar and Madsen2000). (b) Depiction of one cyclic μ-propionato dimer and the linking hydrogen bonds, as reported by Rifaie-Graham et al. (Reference Rifaie-Graham, Pollard, Raccio, Balog, Rusch, Hernández-Castañeda, Mantel, Beck and Bruns2019) (see also Gildenhuys et al., Reference Gildenhuys, Roex, Egan and De Villiers2013; de Villiers and Egan, Reference de Villiers and Egan2014; Kuter et al., Reference Kuter, Mohunlal, Fitzroy, Asher, Smith, Egan and De Villiers2016). Reproduced with permission from (a) Pagola et al. (Reference Pagola, Stephens, Bohle, Kosar and Madsen2000), Springer Nature and (b) Rifaie-Graham et al. (Reference Rifaie-Graham, Pollard, Raccio, Balog, Rusch, Hernández-Castañeda, Mantel, Beck and Bruns2019), Springer Nature.

Overall, the aggregation behavior of (PPIX)FeIII is rather complex. The aggregation state is affected by multiple factors: solvent type, pH, buffer salt, and neutral salt (e.g. NaCl) if added (type and concentration), the concentration of hemin itself, and the presence of ‘additives’ that alter the solvent properties, e.g. micelle forming amphiphiles. The challenge is to know how to set the conditions to obtain a desired aggregation state that will be present predominantly. In Table 2, a few chosen examples of conditions are listed to depict how the experimental conditions determine the state of hemin.
Examples of the predominant aggregation state of (PPIX)FeIII depending on the experimental conditions
CHES, 2-(cyclohexylamino)ethane-1-sulfonic acid; HEPES, 4-(2-hydroxyethyl)-1-piperazineethanesulfonic acid.
Hemin dissolved in pure DMSO, up to concentrations of at least a few millimolars, is in monomeric state (Table 2, entry 1) (Brown and Lantzke, Reference Brown and Lantzke1969), while in aqueous solution at pH 6–9 (de Villiers et al., Reference de Villiers, Kaschula, Egan and Marques2007; Kuter et al., Reference Kuter, Streltsov, Davydova, Venter, Naidoo and Egan2014) or at pH = 10 (Table 2, entry 2), hemin forms π–π dimers (Asher et al., Reference Asher, de Villiers and Egan2009) (Table 2, entry 2). In a detailed spectrophotometric study, de Villiers et al. (Reference de Villiers, Kaschula, Egan and Marques2007) determined the dimerization constant for pH 6–9 conditions (at an ionic strength of 0.154 M), yielding K D,obs ≈ 3.2 × 10⁶ M−1 (K D = [dimer]/[monomer]2). No big variation of this constant with pH was found; above 10 μM (PPIX)FeIII, more than 92% dimerized (see de Villiers et al., Reference de Villiers, Kaschula, Egan and Marques2007).
Another important experimental finding of de Villiers et al. (Reference de Villiers, Kaschula, Egan and Marques2007) was the strong tendency of (PPIX)FeIII to adsorb from aqueous solution onto the surface of the glass or plastic vessels used for the experiments. This property must be taken into account in experiments with hemin in aqueous solution to avoid misinterpretation of experimental observations.
From a practical point of view, to minimize effects that might arise from surface adsorption of hemin added to an aqueous solution, the suggestion is to freshly prepare a concentrated hemin stock solution in DMSO and then add a small portion of it to an aqueous solution that contains molecules – or molecular assemblies – that can act as ‘hosts’ to bind hemin by providing a suitable local environment (Cvjetan et al., Reference Cvjetan, Kissner, Bajuk-Bogdanović, Ćirić-Marjanović and Walde2022). Some of the most common hosts which were employed for this purpose are: G-quadruplex RNAs or DNAs, human serum albumin (HSA) and other proteins, or sodium dodecylsulfate (SDS) or sodium dodecylbenzenesulfonate (SDBS) micelles, see below. The small percentage of DMSO present in the final solution (typically about 1% (v/v)) should not lead to any undesired alterations of the system.
In water/organic solvent mixtures (Table 2, entries 3 and 4), at constant concentration of the organic solvent, the physical state of hemin depends on whether the organic solvent used is protic or aprotic. Protic solvents (e.g. MeOH) induce the formation of π–π dimers, while aprotic solvents (e.g. DMSO) induce μ-oxo dimer formation (Asher et al., Reference Asher, de Villiers and Egan2009). The explanation offered is that the number of solvent molecules that are stabilizing a water molecule bound to Fe(III) (at axial position) via hydrogen bonds is of outmost importance. In the case of protic solvents, the maximum number of solvent molecules that can interact through a hydrogen bond with a water molecule bound to Fe(III) is 3, while in the case of aprotic solvents, it is 2. Further examples of water/organic solvent mixtures using organic solvents different from the ones mentioned here can be found in Asher et al. (Reference Asher, de Villiers and Egan2009). Interestingly, by exchanging the organic solvent, π–π dimers can convert into μ-oxo dimers, and vice versa (Asher et al., Reference Asher, de Villiers and Egan2009). In pure aqueous solutions, at high salt concentrations (Table 2, entry 5), hemin is preferentially present in the form of large stacks of μ-oxo dimers. If an aqueous solution contains surfactants, they influence the aggregation state of hemin (Table 2, entry 6–8). Depending on the chemical structure of the surfactant and its concentration, hemin can be present in monomeric form, if SDS and SDBS surfactants are used, or as μ-oxo dimers if for example Tween-20 is present (Casabianca et al., Reference Casabianca, Kallgren, Natarajan, Alumasa, Roepe, Wolf and de Dios2009). The use of micelle- or vesicle-forming amphiphiles for keeping hemin in monomeric, catalytically active state in aqueous solution will be discussed in detail in the next section.
UV/vis absorption characteristics
Information about the aggregation state of dissolved, dispersed, or solubilized hemin can be obtained by a number of complementary analytical methods: most importantly UV/vis spectroscopy (de Villiers et al., Reference de Villiers, Kaschula, Egan and Marques2007; Asher et al., Reference Asher, de Villiers and Egan2009; Kuter et al., Reference Kuter, Venter, Naidoo and Egan2012; Solomon et al., Reference Solomon, Kronenberg and Fry2017), Raman spectroscopy (Boffi et al., Reference Boffi, Das, della Longa, Spagnuolo and Rousseau1999; Shantha et al., Reference Shantha, Saini, Thanga and Verma2003), nuclear magnetic resonance (NMR) spectroscopy (Mazumdar, Reference Mazumdar1990; Casabianca et al., Reference Casabianca, Kallgren, Natarajan, Alumasa, Roepe, Wolf and de Dios2009), cyclic voltammetry (Toader and Volanschi, Reference Toader and Volanschi2007; Moosavi-Movahedi et al., Reference Moosavi-Movahedi, Semsarha, Heli, Nazari, Ghourchian, Hong, Hakimelahi, Saboury and Sefidbakht2008), X-ray absorption near edge structure spectroscopy (Boffi et al., Reference Boffi, Das, della Longa, Spagnuolo and Rousseau1999), extended X-ray absorption spectroscopy (Kuter et al., Reference Kuter, Streltsov, Davydova, Venter, Naidoo and Egan2014), magnetic circular dichroism (Kuter et al., Reference Kuter, Venter, Naidoo and Egan2012), and molecular dynamics simulation (Kuter et al., Reference Kuter, Streltsov, Davydova, Venter, Naidoo and Egan2014, Reference Kuter, Mohunlal, Fitzroy, Asher, Smith, Egan and De Villiers2016). Although the UV/vis absorption spectrum of (PPIX)FeIII in heme proteins (see Fig. 8) or of free hemin in different media is quite complex, recording the UV/vis absorption spectrum turned out to be useful as an analytical tool to gain insight into the aggregation state of hemin and its local environment (including axial ligand coordination and the formation of compound I in the case of HRP, with a radical cation localized on the porphyrin ring, see Fig. 8a). A brief overview about some of the characteristic features of the UV/vis absorption spectrum of hemin is given in the following.
As shown in Fig. 1b, porphyrins (and metalloporphyrins) have 22 π electrons, of which 18 are delocalized (planar aromatic compound following Hückel's rule, 4n + 2 π electrons, with n = 4, n being a non-negative integer). In the late 1950s and early 1960s, Gouterman successfully explained the origin of the UV/vis bands of porphyrins using a simple ‘four-orbital model’ (Gouterman, Reference Gouterman1959, Reference Gouterman1961, Reference Gouterman1978; Gouterman et al., Reference Gouterman, Wagnière and Snyder1963). According to this model, the two highest occupied molecular orbitals, HOMOs, of a typical porphyrin are near degenerate, as are the two lowest unoccupied molecular orbitals, LUMOs, and these four MOs are well separated from all other occupied and unoccupied MOs, see Fig. 12a (Zhang et al., Reference Zhang, Kwan and Stillman2017). The basic features of the electronic spectra of porphyrins are then explained, to a first approximation, as π → π* transitions involving these four orbitals (Ghosh, Reference Ghosh2000). Depending on the type of porphyrin, the central metal ion in metalloporphyrins like (PPIX)FeIII (Dunford, Reference Dunford2010), the axial ligands, and the environment, the near degenerate pair of HOMO and LUMO become different in energy and vibrational states, resulting in a characteristic general pattern of the absorption spectrum of most metalloporphyrins (Wang and Hoffman, Reference Wang and Hoffman1984), also involving transitions between the HOMOs and vacant d-orbitals of the central metal ion (Dunford, Reference Dunford2010). An extremely strong band, the Soret band (also called B-band) is present between 380 and 500 nm (ɛ ≈ 105 M−1 cm−1) and much weaker Q-bands exist between 500 and 750 nm (ɛ ≈ 104 M−1 cm−1) (Wang and Hoffman, Reference Wang and Hoffman1984), see also Fig. 8. The two calculated HOMOs, HOMO and HOMO − 1, are a1u and a2u (both of them are π orbitals), while the two LUMOs, LUMO and LUMO + 1, are egx and egy (both of them are π* orbitals), see Fig. 12a. Transition of electrons between the HOMOs and LUMOs gives rise to the characteristic spectrum. Both band types arise from π → π* transitions, with the difference that the Soret band arises from S0 → S2 (singlet ground state to second excited single state), while Q-bands arise from S0 → S1 (singlet ground state to first excited single state) transitions, see Fig. 12b (Giovannetti, Reference Giovannetti and Uddin2012). Four clear transitions in the Q-band region can be identified in metal-free porphyrins, while complexation with a metal ion results in two transitions only (Milgrom, Reference Milgrom1997; Giovannetti, Reference Giovannetti and Uddin2012).
Illustrations of Gouterman's ‘four orbital model’ for explaining the key electron transitions that determine the absorption spectrum of porphyrins and metalloporphyrins (aromatic 18 π-electron system). The four orbitals to consider are the two HOMOs and the two LUMOs. (a) Schematic drawing of the two relevant HOMOs and the two relevant LUMOs in porphyrins, shown for metalloporphyrin, as reported by Zhang et al. (Reference Zhang, Kwan and Stillman2017). (b) Qualitative molecular orbital diagram for the allowed transitions involving the Fe(III) and porphyrin orbitals for hemin, considering different energy levels of the two HOMOs and high spin state of Fe(III), as reported by Wood et al. (Reference Wood, Langford, Cooke, Lim, Glenister, Duriska, Unthank and Mcnaughton2004). The measured UV/vis absorption spectra of (PPIX)FeIII in different environments and with different axial ligands can be understood – at least qualitatively – on the basis of dominating transitions between the two HOMOs and LUMOs of the porphyrin and minor contributions from transitions between the porphyrin MOs and the d-orbitals of Fe(III) (see also Kuter et al., Reference Kuter, Venter, Naidoo and Egan2012). (a) Reprinted with permission from Zhang et al. (Reference Zhang, Kwan and Stillman2017). (b) Reprinted with permission from Wood et al. (Reference Wood, Langford, Cooke, Lim, Glenister, Duriska, Unthank and Mcnaughton2004), Copyright 2004 American Chemical Society.

In many cases, the absorption is determined by π → π* transitions of the porphyrin. This is clearly evident from a comparison of the UV/vis absorption spectrum of native HRP and compound I (Fig. 8a). On the other hand, ligand binding at the axial positions of heme b can also have a big effect on the spectrum, both in the Soret and the Q-band regions (see Fig. 8b and later Figs 18 and 23).
Regardless of a complete theoretical description and understanding of the complex absorption spectra of metalloporphyrins, the UV/vis absorption spectrum of hemin depends on its aggregation state, as it reflects the situation at the axial coordination sites and the local environment of hemin. In Fig. 13, UV/vis absorption spectra of monomeric hemin (a), π–π dimer (b), μ-oxo dimer (c), and large stacks of μ-oxo dimers (d) are shown, see also Table 2.
UV/vis absorption spectra of hemin in different aggregation states, as reported by Brown and Lantzke (Reference Brown and Lantzke1969; spectrum a) or Asher et al. (Reference Asher, de Villiers and Egan2009; spectra b–d). (a) Monomeric heme (determined on the basis of the analysis of DMSO solutions containing between 8 and 400 μM hemin; molar absorption coefficient, ɛ, given in M−1 cm−1); (b) π–π dimer (30 μM in aqueous solution, pH = 10); (c) μ-oxo dimer (30 μM in 5.64 M aqueous DMSO (= 40 vol%)); and (d) large stacks of μ-oxo dimers (30 μM in 4.25 M NaCl at pH = 10). For the absorbance versus wavelength plots in (b–d), the aqueous solutions were buffered with 20 mM CHES (N-cyclohexyl-2-aminoethanesulfonic acid). (a) Reprinted with permission from Brown and Lantzke (Reference Brown and Lantzke1969). (b–d) Reprinted with permission from Asher et al. (Reference Asher, de Villiers and Egan2009), Copyright 2009 American Chemical Society.

In Fig. 13a, the UV/vis spectrum of hemin dissolved in DMSO is shown, as reported by Brown and Lantzke (Reference Brown and Lantzke1969). In this case, hemin is predominantly present in monomeric form. The Soret band is narrow, positioned at around 400 nm with a molar absorption coefficient (also called extinction coefficient) of ɛ 405 = 183 000 M−1 cm−1 (Collier et al., Reference Collier, Pratt, De Wet and Tshabalala1979). In the Q-band region, there are two distinct bands positioned at ≈500 and ≈630 nm with significantly lower molar absorption coefficients. If dissolved in 0.01 N NaOH, the molar absorption coefficient of hemin was found to be much lower than in DMSO, ɛ 383 = 62 000 M−1 cm−1 (Kannan et al., Reference Kannan, Sahal and Chauhan2002), while in water (pH = 7.2, at ionic strength of 0.154 M) a value of ɛ 393 = 79 000 M−1 cm−1 was determined. The UV/vis absorption spectra of π–π or μ-oxo dimers, Figs 13b and c, respectively, are significantly different from the spectrum of monomeric hemin. In the Soret band region, the absorption peak is much broader than in the case of monomeric hemin, and the molar absorption coefficient is approximately half that of the hemin monomer, i.e. around ɛ 393 = 45 000 M−1 cm−1 for the π–π dimer at pH = 7.2, 0.154 M ionic strength (de Villiers et al., Reference de Villiers, Kaschula, Egan and Marques2007). A further difference can be seen in the Q-band region, with regard to the position of the bands. It is especially interesting that based on the position and presence/absence of the Q-bands, it is possible to distinguish between π–π and μ-oxo dimers. The π–π dimer has a band positioned at 605 nm, while the μ-oxo dimer has a band at 575 nm with a shoulder at 600 nm (Asher et al., Reference Asher, de Villiers and Egan2009). Lastly, the UV/vis spectrum of large aggregates of μ-oxo dimers is recognizable by a broad Soret band with a molar absorption coefficient even lower than that of the dimers. The Q-bands are similar to the ones of the μ-oxo dimer (Asher et al., Reference Asher, de Villiers and Egan2009).
Micelle-forming surfactants have long been shown to be an interesting alternative to DMSO for the solubilization of hemin in aqueous solutions, see in the following section. In the beginning, it was thought that any type of micelle-forming surfactant present at concentrations above the critical micellization concentration (cmc) will cause monomerization of hemin. Over time, however, it became clear that a hydrophobic micellar core as a ‘solubilization medium’ for hemin is not sufficient. The surfactant needs to have certain structural properties in order to prevent hemin from dimerization. It was clearly shown that in the presence of surfactants with negatively charged head groups such as SDS or SDBS, hemin is predominantly present in monomeric form (Simplicio, Reference Simplicio1972a, Reference Simplicio1972b; Casabianca et al., Reference Casabianca, Kallgren, Natarajan, Alumasa, Roepe, Wolf and de Dios2009; Cvjetan et al., Reference Cvjetan, Kissner, Bajuk-Bogdanović, Ćirić-Marjanović and Walde2022). On the other hand, UV/vis absorption measurements indicated that conventional neutral or positively charged surfactants, like Tween 20 (Casabianca et al., Reference Casabianca, Kallgren, Natarajan, Alumasa, Roepe, Wolf and de Dios2009), Triton X-100 (Asher et al., Reference Asher, de Villiers and Egan2009), or dodecyltrimethylammonium bromide (Casabianca et al., Reference Casabianca, Kallgren, Natarajan, Alumasa, Roepe, Wolf and de Dios2009), induce formation of μ-oxo dimers. In Fig. 14, the UV/vis absorption spectra of hemin in the presence of SDS, SDBS, Triton X-100, or cetyltrimethylammonium bromide (CTAB) (above their cmc values) are compared, all recorded at pH = 7.2 (100 mM 4-(2-hydroxyethyl)-1-piperazineethanesulfonic acid (HEPES) buffer) at 10 μM hemin and a fixed surfactant concentration of 10 mM. In the presence of SDS or SDBS, the hemin spectrum resembles the spectrum of monomeric hemin in DMSO (Fig. 13a) if the intensity of the Soret band as well as the position of the Q-bands are considered. On the other hand, the hemin spectra in CTAB or Triton X-100 are similar in shape to those of the hemin μ-oxo dimer. This is particularly obvious in the region of the Q-bands, where an absorption band centered at 575 nm with a shoulder at 600 nm is present, which is typical for the presence of μ-oxo dimers (Fig. 13c).
UV/vis absorption spectra of 10 μM hemin in the presence of either SDS, SDBS, CTAB, or Triton X-100 (each at 10 mM). Inset: Enlarged Q-band region. The spectra were obtained by the addition of hemin from a DMSO stock solution to the corresponding aqueous micellar solution prepared at pH = 7.2 (100 mM HEPES buffer). The DMSO content in the final solutions was kept constant at 0.16% (v/v). The spectra were recorded with a JASCO V-670 spectrophotometer. High intensity in the Soret band region, with λ max ≈ 400 nm, indicates the presence of a high extent of monomeric hemin (Asher et al., Reference Asher, de Villiers and Egan2009). According to the conclusions drawn in Boffi et al. (Reference Boffi, Das, della Longa, Spagnuolo and Rousseau1999), under the conditions used in the measurements of the spectra shown in the figure, hemin appears to be pentacoordinated in SDS and SDBS micelles, whereas in CTAB and Triton X-100 micelles a significant portion of the hemin appears hexacoordinated, see Fig. 18. Interestingly, the spectrum of hemin in SDS micelles resembles the spectrum of native HRP, see Fig. 8.

Apart from these direct UV/vis spectroscopic indications of the aggregation state of hemin in different media, the use of alternative, complementary methods certainly is helpful, e.g. Raman spectroscopy (see Boffi et al., Reference Boffi, Das, della Longa, Spagnuolo and Rousseau1999; Shantha et al., Reference Shantha, Saini, Thanga and Verma2003). Another, more indirect method of determining whether hemin is in the monomeric state is to examine whether hemin is catalytically active under the conditions used. One possibility is to look for peroxidase-like activity, as only the monomeric form of hemin is expected to be catalytically active. This indirect test is especially useful for conditions of very low hemin concentrations where direct spectroscopic measurements of hemin itself might not be reliable or possible at all. The next section focuses on reports about the catalytic activity of hemin in micellar and vesicular systems.
Ferric heme b in aqueous micellar and vesicular systems
Micellar systems
Although heme b plays an essential role in many different types of heme proteins (see Figs 4–6 and Table 1), free heme b dispersed in an aqueous solution usually does not show significant catalytic activity. The propensity of heme b to aggregate in aqueous solution (see above) is one of the reasons why free heme b in the presence of H2O2 is not very active against typical reducing substrates of HRP. Another reason is the absence of strong electron donating groups that coordinate as an axial ligand at the 5th coordination site, such as proximal His170 in HRP, and the absence of functional groups at the distal side, so that a ‘push–pull’ mechanism like the one shown in Fig. 9 cannot operate. Illustrative are the above mentioned results obtained with the mutant H42L hHRP: the replacement of distal His42 by a leucine residue resulted in a change of the reaction mechanism (homolytic instead of heterolytic cleavage of H2O2 and formation of compound I* instead of compound I) (see Rodríguez-López et al., Reference Rodríguez-López, Lowe, Hernández-Ruiz, Hiner, García-Cánovas and Thorneley2001).
Concerning the mentioned homolytic cleavage of H2O2 by the mutant H42L hHR, McCarthy and White (Reference McCarthy and White1983) pointed out that the observed peroxidase-like activity of heme proteins different from true peroxidases is also based on the homolytic (and not heterolytic) H2O2 cleavage. This indicates that it is the specific local environment of the heme group in heme-based peroxidases which determines the chemistry of the first step of the peroxidase cycle (Fig. 7c).
Several approaches have been undertaken to achieve peroxidase-like activity in an aqueous medium by using free ferric heme b (hemin), see Fig. 15. The approaches include
(a) covalently modified hemin, for example by attaching a short peptide sequence (containing a His residue) at one of the carboxylic acid groups of hemin to prevent aggregation and to serve as an ‘electron pushing’ (i.e. electron donating) axial ligand (Casella et al., Reference Casella, Monzani, Fantucci, Gullotti, De Gioia, Strini and Chillemi1996; Ryabova et al., Reference Ryabova, Dikiy, Hesslein, Bjerrum, Ciurli and Nordlander2004; Yuan et al., Reference Yuan, Xu, Zhao, Li, Wang, Wang and Wang2019);
(b) the association of heme b to guanine (G)-rich DNAs or RNAs, so-called ‘G-quadruplex DNAs’ or ‘G-quadruplex RNAs’ (Golub et al., Reference Golub, Freeman and Willner2011; Sen and Poon, Reference Sen and Poon L2011; Stefan et al., Reference Stefan, Denat and Monchaud2011, Reference Stefan, Denat and Monchaud2012; Yang et al., Reference Yang, Fang, Mei, Chang, Cao and Shangguan2011; Pratviel, Reference Pratviel2016; Hagiwara et al., Reference Hagiwara, Momotake, Ogura, Yanagisawa, Suzuki, Neya and Yamamoto2021; Li et al., Reference Li, Wu, Yan, Yuan, Shu, Gao, Zhang, Li, Ding and Cheng2021);
(c) the association of heme b to a protein that is different from the natural apoprotein of heme b proteins but still binds heme b, for example HSA (Watanabe et al., Reference Watanabe, Ishikawa and Komatsu2012; Kragh-Hansen, Reference Kragh-Hansen2013; Ascenzi et al., Reference Ascenzi, di Masi, Fanali and Fasano2015) or a molecular chaperon (GroEL) (Wang et al., Reference Wang, Wang, Pan, Wei, Jiang, Lu, Liu, Huang and Huang2017, Reference Wang, Sun, Liu and Wang2019, Reference Wang, Li, Wang, Mujuni, Yue and Huang2020; Dell'Acqua et al., Reference Dell'Acqua, Massardi, Monzani, Di Natale, Rizzarelli and Casella2020);
(d) the embedding of heme b in a metal-organic framework (MOF) (see Dare et al., Reference Dare, Brammer, Bourne and Egan2018; Dare and Egan, Reference Dare and Egan2018); or
(e) the association of hemin to micelles or vesicles, the topic of this review and the focus of this section.
Some of the different approaches for the preparation of hemin systems with peroxidase-like catalytic activity in an aqueous medium. (a) Example of a chemically modified hemin, as investigated by Ryabova et al. (Reference Ryabova, Dikiy, Hesslein, Bjerrum, Ciurli and Nordlander2004). The imidazole group of the attached histidine should serve as an electron-donating ligand at the 5th coordination site of Fe(III). (b) Hemin bound to a G-quadruplex DNA, i.e. a complex between hemin and parallel G-quadruplex DNAs formed from d(TTAGGG), as reported by Hagiwara et al. (Reference Hagiwara, Momotake, Ogura, Yanagisawa, Suzuki, Neya and Yamamoto2021) (see also Saito et al., Reference Saito, Tai, Fukaya, Shibata, Nishimura, Neya and Yamamoto2012). (c) Hemin bound to one of the hydrophobic binding sites of human serum albumin (HSA). Image taken from Kragh-Hansen (Reference Kragh-Hansen2013), originally reported by Watanabe et al. (Reference Watanabe, Ishikawa and Komatsu2012), previously described by Zunszain et al. (Reference Zunszain, Ghuman, Komatsu, Tsuchida and Curry2003), PDB 1O9X (see also De Simone et al., Reference De Simone, di Masi and Ascenzi2021). Binding of free hemin to serum albumin (circulating in the blood) is one of the biological mechanisms to keep the concentration of toxic-free hemin low, see above in the text (Kumar and Bandyopadhyay, Reference Kumar and Bandyopadhyay2005). (d) Hemin bound to a zinc MOF, as reported by Dare et al. (Reference Dare, Brammer, Bourne and Egan2018). MOF-bound (PPIX)FeIII is shown as a rigid body model of porphin. (e) Hemin, an amphiphilic compound, bound to micelles or vesicles formed from suitable amphiphilic molecules. The small figures are reproduced with permission from the following sources: (b) Hagiwara et al. (Reference Hagiwara, Momotake, Ogura, Yanagisawa, Suzuki, Neya and Yamamoto2021), Copyright 2021 American Chemical Society; (c) Kragh-Hansen (Reference Kragh-Hansen2013), Elsevier; (d) Dare et al. (Reference Dare, Brammer, Bourne and Egan2018), Copyright 2018 American Chemical Society.

The latter approach was pioneered by Simplicio (see Simplicio, Reference Simplicio1972a, Reference Simplicio1972b; Simplicio and Schwenzer, Reference Simplicio and Schwenzer1973; Simplicio et al., Reference Simplicio, Schwenzer and Maenpa1975). Compared to a chemical modification of hemin or using structurally complex hosts for monomeric heme b (DNA, RNA, or proteins), the use of chemically simple micelle-forming, low molar mass amphiphiles (or amphiphilic block copolymers) is attractive because micelle formation is a molecular self-assembly process that occurs under thermodynamic control, without input of energy. This means that no special sample preparation methods are required, unless the order of adding the different components constituting a micellar system turns out to be important (see below).
SDS and SDBS micelles
The most intensively investigated micelles for hosting hemin in monomeric, catalytically active state are micelles formed from SDS (also known as sodium laurylsulfate), see Fig. 16. Based on detailed previous studies (Phillips, Reference Phillips, Florkin and Stotz1963) on the spectroscopic properties and stability of porphyrins and heme b, Simplicio (Reference Simplicio1972a) investigated the solubilization of hemin in aqueous solutions containing SDS and tetramethylammonium bromide (TMAB). Typical conditions were 12–14 μM hemin, 2 wt% SDS (≈70 mM), 0.1 M TMAB, pH = 10. Tetramethylammonium (TMA) served as a counter ion (Schick, Reference Schick1964). For these conditions, the analysis of the recorded UV/vis absorption spectrum indicated that hemin is present in the SDS micellar solution in monomeric state with λ max = 400 nm and ɛ 400 = 0.82 × 10⁵ M−1 cm−1, see Fig. 17a for the dependence of ɛ 400 on the SDS concentration, as reported by Simplicio (Reference Simplicio1972a). A similar value was reported for pH = 6.2 conditions: ɛ 398 = 0.98 × 10⁵ M−1 cm−1 (Travascio, Reference Travascio2000). The determined value is of the same order of magnitude as the one for the resting state of HRPC, see Fig. 8. A simple drawing of the possible localization of the hemin monomer in a spherical SDS micelle is shown in Fig. 17b, as reported by Simplicio (Reference Simplicio1972a) and Fig. 17c, reported by Mazumdar and Mitra (Reference Mazumdar and Mitra1993). Obviously, the models shown in Figs 17b and c are too simple and probably do not reflect the true average localization of hemin in SDS micelles. They merely illustrate the general idea of using micelles as a simple model for heme proteins ‘with the predominant environment being hydrophobic’ (Simplicio, Reference Simplicio1972a; Simplicio et al., Reference Simplicio, Schwenzer and Maenpa1975). Although this previous work investigated the binding of cyanide ions (–CN) to hemin in the presence of SDS micelles, the authors did not provide data on the possible peroxidase-like activity of the solubilized hemin. The model shown in Fig. 17c is based on 1H and 13C NMR spectroscopy measurements of aqueous solutions of SDS micelles (5 wt% ≈ 170 mM SDS) containing hemin (100 μM), 0.1 M TMAB, at pH ≈ 9–10 (Mazumdar, Reference Mazumdar1990). Under these conditions, the propionic acid residues are expected to be deprotonated and localized at the polar surface of the micelles, while it has been experimentally demonstrated that the hydrophobic part of the hemin is embedded in the hydrophobic interior of the micelles, supporting the suggestions by Simplicio (Reference Simplicio1972a, Reference Simplicio1972b) and Simplicio et al. (Reference Simplicio, Schwenzer and Maenpa1975). Boffi et al. (Reference Boffi, Das, della Longa, Spagnuolo and Rousseau1999) carried out a detailed spectroscopic study of hemin (≈20–60 μM) in 10 wt% SDS (≈345 mM), 0.2 M sodium phosphate, pH = 8.3, and showed that the presence of imidazole or 1,2-dimethylimidazole (250 μM) has a clear effect on the absorption spectrum in the Soret- as well as Q-band regions of the spectrum, see Fig. 18. The spectrum of free hemin – (c) in Fig. 18 – in the presence of 10 wt% SDS (pH = 8.3) is very similar to the spectrum of free hemin in the presence of 10 mM SDS (pH = 7.2, 100 mM HEPES) (Fig. 14) or the spectrum of native HRP (Fig. 8a). The spectrum (c) in Fig. 18, with λ max ≈ 400 nm (Soret band) and λ max = 605 nm and λ max ≈ 480 nm (Q-bands) is characteristic for pentacoordinated high-spin hemin, the axial ligand being a hydroxyl group (Boffi et al., Reference Boffi, Das, della Longa, Spagnuolo and Rousseau1999). The band centered around λ ≈ 600 nm is a typical ‘high-spin marker band’ (Boffi et al., Reference Boffi, Das, della Longa, Spagnuolo and Rousseau1999). Previously, Simplicio (Reference Simplicio1972a) considered hemin in the presence of SDS micelles (2 wt%) to be present as hexacoordinated ‘monoaquomonohydroxy’ hemin, (PPIX)FeIII(H2O,OH), which appears to be incorrect. The spectrum of hemin in the presence of 1,2-dimethylimidazole, spectrum (b) in Fig. 18, has also an absorption band at λ ≈ 600 nm. Together with resonance Raman measurements, Boffi et al. (Reference Boffi, Das, della Longa, Spagnuolo and Rousseau1999) concluded that hemin in the presence of 1,2-dimethylimidazole is pentacoordinated high-spin hemin, the axial ligand being 1,2-dimethylimidazole. In contrast, hemin in the presence of imidazole – again dissolved in 10 wt% SDS (pH = 8.3) – is hexacoordinated low-spin (spectrum (a) in Fig. 18), very different from the spectra shown in (b) and (c), with a Q-band centered around λ = 536 nm (with a shoulder at λ = 562 nm) and a Soret band at λ = 415 nm (Boffi et al., Reference Boffi, Das, della Longa, Spagnuolo and Rousseau1999).
Chemical structures of micelle-forming surfactants. SDS, sodium dodecylsulfate (= sodium laurylsulfate); SDBS, sodium dodecylbenzenesulfonate; Triton X-100; Tween 20, CTAB, cetyltrimethylammonium bromide (= hexadecyltrimethylammonium bromide); DTAB, dodecyltrimethylammonium bromide.

(a) Molar absorption of hemin at λ = 400 nm in aqueous solution as a function of SDS (□), CTAB (△), or Triton X-100 (○) concentration at T = 25 °C. [Hemin] = 8.0–12.0 μM, 0.1 M TMAB (= tetramethylammonium bromide), pH = 9.5, as reported by Simplicio et al. (Reference Simplicio, Schwenzer and Maenpa1975). For [SDS] = 2 mg ml−1 (≈7 mM), the measured molar absorption was independent from pH = 7.0–12.5 (see Simplicio, Reference Simplicio1972a). See also Simplicio (Reference Simplicio1972b). (b) Schematic representation of the possible arrangement of a hemin monomer in a spherically shaped SDS micelle, as reported by Simplicio (Reference Simplicio1972a). The sulfate head group of SDS is negatively charged, the TMA counter ions are positively charged. (c) Updated schematic description of the likely ‘radial type alignment of hemin’ (Simplicio et al., Reference Simplicio, Schwenzer and Maenpa1975) in SDS micelles, as reported by Mazumdar and Mitra (Reference Mazumdar and Mitra1993) on the basis of NMR spectroscopy investigations of Simplicio et al. (Reference Simplicio, Schwenzer and Maenpa1975) and Mazumdar (Reference Mazumdar1990). (a, b) Reprinted with permission from Simplicio (Reference Simplicio1972a) and Simplicio et al. (Reference Simplicio, Schwenzer and Maenpa1975), Copyright 1972 and 1975 American Chemical Society. (c) Reprinted from Mazumdar and Mitra (Reference Mazumdar and Mitra1993), Springer-Verlag.

Effect of imidazole (a) or 1,2-dimethylimidazole (b) on the absorption spectrum of hemin (20–60 μM) in SDS micelles at [SDS] = 10 wt% (= 345 mM), pH = 8.3 (0.2 M sodium phosphate), as reported by Boffi et al. (Reference Boffi, Das, della Longa, Spagnuolo and Rousseau1999). (a) [Imidazole] = 250 μM, (b) [1,2-dimethylimidazole] = 250 μM, and (c) free hemin. The coordination states were deduced from the absorption pattern in the Q-band region of the spectrum (see Boffi et al., Reference Boffi, Das, della Longa, Spagnuolo and Rousseau1999). Reproduced with permission from Boffi et al. (Reference Boffi, Das, della Longa, Spagnuolo and Rousseau1999), Elsevier.

Overall, the various investigations of the spectroscopic properties of hemin in micellar solutions of SDS have shown that UV/vis absorption measurements in the Soret and Q-band regions of the spectrum are useful for gaining information about the state of hemin in terms of hemin aggregation and ligand coordination. For an application as a peroxidase-like system, the determination of the catalytic, i.e. peroxidase-like, activity is of course most important. Such activity determination is conveniently done by using the same type of oxidizable substrates that are also used for determining the peroxidase activity of heme peroxidases, like HRP. Some of these reducing substrates are shown in Fig. 19 (‘reducing’ means that while they are getting oxidized, they reduce the heme that is first oxidized by H2O2, see Fig. 7). So far, there are only a few reports on the peroxidase-like activity of hemin in SDS micellar systems, see Table 3. More work certainly is required. The challenge is to find optimal reaction conditions in systems that have so many parameters to adjust, e.g. the SDS concentration, the pH and buffer salt type, the possible addition of an ‘activity booster’ compound (i.e. a molecule which leads to a higher activity, e.g. imidazole) and its concentration, the type and concentration of the substrate for measuring the activity, the concentration of H2O2, the reaction temperature, and the way the reaction mixture is prepared (order of adding the different components).
Chemical structures of some of the substrates that have been used for spectrophotometrically measuring the activity of heme peroxidases like HRP or peroxidase-mimicking systems. The reactions catalyzed in the presence of H2O2 as a terminal oxidant for HRP as a catalyst are shown, and the key spectroscopic features of the substrate and reaction products are indicated. (a) ABTS2−, 2,2′-azino-bis(3-ethyl-benzthiazoline-6-sulfonate) (see Childs and Bardsley, Reference Childs and Bardsley1975; Scott et al., Reference Scott, Chen, Bakac and Espenson1993; Kadnikova and Kostić, Reference Kadnikova and Kostić2002): 2ABTS2‒ + H2O2 + 2H+ → 2ABTS•− + 2H2O; ɛ 414 (ABTS•−) = 36 000 M−1 cm−1, ɛ 734 (ABTS•−) = 18 200 M−1 cm−1. (b) TMB, 3,3′,5,5′-tetramethylbenzidine (see Josephy et al., Reference Josephy, Eling and Mason1982; Stefan et al., Reference Stefan, Denat and Monchaud2012): for the formation of the TMB radical cation, followed by disproportionation: 2TMB + H2O2 + 2H+ → TMB + diimine dication (charge transfer complex) + 2H2O; ɛ 652 (charge transfer complex) = 39 000 M−1 cm−1. For the formation of the diimine dication product: TMB + H2O2 + 2H+ → diimine dication + 2H2O; ɛ 450 (diimine dication) = 59 000 M−1 cm−1. (c) OPD, ortho-phenylenediamine (= 1,2-diaminobenzene) (see Mekler and Bystryak, Reference Mekler and Bystryak1992; Fornera and Walde, Reference Fornera and Walde2010): 2OPD + 3H2O2 → 2DAP + 6H2O; ɛ 417 (DAP) = 16 700 M−1 cm−1. (d) Guaiacol (= ortho-methoxyphenol = 2-hydroxyphenol) (see DePillis et al., Reference DePillis, Sishta, Mauk and Ortiz De Montellano1991; Doerge et al., Reference Doerge, Divi and Churchwell1997): 2guaiacol + 2H2O2 + 4H+ → DBQ + 4H2O; ɛ 470 (DBQ) = 26 600 M−1 cm−1. (e) Amplex Red (= 10-acetyl-3,7-dihydroxyphenoxazine) (see Zhou et al., Reference Zhou, Diwu, Panchuk-Voloshina and Haugland1997; Gorris and Walt, Reference Gorris and Walt2009; Zhao et al., Reference Zhao, Summers and Mason2012; Dębski et al., Reference Dębski, Smulik, Zielonka, Michałowski, Jakubowska, Dębowska, Adamus, Marcinek, Kalyanaraman and Sikora2016; Wang et al., Reference Wang, Wang, Pan, Wei, Jiang, Lu, Liu, Huang and Huang2017): Amplex Red + H2O2 → Resorufin + CH3COOH + H2O; ɛ 570 (resorufin) ≈ 57 000 M−1 cm−1 (Oja et al., Reference Oja, Guerrette, David and Zhang2014).
Examples of reports on the peroxidase-like activity of hemin in micellar systems
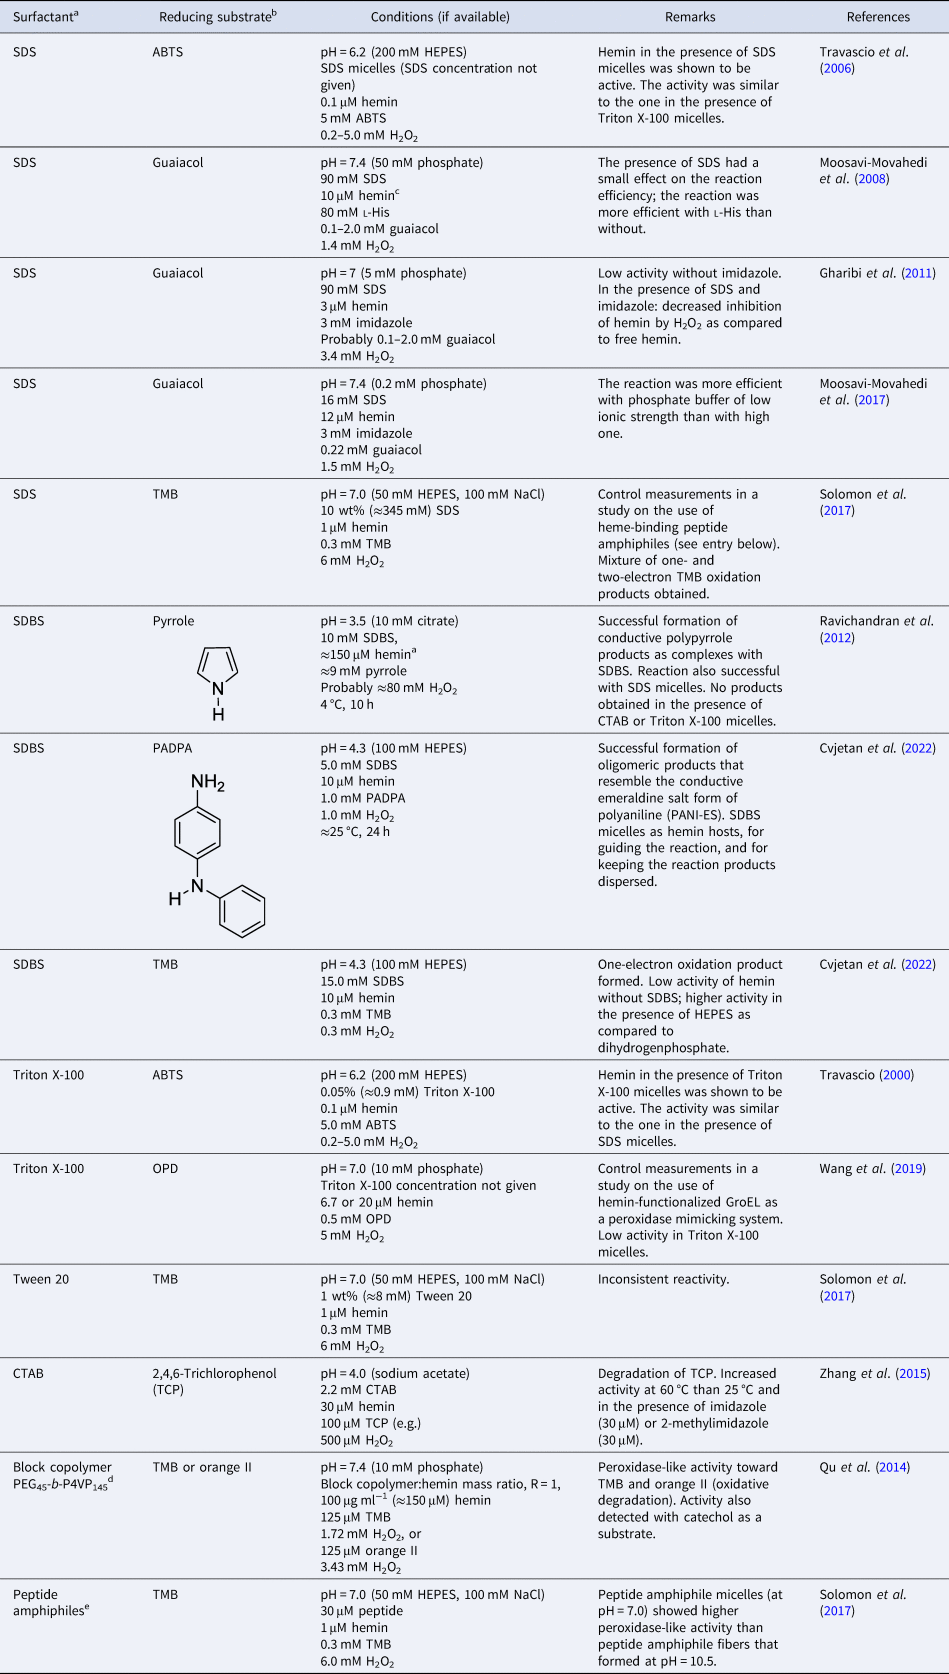
Micellar solutions of SDBS containing hemin were successfully used for the synthesis of conductive oligomeric and polymeric products from either pyrrole as a monomer (Ravichandran et al., Reference Ravichandran, Nagarajan, Kokil, Ponrathnam, Bouldin, Bruno, Samuelson, Kumar and Nagarajan2012) or from PADPA, the linear aniline dimer p-aminodiphenylamine (Cvjetan et al., Reference Cvjetan, Kissner, Bajuk-Bogdanović, Ćirić-Marjanović and Walde2022), see Table 3. H2O2 was used as a terminal oxidant. In both cases, the reactions were carried out under slightly acidic conditions in reaction mixtures that were exposed to air. The products obtained – polypyrrole (Ravichandran et al., Reference Ravichandran, Nagarajan, Kokil, Ponrathnam, Bouldin, Bruno, Samuelson, Kumar and Nagarajan2012) or oligo(PADPA) that resembled the emeraldine salt form of polyaniline (PANI-ES) (Cvjetan et al., Reference Cvjetan, Kissner, Bajuk-Bogdanović, Ćirić-Marjanović and Walde2022) – were very similar to the ones obtained with HRPC (the isoenzyme C of HRP) as a catalyst. Therefore, SDBS micelle-bound hemin could be used as a cheap alternative to HRPC, even though the reaction efficiency was found to be considerably lower in the case of hemin (Cvjetan et al., Reference Cvjetan, Kissner, Bajuk-Bogdanović, Ćirić-Marjanović and Walde2022). One interesting result of the investigation of the latter reaction was that the oxidation of PADPA at pH = 4.3 proceeded under the elaborated optimal conditions without H2O2 as well, but much less efficiently than with H2O2 (Cvjetan et al., Reference Cvjetan, Kissner, Bajuk-Bogdanović, Ćirić-Marjanović and Walde2022). This raises the question about the mechanism of the reaction in the absence of H2O2. Obviously, in this case, the reaction cannot proceed according to the peroxidase mechanism of HRP shown in Fig. 7. It might be that the substrate used (PADPA) is first oxidized, while (por)FeIII (por = PPIX) is reduced to (por)FeII. In the presence of air, (por)FeII is then reoxidized and the catalytic cycle continues, as suggested by Cvjetan et al. (Reference Cvjetan, Kissner, Bajuk-Bogdanović, Ćirić-Marjanović and Walde2022).
The complexity of a micellar system consisting of hemin as a peroxidase-mimicking catalyst is illustrated in Fig. 20. This schematic drawing not only should highlight the complexity of a micellar system, but also emphasize the challenges for further improvements. Challenges include (i) knowledge of the mechanistic steps that hemin undergoes during the course of the reaction, (ii) improved knowledge of the parameters that affect the catalytic activity of hemin and how the activity is affected by these parameters, and (iii) deeper knowledge of the binding and localization of hemin in the micellar aggregates. Insight into any of these challenges would allow further improvements of the catalytic activity of hemin in the micelles. Conceptually, the situation is very similar in the case of the vesicular systems discussed below.
Schematic representation of a hemin-containing micellar system for illustrating some of the molecular interactions and equilibria that need to be taken into account. It is assumed that only one type of micelle-forming amphiphile is present (no mixtures) and that the hemin in the micelle shows peroxidase-like activity, converting in the presence of H2O2 a reducing substrate (AH) into A•, see Table 1. As long as the concentration of monomeric hemin in bulk solution is low, the contribution of its catalytic activity to the overall performance of the micellar system is negligible, and therefore not shown. Depending on the molecular composition of the micellar system, at least the following is important to consider. (a) The chemical structure of the micelle-forming amphiphile (charge, cmc); (b) the hydrophobicity of the micellar core; (c) the pH and composition of the bulk aqueous solution; (d) the presence of ligands that may coordinate to Fe(III); (e) the degree of protonation of the propionic acid residues of hemin; (f) the hemin dimerization constant (shown is a π–π dimer, see Fig. 10); (g) the equilibrium partition constant of hemin to the micelle; (h) the interaction of the amphiphiles with hemin and hemin dimers in bulk solution; and (i) the chemical structure of the reducing substrate (size, charge, redox potential).

Triton X-100 micelles
In several studies, Triton X-100 was used successfully for the solubilization of hemin, see Fig. 17a (Simplicio and Schwenzer, Reference Simplicio and Schwenzer1973; Simplicio et al., Reference Simplicio, Schwenzer and Maenpa1975; Inamura et al., Reference Inamura, Isshiki and Araki1989; Das and Medhi, Reference Das and Medhi1998; Travascio et al., Reference Travascio, Li and Sen1998, Reference Travascio, Sen and Bennet2006; Travascio, Reference Travascio2000). Figure 21 summarizes results obtained from two UV/vis absorption spectroscopy studies of hemin in aqueous Triton X-100 solutions and of the peroxidase-like activity of hemin in the presence of Triton X-100 micelles against ABTS2− as a reducing substrate. Figures 21a and b show the spectral changes of hemin depending on the Triton X-100 concentration for an aqueous solution of pH = 6.5, and the changes in the absorption at λ = 398 nm, A 398 (0.5 μM hemin) as reported by Travascio et al. (Reference Travascio, Li and Sen1998). Figure 21c shows the pH dependence of the absorption spectrum of hemin in Triton X-100 micelles, reflecting significant pH-dependent changes in the Q-band region of the spectrum, as reported by Inamura et al. (Reference Inamura, Isshiki and Araki1989). The spectral changes upon lowering the pH most likely were due to a complexation of chloride ions as the pH value was lowered by addition of HCl, forming (PPIX)FeIII(H2O,Cl) and (PPIX)FeIII(Cl,Cl) complexes.
Spectroscopic properties and peroxidase-like activity of hemin in aqueous Triton X-100 solutions. (a) Changes in the absorption spectrum of hemin (0.5 μM) in aqueous solutions of Triton X-100 at 0 (spectrum ‘a’), 0.001 (‘b’), 0.005 (‘c’), 0.01 (‘d’), 0.02 (‘e’), 0.03 (‘f’), 0.05 (‘g’), and 0.06% (w/v) (‘h’), as reported by Travascio et al. (Reference Travascio, Li and Sen1998). The buffer solution used was a ‘40 K buffer’, consisting of 50 mM MES, 100 mM Tris acetate, and 40 mM potassium acetate, 1% (v/v) DMSO, pH = 6.2. A concentration of 0.01% (w/v) Triton X-100 corresponds to ≈0.155 mM Triton X-100. From 0–0.01% (w/v), the spectra changed without any isosbestic point; from 0.01–0.05% (w/v), the spectra showed an isosbestic point, indicating the existence of two different species in equilibrium (most likely dimeric and monomeric hemin). (b) Change in A 398 with increasing Triton X-100 concentration for the spectra shown in (a); cmc = 0.016% (w/v) (≈0.25 mM). At 0.05% (w/v) Triton X-100, ɛ 398 = 0.8 × 10⁵ M−1 cm−1 (for monomeric hemin) (see Travascio et al., Reference Travascio, Li and Sen1998). This value is similar to the one determined by Simplicio and Schwenzer (Reference Simplicio and Schwenzer1973): ɛ 398 ≈ 0.65 × 10⁵ M−1 cm−1. Above 0.06% (w/v) Triton X-100, the absorption decreased for unclear reasons (empty symbols). (c) Dependence of the UV/vis absorption spectrum of hemin (10 μM) in aqueous solution containing 1.0% Triton X-100 (≈16 mM), by adjusting the pH using a concentrated HCl solution, as reported by Inamura et al. (Reference Inamura, Isshiki and Araki1989). For pH = 1.6, the spectrum of hemin probably is the spectrum of (PPIX)FeIII(H2O,Cl). (d) Activity of hemin (0.1 μM) in Triton X-100 micelles (0.05% ≈ 0.9 mM Triton X-100) against ABTS2− (5 mM) as a reducing substrate as a function of H2O2 concentration in 200 mM HEPES buffer, pH = 6.2, redrawn part of a figure reported by Travascio et al. (Reference Travascio, Sen and Bennet2006). Reproduced with permission from (a, b) Travascio et al. (Reference Travascio, Li and Sen1998), Elsevier; (c) Inamura et al. (Reference Inamura, Isshiki and Araki1989); and (d) Travascio et al. (Reference Travascio, Sen and Bennet2006).

Concerning the peroxidase-like activity of hemin in Triton X-100 micelles, there are a few reports only, for example Travascio et al. (Reference Travascio, Sen and Bennet2006) see Table 3 and Fig. 21d. With ABTS2− as a substrate, Travascio et al. (Reference Travascio, Sen and Bennet2006) noted that under the conditions used, hemin in Triton X-100 micelles has a similar peroxidase-like activity like hemin in SDS micelles. This conclusion was derived based on a comparison of the initial rates of ABTS•− (radical anion) formation at pH = 6.2. In contrast, for the hemin-catalyzed oxidative polymerization of pyrrole at pH = 3.5, the use of SDS micelles worked very well (see above and Table 3), while no reaction products were obtained in the presence of Triton X-100 micelles (Ravichandran et al., Reference Ravichandran, Nagarajan, Kokil, Ponrathnam, Bouldin, Bruno, Samuelson, Kumar and Nagarajan2012). This indicates that the peroxidase-like activity of micelle-solubilized hemin not only may depend on the type of micelles used and other experimental conditions (such as buffer salt used and pH), but also on the type of substrate. Moreover, for the reaction of pyrrole, the anionic surfactant micelles (SDS) not only have a role of hosting hemin, but they also act as counter ions for the polymeric products formed (Ravichandran et al., Reference Ravichandran, Nagarajan, Kokil, Ponrathnam, Bouldin, Bruno, Samuelson, Kumar and Nagarajan2012). The same is true for the formation of PANI-ES products from PADPA with SDBS micelles (see above and Table 3).
Using OPD (ortho-phenylenediamine) as a substrate at pH = 7.0, Wang et al. (Reference Wang, Sun, Liu and Wang2019) reported that hemin solubilized in Triton X-100 micelles is active, but it appeared to have low activity. A systematic re-investigation of the activity of hemin in micellar systems of Triton X-100 should help clarifying the seemingly contradictory results obtained so far. In research on G-quadruplex/hemin complexes, Triton X-100 micelles were often used as ‘temporary hemin solubilizers’ before a G-quadruplex was added (Travascio et al., Reference Travascio, Li and Sen1998, Reference Travascio, Sen and Bennet2006).
CTAB micelles
Although the solubilization of hemin in CTAB micelles was shown to be possible, see Fig. 17a (Simplicio and Schwenzer, Reference Simplicio and Schwenzer1973; Simplicio et al., Reference Simplicio, Schwenzer and Maenpa1975; Mazumdar et al., Reference Mazumdar, Medhi, Kannadaguili and Mitra1989), with the exception of one report (Zhang et al., Reference Zhang, Gu, Hong and Zhang2015) on the degradation of 2,4,6-trichlorophenol (see Table 3), there are no literature data on the peroxidase-like activity of CTAB micelle-solubilized hemin. The reason for this lack of activity data is not clear. It could be that the positive charge present on the surface of CTAB micelles prevents somehow efficient activation of hemin by H2O2. Alternatively, depending on the reducing substrate properties (e.g. its charge), it might be unable to come into the proximity of hemin to get oxidized. Simplicio et al. (Reference Simplicio, Schwenzer and Maenpa1975) already discussed differences between SDS micelle-solubilized hemin, Triton X-100 micelle-solubilized hemin, and CTAB micelle-solubilized hemin. It has been mentioned previously that the penetration of hemin into cationic micelles is deeper than in the case of anionic micelles (Fendler, Reference Fendler and Mittal1977). This could explain a hindrance of the reducing substrate access to hemin in CTAB micelles. A clarification of this possibility should be part of future investigations.
In Simplicio and Schwenzer (Reference Simplicio and Schwenzer1973), hemin was dissolved in CTAB micelles (4% = 110 mM CTAB) and the pH dependence of the absorption spectrum of hemin (13 μM) in the Soret-band region of the spectrum was determined. The spectral changes showed an isosbestic point (Simplicio and Schwenzer, Reference Simplicio and Schwenzer1973), suggesting the presence of two different species only, (PPIX)FeIII(H2O,H2O) (dominating under conditions of low pH) and (PPIX)FeIII(H2O,OH) (dominating at high pH). A plot of measured absorbance at λ = 393 nm versus pH is shown in Fig. 22. From this titration curve, the pK a value for one of the water molecules that coordinate in (PPIX)FeIII(H2O,H2O) inside CTAB micelles was determined to be pK a = 6.1 ± 0.1 (Simplicio and Schwenzer, Reference Simplicio and Schwenzer1973). For SDS and Triton X-100 micellar systems, the pK a values were 4.7 ± 0.1 and 5.5 ± 0.1, respectively (Simplicio and Schwenzer, Reference Simplicio and Schwenzer1973). The question whether hemin is hexa- or pentacoordinated in the micellar systems investigated was discussed in Boffi et al. (Reference Boffi, Das, della Longa, Spagnuolo and Rousseau1999). For hemin dissolved in SDS micelles under alkaline conditions, the authors presented experimental evidence that Fe(III) in hemin is not hexacoordinated, but pentacoordinated, (PPIX)FeIII(OH) with Q-band absorption at λ max = 605 nm (Boffi et al., Reference Boffi, Das, della Longa, Spagnuolo and Rousseau1999), see Fig. 18 (spectrum of free hemin). H2O was probably not considered as ‘true’ ligand due to its weak coordination strength (see Durrant, Reference Durrant2014). Regardless of a correct description of the coordination state of hemin, the experiments of Simplicio and Schwenzer (Reference Simplicio and Schwenzer1973) clearly showed that hemin in CTAB micelles can be titrated with spectroscopic changes that reflect alterations of one axial ligand as the bulk pH value was changed.
Change in absorbance at λ = 398 nm for hemin (13 μM) dissolved in 4% (w/w) (= 110 mM) aqueous CTAB at 25 °C as reported by Simplicio and Schwenzer (Reference Simplicio and Schwenzer1973). The molar absorption of hemin in CTAB micelles at pH = 3.3 was found to be ɛ 393 = 0.9 × 10⁻⁵ M−1 cm−1, higher than the value determined at pH = 9.5, see also Fig. 17. The assigned hemin species that dominate at low and high pH are indicated. Reprinted with permission from Simplicio and Schwenzer (Reference Simplicio and Schwenzer1973), Copyright 1973 American Chemical Society.

In a related study by Mazumdar et al. (Reference Mazumdar, Medhi, Kannadaguili and Mitra1989), the pH dependence of the absorption spectrum of hemin in CTAB micelles (5% = 137 mM CTAB) that formed in a mixture of 18% (v/v) pyridine (pyr)/water was investigated, see Fig. 23. There were again significant pH-dependent changes in the Soret-band region of the spectrum of hemin: higher intensity at low pH as compared to high pH. The authors also measured the changes in the absorption spectrum in the Q-band region of the spectrum. The presence of isosbestic points at 495, 568, and 645 nm suggested the coexistence of only two hemin species, identified as (PPIX)FeIII(pyr,H2O) (predominating at low pH, with λ max = 527 and 556 nm) and (PPIX)FeIII(pyr,OH) (predominating at high pH with λ max = 560 and 600 nm) (see also Mazumdar and Mitra, Reference Mazumdar and Mitra1993). From the spectra shown in Fig. 23, the pK a value for the water molecule that coordinates to Fe(III) in (PPIX)FeIII(H2O,pyr) inside the CTAB micelles was determined to be pK a = 7.7 ± 0.1 (Mazumdar et al., Reference Mazumdar, Medhi, Kannadaguili and Mitra1989). For SDS and Triton X-100 micellar systems, the pK a values were 9.8 ± 0.1 and 9.4 ± 0.1, respectively (Mazumdar et al., Reference Mazumdar, Medhi, Kannadaguili and Mitra1989). The trend is opposite to what was determined for (PPIX)FeIII(H2O,H2O) by Simplicio and Schwenzer (Reference Simplicio and Schwenzer1973) in the three micellar systems, see above.
Dependence on pH of the absorption in the Soret- and Q-band regions of the absorption spectrum of hemin (65 μM) in 18% (v/v) pyr/water solutions containing 5% (w/w) (= 137 mM) CTAB at 26 °C, pH = 5.17 (1), 6.82 (2), 7.33 (3), 7.41 (4), 7.79 (5), 8.34 (6), 8.86 (7), and 9.94 (8), as reported by Mazumdar et al. (Reference Mazumdar, Medhi, Kannadaguili and Mitra1989). The pH of the solutions was adjusted with dilute nitric acid (HNO3) or dilute sodium hydroxide (NaOH). The assigned species that dominate in this pyr/water mixtures at low or high pH are (PPIX)FeIII(pyr,H2O) and (PPIX)FeIII(pyr,OH), with pyr = pyridine. Reproduced with permission from Mazumdar et al. (Reference Mazumdar, Medhi, Kannadaguili and Mitra1989), Royal Society of Chemistry.

Although the absorption spectra shown in Fig. 23 are from measurements in which hemin was dissolved in a micellar CTAB solution in the presence of large amounts of pyridine at various pH values, reference should be made to the spectra reported by Ncokazi and Egan (Reference Ncokazi and Egan2005) of hematin dissolved in a surfactant-free aqueous solution (pH = 7.5) at various pyridine concentrations. Without pyridine, the spectrum in the Soret-band region was broad and of low intensity (typical for aggregate formation). Addition of increasing amounts of pyridine at pH = 7.5 resulted in a marked sharpening of the Soret band (with an increase in intensity and a red shift of the band maximum of 15 nm from λ max = 389 nm to λ max = 404 nm) and changes in the Q-bands (increase in intensity around λ = 550 nm and decrease in intensity around λ = 630 nm). This was taken as an indication of the monomerization of the heme with increasing pyridine concentration and axial coordination by pyridine, eventually forming (PPIX)FeIII(pyr,pyr) (Ncokazi and Egan, Reference Ncokazi and Egan2005). This underlines the sensitivity of the Soret- and Q-band absorptions toward aggregation state and axial ligand coordination (see also Fig. 18).
Other micelles
As indicated in Table 3, micelles formed from an amphiphilic block copolymer (Qu et al., Reference Qu, Shen, Chai, Jing, Zhang, An and Shi2014) or from peptide amphiphiles (Solomon et al., Reference Solomon, Kronenberg and Fry2017) were also used as hosts for hemin. In both cases, hemin association to the micelles was not only due to (unspecific) hydrophobic interactions involving the hydrophobic core of the micelles, but also involved specific interactions with electron donating groups of the amphiphiles as axial ligands of hemin. Therefore, ‘electron-pushing entities’ (see Fig. 9) were provided by the amphiphiles and not through low molar mass additives, like pyridine, histidine (His) or imidazole. For both of these types of micelles, peroxidase-like activity was demonstrated (Table 3). In the case of the amphiphilic block copolymer, in a follow-up study, hemin-binding micelles from poly(ethylene glycol)-block-poly(1-vinylimidazole), PEG114-b-PVIm15, were prepared and immobilized in an alginate hydrogel for the efficient degradation of orange II and pyrogallol (see Qu et al., Reference Qu, Shi, Wang, Cheng, Ma, An and Shi2017).
Main implications of micelles on the peroxidase-like activity of hemin
The reported UV/vis absorption measurements of (PPIX)FeIII in different micellar solutions clearly showed that the presence of micelles has an effect on the aggregation state of hemin. The absorption in the Soret- and Q-band regions of the spectrum depends on the type of micelle (Fig. 14). Furthermore, the spectrum of hemin also depends on the type of axial ligands present at the 5th or at the 5th and 6th coordination positions. Clear differences could be seen between penta- and hexacoordinated hemin in the presence of SDS micelles, for example (Fig. 18). This is in agreement with measurements carried out in 44.5% (w/w) ethanol in water (pHapparent = 7.6) using imidazole at variable concentrations as a small molecule that coordinates at the 5th and 6th coordination sites of hemin (see Hasinoff et al., Reference Hasinoff, Dunford and Horne1969). The presence of isosbestic points indicated that coordination of either one or two imidazole molecules occurred (Hasinoff et al., Reference Hasinoff, Dunford and Horne1969).
Despite several spectroscopic studies of hemin dissolved in an aqueous solution in the presence of micelles, systematic investigations of the peroxidase-like activity of hemin in the presence of micelle-forming amphiphiles are still scarce. There are several factors which can affect the catalytic activity of hemin. Certainly, the type and concentration of micelle-forming surfactants are expected to have the greatest effect, because the micelles are anticipated to provide a local environment, which directly influences the catalytic activity. There is, however, also the effect small molecules (at optimal concentration) might have when coordinated at optimal concentration as an axial ligand to yield pentacoordinated micelle-bound hemin with increased oxidative power. Systematic studies are needed using not only different micelle-forming surfactants (at concentrations below as well as above the cmc), but also different types of reducing substrates. Once reliable data from such studies are available, it should be possible to better understand the influence of the different factors that affect the peroxidase-like activity of hemin in micellar systems. Of particular interest is to develop an improved model for the average localization of hemin (and possibly the spin state) in micelles, depending on the micelle type.
Vesicular systems
Because it is often stated that one of the toxic effects of free heme b is due to its interaction with biological membranes, causing alterations in their permeability (Schmitt et al., Reference Schmitt, Frezzatti and Schreier1993; Kumar and Bandyopadhyay, Reference Kumar and Bandyopadhyay2005; Qutub et al., Reference Qutub, Uzunova, Galkin and Vekilov2010; Das et al., Reference Das, Tarafdar and Chakrabarti2018), there are a number of investigations of heme b interacting with lipid vesicles as biomembrane model systems. However, the results obtained and the conclusions drawn are not always consistent (Light and Olson, Reference Light and Olson1990a), most likely due to differences in the experimental conditions used, see below. Somewhat surprisingly, there are only few reports of the peroxidase-like activity of vesicle-bound hemin. The reason for this is not clear, because vesicular systems of biological or synthetic bilayer-forming amphiphiles are conceptually related to micellar systems (Fig. 24). Both are the result of the self-assembly of amphiphiles in aqueous solution. There are, however, also significant differences: (i) micelles – with diameters of roughly twice the length of a micelle-forming amphiphile (e.g. ≈3 nm in the case of a spherical SDS micelle) – are much smaller than vesicles (with diameters from about 30 nm to dozens of micrometers); (ii) in the case of micelles, the micelles have a hydrophobic core that is formed by the lipophilic chains of the amphiphiles, while in the case of vesicles, a hydrophobic layer built from the lipophilic chains of the amphiphiles forms the internal part of a boundary that separates a trapped (internal) aqueous volume from the bulk solution; (iii) micelles usually are highly dynamic systems with a rapid exchange of the amphiphiles between the micelles and the aqueous solution, while the molecular motions of the amphiphiles in a bilayered shell of a vesicle usually are much slower and the exchange of the amphiphiles between the vesicle membrane and the bulk solution is also much slower than in the case of a micellar systems, reflected in cmc ≫ cvc, i.e. the cmc usually is orders of magnitude higher than the critical vesiculation concentration (cvc), although exceptions exist (Israelachvili et al., Reference Israelachvili, Mitchell and Ninham1977; Walde and Ichikawa, Reference Walde and Ichikawa2021); and (iv) micellar solutions of conventional surfactants (like SDS) are thermodynamically stable, which means that their preparation normally does not require a specific protocol to apply, while vesicles usually can exist in different sizes and morphologies (e.g. uni-, oligo-, or multilamellar), meaning that the way a vesicle dispersion is prepared matters, because it is only kinetically stable and not thermodynamically (Walde and Ichikawa, Reference Walde and Ichikawa2021). For the most common methods that are used for the preparation of relatively uniform vesicle dispersions (see e.g. Torchilin and Weissig, Reference Torchilin and Weissig2003; Walde and Ichikawa, Reference Walde and Ichikawa2021 and the references cited therein).
Vesicle versus micelle. Top: Schematic representations of the cross section of a spherical unilamellar vesicles consisting of a trapped aqueous volume and a self-assembled boundary of amphiphilic molecules that separates the trapped volume from the bulk aqueous solution. The hydrophobic part of the bilayer is marked in yellow. Multi-lamellar vesicles consist of several concentrically arranged self-closed bilayers, multivesicular vesicles contain one or several internal vesicles. The size and morphology of the vesicles usually depend on the method of preparation and on the amphiphiles used. Conventional-bilayer-forming amphiphiles have two hydrophobic chains and one hydrophilic head group, as in the case of the different types of phospholipids present in biological membranes. Vesicles from bilayer-forming mixtures of amphiphiles with only one hydrophobic chain are also known, as well as vesicles formed from amphiphilic block copolymers (so-called polymersomes). Vesicle dispersions usually are only kinetically stable and not thermodynamically. For conventional phospholipids, the concentration of non-associated molecules usually is so low that it can be ignored (≈1 nM). Bottom: For comparison, a schematic representation of the cross section of a spherical micelle in an aqueous solution is also shown, as obtained from SDS, for example. Depending on the chemical structure of a micelle-forming amphiphile, which can be of low molar mass or an amphiphilic block copolymer, and on its concentration and aqueous solution composition, non-spherical, worm-like micelles may also form. Micellar solutions usually are thermodynamically stable. The concentration of non-associated amphiphiles often is relatively high (a few millimolars in the case of SDS) (see e.g. Giuliano et al., Reference Giuliano, Cvjetan, Ayache and Walde2021; Walde and Ichikawa, Reference Walde and Ichikawa2021).

Some of the amphiphiles that have been used so far in investigations about the physico-chemical properties of heme b in vesicular systems and mentioned in the following are shown in Fig. 25. In an early investigation of the binding of hemin, as (PPIX)FeIII(H2O,H2O) or (PPIX)FeIII(H2O,OH), aqueous dispersions of vesicles consisting of either zwitterionic egg phosphatidylcholine (egg PC), anionic porcine brain phosphatidylserine (brain PS), or a 1:1 (mol/mol) mixture of egg PC and cholesterol were prepared by using two different types of vesicle preparation methods (Tipping et al., Reference Tipping, Ketterer and Christodoulides1979a, Reference Tipping, Ketterer and Christodoulides1979b). The two methods were (i) the ‘detergent-depletion’ method with sodium cholate as a detergent (Tipping et al., Reference Tipping, Ketterer and Christodoulides1979a, Reference Tipping, Ketterer and Christodoulides1979b), yielding mainly unilamellar vesicles, and (ii) the ‘hand-shaking’ method that yields multilamellar vesicles, followed by sonication to obtain size-reduced, small vesicles that allowed spectrophotometric measurements without significant interference by light scattering caused by the vesicles. A 0.1 M NaCl/50 mM Tris buffer of pH = 7.4 was used (Tipping et al., Reference Tipping, Ketterer and Christodoulides1979a), the phospholipid concentration was 1 mM and the concentration of (PPIX)FeIII was 5 μM (Tipping et al., Reference Tipping, Ketterer and Christodoulides1979a). Based on the recorded UV/vis absorption spectra, see Fig. 26, the authors concluded that hemin in egg PC or brain PS vesicular dispersions exists predominantly in monomeric state. Aggregate formation of hemin in egg PC vesicles was excluded on the basis of UV/vis absorption measurements in which the egg PC concentration was varied between 0.2 and 10 mM, apparently without resulting in a significant change of the absorption spectrum of hemin (Tipping et al., Reference Tipping, Ketterer and Christodoulides1979a). Control experiments with hemin in the presence of water-soluble, structural units of the polar head group of egg PC, phosphocholine, and glycerophosphocholine, suggested that hemin interacts with the polar head group of PC in the region of the membrane surface; furthermore, differences between these spectra and the spectrum recorded in the presence of egg PC vesicles suggested that the hydrocarbon chains of egg PC are also important for the binding of hemin (Tipping et al., Reference Tipping, Ketterer and Christodoulides1979a). Therefore, ‘it seems likely that the dimethyl-divinyl end’ of the heme molecule is immersed in the hydrocarbon region, whereas ‘the iron atom and the hydrophilic propionic acid side chains are in the head-group area’ (Tipping et al., Reference Tipping, Ketterer and Christodoulides1979a). Figure 27a is a highly schematic depiction of the suggested hemin intercalation in lipid vesicle membranes, as reported by Cannon et al. (Reference Cannon, Kuo, Pasternack, Wong and Muller-Eberhard1984). Such intercalation is supported by phospholipid monolayer studies (Ginsburg and Demel, Reference Ginsburg and Demel1983). The surface pressure of monolayers formed from either DLPC (1,2-dilinoleoyl-sn-glycero-3-phosphocholine), DOPC (1,2-dioleoyl-sn-glycero-3-phosphocholine), DOPC:cholesterol (2:1, molar ratio), DOPC:brain PS (1:1, molar ratio), or DOPC:yeast phosphatidylinositol (1:1, molar ratio) increased upon the addition of hemin (530 nM in cholesterol-free monolayers, or 260 nM if cholesterol was present) to the subphase consisting of 10 mM Tris/HCl, 150 mM NaCl, buffer solution (pH = 7.4) (Ginsburg and Demel, Reference Ginsburg and Demel1983). Molecular dynamics simulations of ferrous heme b in a monolayer formed from DMPC (1,2-dimyristoyl-sn-glycero-3-phosphocholine) support the intercalation of heme b, see the cross-sectional snap shot in Fig. 27b (Giri et al., Reference Giri, Mukhopadhyay, Basak, Chakrabarti, Sanyal, Runge and Murphy2018): the simulations were run for 220 ns at an initial surface pressure of 30 mN m−1 (corresponding to a mean DMPC area of 52 ± 1 Å2). Under conditions of low loading of the monolayer with heme b, it seems to adopt a tilted orientation with respect to the bilayer normal (Fig. 27b).
Chemical structure of some of the amphiphiles that have been used for the preparation of vesicles containing vesicle membrane-bound heme b. (a) For the preparation of phospholipid-based vesicles: DOPC, 1,2-dioleoyl-sn-glycero-3-phosphocholine; DMPC, 1,2-dimyristoyl-sn-glycero-3-phosphocholine; DMPS, 1,2-dimyristoyl-sn-glycero-3-phosphoserine sodium salt; DMPA, 1,2-dimyristoyl-sn-glycero-3-phosphate sodium salt; cholesterol; and the sodium salt of DCP, dicetylphosphate (= dihexadecylphosphate). ‘Egg PC’ and ‘brain PS’ are mixtures of phosphatidylcholines and phosphatidylserines, respectively, varying in hydrophobic chain length, degree, and saturation. (b) For the preparation of vesicles from entirely non-natural amphiphiles: mixture of ‘Gemini 12-2-12’ and SDS, as reported by Gharibi et al. (Reference Gharibi, Moosavi-Movahedi, Javadian, Nazari and Moosavi-Movahedi2011); poly(PEGDGE-α-BTT), as reported by Rasheed et al. (Reference Rasheed, Nabeel and Bilal2019) (the authors call the polymer containing thiadiazole units ‘poly(ethylene glycol)diglycidyl ether-alt-bismuth-thiol’, m and n are not known); and poly(BDD-α-BTT), as reported by Rasheed et al. (Reference Rasheed, Nabeel and Bilal2019) (called by the authors ‘1,7-butadiene-diepoxide-alt-bismuth-thiol’, n is not known).
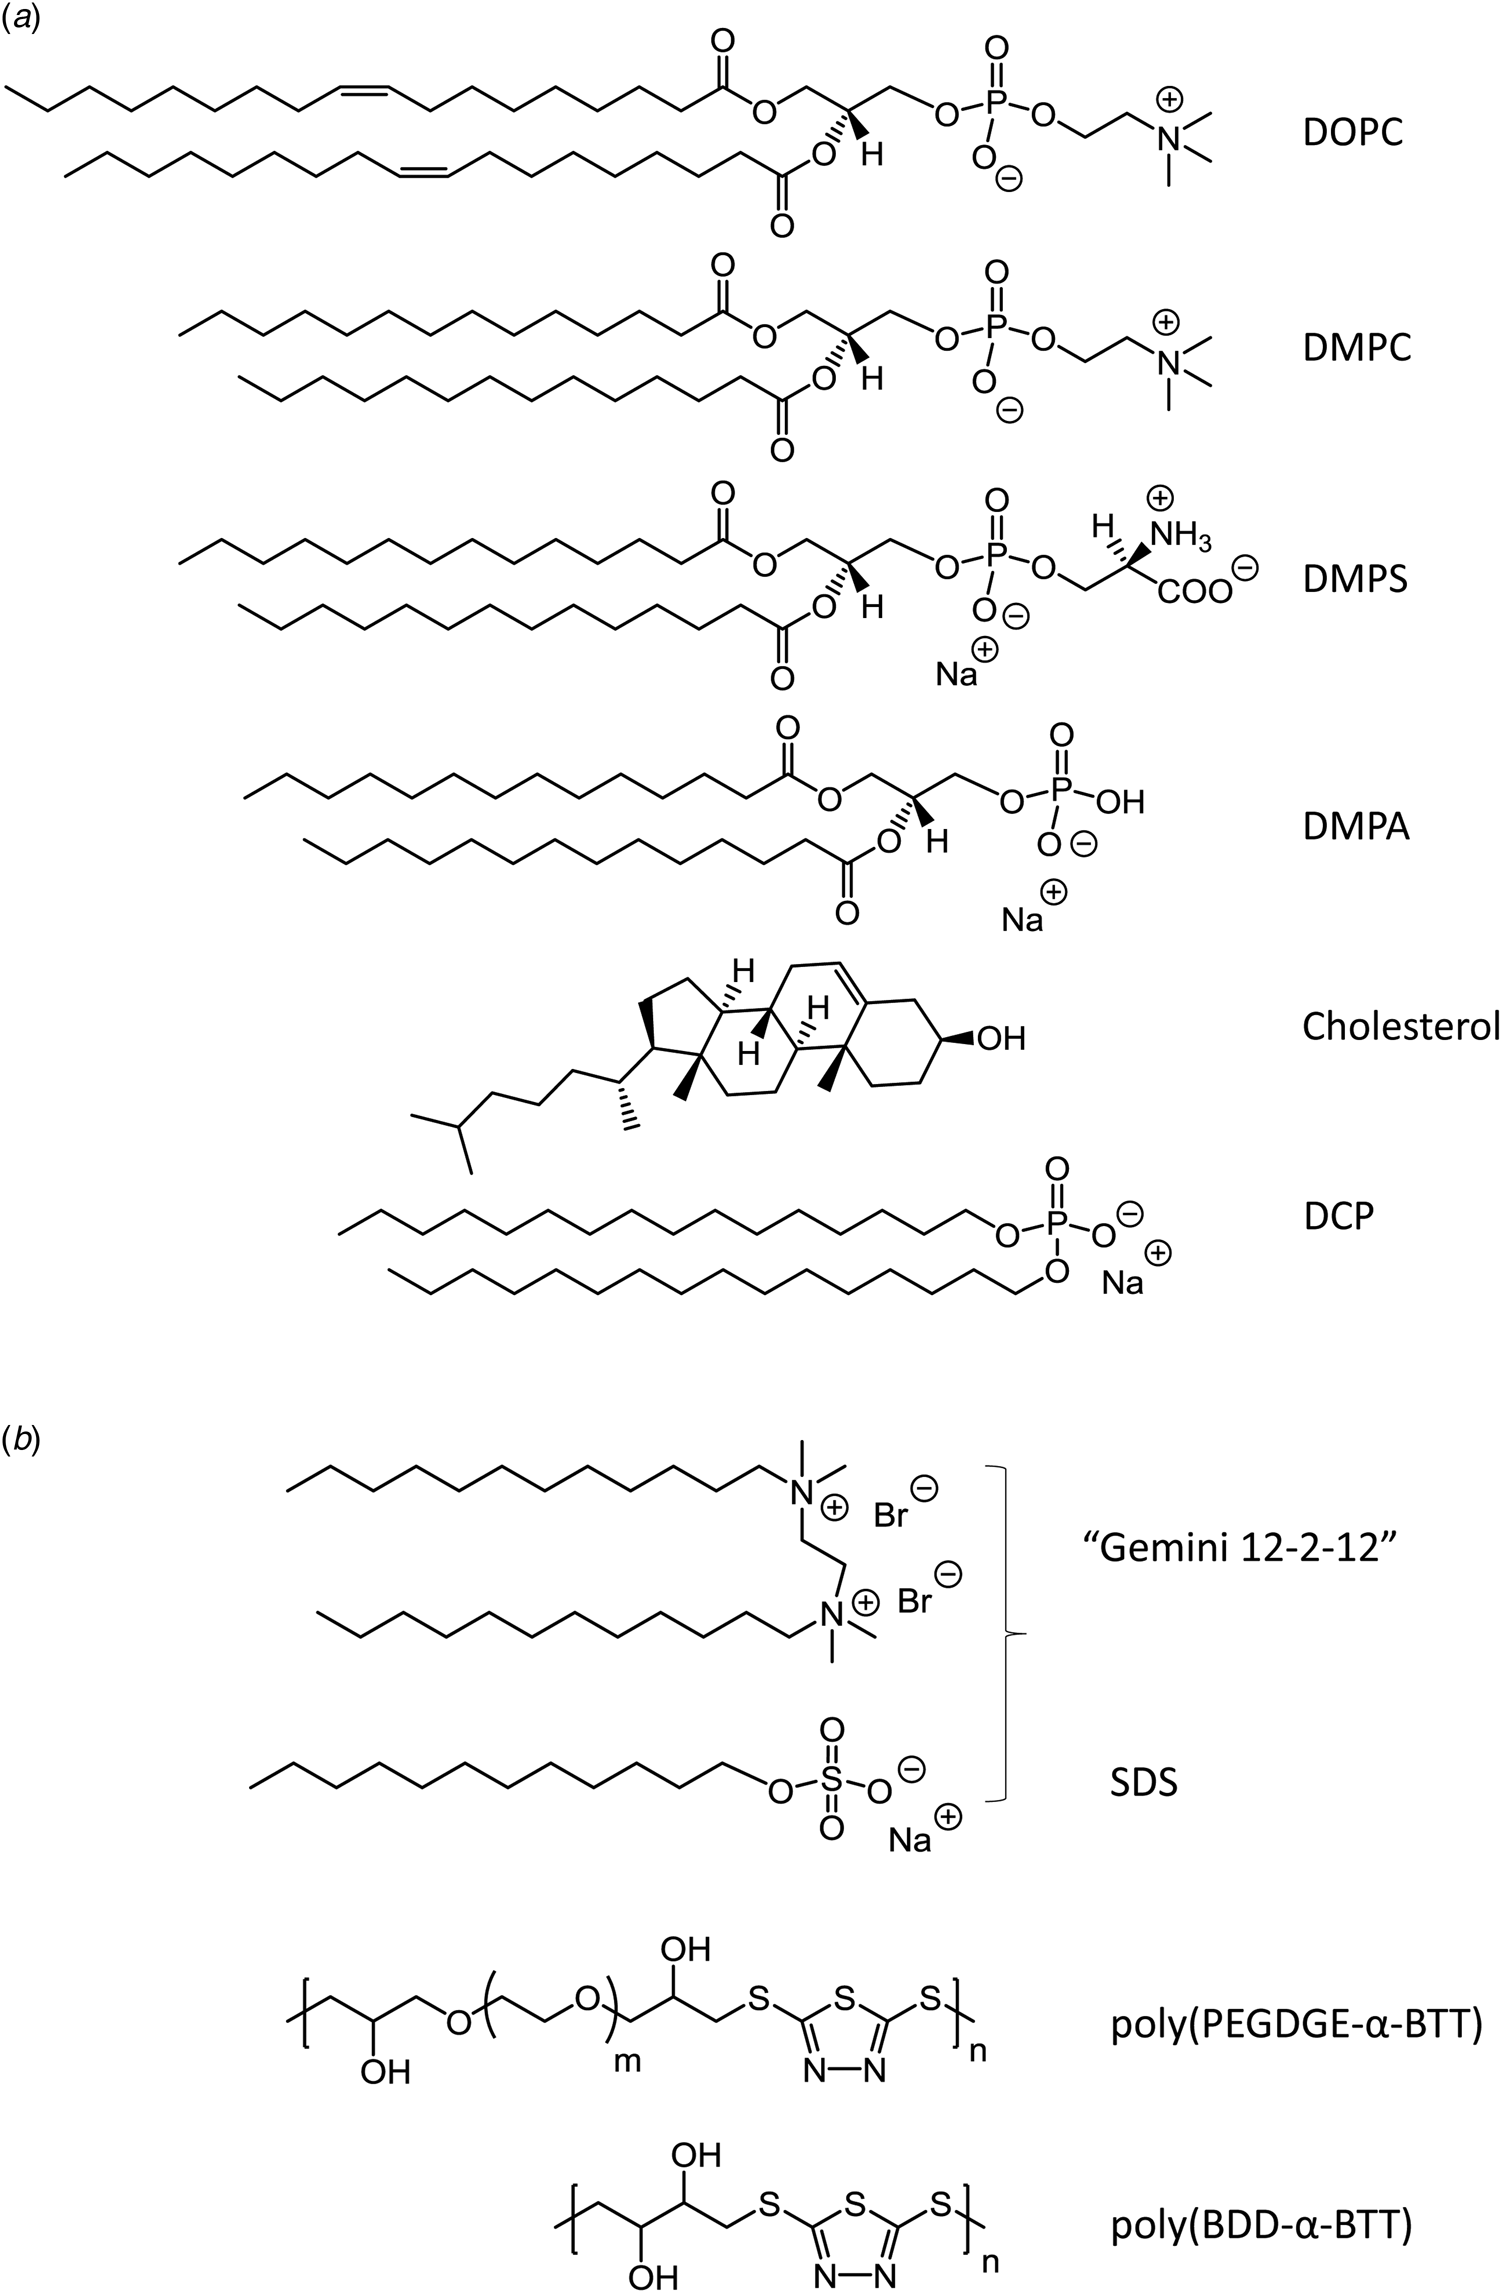
UV/vis absorption spectrum of hemin (5 μM) in vesicle dispersions of 1 mM egg PC (1, solid line) or 1 mM brain PS (2, dashed and dotted line), prepared in 0.1 M NaCl/50 mM Tris buffer (pH = 7.4), as reported by Tipping et al. (Reference Tipping, Ketterer and Christodoulides1979a). The spectra obtained in buffer solution without lipids (3, dotted line) – indicative for hemin aggregation – or in the presence of 100 mM SDS (4, dashed line) are also shown. Path length: 1 cm. The determined molar absorption of hemin bound to egg PC membranes was ɛ ≈400 = 56 500 M−1 cm−1; in the case of brain PS membranes, ɛ ≈400 = 74 000 M−1 cm−1. Reproduced with permission from Tipping et al. (Reference Tipping, Ketterer and Christodoulides1979a).

(a) Highly schematic representation of the possible orientation of hemin in a phospholipid bilayer, as reported by Cannon et al. (Reference Cannon, Kuo, Pasternack, Wong and Muller-Eberhard1984), depicting the localization of hemin in the outer, bulk solution-exposed, monolayer, as well as in the inner monolayer of the vesicle membrane, see Cannon et al. (Reference Cannon, Kuo, Pasternack, Wong and Muller-Eberhard1984) for details. (b) Possible tilted arrangement of ferrous heme b in a DMPC monolayer, as obtained from molecular dynamics simulations (see Giri et al., Reference Giri, Mukhopadhyay, Basak, Chakrabarti, Sanyal, Runge and Murphy2018). The simulation was carried out by taking into account a surface pressure of the DMPC monolayer of 30 mN m−1 and using in the simulation box (62.5 Å × 62.5 Å × 48.5 Å) two lipid monolayers, each containing 64 lipids and a total of two heme b molecules. For details and other simulation conditions, see Giri et al. (Reference Giri, Mukhopadhyay, Basak, Chakrabarti, Sanyal, Runge and Murphy2018). (a) Reprinted with permission from Cannon et al. (Reference Cannon, Kuo, Pasternack, Wong and Muller-Eberhard1984), Copyright 1984 American Chemical Society. (b) Reprinted with permission from Giri et al. (Reference Giri, Mukhopadhyay, Basak, Chakrabarti, Sanyal, Runge and Murphy2018), Copyright 2018 American Chemical Society.

In an investigation of the initial stages of the lipid-mediated formation of hemozoin (Fig. 11), the interaction of π–π or μ-propionato hemin dimers with lipid bilayers formed from either DOPC or DOG (1,2-dioleoyl-sn-glycerol) was studied by molecular dynamics simulations, mimicking the digestive vacuole of the P. falciparum parasite causing malaria (pH ≈ 5.0 inside, lipidic interfaces, see above) (Kuter et al., Reference Kuter, Mohunlal, Fitzroy, Asher, Smith, Egan and De Villiers2016). The simulations showed that the π–π dimer partitions into both lipid bilayers and remains near the hydrated lipid–water interface. The more hydrophobic μ-propionato dimer also partitions into both lipid bilayers; however, it penetrates deeper into the lipid bilayer as compared to the π–π dimer (Kuter et al., Reference Kuter, Mohunlal, Fitzroy, Asher, Smith, Egan and De Villiers2016). Overall, the molecular dynamics simulations – in combination with experimental data ‒ led to the suggestion that the initial step of the lipid-mediated hemozoin formation at pH ≈ 5.0 is the partitioning of π–π dimers into lipid aggregates, followed by dimer aggregation, a reorganization into μ-propionato dimers and finally β-hematin (hemozoin) crystal formation within the hydrophobic part of the lipid membrane. Experimentally, DOG was found to be more efficient than DOPC at forming π–π dimers and at producing β-hematin (Kuter et al., Reference Kuter, Mohunlal, Fitzroy, Asher, Smith, Egan and De Villiers2016).
In Cannon et al. (Reference Cannon, Kuo, Pasternack, Wong and Muller-Eberhard1984), dispersions of lipid vesicles in 80 mM KCl, 20 mM potassium phosphate buffer solution (pH = 7.4) were prepared by the ‘thin film-hydration and sonication’ method. The lipids used were egg PC, brain PS, mixtures of egg PC and anionic dicetylphosphate (DCP) (8:1, molar ratio), egg PC, DCP, and cholesterol (8:1:3, molar ratio), egg PC and cationic stearylamine (8:1, molar ratio), or egg PC, stearylamine, and cholesterol (8:1:3, molar ratio). The vesicle dispersions were mixed with an aqueous solution of hemin dissolved in 0.1 M NaOH, followed by adjustment of the pH value to pH ≈ 7.5 with the phosphate buffer solution mentioned above and tip sonication (Cannon et al., Reference Cannon, Kuo, Pasternack, Wong and Muller-Eberhard1984). The obtained vesicle dispersions containing hemin were then passed through a size-exclusion chromatography column and the fractions containing the vesicles were collected. With all lipids used, hemin eluted with the vesicle fraction, meaning that hemin was associated with the vesicles. The authors reported that partitioning of hemin into the lipid vesicles occurred even without sonication (Cannon et al., Reference Cannon, Kuo, Pasternack, Wong and Muller-Eberhard1984). With the chosen procedure, which included the use of sonication, hemin intercalation in both monolayers of the vesicle membrane is expected, as depicted in Fig. 27a. This is supported by hemin transfer experiments from hemin-containing lipid vesicles to externally added hemin-binding proteins (HSA) which showed a two-step transfer kinetics, a fast step possibly for the hemin molecules localized in the outer monolayer and a slow step for the ones in the inner monolayer (Cannon et al., Reference Cannon, Kuo, Pasternack, Wong and Muller-Eberhard1984). This assignment of the kinetic data was questioned by Rose et al. (Reference Rose, Thompson, Light and Olson1985). The authors carried out own experiments by using instead of hemin ferrous heme b to which carbon monoxide was complexed, (PPIX)FeII(CO) – called ‘CO–heme’ – and found that the transmembrane movement of CO–heme is rather fast (see also Light and Olson, Reference Light and Olson1990a, Reference Light and Olson1990b). The authors argued that the slow kinetic step for the removal of heme b from phospholipid membranes might originate from the presence of heme b aggregates within the membrane, with slow aggregate dissociation. Despite the mentioned uncertainties about the interpretation of the kinetic results, one of the overall conclusions from the detailed study of Cannon et al. (Reference Cannon, Kuo, Pasternack, Wong and Muller-Eberhard1984) was that incorporation of hemin in lipid vesicle membranes occurs readily and independent of the charge of the lipid membrane as long as more than about four to five molecules of phospholipid per hemin are present; the interaction of hemin with the lipid membrane seems to be dominated by hydrophobic interactions. Rose et al. (Reference Rose, Thompson, Light and Olson1985) concluded that for the binding of one heme b molecule about 4–8 phospholipid molecules are required.
In the 1980s, CO–heme – and not hemin – was often used to gain insight into the physico-chemical properties of heme b in vesicular systems because kinetic experiments with hemin yielded ‘heterogeneous time courses’ (Rose et al., Reference Rose, Thompson, Light and Olson1985), probably originating from the formation of aggregates, as previously suggested by Gibson and Antonini (Reference Gibson and Antonini1963). Using CO–heme, ‘much more homogenous time courses’ were observed (Gibson and Antonini, Reference Gibson and Antonini1963; Rose and Olson, Reference Rose and Olson1983; Rose et al., Reference Rose, Thompson, Light and Olson1985). Using CO–heme, the binding strength of heme b to the egg PC membrane was determined on the basis of the equilibrium partition constant K p = [heme b]egg PC membr./[heme b]aq. sol.. The value obtained was K p = 5 × 10⁵ (T = 24 °C), indicating a high affinity of CO–heme for these phospholipid vesicle membranes (Rose et al., Reference Rose, Thompson, Light and Olson1985). The egg PC vesicles used were mainly unilamellar, prepared with the ‘ethanol injection’ method, and the aqueous solution in which they formed was a 50 mM NaCl, 50 mM Tris/HCl buffer solution, pH = 8.2 (Rose et al., Reference Rose, Thompson, Light and Olson1985). Similar K p values of ≈5 × 10⁵ were obtained at T = 30 °C for CO–heme and PC-based vesicles having different membrane compositions, as long as the main bilayer phase transition temperature, T m, was low (T m ⩽ 20 °C) (50 mM NaCl, 50 mM Tris, pH = 8.0), i.e. as long as the membrane was in a fluid, liquid-disordered (also called liquid crystalline) state (see Light and Olson, Reference Light and Olson1990a). Among the 30 vesicle samples of different lipid compositions prepared by the ‘polycarbonate membrane extrusion’ method and analyzed by stopped-flow spectroscopy at 30 °C, those vesicles with high T m gave smaller K p values, and the CO–heme uptake by the vesicle membrane in their solid-ordered (‘gel’) state was slower than in the case of vesicles with low T m (Light and Olson, Reference Light and Olson1990a). The key conclusion was that the physical phase state of the vesicle membrane is ‘the most important factor governing the rate and extent of CO–heme binding’ (Light and Olson, Reference Light and Olson1990a). Furthermore, addition of a negative charge to the lipid vesicles by using anionic amphiphiles decreased K p, obviously caused by electrostatic repulsions, as already suggested by Rose et al. (Reference Rose, Thompson, Light and Olson1985). CO–heme aggregation within the lipid bilayers was not considered in that work.
Whether the general conclusions drawn by Light and Olsson (Reference Light and Olson1990a) about the preferred uptake of (PPIX)FeII(CO) by PC bilayers in their liquid-disordered state – as compared to the solid ordered state – would be the same for (PPIX)FeIII (= hemin) is not clear, but seems likely. However, the more recent investigations appear to indicate that the situation might be significantly different (Das et al., Reference Das, Tarafdar and Chakrabarti2018). Hemin was found to partition less efficiently into vesicle membranes consisting of unsaturated PCs (those with low T m values), as compared to saturated PCs (with high T m values), using vesicle dispersions prepared by the ‘sonication’ method and a 20 mM KCl, 10 mM HEPES buffer solution, pH = 7.0 (Das et al., Reference Das, Tarafdar and Chakrabarti2018). The partition constant, K p (see above), was determined by incubating the vesicle dispersion in the presence of hemin at a temperature above T m for 30 min, followed by ultracentrifugation to pellet the vesicles and for determining the PC and free hemin concentrations in the supernatant. The K p values varied from (2.70 ± 0.11) × 103 (for DOPC, T m ≈ −6 °C), (1.83 ± 0.08) × 103 (for POPC, T m ≈ −3 °C) to (2.56 ± 0.14) × 104 (for DPPC, T m ≈ 41 °C), and (1.56 ± 0.09) × 104 (for DSPC, T m ≈ 55 °C) (Das et al., Reference Das, Tarafdar and Chakrabarti2018); for the T m values given (see Walde and Ichikawa, Reference Walde and Ichikawa2021). In addition to other lipid mixtures that were analyzed, Das et al. (Reference Das, Tarafdar and Chakrabarti2018) also presented experimental data on the effect of hemin on the leakage of trapped 6-carboxyfluorescein (CF) from the vesicles after external addition of hemin at pH = 7.0 and T = 25 °C to the vesicles at a molar ratio of hemin to lipid of 1:125. Much more extensive CF leakage was observed for vesicles formed from DMPC and DMPS (9:1, molar ratio) than from pure DMPC, from DMPC:cholesterol (9:1), or from DMPC:DMPS:cholesterol (8:1:1) vesicles (see Das et al., Reference Das, Tarafdar and Chakrabarti2018). Overall, it remains unclear, whether the observed stronger binding of hemin to high-T m membranes than to low-T m membranes is a contradiction of the results obtained by Light and Olson (Reference Light and Olson1990a), or whether the behavior of hemin differs substantially from the behavior of ‘CO–heme’.
Nevertheless, the hemin-induced leakage of CF from lipid vesicles as plasma membrane-mimicking model systems support the toxic effect free hemin may have due to hemin–biomembrane interactions, see above.
Spectrophotometric investigations with lipid vesicles prepared from anionic 1,2-dimyristoyl-sn-glycerol-3-phosphate (DMPA) at pH = 8.1 (10 mM Tris/HCl) with the ‘sonication’ method, followed by centrifugation to remove large aggregates, indicated binding of hemin to the vesicles (7 μM hemin, 2 mM DMPA) (Davies and Lawther, Reference Davies and Lawther1988). After mixing a DMPA vesicle dispersion with a solution of hemin (pH = 8.1), it took about 2 h to reach a stable absorption spectrum (with ɛ 404 = 60 000 M−1 cm−1) (Davies and Lawther, Reference Davies and Lawther1988). Although the slow kinetics somehow correlates with the conclusions drawn by Light and Olson (Reference Light and Olson1990a) on the effect of anionic lipids on the rate of membrane uptake of CO–heme, the type of final state that hemin reached within the DMPA bilayer is not clear. It was argued that coordination of the heme iron to some groups of the lipid bilayer was responsible for the slow solubilization kinetics (Davies and Lawther, Reference Davies and Lawther1988). The possible formation of heme dimers or higher aggregates within the bilayer membrane was not considered.
The formation of hemin aggregates within vesicular membranes was suggested by Qutub et al. (Reference Qutub, Uzunova, Galkin and Vekilov2010) on the basis of their work with lipid assemblies formed from DMPC and CHAPSO (3-(cholamidopropyl)(dimethyl amino)-2-hydroxy-1-propane sulfonate), a zwitterionic detergent (Fig. 28). CHAPSO was used as a substituent of cholesterol to prepare a model system of the erythrocyte membrane, DMPC:CHAPSO (3:1, molar ratio). Although CHAPSO should not be considered as a cholesterol-like molecule because the structural and physico-chemical properties of the two molecules are rather different, the work presented by Qutub et al. (Reference Qutub, Uzunova, Galkin and Vekilov2010) poses the question whether hemin aggregation within lipid bilayers might occur, depending on the type and amount of phospholipids (and other amphiphiles) used, and depending on the experimental conditions. Figure 28 depicts such possible hemin aggregation, as reported by Qutub et al. (Reference Qutub, Uzunova, Galkin and Vekilov2010). A schematic representation of a mixed bilayer consisting of DMPC and CHAPSO molecules is shown, the latter having a hydrophilic side (formed by three hydroxyl groups and the zwitterionic moiety), similar to the anionic bile salt sodium taurocholate (Mazer et al., Reference Mazer, Benedek and Carey1980). The buffer used contained 150 mM phosphate, pH = 7.35, and the methods of analysis were dynamic light scattering and light microscopy. The vesicles obtained on a microscopy glass slide were very large (‘giant’) and had diameters of more than 150 μm, formed from a 5% solution of DMPC + CHAPSO (at DMPC:CHAPSO = 3:1, mol ratio), upon increasing the temperature from room temperature up to T = 37 °C and after prolonged storage (3 h), see Qutub et al. (Reference Qutub, Uzunova, Galkin and Vekilov2010) for details.
Schematic representation of an ‘island’ of hemin molecules that may exist within lipid vesicle membranes consisting of egg PC and CHAPSO to which hemin is added, as reported by Qutub et al. (Reference Qutub, Uzunova, Galkin and Vekilov2010). CHAPSO was used as cholesterol substituent to mimic the erythrocyte membrane, see text for details. Reprinted with permission from Qutub et al. (Reference Qutub, Uzunova, Galkin and Vekilov2010), Copyright 2010 American Chemical Society.

Binding of hemin to phospholipid vesicle membranes was also confirmed in Schmitt et al. (Reference Schmitt, Frezzatti and Schreier1993), using uni- and multilamellar vesicles prepared in 150 mM NaCl, 20 mM HEPES buffer solution, pH = 7.2, from egg PC, cholesterol, and dihexadecanoylphosphate at a molar ratio of 6:3:1 or 5:4:1. The authors focused their work on a possible effect of hemin on the bilayer permeability toward chromate (CrO42−), TMTA (4-trimethylammonium-2,2,6,6-tetramethylpiperidine-1-oxyl iodide) and/or ascorbate. Typical experimental conditions were 10 mM total lipid and 0.1–1.0 mM hemin (Schmitt et al., Reference Schmitt, Frezzatti and Schreier1993). Depending on the hemin concentration an increase in bilayer permeability was demonstrated. Electron paramagnetic resonance measurements of the membrane spin probe CSL (4′,4′-dimethylspiro[5α-cholestan-3,2′-oxazolidin]-3′-yloxyl) at 1 mol% in bilayers composed of egg PC and cholesterol (6:4, mol ratio), indicated that the membrane incorporated hemin caused a decrease in the lipid order, arguing that the observed permeability increase was due to alterations of the lipid packing and not caused by hemin-catalyzed chemical processes. The authors discussed the likely formation of hemin aggregates within the vesicle membrane that contributed to the permeability increase (Schmitt et al., Reference Schmitt, Frezzatti and Schreier1993).
Although the incorporation of hemin – and other heme b compounds (CO–heme) – in membranes of phospholipid-based vesicles has been studied extensively in the past (see above), to the best of our knowledge there are no reports on a possible peroxidase-like activity of phospholipid vesicle-bound hemin. The reason for this could be that peroxidase activity assays were not carried out, because the focus of the work was on exploring the possible toxic effect of monomeric heme b and on the possible role of lipid aggregates for the formation of hemozoin crystals (malaria research, see Fig. 11), or no peroxidase-like activity was found so far for phospholipid membrane-bound hemin.
In contrast, in the case of two types of vesicular systems consisting of non-natural, fully synthetic amphiphiles, the investigations of Gharibi et al. (Reference Gharibi, Moosavi-Movahedi, Javadian, Nazari and Moosavi-Movahedi2011) and Rasheed et al. (Reference Rasheed, Nabeel and Bilal2019) focused on the peroxidase-like activity of vesicle membrane-associated hemin. In Gharibi et al. (Reference Gharibi, Moosavi-Movahedi, Javadian, Nazari and Moosavi-Movahedi2011), vesicle dispersions were prepared from a mixture of anionic SDS and the cationic gemini surfactant ‘gemini 12-2-12’, see Fig. 25. The samples were prepared in 5 mM phosphate buffer solution, pH = 7 to yield 90 mM SDS, 0.8 mM ‘gemini 12-2-12’, 12 μM hemin, and 3 mM imidazole, the latter serving as an axial ligand. Based on a transmission electron microscopy analysis, the presence of vesicles was demonstrated, although the vesicle size was not uniform; dynamic light scattering measurements yielded an average hydrodynamic diameter of about 50 nm (Gharibi et al., Reference Gharibi, Moosavi-Movahedi, Javadian, Nazari and Moosavi-Movahedi2011). UV/vis absorption measurements in the Soret-band region of the spectrum indicated the presence of mainly monomeric hemin, the absorption spectrum in the vesicular system being identical with the spectrum of hemin (12 μM) measured in the presence of SDS micelles (90 mM SDS) and 3 mM imidazole. The peroxidase-like activity of the vesicular system – 10 μM hemin, 90 mM SDS, 0.8 mM ‘gemini 12-2-12’, 3 mM imidazole, pH = 7 (5 mM phosphate buffer) – was measured with guaiacol as reducing substrate (see Fig. 19d) and H2O2 (1.2 mM) as a terminal oxidant (Gharibi et al., Reference Gharibi, Moosavi-Movahedi, Javadian, Nazari and Moosavi-Movahedi2011). Unfortunately, original data on the measured guaiacol conversion are not given in the paper, and therefore a critical evaluation of the catalytic performance of hemin in the vesicular system is not possible. Nevertheless, for the reported kinetic constants (assuming hemin in this vesicular systems follows Michaelis–Menten kinetics, as in the case of enzymes like HRP), the k cat value was about the same as in the SDS micellar system and lower than for the measurements of hemin (10 μM) and imidazole (3 mM) without any surfactants (Gharibi et al., Reference Gharibi, Moosavi-Movahedi, Javadian, Nazari and Moosavi-Movahedi2011). A more detailed investigation is required for drawing any conclusions about the performance of hemin in this potentially promising catanionic vesicular system (Shang et al., Reference Shang, Liu, Hu and Prausnitz2007), or in related vesicle systems.
In Rasheed et al. (Reference Rasheed, Nabeel and Bilal2019), the authors report about the synthesis of two alternating block copolymers that form vesicles and bind hemin, see Fig. 29a for a schematic representation of the assembly process. The copolymers were abbreviated as poly(PEGDGE-α-BTT) (the authors call it ‘poly(ethylene glycol)diglycidyl ether-alt-bismuth-thiol’) and poly(BDD-α-BTT) (‘1,7-butadiene-diepoxide-alt-bismuth-thiol’) (see Rasheed et al., Reference Rasheed, Nabeel and Bilal2019). The reported chemical structures of the two polymers are given in Fig. 25. The hemin-containing vesicular dispersions were prepared by first dissolving hemin at 0.3 mg ml−1 in 0.2 M aqueous NaOH (12 h at room temperature under stirring), and dissolving the alternating block copolymers at 3 mg ml−1 in DMF. Adding dropwise 2 ml of the copolymer solution into 20 ml of the hemin solution, aggregates formed that were dialyzed against a 10 mM phosphate buffer solution, pH = 7.4. Assuming that all hemin added remained bound to the copolymers, and that there was no change in volume during dialysis, the calculated hemin concentration in the vesicular dispersion obtained was 0.027 mg ml−1 (= 42 μM). Heterogeneous vesicle formation was demonstrated for both copolymers by transmission electron microscopy and dynamic light scattering (D h ≈ 450–510 nm, PDI ≈ 0.36–0.39) (see Rasheed et al., Reference Rasheed, Nabeel and Bilal2019). It was assumed that hemin binds to the copolymers through coordination via the thiadiazole unit. The existence of peroxidase-like activity was proven by using as reducing substrates either orange II (0.25 mM), measuring spectrophotometrically its degradation after adding 5 mM H2O2 in the presence of typically ≈150 μM hemin (0.1 mg ml−1, pH = 7.4, T = 37 °C), TMB (0.5 mM, 6.58 mM H2O2, pH = 7.4) (see Fig. 29b), or catechol (0.25 mM, pH = 7.4 dropwise addition of H2O2), see Rasheed et al. (Reference Rasheed, Nabeel and Bilal2019) for details and additional data.
(a) Schematic representation of the preparation and application of hemin-loaded vesicles consisting of alternating block copolymers, as reported by Rasheed et al. (Reference Rasheed, Nabeel and Bilal2019). The block copolymers used were either poly(PEGDGE-α-BTT) (the authors call the polymer ‘poly(ethylene glycol)diglycidyl ether-alt-bismuth-thiol’) or poly(BDD-α-BTT) (‘1,7-butadiene-diepoxide-alt-bismuth-thiol’) (see Fig. 25. (b) Illustration of the activity of the hemin-loaded vesicles shown in (a) toward TMB as a reducing substrate (0.5 mM) and 6.58 mM H2O2 as an oxidant in 10 mM phosphate buffer solution, pH = 7, at room temperature, as reported by Rasheed et al. (Reference Rasheed, Nabeel and Bilal2019). Unfortunately, neither the type of copolymer vesicles used for the activity measurements, nor the hemin concentration are given in the paper reported. For the chemical structure of TMB and the reaction product responsible for the absorption at λ max ≈ 650 nm, see Fig. 19b. Reprinted with permission form Rasheed et al. (Reference Rasheed, Nabeel and Bilal2019), Elsevier.

The possible presence of hemes in prebiotic times
It is hard to imagine that life could have emerged in the absence of metal ions since they play essential roles in many biological processes (Rossetto and Mansy, Reference Rossetto and Mansy2022). The question is, which organic scaffolds metal ions could have acquired on their way toward enzymes. Based on the structure of contemporary enzymes, it is conceivable to propose that iron was already present in early life forms – and possibly already in prebiotic molecular assemblies (protocells) – as iron–sulfur clusters or hemes and other iron porphyrins. The former has been investigated extensively regarding their plausible prebiotic synthesis routes and possible functional roles in prebiotic times (Bonfio et al., Reference Bonfio, Valer, Scintilla, Shah, Evans, Jin, Szostak, Sasselov, Sutherland and Mansy2017, Reference Bonfio, Godino, Corsini, Fabrizi De Biani, Guella and Mansy2018; Jordan et al., Reference Jordan, Ioannou, Rammu, Halpern, Bogart, Ahn, Vasiliadou, Christodoulou, Maréchal and Lane2021). The possible role of hemes in prebiotic scenarios remains underexplored. This might partially be due to a previous report stating that porphyrins (metalated and non-metalated) cannot be synthesized abiotically, which led to the suggestion that porphyrins are ‘ideal biomarkers’ in the search for extraterrestrial life (Suo et al., Reference Suo, Avci, Schweitzer and Deliorman2007). Such statement does not accurately represent the current demonstrations on the abiotic, potentially prebiotic synthesis of heme, as briefly summarized in the following.
In numerous examples it has been clearly showcased that different types of heme and their organic precursors can be synthesized under prebiotically plausible conditions. These conditions include (i) different Miller–Urey type experimental settings (Szutka, Reference Szutka1964; Hodgson and Baker, Reference Hodgson and Baker1967; Hodgson and Ponnamperuma, Reference Hodgson and Ponnamperuma1968; Simionescu et al., Reference Simionescu, Simionescu, Mora and Leancâ1978; Meierhenrich et al., Reference Meierhenrich, Muñoz Caro, Schutte, Thiemann, Barbier and Brack2005; Lindsey et al., Reference Lindsey, Ptaszek and Taniguchi2009); (ii) conditions that mimic primordial volcanic islands (Fox and Strasdeit, Reference Fox and Strasdeit2013) or hydrothermal vents (Seitz et al., Reference Seitz, Eisenreich and Huber2021); and (iii) other conditions as well (Soares et al., Reference Soares, Taniguchi, Chandrashaker and Lindsey2013; Alexy et al., Reference Alexy, Hintz, Hughes, Taniguchi and Lindsey2015; Deans et al., Reference Deans, Taniguchi, Chandrashaker, Ptaszek, Chambers, Soares and Lindsey2016; Taniguchi et al., Reference Taniguchi, Deans, Chandrashaker, Ptaszek and Lindsey2016; Pleyer et al., Reference Pleyer, Strasdeit and Fox2018; Dagar et al., Reference Dagar, Sarkar and Rajamani2022).
The potentially prebiotic synthesis of heme includes the following steps. In the first step, pyrrole or pyrrole derivatives are formed. Different precursors have been suggested: amino acids, diatomic gases, or simple acyclic organic molecules. In the second step, depending on the structural properties of the formed pyrrole, they either undergo self-condensation or condensation with an aldehyde, usually formaldehyde. As a reaction product, a mixture of different porphyrins is obtained. Metalation of the porphyrins occurs in a third step (Pleyer et al., Reference Pleyer, Strasdeit and Fox2018; Dagar et al., Reference Dagar, Sarkar and Rajamani2022) or alternatively, metal salts are present during the synthesis with the metal ion coordinating to the forming porphyrins. In the latter case, it has been shown that the presence of metal ions significantly increased the yield of pyrroles (Seitz et al., Reference Seitz, Eisenreich and Huber2021) and porphyrins (Simionescu et al., Reference Simionescu, Simionescu, Mora and Leancâ1978) as compared to metal-free reactions. In the context of this review, it is of particular interest to emphasize reaction mixtures in which micelles or vesicles were employed as reaction promoters (Alexy et al., Reference Alexy, Hintz, Hughes, Taniguchi and Lindsey2015), see also Serrano-Luginbühl et al. (Reference Serrano-Luginbühl, Ruiz-Mirazo, Ostaszewski, Gallou and Walde2018) for a description of the general concept. The primary role of micelles or vesicles for supporting chemical reactions is to locally up-concentrate reacting starting materials, thereby facilitating intermolecular reactions to occur. An example of one such reaction is shown in Fig. 30 (Alexy et al., Reference Alexy, Hintz, Hughes, Taniguchi and Lindsey2015). It is fascinating that the reaction proceeded even at pyrrole concentrations of as low as 10–50 μM if the reaction was run in the presence of SDS or CTAC (cetyltrimethylammonium chloride) micelles or egg PC vesicles (T m < 0 °C). This underscores the great benefit of micelles and vesicles for this reaction, because without them the reaction did not proceed. In another work, conceptually the same type of beneficial effect of vesicles was reported, but for vesicles formed from a mixture of decanoic acid and decanoate (Soares et al., Reference Soares, Taniguchi, Chandrashaker and Lindsey2012).
Scheme for the synthesis of 2,3,7,8,12,13,17,18-octaalkylporphyrins from pyrrole and formaldehyde (CH2O) in aqueous solution (0.3 M potassium phosphate buffer, pH = 7) in the presence of either micelles of SDS or cetyltrimethylammonium chloride (CTAC), or egg PC vesicles (see Alexy et al., Reference Alexy, Hintz, Hughes, Taniguchi and Lindsey2015). In the absence of micelles or vesicles, the reaction did not take place (Alexy et al., Reference Alexy, Hintz, Hughes, Taniguchi and Lindsey2015). For the reactions run with 46 μM 3,4-diethylporphyrin and 4.6 mM CH2O at T = 25 or 50 °C in the presence of 30 mM SDS micelles, the maximum yield was ≈35% (after 3 h at 50 °C or 24 h at 25 °C); in the presence of 30 mM CTAC, the yield was ≈15%. For the reaction run with 46 μM 3,4-diethylporphyrin and 4.6 mM CH2O at T = 25 °C in the presence of egg PC vesicles, the yield was ≈13%; the vesicles were prepared by ‘polycarbonate membrane extrusion’ and had an average diameter of ≈100 nm (see Alexy et al., Reference Alexy, Hintz, Hughes, Taniguchi and Lindsey2015).

In both works, it has been clearly shown how a dynamic compartment system can facilitate the reaction that otherwise would not take place. It remains to be further investigated how different composition of the micelles and vesicles would affect the reaction in terms of reaction kinetics and yield. As a continuation of the work reported by Alexy et al. (Reference Alexy, Hintz, Hughes, Taniguchi and Lindsey2015), a different group of researchers has reported metalation of water-insoluble octaethylporphyrin by prebiotically plausible sources of metal ions, i.e. water-insoluble minerals and rocks (Pleyer et al., Reference Pleyer, Strasdeit and Fox2018). It was found that in order for the process of metalation to take place, performing wet–dry cycles was an important step.
Based on the numerous examples showcasing the abiotic formation of porphyrins and hemes it is likely that hemes played a role in the origin of the first cells on the early earth. One should also keep in mind that apart from the peroxidase-like catalytic function of ferric heme b, which is the focus of this review, the role of heme b spans beyond that. As mentioned in the Introduction, heme proteins with heme b as a prosthetic group can catalyze different types of reactions. Therefore, it is expected that primitive catalytic models based on heme b should be capable of achieving similar enzyme-like functions, but less efficiently than in the case of contemporary enzymes. It would be of particular interest to explore how primitive metabolisms would function with metalloporphyrins instead of metal ions only since the former have intrinsically higher catalytic activities due to the additional involvement of the organic porphyrin part (Muchowska et al., Reference Muchowska, Varma and Moran2020).
Conclusions and outlook
Because of the importance of heme b as a prosthetic group in various types of heme proteins, numerous studies on heme b (and related iron porphyrins) have been carried out to date. There is no doubt that further studies on heme b will be performed, either with the aim of improving the current understanding of how heme proteins function or for potential applications of heme b-based devices as enzyme-mimicking systems for analytical or synthetic purposes.
Detailed studies of the heme b in the active site of HRP have revealed the importance of the side chains of a number of amino acids on the proximal and distal sides near the heme group, in particular the imidazole groups of His170 (proximal side) and His42 (distal side). Without either His170 or His42, the peroxidase activity is very low, the rate of compound I formation being orders of magnitudes slower than the one of native HRP (less than 1%), see above and Smith and Veitch (Reference Smith and Veitch1998). Therefore, expectations for the performance of heme b-based peroxidase mimetics using free iron heme b and a non-natural apoprotein-mimicking scaffold must be modest. Other reaction mechanisms may operate so that heme b-based peroxidase-mimicking systems might still be useful, depending on the applications.
Interesting questions to be further addressed are (i) whether primitive heme peroxidase-like precursors lacking complex apoprotein existed in prebiotic times, and (ii) what functions such heme-containing complexes actually had. Hemin/G-quadruplex RNAs are considered potential prebiotic catalysts (Travascio et al., Reference Travascio, Li and Sen1998). Hemin/micelle or hemin/vesicle systems could also have formed, as amphiphilic lipids probably were present in prebiotic times (Deamer et al., Reference Deamer, Dworkin, Sandford, Bernstein and Allamandola2002; Chen and Walde, Reference Chen and Walde2010; Monnard and Walde, Reference Monnard and Walde2015; Fiore and Strazewski, Reference Fiore and Strazewski2016; Deamer, Reference Deamer2017), and the self-assembled lipid scaffold is chemically simpler than oligonucleotides.
In this review, the current, still limited, knowledge on the structure and activity of heme b dissolved or dispersed in micellar and vesicular systems is summarized, with a focus on peroxidase-mimicking activities. On the basis of some of the molecular features of heme b in hemoproteins and on the physico-chemical properties of heme b in aqueous solution, it is argued that micelles and vesicles are potentially promising polymolecular aggregates to provide local hydrophobic environments that allow heme b to be maintained in a catalytically active state in aqueous solution, so that heme b-containing micellar and vesicular solutions and dispersions could be applied as peroxidase-mimicking systems. However, for heme b to show peroxidase-like activity in micellar or vesicular systems, several requirements must be fulfilled: (i) heme b must be ferric heme b, (PPIX)FeIII (= hemin) and in monomeric state; (ii) the 5th coordination site should be occupied by an electron donating molecule; and (iii) the 6th coordination site should not be blocked by a strongly coordinating group so that H2O2 can interact with the iron ion in step 1 of the peroxidase cycle (see Fig. 7).
Due to the amphiphilic nature of PPIX (Scolaro et al., Reference Scolaro, Castriciano, Romeo, Patanè, Cefalì and Allegrini2002; Vermathen et al., Reference Vermathen, Marzorati and Bigler2013; Seo et al., Reference Seo, Jang, Warnke, Gewinner, Schöllkopf and von Helden2016) or hemin, from a purely physico-chemical point of view, aggregates of amphiphiles, like micelles and vesicles, appear ideal candidates for hemin solubilization in predominantly monomeric state. Such hemin solubilization has indeed been demonstrated in several studies (see Figs 14 and 17). A control of the coordination at the 5th and 6th coordination sites of hemin in micelles has been demonstrated (see Figs 18 and 21–23). Therefore, it is likely that conditions can be found for optimal single axial coordination of hemin by an electron-donating group in micellar or vesicular systems so that a decent peroxidase-like activity might be obtained. Nevertheless, there are still only a few reports on the peroxidase-like activity of hemin in micellar or vesicular systems. More work certainly is required. It is likely that by a systematic variation of the different components of the systems will shed some light on the potential and the limitations of these systems: amphiphile type and concentration, buffer type and concentration, pH, hemin concentration, type and concentration of iron-coordinating (‘activity-boosting’) additives, reducing substrate type and concentration, and H2O2 concentration.
The amphiphiles used may play different roles, not only acting as hosts for hemin, but possibly also interfering with the reducing substrates – in a positive or negative way – or with the reaction products that are formed (Fig. 20). Moreover, from an experimental point of view it is worth distinguishing between ‘activity’ data that are obtained from initial velocity measurements, i.e. from analyzing reaction product formation at the very first phase of the reaction, or from reaction yields, i.e. from amounts of products obtained at reaction equilibrium. This important issue has been discussed in some of the many investigations of G-quadruplex/hemin complexes (Yang et al., Reference Yang, Fang, Mei, Chang, Cao and Shangguan2011; Monte Carlo and Fu, Reference Monte Carlo and Fu2022) in which it was concluded that high initial reaction rates may not correlate with high reaction yields due to apparent inactivation of the G-quadruplex/hemin complexes.
Another important question to address in future work is the actual reaction mechanism by which an observed peroxidase-like oxidation by hemin in a micellar or vesicular system takes place. Again, some of the investigations of G-quadruplex/hemin complexes dealt with this question in very careful and detailed experimental work, demonstrating that for some of the complexes, compound I of the peroxidase cycle forms (using Amplex Red as a reducing substrate) (see Shinomiya et al., Reference Shinomiya, Araki, Momotake, Kotani, Kojima and Yamamoto2019), while in other cases, a compound I-like intermediate is not formed (using thioethers as reducing substrates) (see Shumayrikh et al., Reference Shumayrikh, Warren, Bennet and Sen2021). Concerning hemin in a micellar system, recent experiments with micelles formed from anionic SDBS at pH = 4.3 and the linear aniline dimer PADPA as a monomer (see above) to obtain in the presence of H2O2 reaction products that resemble the conductive emeraldine salt form of polyaniline made it clear that other reaction mechanisms than the peroxidase cycle of HRP must play a role depending on the experimental conditions. The experiments showed that the reaction at pH = 4.3 can also take place without the addition of H2O2, but at a much lower rate and with a lower yield (see Cvjetan et al., Reference Cvjetan, Kissner, Bajuk-Bogdanović, Ćirić-Marjanović and Walde2022).
Overall, it is hoped that more fundamental work is dedicated toward the development of micellar and vesicular systems that contain catalytically active hemin. Most of the previous work on hemin in micelles and vesicles focused on structural aspects, mainly on the basis of UV/vis absorption measurements. Although absorptions in the Soret and Q-band regions of the spectrum of heme b are sensitive to the aggregation and oxidation states of heme b, the extent of ligand binding at the two axial coordination positions also influence the absorption band positions and intensities. Therefore, it is difficult to discern a correlation between the hemin absorption spectrum and peroxidase-like activity from the data available to date. Experimental data are needed that directly correlate peroxidase-like activity with UV/vis absorption characteristics and possibly Raman spectroscopic properties of heme b. An interesting direction for future work might be to explore the specificity of hemin in micellar and vesicular systems toward reducing substrates, and if such specificity exists, how it might be explained.
Acknowledgments
We thank Dr. Martin Willeke (Department of Materials, ETH Zürich) for fruitful discussions.
Financial support
This work was supported by the Horizon 2020 Marie Skłodowska-Curie Actions Innovative Training Network (ITN) GA no. 813873, ProtoMet ‘Protometabolic pathways: exploring the chemical roots of systems biology’.
Conflict of interest
The authors declare no conflict of interest.
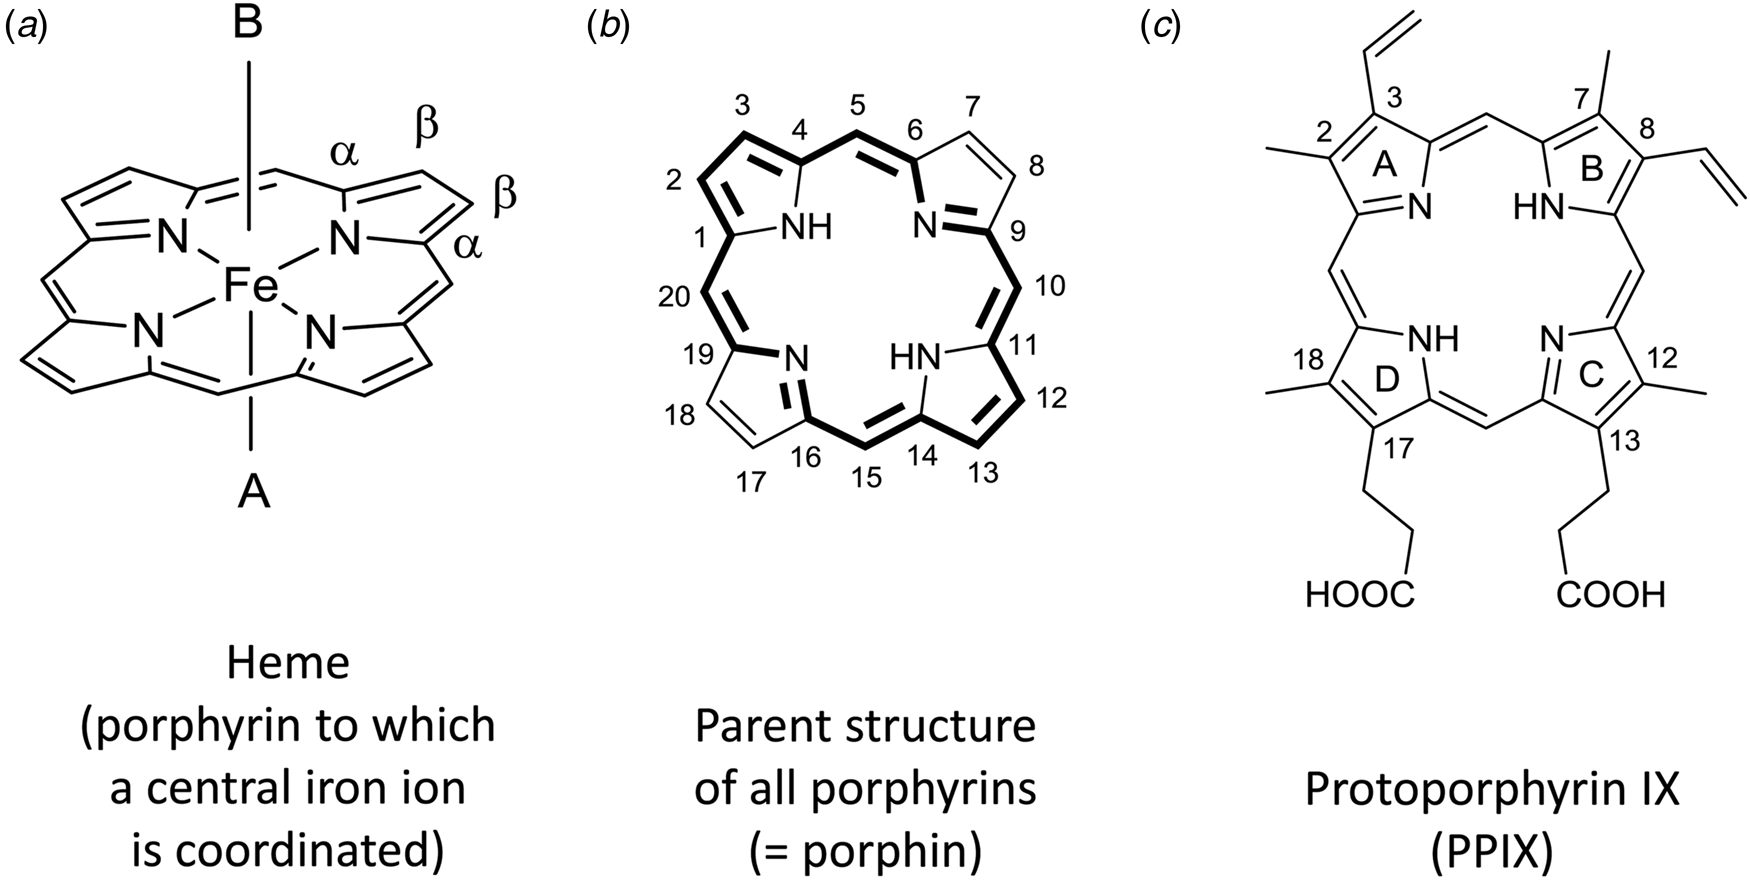


 Open access