

1. Introduction
Many shallow-marine carbonates do not preserve a simple geochemical record of their depositional environment because the sediments are commonly exposed to meteoric water before they have reached mineralogical stability (Allan & Matthews, Reference Allan and Matthews1982). Diagenetic stabilization of the carbonate constituents is accompanied by concomitant textural and chemical changes (Brand & Veizer, Reference Brand and Veizer1980, Reference Brand and Veizer1981). Notably, bulk matrix δ13C data cannot be considered to be free of diagenetic artefacts (Immenhauser, Holmden & Patterson, Reference Immenhauser, Holmden, Patterson, Pratt and Holmden2007). For example, Immenhauser et al. (Reference Immenhauser, Della Porta, Kenter and Bahamonde2003) explained local positive shifts in carbonate δ13C and δ18O values in a thick carbonate platform succession of Palaeozoic strata by geochemically altered platform-top water masses and the effects of early meteoric diagenesis. Furthermore, Patterson & Walter (Reference Patterson and Walter1994a) showed that seawater ΣCO2 from modern carbonate platforms (Bahama Banks and Florida) is depleted in 13C by as much as 4 ‰ relative to open-ocean water. Similarly, Joachimski (Reference Joachimski1994) showed that Purbeckian peritidal micrites deposited in different depositional environments display distinct, facies-dependent carbon-isotope ratios. Therefore, shallow-marine carbonates may develop their own isotopic signature that depends mainly on early meteoric diagenesis and local palaeoenvironmental parameters. However, an increasing number of studies note a correlation of δ13C values between shallow-water and deep-water successions. These studies have lent further support to the applicability of δ13C variations in shallow-marine carbonates for stratigraphic purposes (Immenhauser et al. Reference Immenhauser, Della Porta, Kenter and Bahamonde2003; Buonocunto et al. Reference Buonocunto, Sprovieri, Bellanca, D'argenio, Ferreri, Neri and Ferruzza2002; Glumac & Walker, Reference Glumac and Walker1998; Grötsch, Billing & Vahrenkamp, Reference Grötsch, Billing and Vahrenkamp1998; Immenhauser et al. Reference Immenhauser, Kenter, Ganssen, Bahamonde, Van Vliet and Saher2002; Krull et al. Reference Krull, Lehrmann, Druke, Kessel, Yu and Li2004; Magaritz, Reference Magaritz and Peryt1983; Marshall & Middleton, Reference Marshall and Middleton1980; Swart & Eberli, Reference Swart and Eberli2005; Vahrenkamp, Reference Vahrenkamp1996; Weissert et al. Reference Weissert, Lini, Föllmi and Kuhn1998).
Generally, the Kimmeridgian (Late Jurassic) can be considered as a greenhouse period (Hallam, Reference Hallam1985; Sellwood, Valdes & Price, Reference Sellwood, Valdes and Price2000). In the Swiss Jura, sedimentological and clay-mineralogical analyses of shallow-marine carbonates indicate that climate changed from more humid to more arid at the boundary between the Early and Late Kimmeridgian (Colombié, Reference Colombié2002). This result is consistent with the findings of several authors (Abbink et al. Reference Abbink, Targarona, Brinkhuis and Visscher2001; Hallam, Reference Hallam1984; Price, Reference Price1999; Rameil, Reference Rameil2005; Wignall & Ruffell, Reference Wignall and Ruffell1990), who have indicated a drier phase towards the Jurassic/Cretaceous boundary (from the Kimmeridgian to the Early Berriasian). The Late Kimmeridgian was the end of a second-order transgression that started in the Late Oxfordian (Hardenbol et al. Reference Hardenbol, Thierry, Farley, Jacquin, De Graciansky, Vail, de Graciansky, Hardenbol, Jacquin and Vail1998). Despite this transgression, the Kimmeridgian of the Swiss Jura contains bioturbated mudstones with circum-granular cracks, desiccation cracks, tepees or fenestrae that indicate low-energy depositional environments between the upper intertidal and supratidal zones (Colombié & Strasser, Reference Colombié and Strasser2005). This implies that carbonate productivity was such that the platform could keep up with sea-level rise and even outpace it. However, there is not any sedimentary evidence of repeated and prolonged emergence (e.g. gravitational cements, vadose pisoids, alveolar structures, dissolution vugs, recrystallization of micritic matrix, or rootlet structures). These shallow-water carbonates therefore have a high potential for the preservation of the primary oxygen- and carbon-isotopic compositions.
The biostratigraphy of the Kimmeridgian of the Swiss Jura platform is only poorly defined. A high-resolution sequence-stratigraphic correlation with three biostratigraphically well-dated hemipelagic and pelagic sections located in the Vocontian Basin in France has been performed (Colombié & Strasser, Reference Colombié and Strasser2003, Reference Colombié and Strasser2005). The impetus for the present work was to constrain this correlation by using carbon and oxygen isotopes for correlation between the Kimmeridgian of the Swiss Jura and well-dated coeval sections in other western European basins. Carbon- and oxygen-isotope analyses were made from bulk-rock samples from two Kimmeridgian sections of the Swiss Jura platform. The obtained variations in δ13C and δ18O values correlate with changes in relative sea level. However, these isotopic records differ from those obtained from the same interval in other basins. The obtained values were also compared with the δ13C and δ18O values from coeval nonluminescent belemnite rostra and brachiopods measured in previous studies (Prokoph, Shields & Veizer, Reference Prokoph, Shields and Veizer2008; Riboulleau et al. Reference Riboulleau, Baudin, Daux, Hantzpergue, Renard and Zakharov1998; Veizer et al. Reference Veizer, Ala, Azmy, Bruckschen, Buhl, Bruhn, Carden, Diener, Ebneth, Godderis, Jasper, Korte, Pawellek, Podlaha and Strauss1999; Wierzbowski, Reference Wierzbowski2004), in order to identify the global versus local palaeoceanographic effects. Optical and cathodoluminescence petrography, as well as trends in elemental and isotopic data, were used in order to characterize the influence of meteoric diagenesis. Lastly, the δ13C and δ18O values were compared with the sedimentological and sequence-stratigraphical interpretation of the two studied sections (Colombié, Reference Colombié2002; Colombié & Strasser, Reference Colombié and Strasser2005) in order to specify the origin of the isotopic record in the Kimmeridgian shallow-water carbonates of the Swiss Jura.
2. Geological context
Two Kimmeridgian platform sections, Gorges du Pichoux and Péry-Reuchenette, were studied to investigate their stable-isotope and trace-element compositions. They are located north of Biel in the central Swiss Jura (Fig. 1). During the Kimmeridgian, the Jura Mountains were a SW–NE-trending shallow carbonate platform located between the Paris Basin in the northwest and the Tethys Ocean in the southeast. The Gorges du Pichoux section, which is located north–northwest of the Péry-Reuchenette section, is in a more proximal position and displays generally more restricted facies. Nevertheless, both of the studied successions essentially include bioturbated mudstones and wackestones with moderate fossil diversity (ostracodes, bivalves, gastropods, miliolids, other benthic foraminifera, dasycladaceans and sponge spicules), which indicate semi-restricted lagoons (Colombié & Strasser, Reference Colombié and Strasser2005). Such lime mudstones exhibit high porosities but low permeabilities (Enos & Sawatsky, Reference Enos and Sawatsky1981) that allow only minor pore-water flow. Residence time of waters within these semi-restricted lagoons was long because of weak exchange with open-ocean waters.
Geographical location of the studied sections. The Gorges du Pichoux section is in a more proximal position on the Jura platform than the Péry-Reuchenette section, and generally displays more restricted facies.
In the central Swiss Jura, the Kimmeridgian corresponds to the Reuchenette Formation (Gygi, Reference Gygi1995; Thalmann, Reference Thalmann1966). The Reuchenette Formation lies between the white oolitic limestones of the Late Oxfordian Verena Member and the Early Tithonian ‘Calcaires en Plaquettes’ (Fig. 2). The ammonites of the Swiss Jura have a Tethyan affinity in the Early Kimmeridgian, while they suggest boreal influences in the Late Kimmeridgian (Gygi, Reference Gygi1995; Colombié & Rameil, Reference Colombié and Rameil2007). The top of the Verena Member belongs to the upper part of the Planula ammonite zone (Gygi & Persoz, Reference Gygi and Persoz1986). The upper boundary of the Reuchenette Formation corresponds to the top of the boreal Beckeri zone, which coincides with the Tethyan Autissiodorensis zone (Gygi, Reference Gygi1995; Meyer & Pittman, Reference Meyer and Pittman1994). Sedimentological and sequence analyses of the Gorges du Pichoux and Péry-Reuchenette sections allow the definition of small-, medium- and large-scale depositional sequences that are hierarchically stacked. This hierarchy partly reflects the sedimentary record of climatic and sea-level changes that were in tune with the orbital (Milankovitch) cycles: the small-scale sequences correspond to the 100 ka short eccentricity cycle and the medium-scale sequences to the 400 ka long eccentricity cycle. Large-scale sequences are composed of two to three medium-scale sequences (Fig. 3; Colombié, Reference Colombié2002; Colombié & Strasser, Reference Colombié and Strasser2005). The high-resolution sequence-stratigraphic correlation with three biostratigraphically well-dated hemipelagic and pelagic sections located in the Vocontian Basin in France allows a better definition of the chronostratigraphic framework (Colombié & Strasser, Reference Colombié and Strasser2003, Reference Colombié and Strasser2005). The most important increase in accommodation space in the Kimmeridgian of the Swiss Jura occurs in the Eudoxus ammonite zone (Late Kimmeridgian) and coincides with the end of the second-order transgression (that is, the second-order maximum flooding) defined by Hardenbol et al. (Reference Hardenbol, Thierry, Farley, Jacquin, De Graciansky, Vail, de Graciansky, Hardenbol, Jacquin and Vail1998) for the Tethyan realm (Fig. 2). The platform-to-basin correlation also shows that the composition of hemipelagic and pelagic deposits depends, to a large extent, on cyclical variations of carbonate production in shallow-marine environments and subsequent export of carbonate mud to the basin (Colombié & Strasser, Reference Colombié and Strasser2003). The most important increase in accommodation space in the Kimmeridgian of the Swiss Jura corresponds to the greatest increase in carbonate production and accumulation on the platform and export to the basin. Carbonate production on the platform generally outpaced accommodation gain. Consequently, despite the second-order maximum flooding that characterized the Late Kimmeridgian, the Swiss Jura platform was prograding (Colombié & Strasser, Reference Colombié and Strasser2005).
Stratigraphic chart for the studied interval and associated formations in the Swiss Jura. The most important increase in accommodation space in the Swiss Jura occurs in the Eudoxus ammonite zone, and coincides with the second-order maximum flooding defined by Hardenbol et al. (Reference Hardenbol, Thierry, Farley, Jacquin, De Graciansky, Vail, de Graciansky, Hardenbol, Jacquin and Vail1998) for the Tethyan realm.
Correlation of oxygen- and carbon-isotope ratios between the Gorges du Pichoux and the Péry-Reuchenette sections, and comparison with the sequence-stratigraphic interpretation. Samples listed in bold type were analysed in Zurich, those in regular type in Oxford, those in grey in Lyon. In each section, changes in δ18O resemble those in δ13C. Moreover, variations in oxygen- and carbon-isotopic composition in the Gorges du Pichoux section are similar to those in the Péry-Reuchenette section. Lastly, both studied sections record a general decrease in the oxygen- and carbon-isotope ratios from the base to the top of the studied interval, on which high-resolution changes in δ18O and δ13C values are superimposed.

3. Sampling and methods
Carbon- and oxygen-isotopic analyses were carried out on bulk carbonate samples from the Gorges du Pichoux and Péry-Reuchenette sections (Fig. 3). In the Gorges du Pichoux section, the whole Kimmeridgian was analysed, whereas the studied interval in the Péry-Reuchenette section includes the upper part of the Early Kimmeridgian and the lower part of the Late Kimmeridgian. Seventy-three samples from the Gorges du Pichoux section (2 or 3 metre sampling increments) and 65 samples from the Péry-Reuchenette section (1 or 2 metre sampling increments) were analysed. In order to reduce the effects of mineralogical and biological fractionations as well as diagenetic processes, fine-grained and texturally uniform matrix micrites from the deepest and most open-marine environments were sampled.
Fifty-four analyses from the Gorges du Pichoux section were performed with a VG Prism mass spectrometer at the ETH of Zurich (Switzerland). Then, 62 samples from the Péry-Reuchenette section and 3 samples from the Gorges du Pichoux section were analysed with a VG Prism series 2 at the Department of Earth Sciences of the University of Oxford (United Kingdom). Standard deviations in the Péry-Reuchenette samples are 0.03 ‰ for carbon and 0.09 to 0.1 ‰ for oxygen, while they are 0.06 ‰ for carbon and 0.1 ‰ for oxygen in the Gorges du Pichoux samples. Isotopic results are reported in per mil deviation from the V-PDB (Vienna Pee Dee Belemnite) using the standard delta notation. Lastly, 16 samples from the Gorges du Pichoux section and 3 samples from the Péry-Reuchenette section were analysed with a GV Instruments MultiPrep carbonate preparation device directly coupled to a GV Instruments IsoPrime mass spectrometer at the UMR CNRS 5125 of the University of Lyon 1 (France). Precision is better than 0.03 ‰ for carbon and 0.09 ‰ for oxygen.
Parallel to carbon- and oxygen-isotopic analyses, Sr, Mg, Na, Fe and Mn contents in bulk carbonate samples from the Gorges du Pichoux and Péry-Reuchenette sections were measured. The sampling procedure was the same as the one followed for carbon- and oxygen-isotope analyses. Then, around 15 g of rock were washed in demineralized water, dried in an oven at 80 °C, and powdered very finely. Fifty-five samples from the Gorges du Pichoux were analysed at the University of Dijon. Trace element concentrations in the carbonate fraction (acetic acid soluble fraction) were measured by atomic mass spectrophotometry following the standard procedure developed by Renard & Blanc (Reference Renard and Blanc1971) and Richebois (Reference Richebois1990). Sixty-two samples from the Péry-Reuchenette section were analysed at the Department of Earth Sciences of the University of Oxford. There, 40 mg of powder were dissolved in 1 mol/l acetic acid. The resulting sample solution was centrifuged to remove the residual phase. After adding an internal standard to the sample solution, it was diluted for the ICP mass spectrometer using 1 % HNO3.
Stable-isotope and trace-element compositions were compared to each other (for different time intervals) by using reduced major axis (RMA) linear fitting (Davis, Reference Davis2002). Scatter diagrams include statistical results. For each couple of variables, we calculated the Pearson correlation coefficient (r) in order to estimate the overall quality of the linear relations (the closer to ±1, the better the linear relation). A significance t-test associated with this correlation coefficient indicates how far the sampled data are from the null hypothesis (H0) of no linear relationship between the two variables. A low p-value (classically, < 0.05) refers to couples of variables whose linear relationship cannot be explained by sampling chance. Scatter diagrams include the estimated RMA lines only in this case. However, the correlation of time series of stable-isotope or trace-element compositions can be affected by time-autocorrelation effects. Estimating and testing for significance correlations calculated between time-differentiated variables (e.g. δ18Ot+1 – δ18Ot and δ13Ct+1 – δ13Ct) can easily eliminate this problem. Still, significant correlation between such differentiated variables indicates that the correlation between the two original variables is not a spurious artefact of time-autocorrelation. An analysis of covariance (ANCOVA; Sokal & Rohlf, Reference Sokal and Rohlf1995) was performed in order to test for significance the null hypothesis that a same δ13C versus δ18O linear relation model holds for the various depositional environments, that is, that all the estimated regression lines are statistically equivalent. Here, a low p-value (classically, < 0.05) indicates that the compared samples actually refer to two or more distinct sets of linear relations. We further investigated the relationship between the ranked depositional environments along a more open-marine to more restricted gradient and the linear regression intercepts used for the ANCOVA (that is, the δ18O-values predicted by the sampled linear models for δ13C = 0). We used the Kendall rank correlation coefficient (τ) and its associated significance test (H0: τ = 0) (Abdi, Reference Abdi and Salkind2007; Kendall & Gibbons, Reference Kendall and Gibbons1990). Kendall's τ is a robust (nonparametric) measure for nonlinear but monotonous relationship between two variables (the closer to ±1, the stronger the correspondence between the two sets of ranked values).
Ten thin-sections from the Gorges du Pichoux were investigated with cathodoluminescence microscopy (CL MK3a, 17 kV gun voltage, 450 μA gun current). They are located below, in and above the transgressive and maximum-flooding deposits of the second and third large-scale sequences (Fig. 3).
4. Results
Results of the carbon- and oxygen-isotopic analyses from the Gorges du Pichoux and Péry-Reuchenette sections are plotted in Figure 3 and listed in Table 1. In the Gorges du Pichoux section, δ13C and δ18O values fluctuate to a large part in covariance and generally resemble those from the Péry-Reuchenette section (Fig. 3). Carbon- and oxygen-isotope values in the Gorges du Pichoux section range from −3.5 to 2.2 ‰ and from −6.7 to −2 ‰, respectively (Table 1). The mean values are −0.3 ± 1.4 ‰ for δ13C and −4.7 ± 1.1 ‰ for δ18O. The lowest δ13C and δ18O values from the Péry-Reuchenette section are −2 ‰ and −8.7 ‰, respectively; the highest values are 3.1 ‰ and −2.2 ‰. The mean δ13C and δ18O values are 0.4 ± 1 ‰ and −4.6 ± 1.2 ‰, respectively. In both the Gorges du Pichoux and Péry-Reuchenette sections, the deviation from the mean value to the lowest value and highest value is at least one order greater than the standard deviation, indicating that fluctuations in δ13C and δ18O values are meaningful. δ13C and δ18O values generally decrease from the base to the top of both studied sections. Most δ13C and δ18O values are higher than the mean value in the lower part of the studied interval, whereas most of them are lower than the mean value in the upper part. The mean δ13C and δ18O values are lower at Gorges du Pichoux, which is the more proximal section, than at Péry-Reuchenette. The standard deviations for δ13C and δ18O values in the Gorges du Pichoux section are higher than those in the Péry-Reuchenette section.
Carbon- and oxygen-isotope ratios (‰ V-PDB) from the Gorges du Pichoux (samples Pi) and Péry-Reuchenette (samples Re) sections
Samples in bold type were analysed in Zurich, those in regular type in Oxford, those in italic type in Lyon. σ is standard deviation.
Moreover, (δ13C, δ18O) scatter diagrams for the Gorges du Pichoux and Péry-Reuchenette sections show that carbon- and oxygen-isotope ratios behave as interrelated variables when including the whole studied interval or when looking only at its lower or upper part where most δ13C and δ18O values are higher or lower than the mean values, respectively (Fig. 4).
(δ13C, δ18O) scatter diagrams for: (a) the whole Gorges du Pichoux section, (b) the lower part (from Pi 17 to Pi 107) and (c) the upper part (from Pi 108 to Pi 234) of the Gorges du Pichoux section; (d) the whole Péry-Reuchenette section, (e) the lower part (from Re 24.4 to Re 29.20) and (f) the upper part (from Re 29.21 to Re 10.5) of the Péry-Reuchenette section. δ13C and δ18O values are interrelated variables whatever the studied section and interval.

The comparison between the stable isotope records and the sequence-stratigraphical interpretation reveals high-frequency δ13C and δ18O changes: (1) δ13C and δ18O values that are higher than the mean values in the transgressive deposit (TD) of the second large-scale sequence; (2) δ13C and δ18O values that are lower than the mean values in the maximum-flooding deposit (MFD) of the second large-scale sequence; (3) a positive shift in δ13C and δ18O values in the TD of the third large-scale sequence in the Péry-Reuchenette section but a coeval negative shift in the Gorges du Pichoux section; and (4) a negative shift in δ13C and δ18O values in the MFD of the third large-scale sequence (Fig. 3). The main excursions discussed here are defined by numerous data points and are not the effects of simply one or a few samples deviating from the mean. The highstand and lowstand deposits display very irregular patterns in the isotope curves that are difficult to correlate from one section to the other.
Strontium, Mg, Na, Fe and Mn contents in the Gorges du Pichoux and Péry-Reuchenette sections are listed in Tables 2 and 3, respectively. Strontium contents vary from 37 to 226 ppm in the Gorges du Pichoux section, and from 93 to 219 ppm in the Péry-Reuchenette section. Magnesium contents range from 1052 to 8839 ppm in the Gorges du Pichoux section, and from 516 to 17539 ppm in the Péry-Reuchenette section. Only the samples from the Gorges du Pichoux section include Na, whose contents vary from 113 to 283 ppm. Iron contents fluctuate from 138 to 626 ppm in the Gorges du Pichoux section, and from 0 to 345 ppm in the Péry-Reuchenette section. Manganese contents range from 40 to 122 ppm in the Gorges du Pichoux section, and from 18 to 90 ppm in the Péry-Reuchenette section.
Sr, Mg, Na, Fe and Mn contents (ppm) in the Gorges du Pichoux samples
Analyses were performed in collaboration with Laurent Emmanuel at the University of Dijon. σ is standard deviation.
Sr, Mg, Fe and Mn contents (ppm) in the Péry-Reuchenette samples
Analyses were performed at the Department of Earth Sciences of the University of Oxford. σ is standard deviation.
All samples investigated with cathodoluminescence microscopy are luminescent (Fig. 5). They show yellow to orange and orange to red homogeneous luminescence. Most bioclasts show the same colour as the matrix. Iron oxides and cements tend to be brown to black.
Plain light (a, b, c, d) and cathodoluminescence (e, f, g, h) photomicrographs of samples Pi 99 (a, e), and Pi 128 (b, f) characterizing transgressive deposits, and Pi 110 (c, g), and Pi 147 (d, h) representing maximum-flooding deposits of the Gorges du Pichoux section. Most samples are fine-grained micrites and show yellow to orange and orange to red homogeneous luminescence, which indicates that the studied samples have undergone diagenetic alteration.

5. Discussion
5.a. General carbon- and oxygen-isotopic trends in the Kimmeridgian
The end of the second-order transgression (second-order maximum flooding), which characterizes the Eudoxus zone in the Tethyan realm (Fig. 2), coincides with the MFD of the third large-scale sequence. There, both studied sections exhibit the most-open marine facies, the thickest beds, and relatively negative δ13C and δ18O values (Fig. 3). The general decrease in the isotopic values from the base of the studied interval to the second-order MFD coincides with this long-term transgressive trend. The high-resolution Tethyan-to-boreal correlation performed by Colombié & Rameil (Reference Colombié and Rameil2007) shows that the second-order MFD in the Swiss Jura corresponds to a positive shift in δ13C (Fig. 6) in bulk organic matter from the Kimmeridge Clay Formation (KCF) of southern England (Morgans-Bell et al. Reference Morgans-Bell, Coe, Hesselbo, Jenkyns, Weedon, Marshall, Tyson and Williams2001). However, the enhanced δ13CTOC values in the KCF mostly correlate with enhanced TOC values that probably result from enhanced preservation of carbohydrates through sulphurization (van Dongen, Schouten & Sinninghe Damste, Reference van Dongen, Schouten and Sinninghe Damste2006). They are most likely caused by a longer duration of photic zone euxinia in the depositional environment and do not reflect the overall composition of dissolved inorganic carbon in seawater. Moreover, whatever the palaeogeographical location (boreal or Tethyan), the Late Kimmeridgian is characterized by either an increase or a decrease in carbon- and oxygen-isotope ratios (Morgans-Bell et al. Reference Morgans-Bell, Coe, Hesselbo, Jenkyns, Weedon, Marshall, Tyson and Williams2001; Weissert & Mohr, Reference Weissert and Mohr1996; Jenkyns et al. Reference Jenkyns, Jones, Gröcke, Hesselbo and Parkinson2002; Bartolini, Baumgartner & Guex, Reference Bartolini, Baumgartner and Guex1999; Bartolini, Baumgartner & Hunziker, Reference Bartolini, Baumgartner and Hunziker1996; Cecca et al. Reference Cecca, Savary, Bartolini, Remane and Cordey2001; Gröcke et al. Reference Gröcke, Price, Ruffell, Mutterlose and Baraboshkin2003; Morettini et al. Reference Morettini, Santantonio, Bartolini, Cecca, Baumgartner and Hunziker2002; Padden et al. Reference Padden, Weissert, Funk, Schneider and Gansner2002; Price & Gröcke, Reference Price and Gröcke2002; Price & Rogov, Reference Price and Rogov2009; Riboulleau et al. Reference Riboulleau, Baudin, Daux, Hantzpergue, Renard and Zakharov1998; Wierzbowski, Reference Wierzbowski2004). Lastly, the compilation of δ18O and δ13C values from diagenetically little altered Phanerozoic fossil shells indicates a general decrease in δ18O and δ13C values during the Late Jurassic (Prokoph, Shields & Veizer, Reference Prokoph, Shields and Veizer2008; Veizer et al. Reference Veizer, Ala, Azmy, Bruckschen, Buhl, Bruhn, Carden, Diener, Ebneth, Godderis, Jasper, Korte, Pawellek, Podlaha and Strauss1999). At 150 Ma, which is approximately the age of the studied interval, mean δ18O and δ13C values were −0.75 ‰ and 1.7 ‰, respectively (Veizer et al. Reference Veizer, Ala, Azmy, Bruckschen, Buhl, Bruhn, Carden, Diener, Ebneth, Godderis, Jasper, Korte, Pawellek, Podlaha and Strauss1999). More recently, Prokoph, Shields & Veizer (Reference Prokoph, Shields and Veizer2008) gave −1.5 ‰ for δ18O and 2.8 ‰ for δ13C of brachiopods. These values are consistent with those measured by Riboulleau et al. (Reference Riboulleau, Baudin, Daux, Hantzpergue, Renard and Zakharov1998) and Wierzbowski (Reference Wierzbowski2004) from belemnite rostra: δ18O and δ13C values varied from −1.8 to 0 ‰ and from −1.5 to 3 ‰, respectively. Most of these values are higher than the mean δ18O and δ13C values presented here (that is, −4.6 and 0 ‰, respectively).
Correlation of carbon-isotope ratio variations between the Swiss Jura and the lower part of the Kimmeridge Clay Formation in southern England according to Colombié & Rameil (Reference Colombié and Rameil2007). The second-order MFD in the Gorges du Pichoux section, which shows the lowest δ13C values, coincides with a positive shift in δ13C in the Kimmeridge Clay Formation of southern England. Carbon- and oxygen-isotopic composition increases or decreases in the Late Kimmeridgian depending on geographical location, suggesting that high-resolution variations in δ13C values in the Swiss Jura partly result from diagenetic alteration or changes in local environmental conditions.
Consequently, the general decrease in the carbon- and oxygen-isotopic ratios from the base of the studied interval to the second-order MFD coincides with secular changes that are expressed also on a more global scale. However, both studied sections show lower values than those measured from contemporaneous shell or whole rock samples in other basins, and high-frequency changes in δ13C and δ18O values that are superimposed on the general decrease in carbon- and oxygen-isotopic compositions.
Controls on the δ13C and δ18O values of abiotic and biotic carbonates are numerous (Fig. 7). In the following, diagenetic effects and environmental conditions will be discussed.
Primary and diagenetic controls on δ13C and δ18O values of abiotic and biotic carbonates according to the references listed in this figure, but see also Immenhauser, Holmden & Patterson (Reference Immenhauser, Holmden, Patterson, Pratt and Holmden2007), Marshall (Reference Marshall1992), Anderson & Arthur (Reference Anderson, Arthur, Arthur, Anderson, Veizer and Land1983), Scholle & Arthur (Reference Scholle and Arthur1980) and Zeebe & Wolf-Gladrow (Reference Zeebe and Wolf-Gladrow2001). Primary oxygen- and carbon-isotopic composition of carbonates depends on fractionation of oxygen and carbon isotopes during precipitation of carbonates or kinetic vital effects, or changes of the oxygen- and carbon-isotopic composition of seawater.
5.b. Diagenetic alteration
Both petrography and geochemistry can be used to detect diagenetic products (Marshall, Reference Marshall1992; Moore, Reference Moore2001). Cement type can be diagnostic of a particular diagenetic environment. However, identical cement types may be formed in different diagenetic environments. For example, equant drusy spar cement may precipitate in near-surface meteoric environments and under deep burial conditions (Flügel, Reference Flügel2004). Moreover, most samples from the Kimmeridgian of the Swiss Jura are fine-grained micrites, in which cementation and diagenetic alteration are difficult to identify using transmitted light microscopy (Fig. 5). Therefore, attention must be paid to isotopes, trace elements and cathodoluminescence fabrics to correctly interpret the diagenetic environment.
Only early meteoric diagenesis leads to concomitant decreases in 18O and 13C contents of carbonates (Fig. 7) and could explain the low δ13C and δ18O values measured in the Kimmeridgian of the Swiss Jura. The oxygen- and carbon-isotopic compositions of meteoric cements will depend on the isotopic composition of the meteoric waters invading the sediment. The oxygen-isotopic composition of meteoric waters is strongly latitude dependent and can vary in δ18O from −20 to −2 ‰ SMOW (Anderson & Arthur, Reference Anderson, Arthur, Arthur, Anderson, Veizer and Land1983; Hudson, Reference Hudson1977). At any specific geographic site, however, the initial δ18O composition of meteoric water should be relatively constant. In most meteoric environments, the prime source for the ultimate carbon-isotopic composition of meteoric diagenetic waters is soil gas and the CO2 derived from the dissolution of marine limestones (Allan & Matthews, Reference Allan and Matthews1982; Lohmann, Reference Lohmann, James and Choquette1988). Equilibration with organically derived CO2 with a strongly negative δ13C (−25 to −16 ‰) depends on the extent of rock–water interaction. The pattern of invariant δ18O combined with variable δ13C, termed the meteoric calcite line, serves as the baseline relative to which chemical variations characteristic of vadose-phreatic, mixed-water and spelean environments can be discriminated (Lohmann, Reference Lohmann, James and Choquette1988). Trace, minor and major cations are also mobilized as carbonate rock is progressively altered. Post-depositional alteration therefore leads to increases in Mn2+ and Fe2+ contents, and decreases in Sr2+, Na+, 18O and possibly 13C contents in carbonate components (Brand & Veizer, Reference Brand and Veizer1981). Sr2+ and Mn2+ are useful diagenetic tracers because of their widely divergent partition coefficients, their association mostly with the carbonate lattice, and their large compositional differences in marine and meteoric water (Bodine, Holland & Borcsik, Reference Bodine, Holland and Borcsik1965; Kinsman, Reference Kinsman1969; Turekian, Reference Turekian1972).
Oxygen-isotope values range from −6.7 to −2 ‰ in the Gorges du Pichoux section and from −8.7 to −2.2 ‰ in the Péry-Reuchenette section (Table 1). They are lower than the literature estimates of Kimmeridgian marine carbonates, which vary between −1.85 and 0 ‰ (Riboulleau et al. Reference Riboulleau, Baudin, Daux, Hantzpergue, Renard and Zakharov1998; Wierzbowski, Reference Wierzbowski2004). However, carbon-isotope values range between −3.5 and 2.2 ‰ in the Gorges du Pichoux section, and between −2 and 3.1 ‰ in the Péry-Reuchenette section (Table 1). These values are close to the δ13C values from Kimmeridgian marine carbonates, which range from −1.5 to 3 ‰ (Riboulleau et al. Reference Riboulleau, Baudin, Daux, Hantzpergue, Renard and Zakharov1998; Wierzbowski, Reference Wierzbowski2004). Low δ18O values, moreover, do not coincide with low δ13C values (except for sample Pi 217). Furthermore, slopes of (δ13C, δ18O) correlation lines range from 0.78 for the whole Gorges du Pichoux section to 1.86 for the lower part of the Péry-Reuchenette section (Fig. 4), suggesting that carbon- and oxygen-isotope ratios were modified in the same way. Lastly, δ18O values and Sr contents are related in the Gorges du Pichoux section, while they are two independent variables in the Péry-Reuchenette section (Fig. 8).
(Sr, Mn) and (δ18O, Sr) scatter diagrams for the Gorges du Pichoux (a, b) and Péry-Reuchenette (c, d) sections. δ18O values and Sr contents correlate in the Gorges du Pichoux section, whereas they are two independent variables in the Péry-Reuchenette section, suggesting changes in diagenetic alteration from one section to the other.
Changes through time in δ18O and δ13C values are similar in both studied sections. Increases in δ18O and δ13C values in TD and decreases in MFD occur in two large-scale sequences. That meteoric diagenesis can have a strong influence at low relative sea level (that is, around sequence boundaries) seems only logical. However, the slopes of (δ13C, δ18O) correlation lines are 0.77 for TD and 0.53 for MFD (Fig. 9). These slopes are in accordance with those defined for the whole studied sections and their lower and upper parts (Fig. 4). Therefore, the measured isotopic signals do not imply a stronger influence of meteoric diagenesis in the shallower-water facies of TD. Also, it is difficult to conceive that meteoric diagenesis could have dominated the deeper-water facies of MFD. Lastly, the absence of pronounced subaerial exposure surfaces excludes the possibility of long-lasting and pervasive freshwater lenses affecting thick portions of the sedimentary record.
(δ13C, δ18O), (δ18O, Sr) and (Sr, Mn) scatter diagrams for large-scale transgressive (TD) and maximum-flooding (MFD) deposits. Slopes of correlation lines are in accordance with those defined for the whole and the lower and the upper parts of the studied sections. Strontium contents and δ18O, and Sr and Mn contents correlate neither in TD nor in MFD. The impact of diagenesis does not seem stronger in TD that are, however, shallower and more prone to diagenetic alteration than MFD.
Strontium contents in the Gorges du Pichoux and Péry-Reuchenette sections (Tables 2, 3) are very low compared to Sr contents of modern micrites (Kinsman, Reference Kinsman1969; Andrews, Christidis & Dennis, Reference Andrews, Christidis and Dennis1997; Bosence, Reference Bosence, Monty, Bosence, Bridges and Pratt1995; Gischler & Zingeler, Reference Gischler and Zingeler2002; Milliman et al. Reference Milliman, Freile, Steinen and Wilber1993). However, manganese contents are close to those of modern lagoonal (brackish water) or freshwater carbonate sediments (Friedman, Reference Friedman and Friedman1969), and lower than those measured in pelagic carbonates of Kimmeridgian successions (de Rafélis et al. Reference De Rafélis, Renard, Emmanuel and Durlet2000). In addition, (Sr, Mn) scatter diagrams performed for the Gorges du Pichoux and Péry-Reuchenette sections do not show any relationship between Sr and Mn contents (Fig. 8), and the same is true for the (Sr, Mn) distribution covering only the TD and MFD (Fig. 9).
Cathodoluminescence microscopy was applied to check diagenetic effects. Mn2+ is considered as the main activator of an orange-coloured luminescence, while Fe2+ acts as an inhibitor resulting in a dark red (dull) or no luminescence (Joachimski et al. Reference Joachimski, Simon, Van Geldern and Lécuyer2005; Machel et al. Reference Machel, Mason, Mariano, Mucci, Barker and Kopp1991; Savard, Veizer & Hinton, 1995). Since Mn2+ is only soluble under reducing conditions, the observed orange-coloured luminescence is indicative of diagenetic stabilization under non-oxidizing conditions (probably marine burial to burial) (van Geldern et al. Reference van Geldern, Joachimski, Day, Jansen, Alvarez, Yolkin and Ma2006).
In conclusion, there is no clear evidence that meteoric diagenesis was not responsible for the low δ18O and δ13C values measured in the Kimmeridgian of the Swiss Jura. Moreover, cathodoluminescence microscopy indicates that the analysed samples have undergone diagenetic alteration that uniformly affected matrix and grains and was the same whatever the stratigraphic location of the studied samples.
5.c. Changes in local environmental conditions
Several controls lead to changes in the oxygen- and carbon-isotopic compositions of seawater that induce changes in the δ18O and δ13C values of carbonates (Fig. 7). However, only freshwater discharge results in concomitant decreases in oxygen- and carbon-isotopic compositions of carbonates. Dilution by freshwater lowers both δ13C and δ18O values of seawater from which marine carbonates precipitate because of depletion in 13C and 18O of freshwater relative to seawater (Patterson & Walter, Reference Patterson and Walter1994a). The lower part of the studied sections locally shows gyrogonites and stems of charophytes in bioturbated mudstones with fossils of euryhaline organisms (ostracodes, bivalves, miliolids). These deposits indicate ponds between channel systems that became brackish during periods of heavy rainfall (Colombié & Strasser, Reference Colombié and Strasser2005). However, the decreasing kaolinite-to-illite ratio and quartz content, the disappearance of charophytes, and the appearance of gypsum pseudomorphs in the upper part of the studied sections indicate that climate changed from more humid to more arid at the boundary between the Early and Late Kimmeridgian (Colombié, Reference Colombié2002). Freshwater runoff most likely decreased from Early to Late Kimmeridgian times while salinity increased, leading to gypsum formation in the most restricted areas. Therefore, the low δ18O and δ13C values measured and the high-frequency changes in oxygen- and carbon-isotopic compositions observed in the Kimmeridgian of the Swiss Jura rather result from the combination of multiple factors probably controlled by high-frequency changes in relative sea level rather than from freshwater run-off alone.
Changes in δ13C and δ18O values measured in the Kimmeridgian of the Swiss Jura coincide with large-scale changes in relative sea level. Relative sea-level changes are interpreted from the evolution through time of depositional environments and bed thicknesses (Colombié, Reference Colombié2002; Colombié & Strasser, Reference Colombié and Strasser2005). In a depositional sequence, the MFD correspond to the most open-marine depositional environments and to the thickest beds, which suggest the highest accommodation gain and carbonate accumulation (Colombié, Reference Colombié2002; Colombié & Strasser, Reference Colombié and Strasser2005). They also coincide with decrease in δ13C and δ18O values.
During the Kimmeridgian, the Swiss Jura platform was characterized by tidal flats and by more or less open-marine lagoons with shoals and bioherms (Colombié & Strasser, Reference Colombié and Strasser2005). An analysis of covariance shows that (δ13C, δ18O) correlation lines, defined for each depositional environment, are parallel (Fig. 10; Table 4), suggesting that carbon- and oxygen-isotope fractionations between carbonates and seawater were the same in each environment. (δ13C, δ18O) correlation lines defined for marsh, intertidal and open lagoonal environments in the Péry-Reuchenette section are parallel to the others (Fig. 10). However, a t-test applied to these data indicates that the corresponding δ13C and δ18O values are not interrelated (Table 4). This result is most likely due to scant data concerning these environments. The slopes of (δ13C, δ18O) correlation lines range from 0.34 to 1.19. These values are in accordance with those that were defined for the whole studied sections and their lower and upper parts (Fig. 4).
Statistical results for each depositional environment defined in the Gorges du Pichoux and Péry-Reuchenette sections
n – number of observations, r – correlation coefficient, a – slope of regression line, b – intercept of regression line.
(δ13C, δ18O) scatter diagrams showing regression lines defined for each environment of (a) the Gorges du Pichoux and (b) the Péry-Reuchenette sections. The (δ13C, δ18O) regression lines defined for each depositional environment are parallel, suggesting that carbon- and oxygen-isotope fractionation is the same whatever the environment. These lines, however, show different y intercepts. This offset is probably due to water mass ageing that increases from more open-marine to more restricted environments.
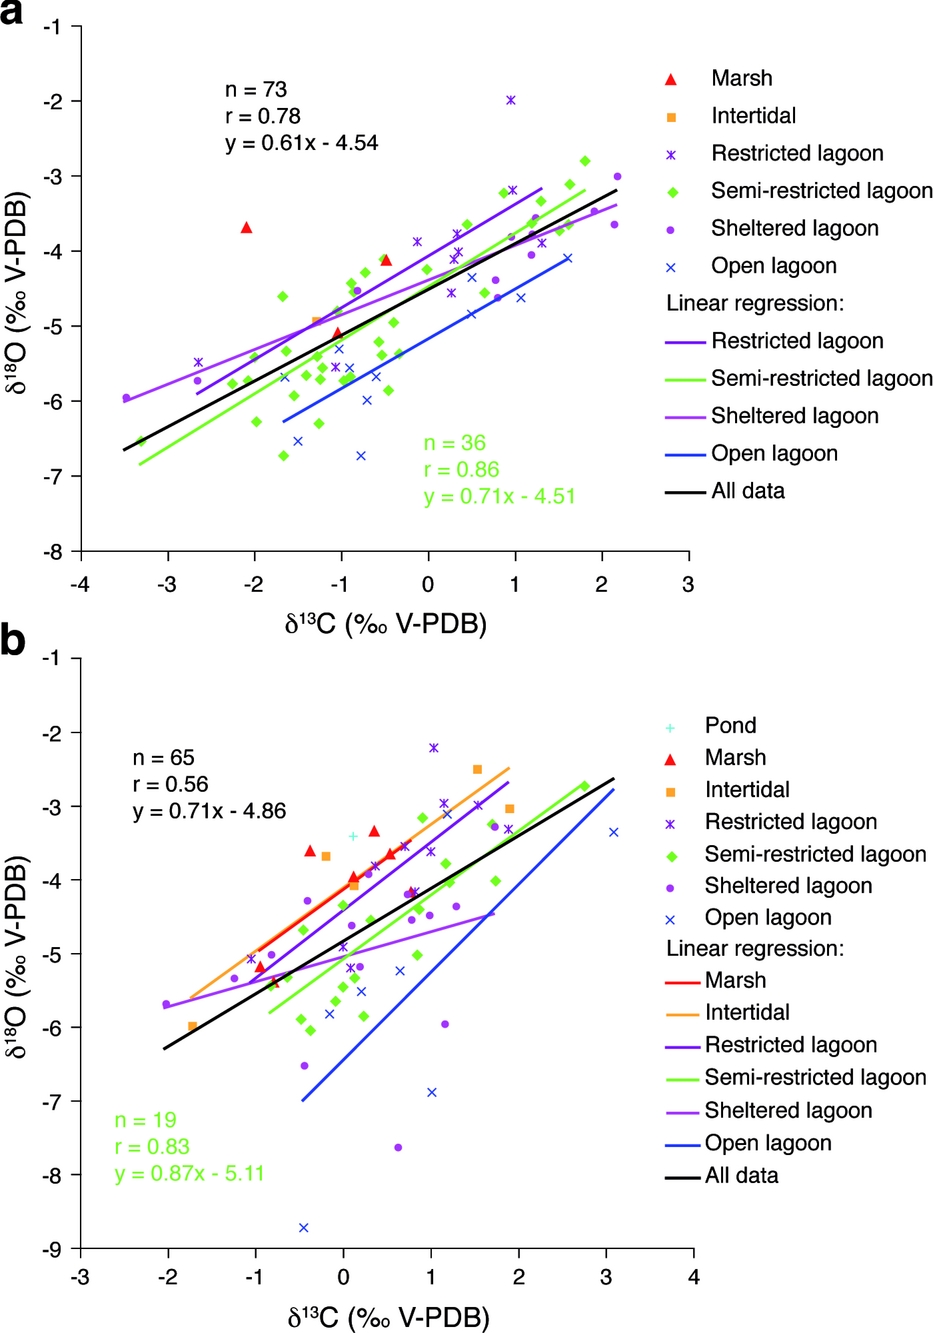
For both studied sections, (δ13C, δ18O) correlation lines, defined for each depositional environment, show similar slopes but different y intercepts (Fig. 10). These intercepts increase from more open-marine to more restricted environments (Fig. 11). This offset is interpreted as resulting from water mass ageing that would increase towards more restricted environments. Water mass ageing describes the isolation from vigorous exchange and mixing with the ocean surface waters (Immenhauser, Holmden & Patterson, Reference Immenhauser, Holmden, Patterson, Pratt and Holmden2007; Lloyd, Reference Lloyd1962). Broecker & Takahashi (Reference Broecker and Takahashi1966) and Morse et al. (Reference Morse, Millero, Thurmond, Brown and Ostlund1984) analysed several parameters of water samples from Grand Bahama Bank. They showed that increase in water mass ageing leads to increasing salinity.
Rank correlation between δ18O – (aenv × δ13C) values and depositional environments for the (a) Gorges du Pichoux and (b) Péry-Reuchenette sections. δ18O – (aenv × δ13C) is the y intercept, and aenv is the slope of the (δ13C, δ18O) correlation lines that are defined for each depositional environment and listed in Table 4. Area between dashed lines represents the 95 % confidence belt. Almost all y intercepts lie within this confidence belt, suggesting that the increase from more open-marine to more restricted environments is significant and depends on changes in palaeoenvironmental parameters. The Tau tests performed for the Gorges du Pichoux (τ = 0.307; p = 1.9 × 10⁻⁴) and Péry-Reuchenette (τ = 0.325; p = 1.5 × 10⁻⁴) sections confirm that δ18O values strongly depend on depositional environments.

The facies model devised by Colombié (Reference Colombié2002) and Colombié & Strasser (Reference Colombié and Strasser2005) for the Kimmeridgian of the Swiss Jura implies that salinity increased from more open-marine to more restricted, hypersaline environments. In the more proximal Gorges du Pichoux section, δ18O, Sr and Na are interrelated variables (Figs 7, 12). They all depend on salinity (Fritz & Katz, Reference Fritz and Katz1972; Jaffrezo & Renard, Reference Jaffrezo, Renard, Poignant and Deloffre1979; Land & Hoops, Reference Land and Hoops1973; Veizer, Reference Veizer, Arthur, Anderson, Veizer and Land1983). In this section, decrease in δ18O during maximum-flooding conditions can thus be explained by normal salinity in an open-marine environment, when compared to higher salinity in more restricted conditions. In the Péry-Reuchenette section, however, δ18O and Sr are two independent variables (Fig. 8). Therefore, decreasing salinity alone cannot explain decreasing δ18O values during MFD in the Kimmeridgian of the Swiss Jura.
(Sr, Na) scatter diagram for the Gorges du Pichoux section. The correlation between Na and Sr contents may be due to a control by salinity.
Broecker & Takahashi (Reference Broecker and Takahashi1966) and Morse et al. (Reference Morse, Millero, Thurmond, Brown and Ostlund1984) also indicated that the mean rate of carbonate precipitation decreases with increasing water mass ageing because the waters in the region of slower carbonate precipitation are substantially less supersaturated than in areas with a high precipitation rate. In the Kimmeridgian of the Swiss Jura, small-scale sequences took 100 ka to form (Colombié, Reference Colombié2002; Colombié & Strasser, Reference Colombié and Strasser2003, Reference Colombié and Strasser2005). Changes in their thickness reflect variations in carbonate production and accumulation rates. The second and third large-scale MFD in the Gorges du Pichoux section correspond to increasing carbonate production and accumulation rates (Fig. 13). This increase in carbonate production and accumulation rates, which is due to an opening of the system, a better connection with the open ocean, and thus to decreasing water mass ageing, systematically coincides with decreasing δ13C values (Fig. 13). Consequently, changes in δ13C values in the Kimmeridgian of the Swiss Jura probably reflect changes in carbonate production and accumulation rates that may result from variations in residence time of waters on the platform.
Changes in small-scale sequence thicknesses and δ13C values in the Gorges du Pichoux section. Small-scale sequences formed within 100 ka (Colombié, Reference Colombié2002; Colombié & Strasser, Reference Colombié and Strasser2005), and changes in their thicknesses reflect variations in carbonate production and accumulation rates. In the second and third large-scale MFD, negative shifts in δ13C values correlate with positive shifts in sequence thicknesses, suggesting that increasing carbonate production and accumulation rates on the platform led to 13C depletion in carbonates.
Residence time of water masses, increasing with environmental restriction, may explain why δ13C and δ18O mean values and standard deviations are larger in the Gorges du Pichoux section, which is the more proximal section, than in the Péry-Reuchenette section, which is the more distal section (Fig. 3).
While the TD of the second large-scale sequence in both studied sections and the TD of the third large-scale sequence in the Péry-Reuchenette section show a positive shift of δ13C values, the TD of the third large-scale sequence in the Gorges du Pichoux section is characterized by a negative shift of δ13C values (Fig. 3). This decrease in δ13C values coincides with an increase in carbonate production and accumulation rates (Fig. 13). This discrepancy can be explained by two separate water masses that covered the Jura platform at that time. Such compartmentalization may have been related to platform morphology, which was at least partly controlled by differential subsidence (Colombié, Reference Colombié2002). During highstand and lowstand conditions, compartmentalization was even more pronounced because water was generally shallower and the isolation of water bodies more likely. This explains the irregular pattern of the isotope curves in the corresponding deposits (Fig. 3).
6. Conclusions
Carbon- and oxygen-isotope analyses were performed on bulk shallow-marine carbonate samples coming from two Kimmeridgian sections located in the Swiss Jura. The comparison of the δ13C and δ18O records with the δ13C and δ18O records described from the same time interval in other basins, the use of trends in isotopic and trace-element data, as well as optical and cathodoluminescence petrography, and their combination with the sedimentological and sequence-stratigraphical interpretation of the two studied sections lead to the following conclusions:
(1) The general decrease in δ13C and δ18O values from the base to the top of the studied sections coincides with secular variations that are expressed on a more global scale. However, δ13C and δ18O values are lower than those measured from little-altered fossil shells, which reflect the general carbon- and oxygen-isotopic compositions of seawater at that time. Moreover, the Kimmeridgian carbonates of the shallow-water Jura platform show high-frequency changes in δ13C and δ18O values that are superimposed on the general trend.
(2) The generally more negative δ13C and δ18O values in the studied carbonates relative to those of the average Kimmeridgian ocean most probably result from a mix of diagenetic and local environmental effects.
(3) High-frequency changes in oxygen- and carbon-isotopic compositions might result from variations in local environmental conditions on the shallow platform, which were different from those occurring in the open ocean. Variations in δ13C and δ18O are interpreted to be due to changes in salinity and carbonate production and accumulation rates that result from changes in residence time of water on the platform. Platform morphology and sea-level changes modified water circulation patterns and created water masses with distinct isotopic signatures.
(4) In shallow-marine carbonates, carbon- and oxygen-isotope records can be used as a tool for long-distance stratigraphic correlations only under the condition that the origin of the isotopic signals is well understood. The correlation of the studied sections with the Kimmeridge Clay Formation of southern England has demonstrated that coeval peaks in the isotope curves can be inversed due to diagenetic alteration and different local environmental conditions.
Acknowledgements
We thank two anonymous referees for constructive criticism. Financial support for this study came from the Swiss National Science Foundation (project no. 20-56491.99 and 81FR-68839) and the French CNRS program ‘ECLIPSE II’. A great part of the analyses were performed during the Ph.D. and post-doctoral research of Claude Colombié. She thanks Steve Hesselbo, from the Department of Earth Sciences of the University of Oxford in England, who hosted her for a post-doctoral year, and for his constructive comments on the last version of this manuscript. Thanks go to Maureen Padden, to Julie Cartlidge, from the Department of Earth Sciences of the University of Oxford, and to François Martineau, from the UMR CNRS 5125 of the University of Lyon 1 in France, for carbon- and oxygen-isotope analyses. Laurent Emmanuel, Benoît Vincent, and the technical staff from the University of Dijon in France and from the Department of Earth Sciences of the University of Oxford are acknowledged for trace element analyses. Thanks to Gilles Escarguel, Marie-Anne Héran and Arnaud Brayard for helping with statistical analyses. The constructive comments provided by Nicolas Olivier, Fabienne Giraud, Giovanni Aloisi, John Reijmer and Adrian Immenhauser greatly helped to improve an earlier version of this manuscript.


