Introduction
The main interest of satellite altimetry data over ice sheets is the construction of a very precise topography that allows us either to constrain ice-sheet flow models (Reference Rémy and MinsterRémy and Minster, 1993; Reference Rémy and BrissetRémy and others, 1996) or to estimate the ice-cap mass balance (Reference ZwallyZwally, 1989; Reference WinghamWingham, 1995a). However, altimetric observations should also provide information about the surface and/or subsurface snow properties (Reference Ridley, Cudlip, McIntyre and RapleyRidley and Partington, 1988; Reference Rémy, Brossier and MinsterRémy and others, 1990,Reference Rémy, Féménias, Ledroit and Minster1995).
Considering the altimeter as a radar instrument, one can show, for example, that the intensity of radar back-scattering is controlled by surface microroughness, which is related to katabatic-wind intensity (Reference Rémy, Brossier and MinsterRémy and others, 1990), or that the waveform shape is affected by subsurface quantities such as grain-size, snow temperature, snow density (Reference Ridley, Cudlip, McIntyre and RapleyRidley and Partington, 1988; Reference Partington, Ridley, Rapley and ZwallyPartington and others, 1989) or internal Stratification (Reference Rott, Sturm and MillerRott and others, 1993; Reference Rémy, Féménias, Ledroit and MinsterRémy and others, 1995). Moreover, small-scale features, such as sastrugi or snow dunes, and medium-scale features such as undulations, play a role in the altimetric return waveforms, because they induce variations both on the illuminated radar footprint (of the order of 10 km × l0 km) and on the surface height distribution inside this footprint. These topographic effects are probably the cause of the strongest signal in altimetric waveform shape and intensity at a ~10km scale (Reference Martin, Zwally, Brenner and BindschadlerMartin and others, 1983; Reference Féménias, Rémy, Raizonville and MinisterFéménias and others, 1993; Reference WinghamWingham, 1995b).
The recovery of geophysical parameters is thus not trivial, because not only is the snowpack, a very complex dielectric medium, but also the waveform shape is subject to the effects mentioned above. To separate these different effects, a study of the spatial characteristics of altimeter signal behavior must be performed. Our contribution here has been guided by the following questions. What is the impact of small- and medium-scale topography on the altimetric signal? Do other geophysical mechanisms act on the waveform shape? What is the effect on the surface height recovery? Is the induced altimetric signal reproducible from one mission to another? What kind of geophysical information may the continental-scale signal provide?
In order to minimize the large-scale features and topographic effects, the Study was performed at Dome C, Terre Adélie, where the high ice thickness leads to a flat region with attenuated undulations (see Fig. 1). The Dome C region is also characterized by low winds (Reference PetréPetré, 1993).
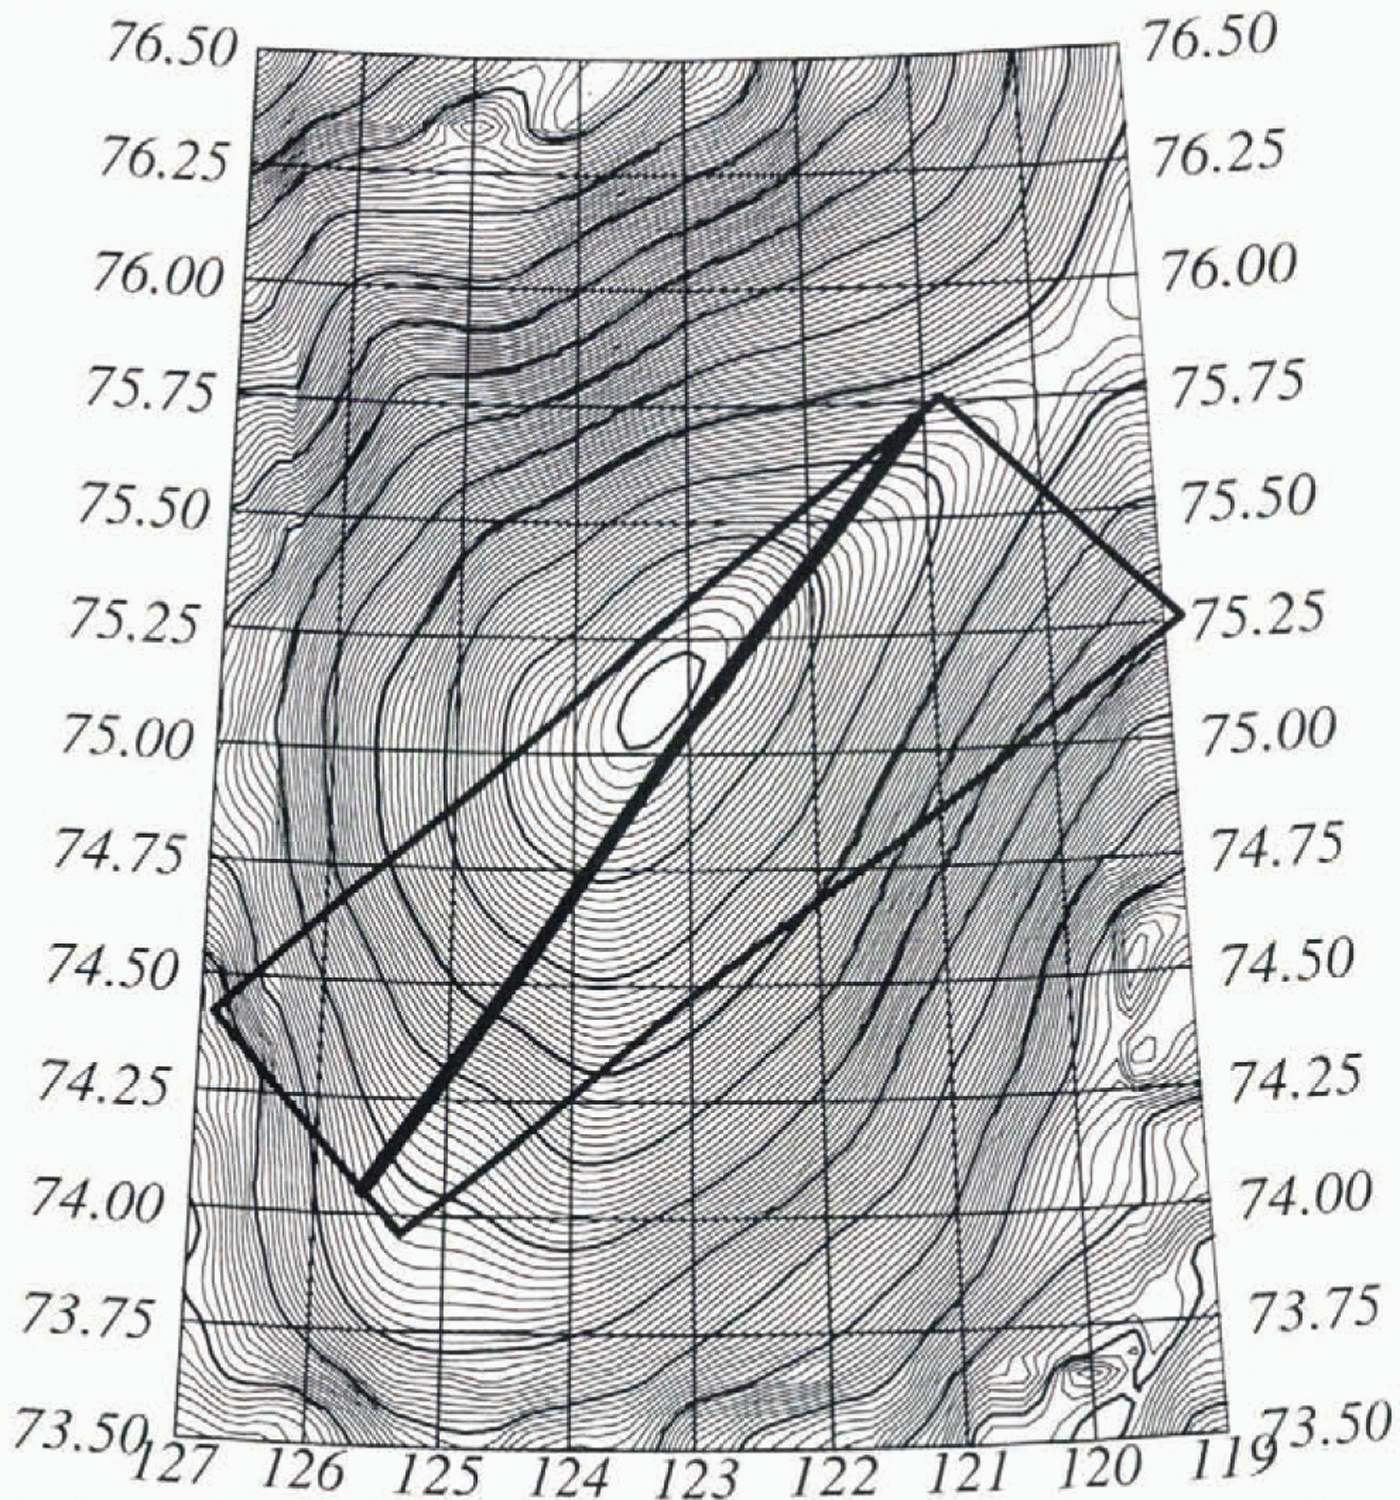
Topographic map of the Dome C region, Terre Adélie, Antarctica. The map was constructed by inverse method, using ERS-1 35d repeat-cycle retracked data. Isolines are each meter, and bold isolines are each 10m. The frame of the SPOT images and an ERS-1 track are superimposed.

ERS-1 European remote-sensing satellite data were analyzed along a 250 km track. We developed and used a waveform simulator in order to understand the different physical mechanisms. We also used four consecutive SPOT (Satellite pour l’observation de la terre) images as terrain truth, in order to detect sastrugi fields or change in snowpack nature and to compare these visual observations with the altimetric signal. This comparison helps us to better understand the influence of the observed surface features on radar echoes. After this verification at Dome C, a larger area was investigated to study the continental-scale behavior of the ERS-1 altimetric signal.
1. Altimetric Observations
1.1. Situation
For the first time, the ERS-1 altimeter provides observations at high-latitude regions (82°). Figure 1shows the topographic map of the Dome C region from ERS-1 data. Our analyzed satellite track and the region of SPOT coverage are superimposed. We used the WAP (waveform altimeter product) data of the 35 d repeat orbit delivered by the UK-PAF (United Kingdom Processing and Archiving Facility).
The altimetric height is deduced from a retracking technique (fitting process), as explained in Reference Féménias, Rémy, Raizonville and MinisterFéménias and others (1993)and Reference LegrésyLegrésy (1995). The precise orbit from the Deutsch Processing and Archiving Facilities is used. In order to reduce the residual height errors (retracking, orbit and propagation of the radar wave in the atmosphere), we used a total inversion technique (see Reference Rémy, Mazzega, Ноurу, Brossier and MinsterRémy and others, 1989; Reference Brisset and RémyBrissct and Rémy, 1996) in which the signal and errors are separated using their covariance properties. The a posteriori precision of the topography is within 1m.
1.2. Waveform description
The retracking technique allows us to estimate four parameters, as shown in Figure 2:
Waveform parameters description, σ° is the backscattering coefficient related to the waveform integral (in dB). Tr is the half leading width, expressed in gates. Fl is the trailing-edge slope in a logarithmic scale (in Np/gate). t0is the altimetric impact measurement expressed in gates (1gate = 3125 ns or 47 cm in height). The corresponding kilometer scale of the temporal footprint evolution is also given.
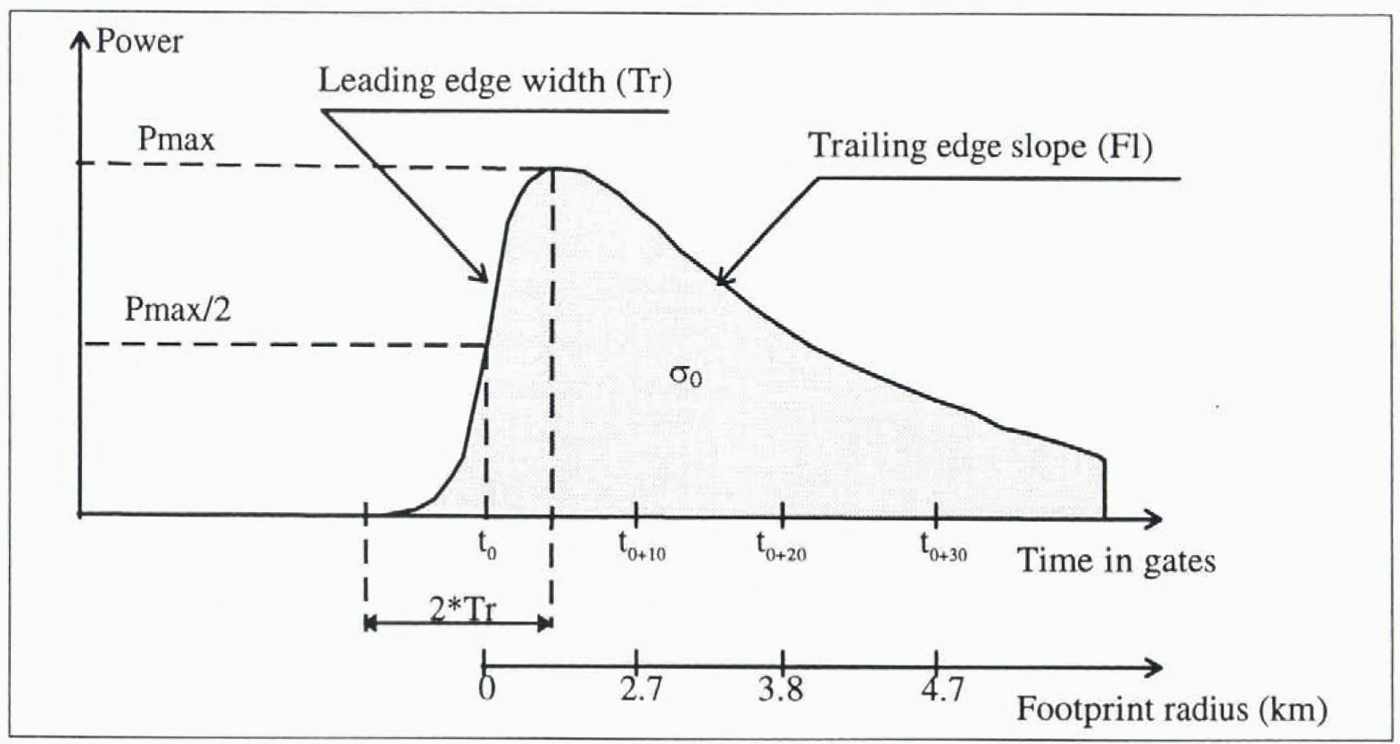
The total energy return, related to the backscattering coefficient σ°(expressed in dB). If calculaled on the whole waveform, this represents the energy received from the footprint (e.g. a 5–10 km scale; see Fig. 2).The total energy returned is corrected for the shift of the waveform inside the temporal-acquisition window due to tracking error (Reference Rémy, Brossier and MinsterRémy and others, 1990).
The half leading-edge width, named Tr (expressed in altimetric gates, e.g. 47 cm for ocean mode), which is obtained by fitting the error function (erf). This corresponds to the first part of the impact of the radar wave on the ground surface (e.g. 1 km scale).
The trailing-edge slope, named Fl (expressed in 10−Np/ gate), which is obtained by a linear regression of the end of the waveform on a logarithmic scale (from the maximum amplitude gate to the 63rd gate). This corresponds to whole altimeter footprint scale.
Two different heights are extracted: the first one is given by the position of the middle of the leading edge, and the second one by the position of the first echo (by adding the half leading-edge width to the first height).
1.3. ERS-1 data profile
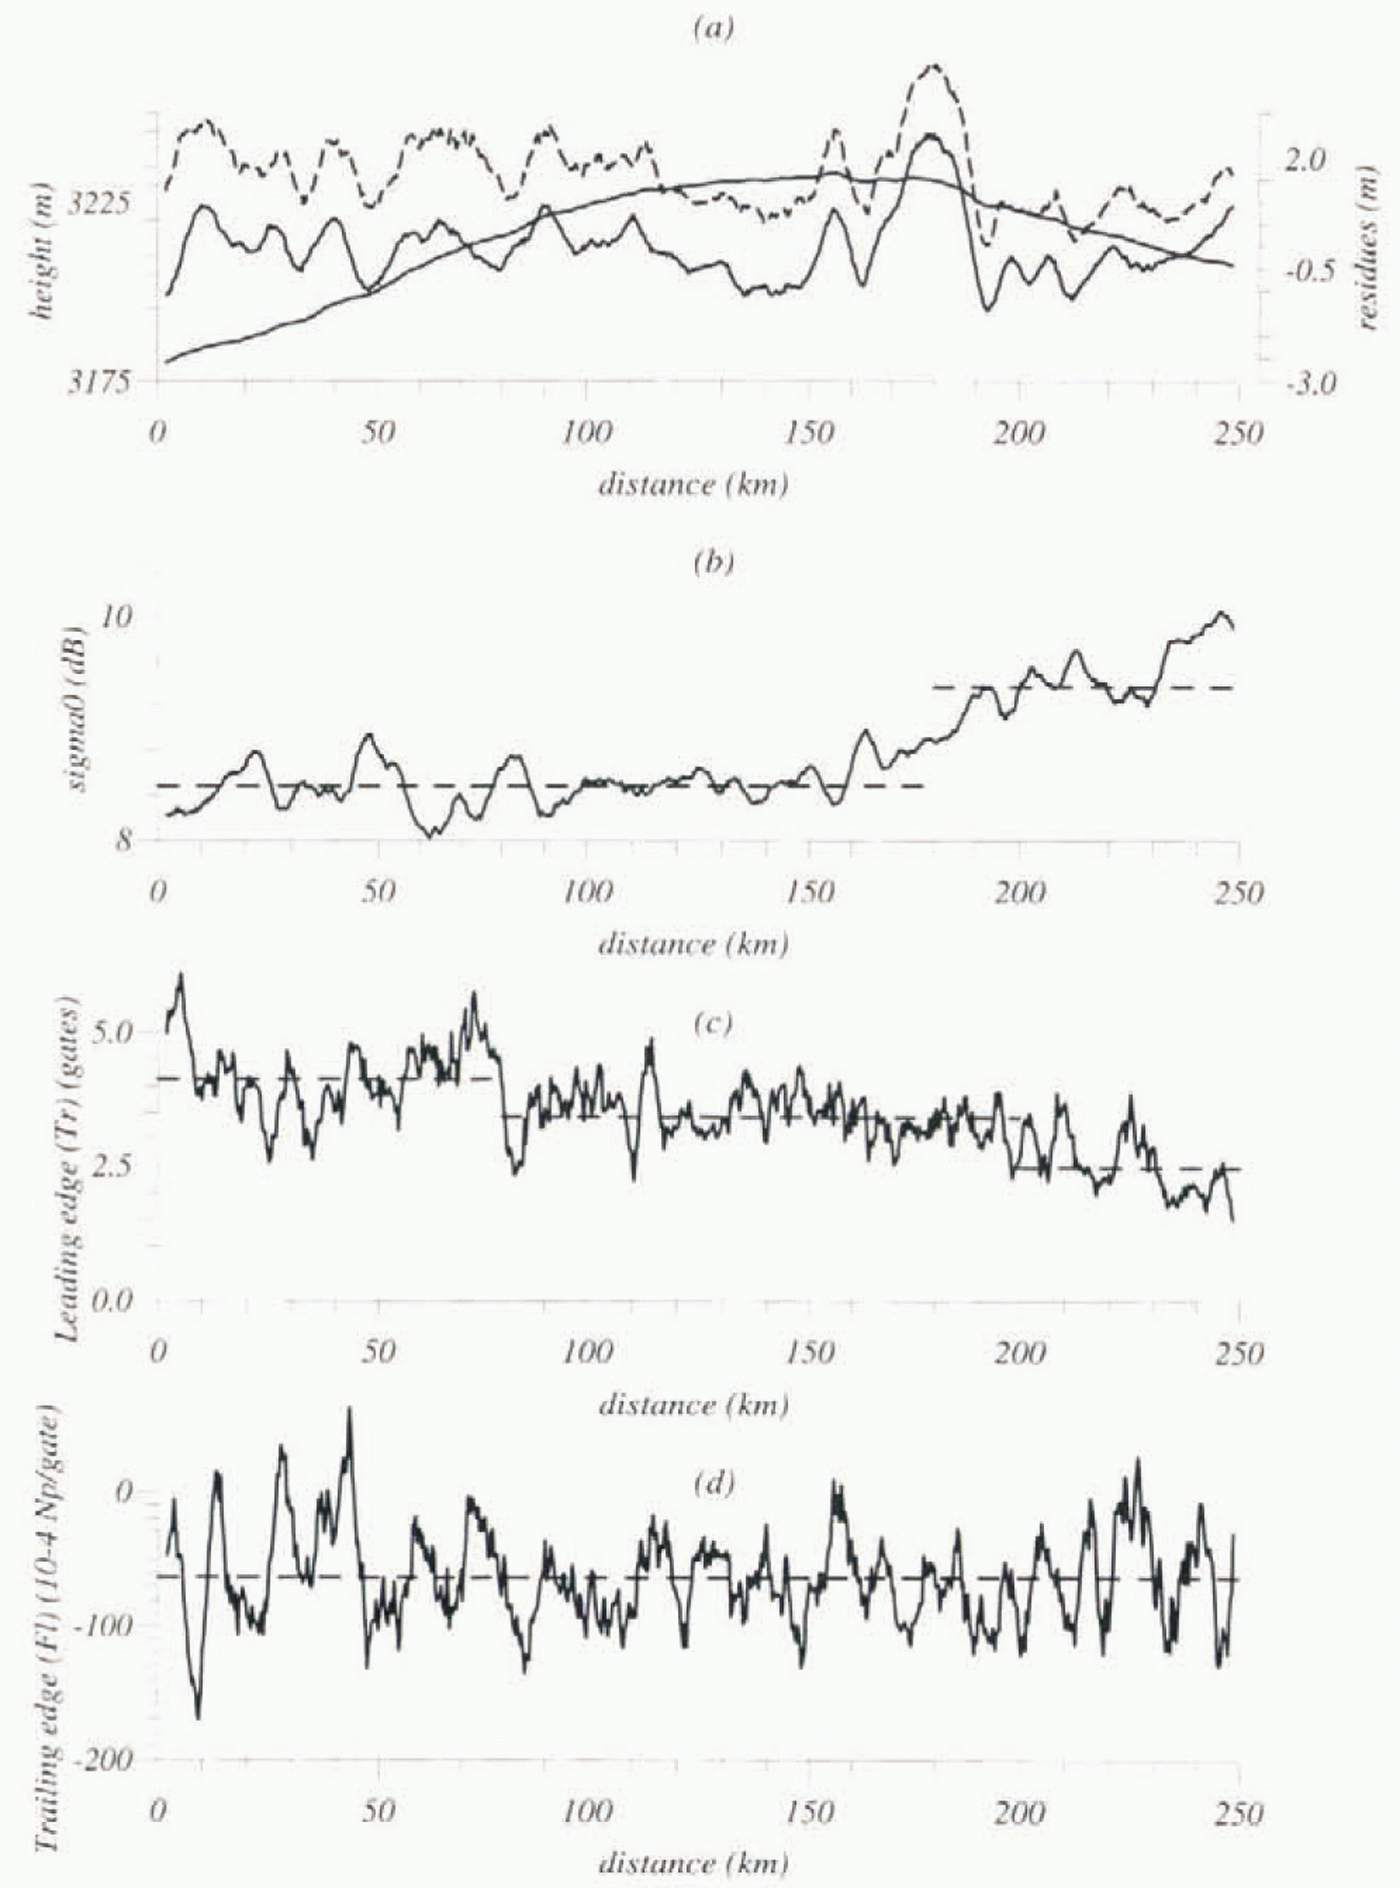
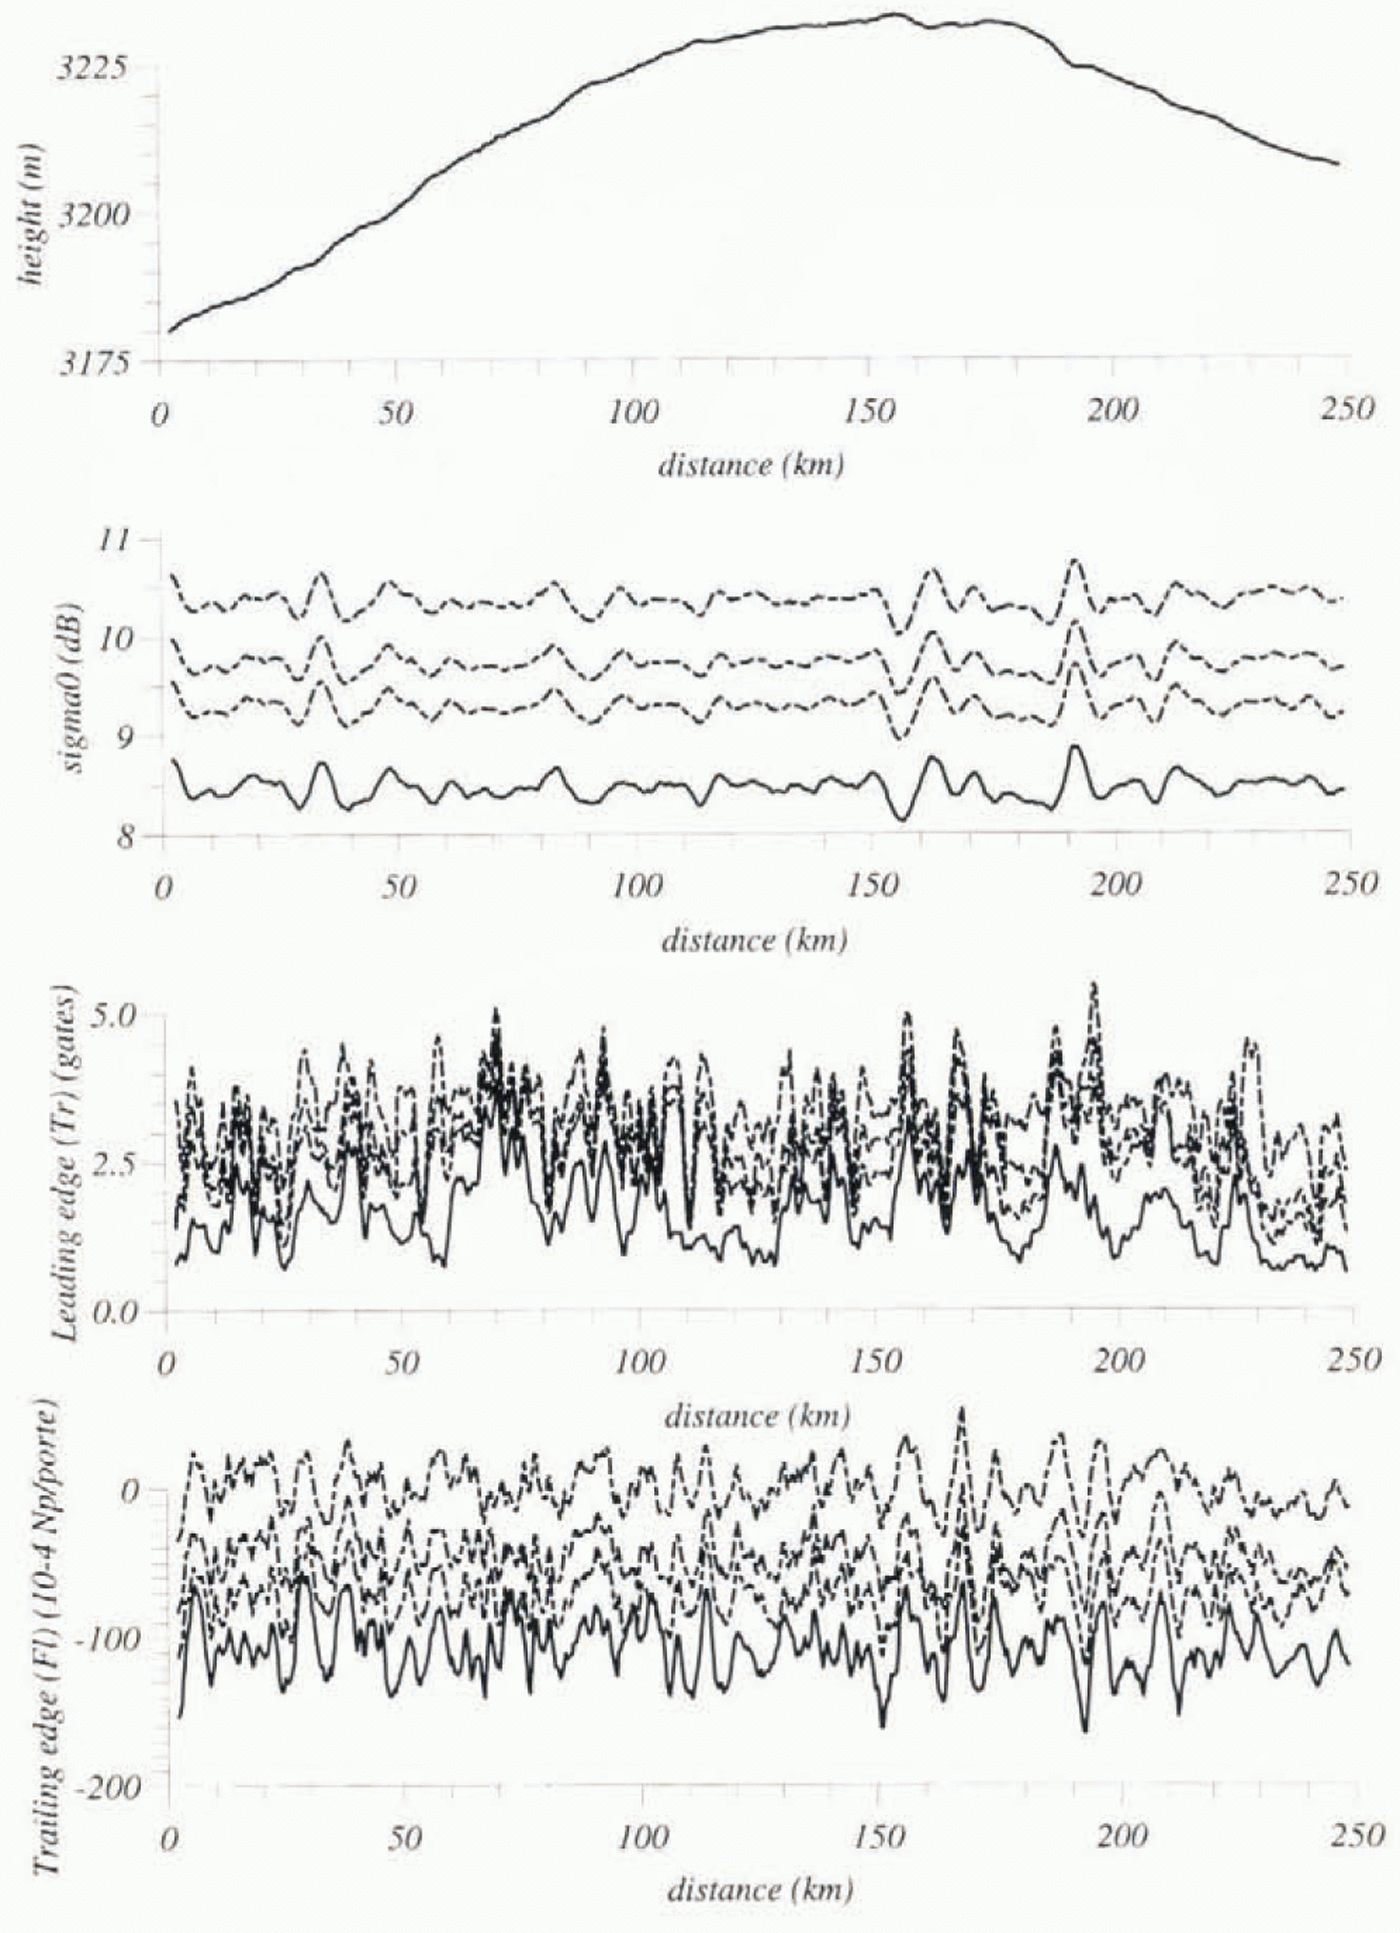
The height profile along track 5056 (marked in Figure 1) is displayed in Figure 3. Panel a shows the height profile, superimposed on the two topography residuals obtained by subtracting a large-scale polynomial form); panels b-d show the three waveform parameters, σ°, Tr and Fl respectively. The two residual topographies in Figure 3acorrespond to the two different heights defined before. The “first impact” topography has larger amplitude than the “first echo”, and is noisier. In general, looking for the middle of the leading edge smooths the topography at the impact footprint scale, so some small-scale features may disappear. Note, however, that some small features which were not visible on the “first echo” topography remain on this topography (see km 130 or 205). The rms of the topographic residuals is 1m. Despite this very smooth topography, the three waveform parameters shown in Figure 3b-d are highly noisy at a 10 km scale. As suggested by the comparison between the three profiles, most of the medium-scale features vary together: see km 50, 70, 85, where local maxima in σ°correspond to minima in Fl and Tr.
Different parameters’ profiles along the track: (a) the height profile and two types of residues, one corresponding to the half-leading-edge impact (solid line), the other corresponding to the “first impact echo” (dashed line); (b) the backscaterring coefficient profile; (с) the leading-edge parameter; (d) the trailing-edge slope expressed in 10−1Np/gate, all with local mean values (dashed).

However, this remark does not apply to other locations, for example, the beginning of the profile, where there is higher noise level. A more detailed analysis can be made by comparing real and simulated profiles, as in section 2.4.
The average value of Tr is 3.7 gates, with a rms of 1.9 gates. The average value of Fl is −63.5 × 10 −4Np/gate, and the rms is 108 × −4Np/gate.
A large-scale signal is also observed in Figure 3; the mean leading-edge value for the first 80km is 1–1.5 gates greater than that for the end of the track, while σ°shows a large-scale trend, with an increase of 1.5 dB from the beginning to the end of the track. The rms of the residual signal is 0.5 dB. Note that the trailing edge shows no significant large-scale variation.
1.4. Mechanisms acting on waveform shape
At the scales studied here, most of the waveform shape and intensity variations are probably caused by small- and medium-scale topographic signals. Several mechanisms may affect the radar echo.
First, the radar waveform shape is very sensitive to the local Surface slope, because of the slope error: the impact of the radar wave does not occur at the nadir where the antenna gain is maximal, but is shifted to an upslope point, nearest to the satellite, where the energy emitted and then received by the antenna is diminished. If the surface slope is α, the impacl occurs at a distance hα(Reference Brenner, Bindschadler, Thomas and ZwallyBrenner and others, 1983: Reference Rémy, Mazzega, Ноurу, Brossier and MinsterRémy and others, 1989), where his the satellite height, and the energy received from the surface will be diminished by a factor exp(−Gsin2α) (Reference BrownBrown, 1977) where Gis the antenna gain (G= 11280 for ERS-1). This will then affect the shape and intensity of the waveform.
Secondly, waveform shape is also very sensitive to the curvature of the surface due to the presence of undulations because of the change in the temporal evolution of the surface illuminated by each individual echo. The signal is focused when the impact occurs in a positive (concave) curvature, while it is dispersed on a negative (convex) curvature. This effect appears at the same wavelengths for both the topography and the waveform parameters.
Finally, there is also evidence of the presence of a volume echo signal. The mean value of the trailing-edge parameter is higher, and the leading edge is lengthened, in comparison to the reference values (−121 × 10−4Np/gate for Fl, including earth curvature, and 1–2 gates for Tr) in this smooth region where sastrugis are reported to be 30 cm high (Reference VincentVincent, 1994).
2. Waveform Simulation and Altimetric Signal
2.1. Altimeter simulation
We used a waveform simulation to investigate the phenomena acting on the altimetric signal and to test their effect on the waveform shape.
The waveform simulator is a simplified version of the one developed by Reference Féménias, Rémy, Raizonville and MinisterFéménias and others (1993); the surface is digitized on a 15 m × 15 m regular grid, larger than the footprint of the whole waveform in order to avoid ambiguity at the boundary conditions (in the presence of slope, the footprint is displaced upslope of the nadir and it is expanded in the presence of macroroughness). The time of arrival of the backscattered signal from each illuminated point is calculated along with the distance of this point to the satellite, taking into account its position inside the footprint and local topography. Earth curvature, large-scale topography, undulations or sastrugis can thus be taken into account.
Each point contribution is weighted by the antenna gain pattern or local incidence angle. It is also possible to simulate volume echo, by adding attenuated echoes, shifted in time.
2.2. Topography effects
In order to model the effect of the actual topography on the backscattered signal, we introduced the observed along-track altimetric profile, while the across-track direction topographic signal was extrapolated from the topographic map. Because of the slope error, the profile as seen by the satellite is not the true one. Three methods of correcting for this effect are found in the literature. It is possible to correct the altitude at the nadir, by removing hα2/2from the topography seen by the altimeter (the so-called direct method; Reference Brenner, Bindschadler, Thomas and ZwallyBrenner and others, 1983) or to correct both the position öf the impact point (shifted of hαand the height (by adding hα2/2,the relocation method; Reference Brenner, Bindschadler, Thomas and ZwallyBrenner and others, 1983). One can also demonstrate that between the nadir and impact points, an intermediate point exists where the measured height is the true one (intermediate method; Reference Rémy, Mazzega, Ноurу, Brossier and MinsterRémy and others, 1989). A good recovery of the leading edge needs a very precise modeling of the interaction between radar wave and topography at the impact (Reference Féménias, Rémy, Raizonville and MinisterFéménias and others, 1993). As a consequence, the best method of Correcting for slope error, in the present case, is the relocation method, because it conserves the small-wavelength topographic features near the impact point. Finally, we used a linear interpolation function in order to get correct position and height on a regularly spaced grid (as suggested by Reference Brenner, Bindschadler, Thomas and ZwallyBrenner and others, 1983). Waveform simulation is also affected by slope error, so we can directly compare the observed altimetric profiles and the simulated one.
Simulation: the satellite track crosses a band of enhanced backscattering. The three simulated waveform parameter profiles are represented.

2.3. Surface and subsurface signals
2.3.1. Geophsical parameters estimation
The radar echo is constituted by reflection from the air/snow interface and also by internal reflection from subsurface layer interfaces. Inside the snow pack, the subsurface signal can be attenuated by losses by absorption, by scattering by ice grains, and by multiple reflections inside the snowpack. The subsurface signal consists either in scattering by ice grains (Reference Ridley, Cudlip, McIntyre and RapleyRidley and Partington, 1988) or in internal reflection by the subsurface snow layering due to density variations (Reference Rott, Sturm and MillerRott and others, 1993; Reference Rémy, Féménias, Ledroit and MinsterRémy and others, 1995). Using the Seasat scatterometer data above Antarctica, Reference Ledroit, Rémy and MinsterLedroit and others (1993)showed that the contribution of volume scattering by ice grains to the re-emitted signal can be neglected compared to surface and internal interface backscattering when the incidence angle is less than 10°, in the case of altimetry (note, however, that volume scattering by ice grains contributes to the extinction). Moreover, Reference Rémy, Féménias, Ledroit and MinsterRémy and others 1995showed that the internal layering effect is the dominant subsurface signal for any incidence angle in the case of altimetry.
Reference Jezek and AlleyJezek and Alley (1988)reported internal density variations of the order of 0.05 gcm−3each 5 cm at Dome C. They also reported penetration depth of the radar waves in the snowpack of 5–10cm for the present frequency (see also Reference Ulaby, Moore and FungUlaby and others, 1986), leading to an extinction coefficient of 0.1–0.2 m−1. Thus, the losses by absorption or ice-grain scattering and the internal interface backscatter must be taken into account in our analysis.
At the surface, it has been demonstrated that the variations of the surface backscattering coefficient on a rough surface can be expressed (Reference Fung and EomFung and Eom, 1982) by:
where Rs2is the Fresnel coefficient at the air/snow interface and f(s)is linked to the surface slope distribution.
The Fresnel coefficient R2at an interface between two differnt media is given by:

The snow dielectric constant ∈depends only on the snowpack density ρ(Reference Tiuri, Sihvola, Nyfors and HallikainenTiuri and others, 1984):
This yields to ∈= 1.68 for a snow density of 0.35 gcm−3, and ∈= 1.792 for a snow density of 0.4 gcm −3. The surface Fresnel coefficient is then Rs2= 0.0166 (∈1= 1, ∈2= 1.68), leading to a σsof 0.0166f(s).
The subsurface signal may be modeled as the contribution of each layer shifted in time and attenuated by both absorption and scattering by ice grains. The reflections occur at each interface and can also be modeled by Equation (1)where Rs2should be replaced by Rint2corresponding to the internal density variations.The internal reflection coefficient is then Rint2= 2.567 × 10 −4each 5cm. Assuming that internal layers have the same mirroroughness characteristics as the surface (see Reference AlleyAlley, 1988), each layer (i)will contribute as:

Here, I0is the incident flux. kvis linked to losses by absorption and scattering by ice grains, xe, is the extinction coefficient linked to all listed effects (2(kv+ Rint2)), and δ1= 5 cm.
Each altimetric gate corresponds to с’τ= 30 cm inside the snowpack τ =3 ns, and inside a snowpack of density 0.35 gcm−3, the light speed is c’ = ncwhere nis the refraction index inside the snowpack), covering six of the observed layers. The integration gives a λjcontribution for layer (j)of δ2= 30 cm thickness:
with

where σvis the equivalent backscattering of a 30 cm layer. σvis then 0.00147f(s)for each 30cm layer. σv/σsis then equal to 0.09, i.e. mostly sensitive to internal density variations. Note that the contribution of extinction is found to be negligible in the integration.
Values of σv/σs~ 0.1 and xe~ 0.1 to 0.2 m−1seem to be very sensitive to surface and subsurface snow properties, principally to the number of internal layers per meter. However, these values remain representative of a realistic case and will be used hereafter.
2.3.2. Computation
One can also take account of the scattering distribution function, due to surface macroroughness, such as sastrugis (named pdf by Reference BrownBrown (1977)), by convolution of the smooth surface response P2and of the pdf given by:

where Psis the surface response to the incident radar impulse, nis the limit of definition of the pdf. σsis the surface backscattering coefficient, kis the arrival gate, and Pis the flat-surface impulse response.
The subsurface signal can be seen as the addition of shifted and attenuated echoes (Reference Jezek and AlleyJezek and Alley, 1988). The total energy emitted by snowpack heterogeneities is proportional to the illuminated volume, which is proportional to the illuminated surface (the maximum incidence angle between the radar wave and the surface is very small, ~1°). The received energy is also weighted by the antenna gain which acts similarly on the surface part or volume part, file calculation scheme is then:

where Pvis the volume signal, xeis the extinction coefficient of the medium, and σv/σsis the proportion of energy either scattered or reflected by one layer of 0.3 m thickness. This calculation scheme corresponds to a convolution. In fact, the whole signal can be seen as a convolution between the surface echo and a volume function as:

2.4. Simulation along a track
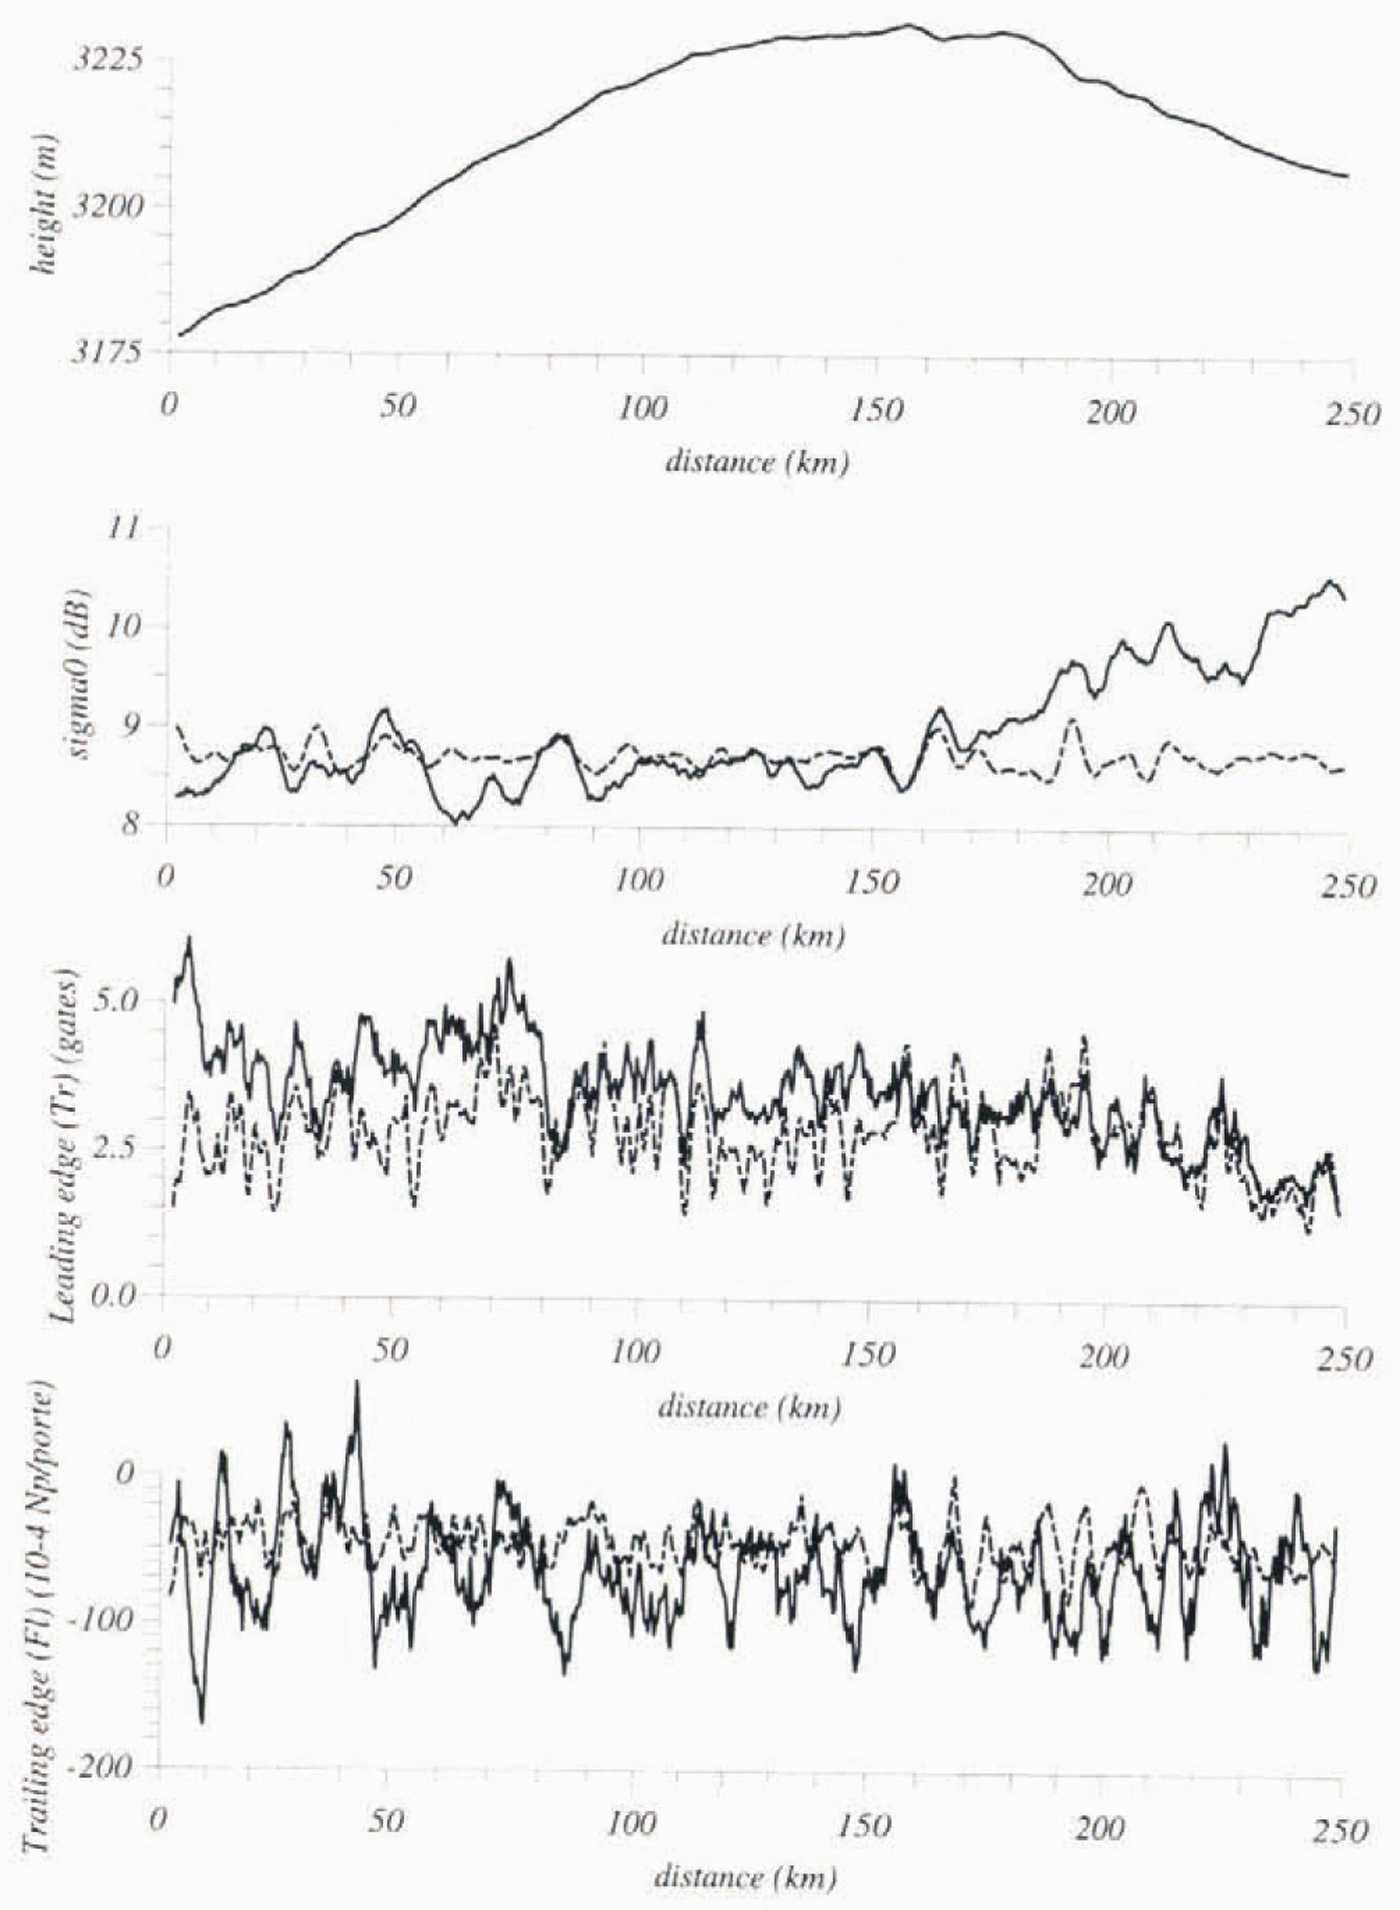
The three simulated waveform parameters are superimposed on the observed ones in Figure 4, for the track shown on Figure 1.
The simulated parameters, taking account of topographic effects and volume echo (σv/σs= 0.1 and xe= 0.15 m−1(dashed line), and Note that for σ° the simulation reproduces most of the peaks, but not the large-scale evolution. The leading edge is very well reproduced; there is also a large-scale signal not reproduced. The trailing-edge variations are not well reproduced in either amplitude or position.

The simulated leading-edge variations are in very good agreement, in both phase and amplitude, with the observed one (see km 10, 90, 110–140, 160, to the end of the profile). However, the ~50km scale amplitude variations of this parameter are not reproduced in the simulation.
The backscattering coefficient is in good agreement, except for the large-scale signal at the end of the track, which is clearly not due to topography features. Most of the observed variations are effectively reproduced (e.g. km 150). However, at the beginning of the profile, the simulation does not restore the whole amplitude on a 20 km distance scale.
The trailing-edge slope is not really in good agreement. Only a few peaks are well scaled (km 30 or 160), some are out of phase (km 210) and most have a diminished amplitude.
There are several reasons for the poor recovery of both the σ°and Fl amplitude variations. First, the across-track signal is poorly known, and thus information is missing for the simulation. Furthermore, the backscattering coefficient depends on the incidence angle. This dependence is very difficult to model because it is sensitive to the microroughness distribution (Reference Ulaby, Moore and FungUlaby and others, 1986) which is not known. This microroughness effect on σ°and Fl enhances the surface curvature effect (the average incidence angle is diminished in a hollow where σ°is maximum and is conversely increased on a bump where σ°is small). Finally, snow properties may exhibit small-scale variations linked with undulations: for instance, Reference Seko, Furukawa, Nishio and WatanabeSeko and others (1993)showed that the accumulation rate is greater in hollows than in bumps. Ihe trailing-edge calculation is also highly noisy because the waveforms are noisy. As a reference, we computed a 300 km ocean track and found a mean of −124 × 10−4Np/gate with a rms of 95 × 10−4Np/gate, which is similar to the present observations above the ice sheet.
3. Visible Observations and Altimetric Signal
The altimetric data show a strong signal (typically 1dB in σ°, several gates in leading edge and several 10−3Np/gate in trailing edge) at small spatial scales (from several to 20km). This provides a good opportunity to use “visible” observation such as SPOT images or in situ observations of this region and to compare it to the altimetric signal.
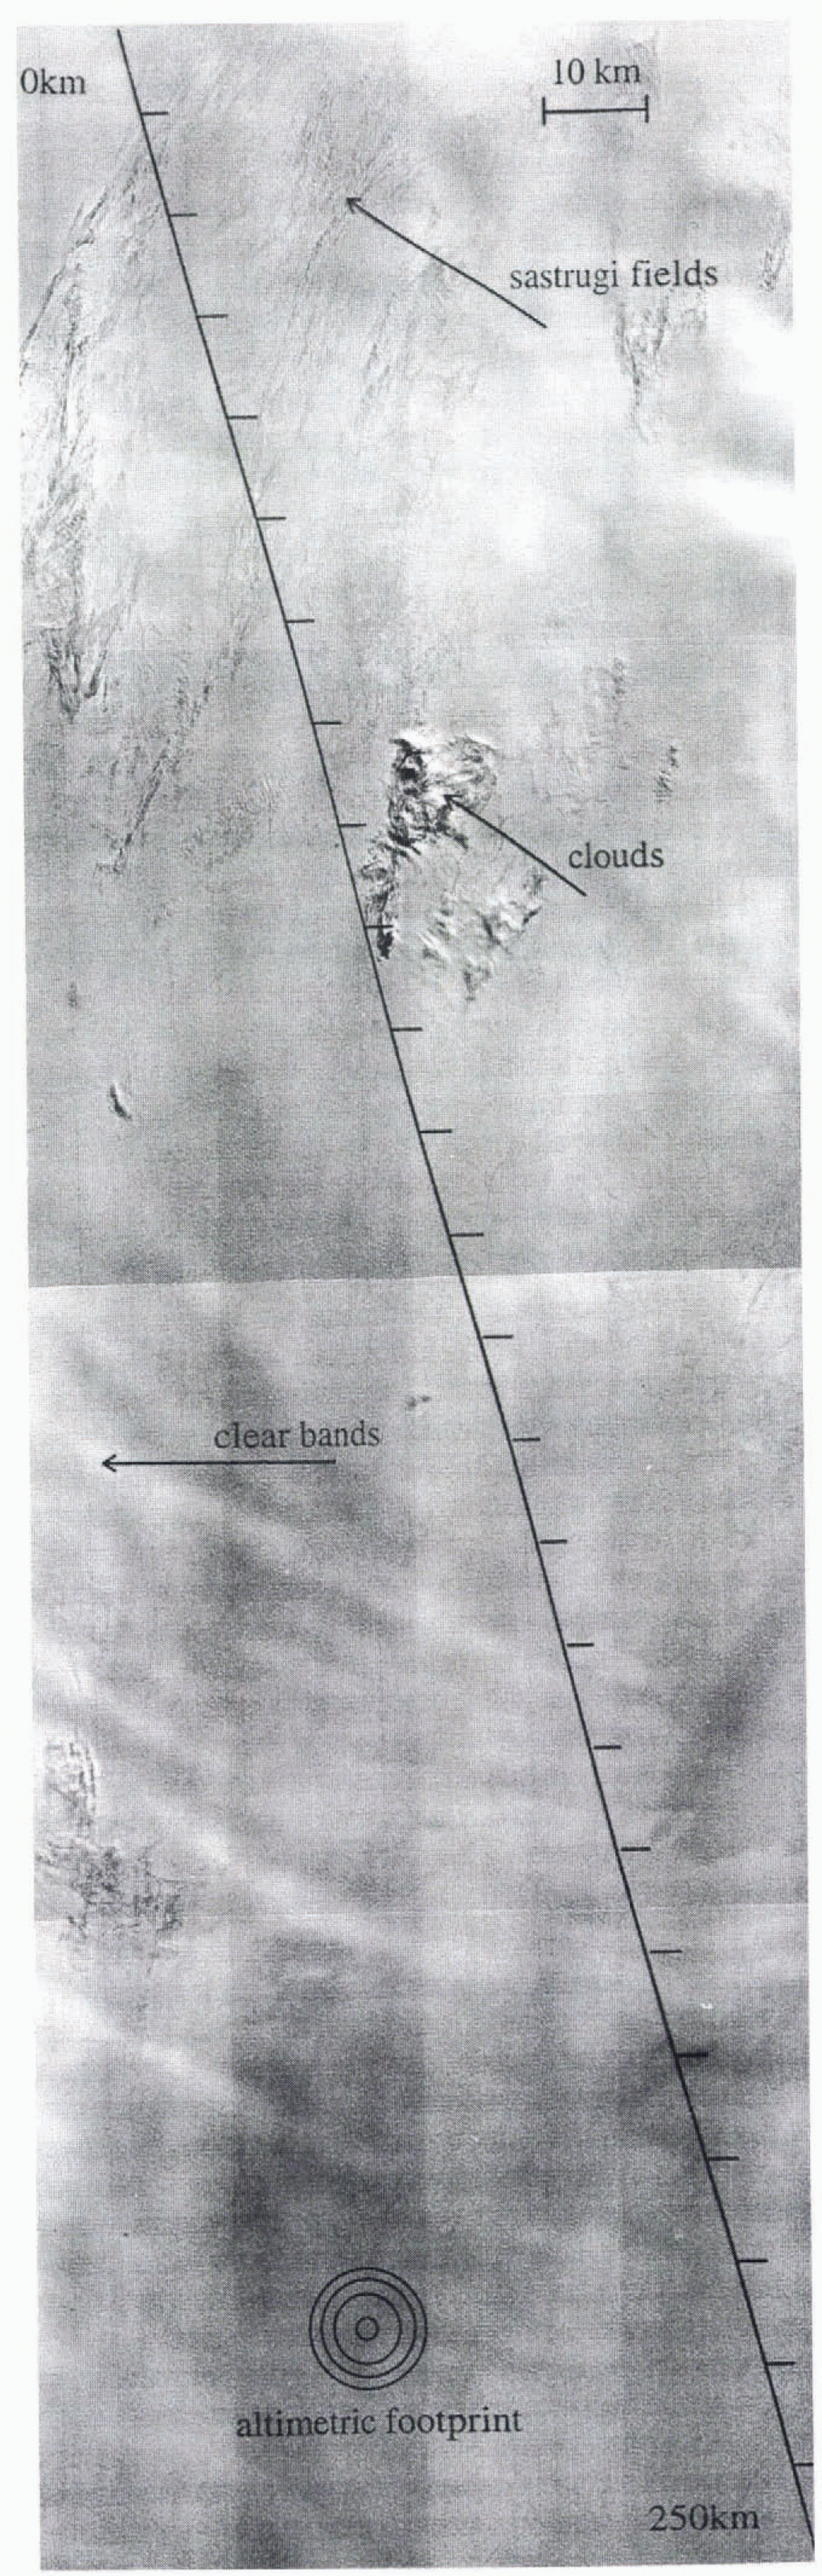
3.1. SPOT images
The four consecutive SPOT images of this area (Fig. 5) show heterogeneities on the radar footprint scale, such as sastrugis, and medium- to large-scale apparent reflectance changes. The radar footprint is shown on the SPOT images at the corresponding scale. The altimeter track is superimposed with the distance scale.
SPOT image of the region, constructed with four consecutive images. The ERS-1 studied track is represented with a kilometric scale. The footprint of the altimeter radar wave is represented in the lower left corner; the central cirle corresponds to the first impact. The apparent reflectance of the surface is coded in 23.NC (number of counts). They revealed the presence of small-scale heterogeneities. The large-scale signal is principally caused by spatial variations of sun elevation. One can see sastrugi fields at the top, clear spots spread across the images, and strong albedo-change area. The central detail is a cloud.

We used the following system of equations to interpret the SPOT images:
The intensity of the apparent reflection is coded on a linear scale of numerical counts (NC), linearly linked with the irradianсе of the satellite (Lsat) which is given by:

where θiis the solar incidence angle on the surface, ρappis the apparent reflectance of the surface, E0is the incident solar radiation at the top of the atmosphere, and Dthe losses throughout the atmosphere.
The observed variations are then relative (Reference Bourdelles and FilyBourdelles and Fily, 1993), and are given by:

Variations of observed NC are then due either to local incidence angle or to albedo changes. One NC variation yields a 0.5% change in albedo at 192 NC, which is the mean value of the images (values vary from 182 to 203), while a 1 NC variation yields a 0.67° change in local slope (or incidence angle) at 24°, which is approximately the sun elevation at the snapshot time.
Note that the images are not corrected for the spatial variation of sun elevation throughout the images, which is the principal signal (10 NC). Nor are they corrected for problems in the data that make four stripes in four sections. However, these processed SPOT images reveal three different types of observed structures that can be analyzed in relation to our altimetric signal.
3.2. Roughness
One can observe fields of sastrugis which are irregularly spread, particularly at the top of the image (km 25–80). Assuming a constant reflection coefficient and a “factory roof” structure, we calculated that they correspond to a slope of 1% on 10 pixels. This is equivalent to a structure 1 m high, 100 m wide and about 2 km long. These structures, which are not visible in situ, have already been observed by aerial observations (Reference Bromwich, Parish and ZormanBromwich and others, 1990).
The altimetric waveform leading-edge parameter shows great variability and a 1 gate increase in this region (see km 20–80, especially in the first 10 km, around km 40 and km 60–80 (Figs 3c and 5)), which effectively corresponds to the mean increase due to sastrugi fields. It also corresponds to the small values of σ°poorly recovered by the simulation. Finally, these sastrugi fields probably enhance the dependence of the backscattering on the incidence angle, and may explain the great amplitude of the σ°and Fl variations at the beginning of the profile.
3.3. Changes in brightness
Clear spots of strong brightness changes are also observed on SPOT images. For instance, a very clear albedo change occurs from km 175 to the end of the profile, and albedo changes of а few kilometers occur near km 160. Looking at Figures 3b and 5, one can observe that the enhancement of altimetric backscattering coefficient clearly corresponds to the large-scale change in brightness. Because of the radar footprint scale, the abrupt change is smoothed over 10–20 km (see Fig. 2). The other two waveform-shape parameters, Tr and Fl, are not clearly sensitive to these structures. These clear spots seem to be related to microroughness changes, because, first, only microroughness variations may explain such local albedo changes (Reference Choudhury and ChangChoudhury and Chang, 1981; Reference Bourdelles and FilyBourdelles and Fily, 1993), and, secondly, this signal affects only σ°, without changing the other waveform parameters. Only roughness changes may affect surface + volume signal without affecting σv/σs(Equation (5)). This is Confirmed by in situ measurements, which snow that these spots do not correspond to hard changes in snow properties but effectively correspond to abrupt changes in surface roughness personal communication from F. Candaudap and M. Fily, 1996).
3.4. Clear bands
Finally, we observed clear bands tens of km long and several km wide. The variations of the apparent reflectance (4–5 NC) yield slope Variations of ~ 1.2%, which are not in accordance with any surface feature seen by the altimeter.
This factor 10 of discordance in slope estimation cannot be due to error either in altimetric measurement or in Equation (9). A possible explanation is that, at this time of year (November), the elevation of the sun is so low that surface characteristics such as temperature are very sensitive to surface slope variations of a few percent personal communication from P. Reference PetréPetré, 1995).
It is also possible that some features in Figure 5result from obstruction by thin cirrus clouds and cloud shadows, but we have no independent measurements to confirm this hypothesis.
Another explanation is that real snow optical properties (snow grain-size, snowpack density or surface roughness: dρ/ρ~2.5%) are effectively related to undulation features, as demonstrated by Reference Seko, Furukawa, Nishio and WatanabeSeko and others (1993).
4. Applications and Discussion of Altimetric Measurement
4.1. Local change in backscattering coefficient, and effect on altimetric parameters
Observations suggest that sastrugi fields, or abrupt microroughness variations, or perhaps snow-property variations, create local backscattering variations. How do these backscattering variations affect the waveform shape?
We simulated the crossing of a band of different backscattering by the altimeter. The band is 2 km wide, the backscattering is enhanced by 1 dB, and the angle between satellite track and the band is 45° (see Fig. 6a).
As suggested by Figure 2, the last gates of the waveform are sensitive to the band 5 km before the intersection between the satellite track and the band. The trailing-edge slope then begins to rise until reaching −90 × 10 −4Np/gate, 5km before the intersection, and decreases to −150 × 10 −4Np/gate in the middle of the band (Fig. 6). The leading edge acts similarly but at a smaller scale with a smaller amplitude (0.25 gate). The σ°is of course enhanced, but only by a factor of 0.3 dB, corresponding to the weighting between both surface types in the footprint.
The effect is greater on the waveform shape than on the total received energy. This may partly explain the strong variations in Fl values. The height measurement is then only affected by a few centimeters. Reference Ridley, Cudlip, McIntyre and RapleyRidley and others (1989)have already shown that the crossing of a ridge in West Antarctica affects the altimetric waveform, but it is the first time that such effects have been found to play a role in the smooth interior of the continent.
4.2. Discussion on subsurface sensitivity
Figure 7shows the altimetric parameters’ evolution along the track shown in Figure 3, with respect to different volume configurations (according to section 2.3, σv/σs= 0.1, xe= 0.2, 0.15, 0.1). The effect of the subsurface signal is not the same for different parameters. Only the mean value of σ°or Fl is affected; no fluctuation due to the initial surface echo shape is visible. Thus, the presence of a small spatial-scale signal will not compromise the retrieval of geophysical quantities using σ°or F1.
Simulated parameters for different cases. The surface signal is drawn in solid line, and the three cases where the subsurface features are added to surface signal are drawn in dashed. The σv/σscoefficient is 0.1 for the three cases and the extinction varies from 0.2 to 0.15 down to 0.1. Note that the variations in σ° and trailing edge linearly depend on the volume signal, but the leading-edge changes are more complicated.

On the other hand, the subsurface effect on the leading edge is strongly dependent on the surface echo shape and introduces a kilometric-scale signal. The addition of the subsurface part induces a complex effect. For instance, at km 50 or 70, the leading edge is little affected by the variation of the subsurface signal, while at km 150 or around 200, the leading edge is enhanced by more than 2 gates, and produces fluctuations which were not present before. Except at the beginning of the profile, where the large spatial-scale feature is not recovered, the whole signal is then due to a complex combination between topography and penetration effects. Note that varying σvproduces comparable effects. This means that even in this smooth area, few gates of variations in the leading edge can result from these complex effects and have direct small-distance-scale impact on the height estimation. This is confirmed by analysis of the dual-frequency Topex altimeter above Greenland: the height difference between the C and Ku bands shows a strong small-scale signal (Reference Rémy, Legrésy, Bleuzen, Vincent and MinsterRémy and others, in press). As a consequence of this complex effect, the retrieval of surface and subsurface parameters should not be performed with the help of the beginning of the waveform, as is currently done (Reference Davis and MooreDavis and Moore, 1993; Reference Yi and BentleyYi and Bentley, 1994). For instance, Reference Féménias, Rémy, Raizonville and MinisterFéménias and others (1993)have shown that it is possible to have two similar wave forms with two different volume configurations. Alternatively, Reference LegrésyLegrésy (1995)shows that it is possible to have very different waveforms with the same volume characteristics, depending on local topography even by averaging many waveforms .
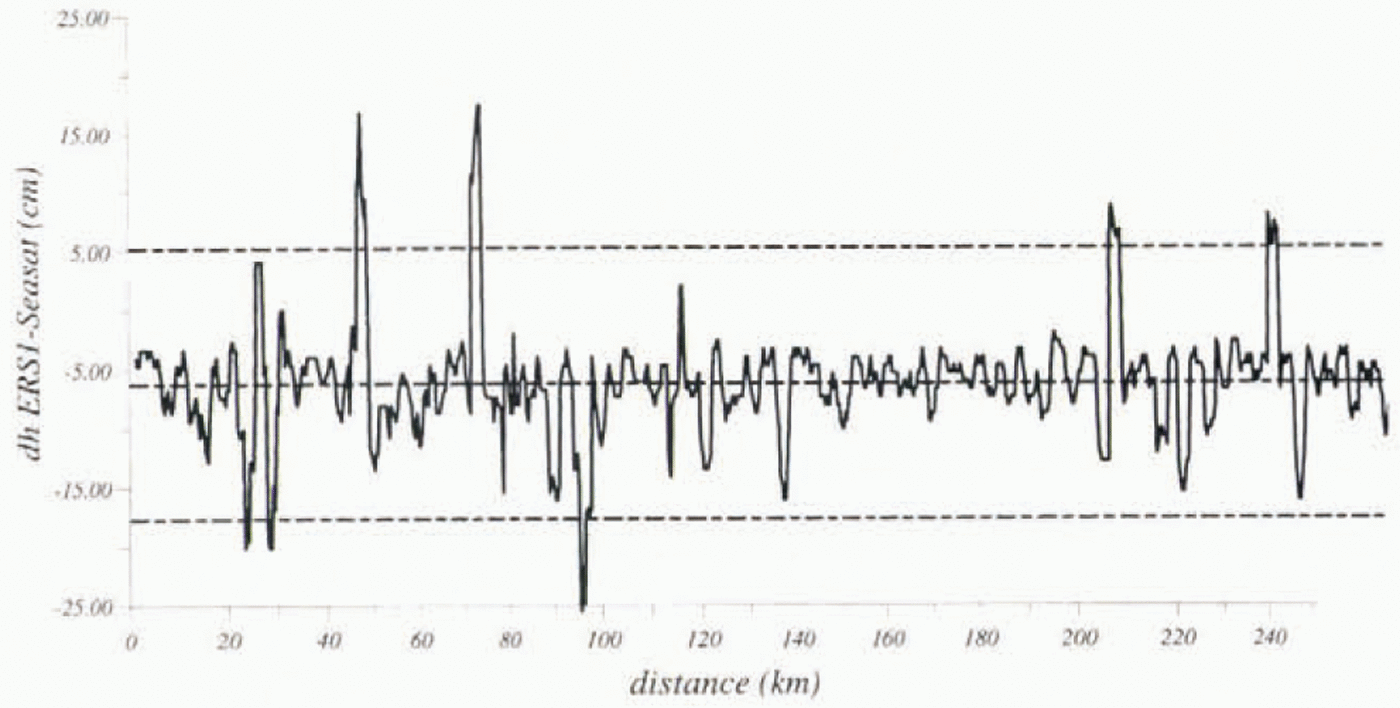
The combination between surface geometry and subsurface effect depends on the altimeter characteristics. We simulated the profile shown in Figure 3, as seen by both the Seasat and ERS-1 altimeters. The volume signal is characterized by xe= 0.15m−1and σv/σs= 0.1. Even with the weak differences between the two missions (antenna width of 1m for Seasat and 1.2 m for ERS-1, and altitudes of 800 km for Seasat and 780 km for ERS-1), an average height difference of 6.3 cm with a rms of 11.4cm is found (Fig. 8). This effect is similar if other retracking data such as WAP ones are used (Reference LegrésyLegrésy, 1995). The effect is small in this case, but particular care should be taken for other altimetric missions and other regions.
Height difference of the same profile seen by Seasat and ERS-1 altimeters. The difference between the two satellites is 20 km in altitude and 20 cm in antenna diameter. The simulation is performed wilh a volume signal characterized by σv//σs= 0.1 and xe= 0.15 m−1. In this smooth region, the simulated difference reaches 6.3 cm with a rms of 11.4 cm.

In summary, therefore, at a 50 km scale, the averaged σ°or Fl values seem to be characteristic of the geophysical processes, whereas the leading-edge signal shows a non-linear response which is more difficult to interpret.
5. Continental-Scale Behavior of Altimetric Signal
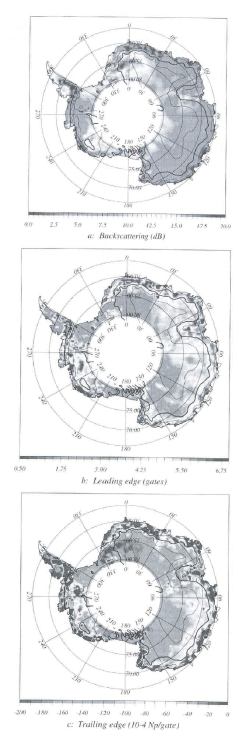
Following these results at Dome C, large-scale maps of these parameters were constructed (Fig. 9) by averaging the parameter values over 50 km × 50 km using data from the 35 d cycle No. 87 of ERS-1 in ocean mode. The leading-edge map has also been included (Fig. 9b); even if this parameter is quantitatively uncertain at the small-spatial scale, it gives good qualitative information. In fact, the leading-edge map shows important spatial variations over, Antarctica, greater than possible variations due to its small-scale complexity (topography/volume echo). The three maps show important and coherent signals.
Continental maps of the altimetric waveform раrameters, with (а) the backscattering coefficient (σ°), (b) the leading-edge width (Tr), and (c) the trailing-edge logarithmic slope (Fl).

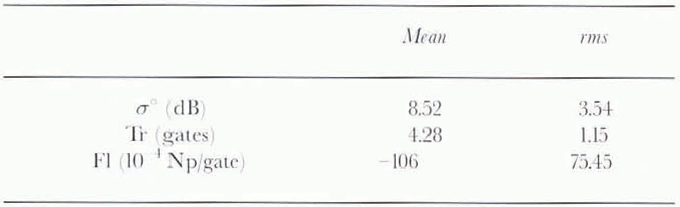
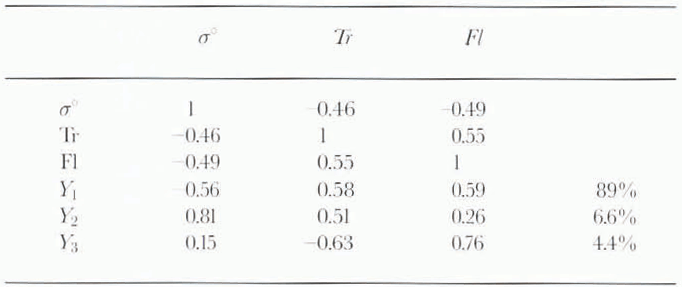
A principal component analysis has been conducted, based on these three mapped parameters. The average values of the parameters are given in Table 1, and the correlation matrix in Table 2. The first component resulting from the analysis represents 89% of the variance of the three parameters. It indicates that when σ°diminishes, Tr and Fl increase. This analysis indicates that one principal mechanism controls the altimetric response of the surface.
Mean values and rms of the waveform parameters over the Antarctic continent

Correlation matrix between the three waveform parameters and the three eigenvectors of the principal component analysis with their significance

The primary study shows that Fl is controlled by the ratio between volume and surface signal if averaged over a 50 km scale, while σ°is controlled by the summation of both terms at the same scale.
At this scale, Fl is also dependent on the surface slope and curvature, while σ°is little affected by undulations and slope. In this way, a decrease in the volume/surface ratio associated with an increase of their sum can only be explained by an increase in surface backscattering. Note that a control of the total backscattering by the extinction coefficient as is currently admitted (Reference Davis and ZwallyDavis and Zwally, 1993) would enhance σ°and Fl together.
Generally, in high-accumulation zones (e.g. coastal zones of East Antarctica and the eastern part of West Antarctica), σ°is weak and Tr and Fl are high. Over these regions, the important surface microroughness caused by strong wind leads to low surface backscattering.
Indeed, Reference Rémy, Brossier and MinsterRémy and others (1990)showed, with Seasat data, in the region 90–150°E, 66–72°S, that the wind influences the surface microroughness, and concluded that backscattering is inversely proportional to wind intensity. The snowpack is relatively homogeneous (accumulation, wind, temperature) over this region, so variations in backscattering are due to variations in surface microroughness representative of wind intensity. The leading edge is high, partly because of the important macroroughness (snow dunes resulting from wind; see Figs 3 and 5) and partly because it is enhanced by volume echo (Fig. 7). The trailing edge is particularly raised, partly by the surface slope (Reference LegrésyLegrésy, 1995) and partly by the importance of volume echo/surface echo.
For instance, at 120°E, from coast to interior, accumulation varies from 50 to 5cmyear−1w.e. The wind is particularly high along the coast (>18ms−1), while it is less than 6ms−1in the interior. Thus, surface roughness (micro and macro) is very important toward the margin and it is low at high altitudes. The importance of the surface signal compared to the subsurface one, and the decreasing surface slope bring the trailing edge down to its reference value. At higher latitudes the backscattering becomes very high, the leading edge is short and the trailing-edge slope becomes lower than its reference value. This can be explained by a particular surface echo process that could be described as intermediate between rough surface echoes observed above ice caps and specular surface echoes observed above sea ice. It is not possible here to conclude whether it is caused by a particular distribution function of surface roughness slope, or by particular effects of near-surface stratification in this low-accumulation zone. In the latter region, Reference Rott, Sturm and MillerRott and others (1994)reported a high backscattering coefficient with ERS-1 scatterometer data in C-band (5.2 GHz) at 35° incidence angle. They explained this high backscattering by important stratification. However, the penetration depth (related to frequency) is more important for the scatterometer, while surface backscattering sensitivity (related to incidence angle) is more important for the altimeter. The scatterometer signal is thus largely controlled by subsurface charaeteristics.
By contrast, in Dronning Maud Land (around 0° longitude; ERS-1 scatterometer data (Reference Rott, Sturm and MillerRott and others, 1994) show low backscattering, while ERS-1 altimeter data show very high σ°and low Fl. Indeed, such altimetric behavior can only be explained by a surface crust that can be transparent for scatterometer measurements.
In the West Antarctic ice cap, near 230°E, there is another region of high backscattering and low trailing edge, but in this case the leading edge remain high.
Conclusion
The aim of this paper was to study the spatial characteristics of the altimeter above the ice sheet. To do this, we first developed a waveform simulator which for the first time takes into account the convolution between antenna-pattern gain, ice-topography geometry and surface and subsurface signal parts, and also the real track profile. This simulator is able to reproduce part of the true characteristics of ERS-1 data above Antarctica. We showed that, even at Dome C, where the topography is among the continent’s smoothest, very gentle undulations strongly affect the waveform (1 dB in σ°1–2 gates in Tr, or 50–100 × 10−4Np/gate in Fl). The addition of subsurface scattering creates a large-scale signal in energy or trailing edge, but it also creates a strong non-linear and small-scale signal on the leading edge, which directly affects the estimation of the altimetric height with classical retracking techniques. The intensity of the subsurface signal cannot be easily detected or removed with the help of the beginning of the waveform, because it does not depend on a clear topographic signal, slope or curvature.
In order to look for the spatial variability of the altimetric signal characteristics not directly related to the topography, we compared these ERS-I data with SPOT images. These images clearly showed heterogeneities in albedo which seem to be related to abrupt changes in microroughness. σ°may be enhanced by 3 dB in these places. They also show smooth changes in albedo related to undulations whose amplitudes are not in accordance with surface dope amplitude and seem to be related to Snow-property changes. Sastrugis of 1m/100m, are also observed: they lengthen the leading edge by up to 2 gates.
Finally, altimetric parameters averaged over 50km scale and mapped on the whole continent show a very coherent pattern. Principal component analysis points out that up to 90% of the altimetric observation may be explained by one unique mechanism. Indeed, large-scale altimetric behavior is mostly controlled by variations in surface for near-subsurface backscattering. Regions where altimeter waveform characteristics clearly exhibit a dominant subsurface signal are regions where the surface scattering is affected by katabatic-wind induced features. On the other hand, regions where the altimetric signal is clearly dominated by surface signal exhibit a strong backscattering caused either by smooth surface or by the surface crust.
The combination of altimeter and radiometer data, both affected by surface characteristics (Reference Rémy and MinsterRémy and Minster, 1991), is very promising.
Acknowledgements
The SPOT images were obtained within the framework of the Franco-Italian project, Dome Concordia. Thanks go to J.Y. Prado of Centre National d’Etudes Spatiales (CNES) who provided these images, to Y. Guarguer of CNES for his help with the interpretation of the images, to P. Vincent of CNES and J. F. Minster of UMR5566 for their helpful comments, to R. Morrow of UMR5566 who provided useful comments and reviewed the paper’s English grammar, and to J. Louet of the European Space Agency/European Space Technology Centre (ESA/ESTEC). Part of this work has been done under ESA contract.