

Introduction
In geothermal exploitation of sedimentary rocks, it is crucial to adequately predict the regional aquifer distribution. Often geological data are sparse and property extrapolation is required over large distances. This is especially challenging for fluvial aquifers, which are notorious for lateral variation in lithofacies and aquifer properties. The prediction of the regional sandstone distribution (henceforth fluvial architecture) from well logs in fluvial aquifers is often ambiguous because lithofacies distribution could be affected by both allogenic and autogenic processes (e.g. Hajek et al., Reference Hajek, Heller and Sheets2010; Donselaar et al., Reference Donselaar, Cuevas Gozalo and Moyano2013; Flood & Hampson, Reference Flood and Hampson2015; Van Toorenenburg et al., Reference Van Toorenenburg, Donselaar, Noordijk and Weltje2016). This is reflected by large aquifer thickness variations that are recognised in currently active geothermal doublet wells in the West Netherlands Basin (WNB). The fluvial, sandstone-rich successions that form the aquifer of the geothermal HON-GT doublet range in thickness from 50 to 150 m in approximately 1.5 km spaced wells (Fig. 1). In addition, the depth of this aquifer below the top of the marginally marine Rodenrijs Claystone Member (e.g. Van Adrichem Boogaert & Kouwe, Reference Van Adrichem Boogaert and Kouwe1993) ranges from almost 100 m to more than 200 m in different geothermal wells. Up to now, these variations cannot be explained and create uncertainty in the prediction of lifetime and drilling costs of future doublet systems in the WNB.
Gamma-ray logs of two geothermal doublets HON-GT and PNA-GT. Fault interpretation is based on Duin et al. (Reference Duin, Doornenbal, Rijkers, Verbeek and Wong2006). Well-log correlation is based on ‘End-of-well reports’ (NLOG, 2017).

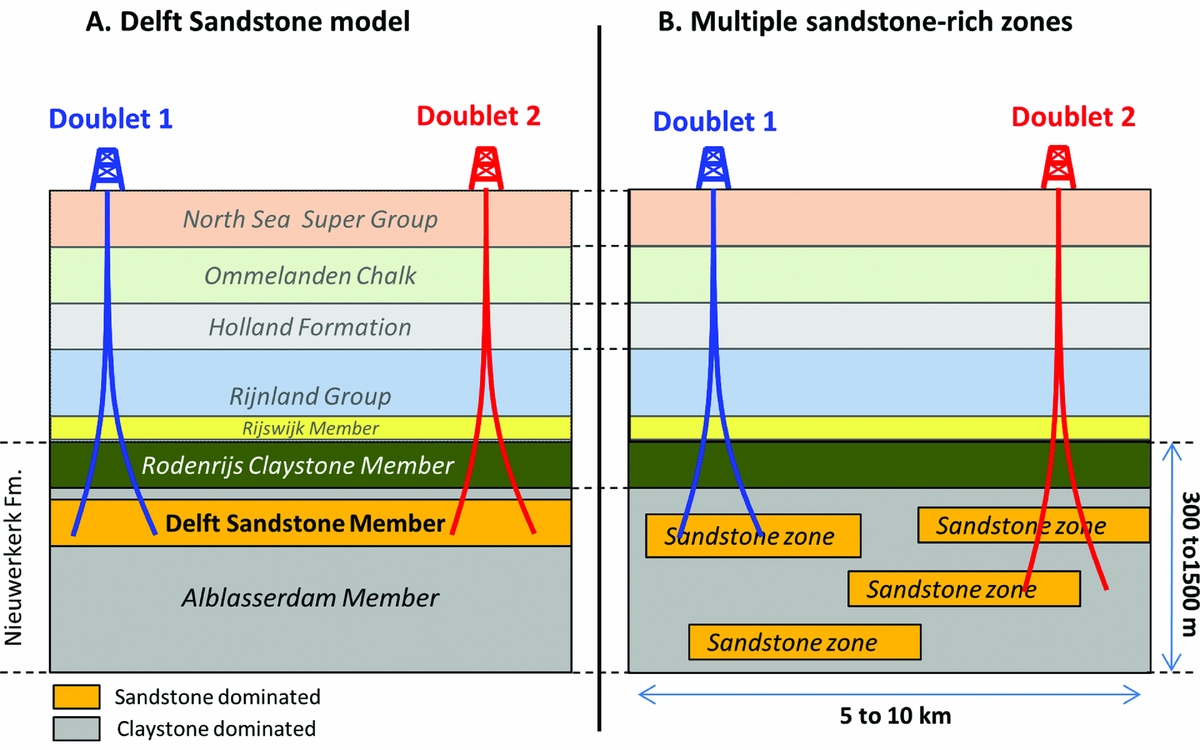
The aquifer in the geothermal wells of Figure 1 is interpreted as the Delft Sandstone Member which is part of the Lower Cretaceous Nieuwerkerk Formation (e.g. Van Adrichem Boogaert & Kouwe, Reference Van Adrichem Boogaert and Kouwe1993; Den Hartog Jager, Reference Den Hartog Jager, Rondeel, Batjes and Nieuwenhuijs1996; Herngreen & Wong, Reference Herngreen, Wong, Wong, Batjes and De Jager2007; Donselaar et al., Reference Donselaar, Groenenberg and Gilding2015). This member is characterised as a syn-rift, sandstone-rich interval ranging in age from Valanginian to Early Hauterivian, deposited in a meandering fluvial environment. Regional transgression and subsidence resulted in an increasingly marine character of the overlying sediments ranging from the restricted marine Rodenrijs Claystone Member to the marine Rijnland Group (Fig. 2). The interpretation of the Delft Sandstone Member as a single sandstone-rich interval in the upper section of the Nieuwerkerk Formation (Fig. 3A) is derived from lithostratigraphic regional well-log correlation from numerous hydrocarbon wells in the WNB (e.g. Racero-Baena & Drake, Reference Racero-Baena, Drake, Rondeel, Batjes and Nieuwenhuijs1996; Herngreen & Wong, Reference Herngreen, Wong, Wong, Batjes and De Jager2007). This model is commonly used in geothermal exploitation in the basin for doublet design and deployment. However, recent regional stratigraphic studies based on sequence stratigraphic principles did not acknowledge the Delft Sandstone Member (DeVault & Jeremiah, Reference DeVault and Jeremiah2002; Jeremiah et al., Reference Jeremiah, Duxbury and Rawson2010). DeVault & Jeremiah (Reference DeVault and Jeremiah2002) state that because of the syn-rift origin of the Nieuwerkerk Formation, clusters of amalgamated sandstone-rich zones can exist throughout the Nieuwerkerk Formation that do not necessarily form a single continuous sandstone-rich interval (Fig. 3B). The existence of two geological models that describe sandstone distribution in the Nieuwerkerk Formation creates uncertainty for geothermal exploitation because both models have a different impact on possible interference and aquifer thickness prediction. If the aquifer is formed by a single continuous sandstone-rich interval, pressure communication could affect injectivity and productivity of adjacent doublets (Fig. 3A). In contrast, pressure communication is less straightforward if different sandstone-rich zones occur with limited lateral extent. In the example of Figure 3B, claystone-dominated zones can form flow barriers or baffles between doublets 1 and 2. Furthermore, when the aquifer is not formed by a single sandstone-rich zone, the aquifer thickness depends on the lateral extent of the sandstone-rich zones that the doublets can encounter as is illustrated for doublet 2 in Figure 3B. Furthermore, the model in Figure 3B suggests that multiple aquifer targets can be present at deeper and hotter stratigraphic intervals affecting the geothermal potential in the region.
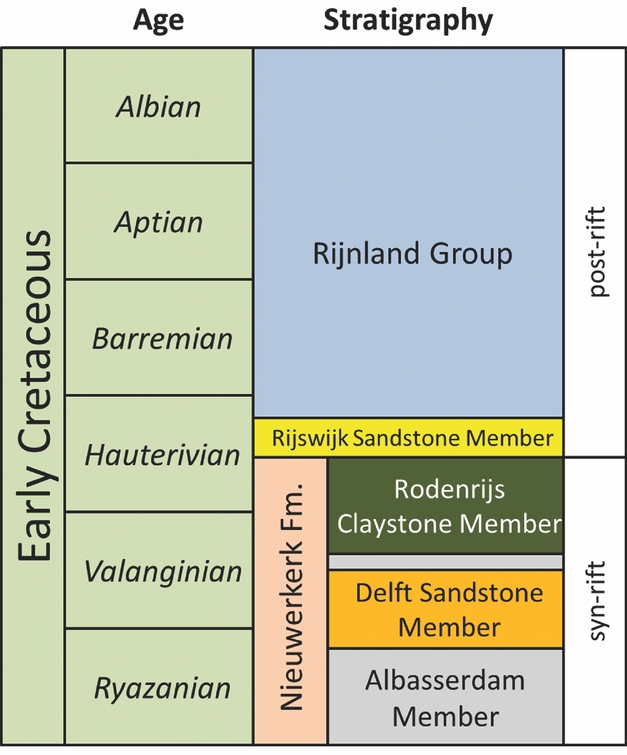
Stratigraphic column for the Early Cretaceous section in the WNB indicating tectonic activity during deposition of the Rijnland Group, the Nieuwerkerk Formation and the main geothermal aquifers in the WNB: the Rijswijk Sandstone Member and the Delft Sandstone Member (Van Adrichem Boogaert and Kouwe, Reference Van Adrichem Boogaert and Kouwe1993).
(A) Cartoons illustrating the difference in sandstone distribution in the Nieuwerkerk Formation in schematic strike sections on graben scale according to (A) the Delft Sandstone model and (B) the multiple sandstone-rich zones models.
The goal of this study is to place the fluvial aquifers in a chronostratigraphic framework. The results should decrease the uncertainty in the prediction of aquifer thickness for new doublet systems in the WNB and contribute to optimised doublet design. To reach this goal, palynological samples from drill cuttings are analysed in three geothermal wells, HON-GT-01, HON-GT-02 and PNA-GT-02, to define the chronostratigraphic position of fluvial intervals and identify regional maximum flooding surfaces (MFSs). The analyses are used to create a framework for a well-to-well correlation from which an explanation of aquifer thickness variations in the different doublets is proposed. This explanation is used to interpret regional aquifer architecture in different fault blocks.
Data and methods
Overview
This study was based on a combination of seismic interpretation, gamma-ray (GR) log correlation, and palynological analysis of cuttings. In the seismic interpretation, faults were identified in our study area in the WNB, which were active during deposition of the Nieuwerkerk Formation. In combination with a regional structural interpretation by Duin et al. (Reference Duin, Doornenbal, Rijkers, Verbeek and Wong2006) the lateral extent of these faults was identified. Secondly, by utilising palynological analyses of cuttings the chronostratigraphic position of each aquifer sandstone interval was identified and MFSs were interpreted. This formed the framework of improved geothermal GR well-log correlation. GR logs of 11 geothermal wells in our study area were used to compare fluvial architecture in different fault blocks. All results were finally combined in maps that predict the lateral extent of the sandstone-rich successions in the basin. An overview of the data used in our study is presented in Figure 4.
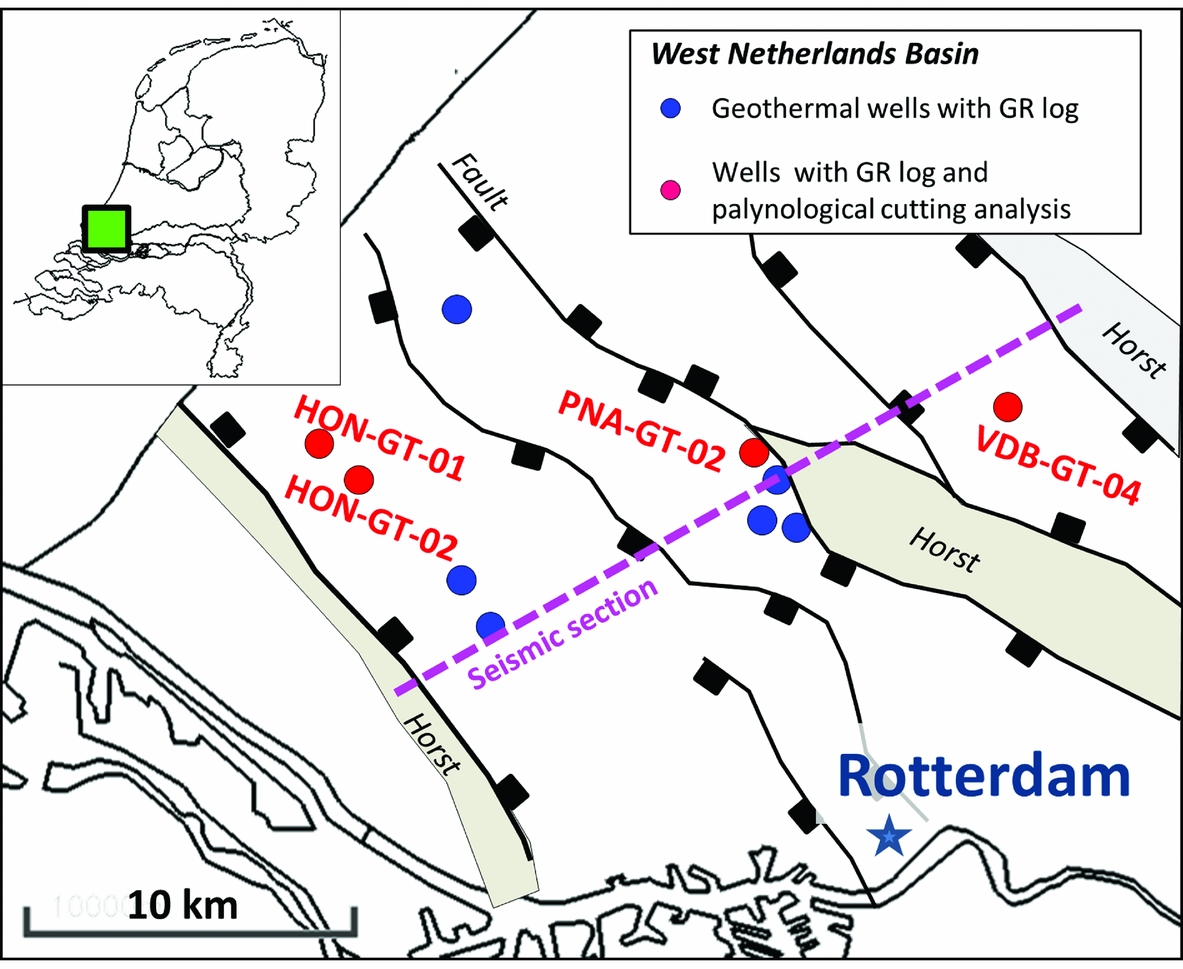
Location of the geothermal wells for the GR well-log correlation, cuttings analysis, the outline of the seismic cross-section and the regional structural interpretation by Duin et al. (Reference Duin, Doornenbal, Rijkers, Verbeek and Wong2006).
Structural setting of the Nieuwerkerk Formation
On a seismic section perpendicular to the major fault trend, two seismic horizons were interpreted: the top and base of the Nieuwerkerk Formation. The basin-wide section was derived by merging ten 3D seismic sections (Fig. 4; Vondrak, Reference Vondrak2016). Using horizon flattening of the top of the formation, fault blocks were identified that experienced different tectonic movement affecting fluvial architecture of the Nieuwerkerk Formation. This is derived from thickness differences of the formation between the major faults. Using structural interpretation by Duin et al. (Reference Duin, Doornenbal, Rijkers, Verbeek and Wong2006), the regional outlines of the fault blocks that experienced different tectonic movement during deposition of the Nieuwerkerk Formation were mapped. This result was used as the basis for regional well-log correlations and generation of maps that describe the distribution of sandstone-rich successions.
Palynological analysis
A total of 42 cuttings samples from well PNA-GT-02, 40 samples from HON-GT-01 and 28 samples from HON-GT-02 were analysed. Two additional samples from well VDB-GT-04 (at depths 1890 m and 1910 m) complemented the palynological analysis of Munsterman (Reference Munsterman2012). The samples were processed at the TNO laboratory using the standard sample-processing procedures (e.g. Janssen & Dammers, Reference Janssen and Dammers2008), which involved HCl and HF treatment, and sieving over an 18µm mesh sieve. The well selection was based on the well location in different graben blocks and the total thickness of the Nieuwerkerk Formation that these wells encountered. Larger total thickness could potentially reveal more information from the fluvial interval. The cuttings descriptions and the GR logs in the ‘End-of-well-reports’ (NLOG, 2017), in combination with results from Munsterman (Reference Munsterman2012), provided a basis for the selection of sample depths. The location of the wells in different fault blocks allowed relating differences in fluvial architecture to the syn-tectonic origin of the interval. The palynological analysis consisted of age dating and identification of the Elegans MFS and the Paratollia MFS (e.g. Jeremiah et al., Reference Jeremiah, Duxbury and Rawson2010), which formed the framework of our regional correlation scheme.
Age dating
The age interpretation was based on the last occurrence datum (LOD) of palynomorphs, in particular dinoflagellate cysts (dinocysts), and pollen and spores (sporomorphs). Key-references concerning the palynostratigraphy of the Early Cretaceous from the North Sea region were Davey (Reference Davey1979, Reference Davey1982), Heilmann-Clausen (Reference Heilmann-Clausen1987), Costa & Davey (Reference Costa, Davey and Powell1992), Riding & Thomas (Reference Riding, Thomas and Powell1992), Partington et al. (Reference Partington, Copestake, Mitchener, Underhill and Parker1993), Abbink (Reference Abbink1998), Duxbury et al. (Reference Duxbury, Kadolsky, Johansen, Jones and Simmons1999), Herngreen et al. (Reference Herngreen, Kerstholt and Munsterman2000) and Duxbury (Reference Duxbury2001). The international geological timescale of Gradstein et al. (Reference Gradstein, Ogg, Smith and Ogg2012) was followed.
Sporomorph eco-grouping (SEG) method
The SEG method (Abbink, Reference Abbink1998; Abbink et al., Reference Abbink, Targarona, Brinkhuis and Visscher2001, Reference Abbink, Van Konijnenburg-Van Cittert, Van der Zwan and Visscher2004a,Reference Abbink, Van Konijnenburg-Van Cittert and Visscherb) was used to identify the Paratollia MFS in the fluvial aquifer interval of HON-GT-01, HON-GT-02 and PNA-GT-02. With this method, sporomorph types were related to vegetation eco-groups. Abbink et al. (Reference Abbink, Van Konijnenburg-Van Cittert, Van der Zwan and Visscher2004a, b) classified Jurassic to Lower Cretaceous sporomorphs into six eco-groups. (1) Upland vegetation grows on higher terrain well above ground water level, which is never submerged by water. (2) Lowland vegetation is found on plains with or without freshwater swamps. It is not influenced by salt water. When periodically submerged it is referred to as ‘Wet-Lowland’ otherwise ‘Dry-Lowland’. (3) River vegetation is found on riverbanks and could be periodically submerged. (4) Pioneering vegetation occupies recently developed eco-space that has been previously submerged by seawater. (5) Coastal vegetation is found along the coast. (6) Tidally influenced vegetation is daily influenced by tidal changes and regularly submerged in a salt-water regime. Quantitative analysis of sporomorphs indicated percentages of eco-groups that were represented in the cuttings samples. In the SEG method it is assumed that the lower coastal plain area is reduced during a transgression (Fig. 5A, B). Therefore the relative share of Lowland eco-group vegetation is minimal on the moment of maximum transgression, when a MFS is formed. Based on this assumption, trends in relative representation of eco-groups were related to sea-level fluctuation. MFSs were assigned to samples where the relative share of ‘Upland’ sporomorphs peaked with respect to the ‘Lowland’ eco-group while the marine-influenced eco-groups were poorly represented or absent. Cuttings samples with 10 m intervals were analysed in the 2560–2810 m (measured depth (MD)) interval in HON-GT-01, 2590–2860 m (MD) in HON-GT-02 and 2440–2850 m (MD) in PNA-GT-02. These intervals were selected based on their fluvial origin which was derived from the cuttings description in the ‘End-of-well-reports’ (NLOG, 2017).
Schematic representation of the impact of (A) low sea level and (B) high sea level on the relative occurrence of eco-groups: 1=Upland, 2=Lowland, 3=River, 4=Pioneer, 5=Coastal, 6=Tidally influenced. Note the lower relative occurrence of the ‘Lowland’ eco group with high sea level in (B). Modified from Abbink et al. (Reference Abbink, Van Konijnenburg-Van Cittert, Van der Zwan and Visscher2004a,Reference Abbink, Van Konijnenburg-Van Cittert and Visscherb).

Results
Seismic interpretation
On the seismic cross-section three half-grabens and one horst block were recognised (Fig. 6A). The fault blocks were referred to as ‘Westland graben’, ‘Pijnacker graben’, ‘VDB graben’ and ‘Bergschenhoek horst’. The interpretation of the top and base of the Nieuwerkerk Formation indicated a lateral thickness variation of the Nieuwerkerk Formation in these grabens and horst, created by syn-depositional fault movement. Horizon flattening of the Top Nieuwerkerk Formation horizon was applied to highlight fault blocks where sedimentation might be affected by this tectonic movement (Fig. 6B). The associated faults that were active during deposition of the formation are highlighted in red. The regional extent of these faults was derived from the structural interpretation by Duin et al. (Reference Duin, Doornenbal, Rijkers, Verbeek and Wong2006). The three grabens are highlighted on the map in Figure 6. These results were used for the comparison of fluvial reservoir architecture in these three fault blocks.
(A) Seismic section with interpretation of faults as well as top (yellow) and base (pink) of the Nieuwerkerk Formation horizons. (B) Horizon flattening on top Nieuwerkerk Formation. The outline of the seismic section and the outline of the interpreted faults are indicated on the map.

Palynological analysis
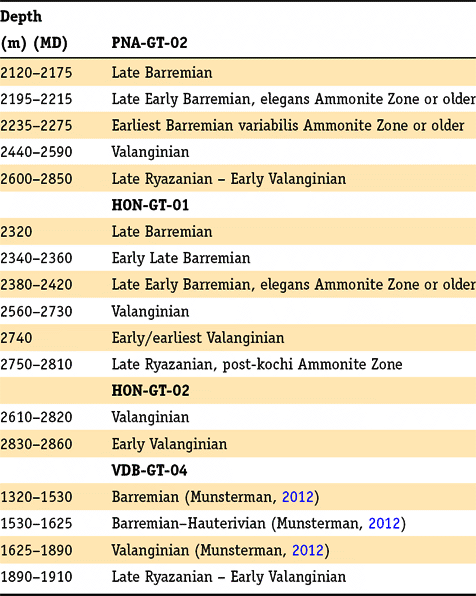
Palynological age dating formed the basis of the GR well-log correlation scheme. An overview of the results is presented in Figure 7 and Table 1. A detailed description of the analysis of all samples is presented in Appendix 1 (as Supplementary Material at https://doi.org/10.1017/njg.2017.23). Two MFSs were identified in HON-GT-01 and HON-GT-02 and four MFSs in PNA-GT-02. The MFS that is close to the Early Valanginian to Late Ryazanian boundary is associated with the Paratollia MFS in all wells. In well PNA-GT-02, this was based on the LOD of Stiphrosphaeridium dictyophorum (Sdi) at 2600 m depth and the LOD of Canningia compta (Cco) at 2620 m depth (Appendix 1). In HON-GT-01, the Paratollia MFS was interpreted at 2730 m depth based on the LODs of Canningia compta (and a morphologically closely related Escharisphaeridia spp. at 2730 m) and Perisseiasphaeridium insolitum at depth 2740 m MD (Costa & Davey, Reference Costa, Davey and Powell1992; Strauss et al., Reference Strauss, Elstner, du Chene, Mutterlose, Reiser and Brandt1993). In well HON-GT-02, this is based on the LOD of a single dinoflagellate cyst Stiphrosphaeridium dictyophorum.
Combination GR logs, Palynological age dating of intervals and results of the SEG analysis. Age interpretation in VDB-GT-04 is based on Munsterman (2012). (A) Sandstone-rich zone of Valanginian age, (B) sandstone-rich zones of Early Valanginian/Late Ryazanian age.

Overview of interval age dating.
The palynofacies and their relative occurrence in both HON-GT wells and PNA-GT-02 indicate that the Valanginian to Late Ryazanian interval was formed in a relatively humid, fluvial lowland environment, not directly positioned close to the coast. This last observation is derived from the absence or rare recognition of marine indicators. Both the sandstone content and the relative occurrence of sporomorphs associated to the ‘Lowland-dry’ eco-group is higher in HON-GT-02 compared to HON-GT-01, despite the relatively short distance of approximately 1.5 km between the wells in this doublet (Fig. 7).
In VDB-GT-04, the recognition of the Paratollia Ammonite Zone was based on the presence of Perisseiasphaeridium insolitum, Stiphrosphaeridium dictyophorum, Canningia compta, Hystrichosphaeridium scoriaceum and Oligosphaeridium diluculum in the samples at 1890 m and 1910 m MD (Costa & Davey, Reference Costa, Davey and Powell1992). A marine origin of the sample at 1890 m MD was recognised and therefore it may most likely be associated with the Paratollia MFS. Note that this is not based on SEG analysis in this well.
The results indicate that the aquifers in the four wells are not part of a single sandstone-rich succession. At least two sandstone-rich zones of Valanginian and Ryazanian age with limited lateral extent are encountered (Fig. 7). The Valanginian sandstone-rich zone A in HON-GT-01 relates to the upper section of the sandstone-rich zone in PNA-GT-02 with the same age. In contrast, the Valanginian succession in VDB-GT-04 is claystone-dominated. In this well, the aquifer is formed by a Ryazanian sandstone-rich zone B that relates to the Ryazanian sandstone-rich zone in PNA-GT-02. In HON-GT-01 the Ryazanian succession is claystone-dominated. Stacking of both sandstone-rich zones A and B accounts for the increased aquifer thickness in well PNA-GT-02. In contrast, lower aquifer thickness could be explained by the presence of a single sandstone-rich zone in HON-GT-01 and VDB-GT-04.
Regional well-log correlation
In the four wells with palynological analysis, the Paratollia MFS was recognised at approximately 300 m true vertical depth below the Elegans MFS (Fig. 8). In the wells without palynological cuttings analysis or in wells that did not reach sufficient depth, the top and base of the Valanginian succession were interpreted by extrapolation GR log patterns assuming constant thickness of the Valanginian interval. The resulting correlation scheme indicates that the Valanginian interval is sandstone-rich in both the Westland and Pijnacker grabens. In contrast, this interval has low sandstone content in the VDB fault block (Fig. 8). The Early Valanginian/Ryazanian interval has low sandstone content in the Westland fault block, but high sandstone content in the Pijnacker and VDB fault blocks. Our correlation scheme suggests that the prevailing position of the meander belts in which sand was deposited shifted from the east to the west side of the basin during the Ryazanian and Valanginian. In the Pijnacker fault block, both the Valanginian and the Early Valanginian/Ryazanian intervals have high sandstone content. This accounts for the largest interval with high sandstone content in all geothermal wells in the basin of approximately 250 m thickness in the PNA-GT-02 well. The other wells in this fault block have a limited total depth. Therefore they did not intersect the total Early Valanginian/Ryazanian interval. Similarly, the limited total depth of the VDB-GT-04 well only shows 70 m of the Early Valanginian/Ryazanian interval, of which approximately 50 m is sandstone-rich. In the Westland fault block, the Valanginian aquifer thickness ranges from 50 to 150 m. In the HON-GT-01 well, the lower half of the Valanginian interval is claystone-rich, unlike the other wells. The net-sandstone content (N/G) of the combined Valanginian and Early Valanginian intervals is calculated for each well. A specific GR log cut-off value is used in each well to take the differences in GR calibration into account. The N/G values range from 20% in the HON-GT-01 well where thick, non-aquifer intervals are included in the calculation, to 50% in the HAG-GT-01 well where the N/G calculation is based on the sandstone-dominated Valaginian interval. The arithmetic average N/G in all wells of the combined Valanginian and Early Valanginian / Late Ryazanian intervals is 35%.
Well-log correlation of geothermal wells in three different fault blocks in the WNB. Solid lines indicate MFS interpretation based on cuttings analysis, dotted line is the projected MFS based on TVD, in wells without cuttings analysis.

Series of maps indicating the location of sand-dominated sedimentation during the (A) Ryazanian / Early Valanginian and (B) Valanginian. Arrows indicate fluvial palaeoflow direction. (C) Cartoon illustrating facies distribution in the fluvial interval of the Nieuwerkerk Formation on a cross-section perpendicular to the fault trend.

Discussion
Ryazanian / Early Valanginian shift of sandstone-dominated facies
The seismic facies interpretation of a regional westward shift of sandstone-dominated facies during the Valanginian (Den Hartog Jager, Reference Den Hartog Jager, Rondeel, Batjes and Nieuwenhuijs1996) is corroborated by our palynology-based correlation (Fig. 9). Because of the unidirectional nature of the shift in sandstone-dominated facies in our study, we propose a tectonic origin of the shift. In the absence of such tectonic control, successive meander-belt avulsions and inherent compensational stacking would be the ruling processes, and a random spatial distribution of the fluvial sandstones the characteristic sedimentary architecture (e.g. Stouthamer & Berendsen, Reference Stouthamer and Berendsen2007; Hajek et al., Reference Hajek, Heller and Sheets2010; Donselaar et al., Reference Donselaar, Cuevas Gozalo and Moyano2013; Flood & Hampson, Reference Flood and Hampson2015; Van Toorenenburg et al., Reference Van Toorenenburg, Donselaar, Noordijk and Weltje2016). Based on this hypothesis, maps are generated that predict the lateral extent of the Ryazanian / Early Valanginian sandstone-rich zone (Fig. 9A) and the Valanginian sandstone-rich zone (Fig. 9B).
If tectonic movement had a strong impact on sedimentation, this might invalidate our assumption that the Valanginian interval has a constant thickness in our study area. In that case, it could be expected that the thickness of the Valanginian interval would increase in wells that are closer to the hanging wall of grabens. However, we expect that this would not have a significant impact on the trend in Figure 8 for two reasons. Firstly, the geothermal wells in the ‘Pijnacker Graben’ and ‘Westland Graben’ are drilled more or less parallel to the major fault trend and therefore the thickness correction would affect them equally. Secondly, in the wells with our palynological analysis an approximately constant thickness was observed, despite the fact that the four geothermal wells are located in different fault blocks. Additional palynological analysis in other WNB doublets could verify if the assumption is valid.
Regional aquifer architecture
In the present study, the correlation of the sandstone intervals in the Nieuwerkerk Formation is based on their chronostratigraphic position and the occurrence of two MFSs, whereas previous studies used a lithostratigraphic correlation. Van Adrichem Boogeart & Kouwe (Reference Van Adrichem Boogaert and Kouwe1993) identified the youngest fluvial sandstone-rich interval in the formation as the Delft Sandstone Member. Their regional aquifer architecture model (Fig. 2A) is used in current geothermal exploitation in the basin but does not adequately explain aquifer thickness variations like those shown in Figure 1. DeVault & Jeremiah (Reference DeVault and Jeremiah2002) described the regional aquifer architecture as a more random distribution of amalgamated sand complexes with limited lateral continuity that occur throughout the Nieuwerkerk Formation. These previous descriptions of the aquifer architecture were based on hydrocarbon wells on structural highs in the basin. Previously aquifer thickness prediction in the grabens was uncertain without well control, especially because these fault blocks might have experienced different tectonic movement. New well data from the graben fault blocks and the palynological analysis of our study suggest the aquifer architecture as sketched in Figure 9.
Because the number of geothermal wells in the grabens is still limited, the continuity of sandstone complexes is still uncertain. In the entire fluvial Valanginian to Late Ryazanian interval, N/G ranges from 20% to 50%, with an arithmetic average of 35% (Fig. 8). These percentages are an initial estimate of N/G, as no sensitivity study of GR cut-off value is included. Nevertheless this indicates that significant volumes of claystone are preserved. The Nieuwerkerk Formation is deposited by a relatively small meandering fluvial system with a palaeoflow depth of approximately 4 m (e.g. DeVault & Jeremiah, Reference DeVault and Jeremiah2002). The associated palaeochannel width and channel-belt width are therefore estimated to be approximately 40 m and 1–2 km, respectively (e.g. Bridge, Reference Bridge, Posamentier and Walker2006; Gibling, Reference Gibling2006). The maximum width of individual sandstone bodies is smaller than the channel-belt widths (e.g. Donselaar & Overeem, Reference Donselaar and Overeem2008; Donselaar et al., Reference Donselaar, Groenenberg and Gilding2015). Through amalgamation, sandstone-body width might extend further. However, claystone bodies are likely to form flow baffles or barriers perpendicular to the palaeoflow direction. This should be taken into account in doublet design and doublet placement as it will have an impact on possible interference between adjacent doublets and flowpath formation between injection- and production wells of individual doublets (e.g. Willems et al., Reference Willems, Nick, Donselaar, Weltje and Bruhn2017).
Our results have an impact on expected aquifer thickness in different fault blocks. Larger aquifer thickness could be expected in the Pijnacker fault block where sandstone-dominated zones in both successions overlap. Furthermore, our results affect expected aquifer depth and therefore drilling costs in different fault blocks. As shown in Figure 9C, the aquifer is found at greater depth in the VDB fault block than in the other two fault blocks. In addition, our results can be used for aquifer property extrapolation for new geothermal doublets. For example, the expected injectivity and productivity of future doublets should be based more on values which are measured in geothermal doublets in the same fault block. It is also possible that stratigraphically different sandstone successions have different properties. In current WNB doublets, productivity and injectivity vary considerably (Van Wees et al., Reference Van Wees, Degens, Zijp, De Boer, Obdam and Eyvazi2012). However, the variation could also be due to other factors such as scaling or skin formation. Van Wees et al. (Reference Van Wees, Degens, Zijp, De Boer, Obdam and Eyvazi2012) pointed out that unfortunately it is not possible to identify a single cause of this variability because of limited available data.
Palynological analyses and SEG method
Comparison of our results with those of Munsterman (Reference Munsterman2012) shows that the Valanginian interval in VDB-GT-04 has relatively more of a lower coastal plain character with respect to the HON-GT doublet and the PNA-GT-02 well. This could be due to a topographical difference between the fault blocks during the Valanginian. The SEG analysis indicated that in the HON-GT-02 well, a relatively higher fraction of ‘Lowland-dry’ type sporomorphs were recognised, which could point at a more inland location of the well compared to HON-GT-01 which is drilled more towards the palaeo-coastline in the north (e.g. Den Hartog Jager, Reference Den Hartog Jager, Rondeel, Batjes and Nieuwenhuijs1996). The Valanginian interval of HON-GT-01 also has a higher claystone content that could also be explained by a more near-coastal location of this well. In addition, the change in sandstone content could be explained by fault movement that directed the location of sand-rich meander belt deposits towards well HON-GT-02 while HON-GT-01 was located in the floodplain region. Due to the limited number of wells in our study, it is currently unclear how these observations are related to the fluvial architecture, sandstone distribution and the location of the palaeo-coastline.
The palynological age dating gives an indication of the age of interval and is not able to identify exact age boundaries or the exact location of the Paratollia MFS. The resolution of the age dating is limited by the sample spacing of 10 m and the risk of caving from higher sections. Uncertainty in age interpretation applies most to the Valanginian – Late Ryazanian boundary in our study area. Often, our interpretation of this boundary was based on recognition of a limited number of palynological indicators. In contrast, identification of the marine Elegans MFS has a lower degree of uncertainty because it was based on a combination of GR log interpretation and palynological analysis. This is because GR log signals in marine intervals are more often related to sea-level changes compared to GR log signals in fluvial intervals, like the Valanginian to Late Ryazanian interval in our study area. In addition, marine dinoflagellate cysts provide a higher-resolution dating than (long-ranging) terrestrial spores and pollen.
Our results underline the importance of palynological analysis for fluvial well-log correlation. These analyses enabled the identification of markers within fluvial claystone-dominated as well as sandstone-dominated successions, which would not have been possible based on GR log interpretation alone.
Conclusions
Based on the results of this study we can conclude that:
-
• Current WNB geothermal doublets encounter sandstone-rich zones in at least two stratigraphic intervals of Valanginian age and of Early Valanginian/Ryazanian age.
-
• Sandstone-rich zones in both intervals can overlap, which accounts for the large aquifer thickness in the PNA-GT-02 well.
-
• Valanginian tectonic movement induced a shift of the deposition of sandstone-dominated facies from the east to the west of the basin.
-
• This shift has an impact on expected aquifer thickness and aquifer depth in different fault blocks in the basin.
Acknowledgements
This study was carried out by Delft University of Technology in collaboration with Panterra Geoconsultants and TNO, in the context of the Research Agenda Geothermal Energy of the Ministry of Economic Affairs and LTO Glaskracht Nederland in the innovation programme ‘Kas als Energiebron’. We kindly thank the consortium of share- and stakeholders of the Delft Geothermal Project (DAP) for their support. We thank the associate editor Geert-Jan Vis and the reviewers Daan den Hartog Jager and Henk Kombrink for their constructive and helpful revisions of the original manuscript.
Supplementary material
Supplementary material is available online at https://doi.org/10.1017/njg.2017.23.


