


Introduction
Tourmaline is the dominant host for boron (B) in most rocks of the Earth's crust, occurring in granites and granitic pegmatites, though also in sedimentary and in low-grade to ultrahigh-pressure metamorphic rocks (van Hinsberg et al., Reference van Hinsberg, Henry and Dutrow2011a, Reference van Hinsberg, Henry and Marschall2011b; Dutrow and Henry, Reference Dutrow and Henry2018; Henry and Dutrow, Reference Henry and Dutrow2018). Tourmaline minerals are complex borosilicates with a significant compositional variability containing both light and heavy elements, from H to Pb, and across multiple valence states. This variability results in a wide range of distinct mineral species. In accordance with Henry et al. (Reference Henry, Novák, Hawthorne, Ertl, Dutrow, Uher and Pezzotta2011), the general formula of tourmaline can be written as XY3Z6T6O18(BO3)3V3W, where X = Na+, K+, Ca2+, Pb2+, □ (□ = vacancy); Y = Mg2+, Fe2+, Mn2+, Li+, Al3+, Fe3+, Cr3+, V3+, Ti4+; Z = Al3+, Fe3+, Cr3+, V3+, Mg2+, Fe2+, Ti4+; T = Si4+, Al3+, B3+; B = B3+; V = OH1–, O2– and W = OH1–, F1–, O2–. The non-italicised letters X, Y, Z, T and B represent groups of cations accommodated at the [9]X, [6]Y, [6]Z, [4]T and [3]B crystallographic sites (italicised letters). The letters V and W represent groups of anions accommodated at the [3]O3 and [3]O1 crystallographic sites, respectively. The H atoms occupy the H3 and H1 sites, which are related to O3 and O1, respectively.
According to the dominance of specific ions at one or more sites of the crystal structure, the tourmaline-supergroup minerals can be classified in three primary groups based on the X-site occupancy: X-site vacant, alkali and calcic (e.g. Henry et al., Reference Henry, Novák, Hawthorne, Ertl, Dutrow, Uher and Pezzotta2011). A further level of classification into subgroups is based on charge arrangements at the Y and Z sites. Tourmalines are also distinguished by the dominant anion at the W position of the general formula into hydroxy-, fluor- and oxy-species (Henry et al., Reference Henry, Novák, Hawthorne, Ertl, Dutrow, Uher and Pezzotta2011). In particular, partitioning of the X and Y-site occupancy has been calibrated and is useful to reconstruct the chemical history of the fluids involved in tourmaline crystallisation (van Hinsberg et al., Reference van Hinsberg, Henry and Dutrow2011a, Reference van Hinsberg, Henry and Marschall2011b; Dutrow and Henry, Reference Dutrow and Henry2018; Bosi et al., Reference Bosi, Pezzotta, Altieri, Andreozzi, Ballirano, Tempesta, Cempírek, Škoda, Filip, Čopjacová, Novák, Kampf, Scribner, Groat and Evans2022a).
Gem-quality tourmalines from Elba Island are easily recognisable and distinguishable from those of all other world localities for the delicate pastel colours and the perfection of their crystal shape, even in small sizes. Specifically, the main features which make them unique are the pastel colours of the crystal prismatic section and an unusual dark coloured termination at the analogous pole (the so-called ‘Moor's head’ textural type), which is commonly black (Pezzotta, Reference Pezzotta2021). However, in some cases, the terminations of the tourmaline crystals are not black, but are composed of multiple thin growth zones of greenish, brownish, purplish or even bluish colours (Pezzotta, Reference Pezzotta2021). The blue hues are the rarest and thus, the most scientifically fascinating colours among Elba Island tourmalines. During the last decades, the only Elba pegmatitic veins in which some tourmaline crystals with a blue growth zone at the termination have been sampled, are those named San Silvestro and Fucili (Grotta d'Oggi quarry), located respectively a few hundred metres south and north of the San Piero in Campo village (Pezzotta, Reference Pezzotta2021) (Fig. 1).
Tourmaline crystal with a blue-growth zone on quartz, 18 mm in length. An historic specimen from the San Silvestro pegmatite, San Piero in Campo, Elba Island, Italy. Federico Pezzotta collection. Antonio Miglioli photo.

Tourmaline crystals with blue growth zones from Elba have always been sought after and appreciated by collectors from all over the world. Although their morphology has been described in detail since the 19th century by mineralogists such as Giovanni D'Achiardi (D'Achiardi, Reference D'Achiardi1894, Reference D'Achiardi1897), their rarity and collectability have hindered studies concerning their crystal-chemical characteristics. In fact, few data are currently available for detailed compositional or spectroscopic analysis. Moreover, a correlation study between ultraviolet-visible-near-infrared optical absorption spectra (UV-NIR) and local structural information obtained by Fourier-transform infrared spectroscopy (FTIR), in addition to an in-depth study of the atomic mechanisms that regulate cause of colour has never been undertaken.
Elbaite crystals with a blue coloration have been found in other locations. These include copper-bearing crystals from Paraiba State (Brazil), iron-bearing crystals from Pakistan and Usakos (Namibia), and blue cap tourmalines from the Tourmaline Queen Mine (Pala, San Diego County, California). Optical absorption spectroscopic data of most of these samples can be found on the Caltech website (http://minerals.caltech.edu/files/visible/tourmaline).
This investigation characterises two tourmalines with a blue growth zone, from both the San Silvestro and the Fucili pegmatites, using compositional data and spectroscopic analyses to define their crystal-chemical character and the causes of the colour. Because tourmaline is an excellent petrogenetic indicator, able to register the chemical-physical variations of the crystallisation environment during its growth (e.g. Hawthorne and Dirlam, Reference Hawthorne and Dirlam2011), the origin and composition of fluids involved in the tourmaline crystallisation, responsible for the blue zone at the termination of the crystals, is also addressed.
Occurrence
Tourmaline crystals from Elba Island, Italy, occur in miarolitic cavities within pegmatitic veins distributed along the eastern border of the Monte Capanne pluton (Fig. 2a). This pluton, which composes the western side of the island, is a peraluminous biotite monzogranite intrusion (Dini et al., Reference Dini, Innocenti, Rocchi, Tonarini and Westerman2002) formed by the downward stacking of multiple magmatic pulses (Farina et al., Reference Farina, Dini, Innocenti, Rocchi and Westerman2010). After the formation of the main pluton, several aplite-pegmatite dykes were emplaced throughout the intrusion in an area of <4 km2 along the eastern side of the Monte Capanne pluton (Marinelli, Reference Marinelli1959; Pezzotta, Reference Pezzotta2000).
(a) Geologic map of Elba Island. The occurrence area of the tourmaline samples investigated in this study is marked at the edge of the Monte Capanne granite (VI). I. Calamita gneiss. II. Schists. III. La Spezia nappe. IV. Radiolarites and ophiolite nappe. V. Marls and porphyritic Tertiary granites (after Trevisan, Reference Trevisan1951 and modified by Pezzotta, Reference Pezzotta2021). (b) Crystal from the Fucili pegmatite (Grotta d'Oggi quarry, north of San Piero in Campo, Elba Island, Italy), 9 mm in length. (c) Crystal from the San Silvestro pegmatite (south of San Piero in Campo, Elba Island, Italy), 12 mm in length. Scale bar = 1 mm. The analysed traverses (a–b) are represented by solid red lines, and the dashed red lines divide the crystal in the different zones labelled as Z1—Z4/Z5 based on colour/chemistry.

The aplitic–pegmatitic veins of Monte Capanne (6.7−6.9 Ma) have been classified in four distinct groups by Pezzotta (Reference Pezzotta2000) on the basis of their internal structures, mineralogy and degree of geochemical evolution (Orlandi and Pezzotta, Reference Orlandi and Pezzotta1996): (I) dykes without Li minerals; (II) Li-bearing dykes with complex asymmetric zoning; (III) Li-bearing dykes with simple asymmetric zoning; and (IV) irregularly zoned to unzoned Li-bearing dykes. The degree of geochemical fractionation increases from group I to group IV. The less geochemically evolved group I dykes are mostly emplaced within the granitoids of the pluton, and the most evolved group IV dykes are emplaced in the contact metamorphic rocks (metasediments and metaserpentinites) of the aureole.
San Silvestro and Fucili pegmatites belong to group II. The San Silvestro pegmatite shows complex and well-structured internal asymmetric zoning, which includes a well-defined aplitic-layered unit at the footwall. Fucili is composed of a swarm of narrow pegmatitic and aplitic veins, sub-parallel or locally intersecting each other at low angles, hosted in monzogranite. These pegmatites are highly miarolitic, with cavities containing euhedral crystals of quartz, feldspar, lepidolite, gem-tourmaline and several accessory minerals (Pezzotta, Reference Pezzotta2021).
Analytical methods
Samples description and preparation
The two tourmaline samples, Fucili and San Silvestro (Fig. 2b,c), are characterised by a blue growth zone at the analogous pole, with a more intense greenish hue in the Fucili sample. An additional yellow–green coloured zone is observable close to the base of both crystals; this zone is better defined in the San Silvestro crystal.
The samples were glued to a glass slide using epoxy resin, with their length parallel to the surface of the slide. A slice of each crystal was cut along the growth direction (crystallographic c-axis) and subsequently ground and polished to produce a flat surface with a uniform thickness of 500 μm for electron microprobe analysis (EMPA).
A section of the blue zone showing significant Fe contents by EMPA was cut from the Fucili sample using a thin bladed diamond wheel saw. Small amounts (1–2 mg) of the material were finely ground under acetone in an agate mortar, mixed with thermoplastic resin and then shaped to a millimetre-sized cylindrical absorber with mild heating for Mössbauer spectroscopy analysis.
For infrared and optical absorption spectroscopy analyses, samples were glued to a glass-slide using a thermoplastic resin and cut along the c-axis, as described above. Before analyses, tourmaline slices were further thinned to appropriate thickness and doubly polished (Fucili sample: 45 μm and 364 μm for infrared and optical absorption spectroscopy analyses, respectively; San Silvestro sample: 74 μm and 865 μm for infrared and optical absorption spectroscopy analyses, respectively).
Electron-microprobe analysis
Compositional data were collected along a straight traverse parallel to the c-axis from the base to the termination of each crystal with an average step size of 300 μm using a CAMECA SX50 electron-microprobe at the Istituto di Geologia Ambientale e Geoingegneria (CNR of Rome, Italy). Twenty four and 37 spot analysis for Fucili and San Silvestro samples were obtained, respectively. Electron microprobe analyses were undertaken operating in the wavelength-dispersion mode with an accelerating potential of 15 kV, a sample current of 15 nA and a beam diameter of 10 μm. Minerals and synthetic compounds were used as primary standards: wollastonite (Si, Ca); magnetite (Fe); rutile (Ti); corundum (Al); karelianite (V); fluorophlogopite (F); periclase (Mg); jadeite (Na); orthoclase (K); rhodonite (Mn); and metallic Cr, Cu and Zn. The PAP correction procedure for quantitative electron probe micro-analysis was applied (Pouchou and Pichoir, Reference Pouchou, Pichoir, Heinrich and Newbury1991). Relative error on these data was <5% and detection limits <0.03 wt.%.
Mössbauer spectroscopy
The 57Fe Mössbauer spectrum of the blue zone of the Fucili sample was acquired using a conventional spectrometer system equipped with a 10 mCi point source and operated in constant acceleration mode. The absorber was mounted on strip tape and positioned close (<1 mm) to the tip of the point source. Data were collected at room temperature over the velocity range ±4.2 mm/s and recorded in a multichannel analyser with 1024 channels. The velocity was calibrated with an α-Fe foil. The obtained spectrum was fitted to Lorentzian line-shapes using the MossA fitting program (Prescher et al., Reference Prescher, McCammon and Dubrowinsky2012).
Optical absorption spectroscopy
Polarised, room temperature optical absorption spectra (OAS) of the Fucili and San Silvestro yellow–green and blue zones in the range of 30000–11500 cm–1 were obtained at a spectral resolution of 1 nm on doubly polished sections, using an AVASPEC-ULS2048 × 16 spectrometer attached via a 400 μm ultraviolet (UV) optical fibre cable to a Zeiss Axiotron UV-microscope. A 75 W Xenon arc lamp was used as light source and Zeiss Ultrafluar 10× lenses served as objective and condenser. An UV-quality Glan-Thompson prism, with a working range from 40000 to 3704 cm–1 was used as a polariser. Spectral data in the range 11500–5000 cm–1 were taken from the FTIR measurements. The colourless central region for both samples was also measured as a reference spectra.
Fourier-transform infrared spectroscopy
Polarised Fourier-transform infrared spectra of Fucili and San Silvestro blue zones in the range 2000–13000 cm–1 were collected at a resolution of 4 cm–1 from the same sections studied by OAS spectroscopy but with a reduced thickness. Analyses were performed using a Bruker Vertex 70 spectrometer attached to a Hyperion 2000 microscope and equipped with a halogen-lamp source, a CaF2 beam-splitter, a ZnSe wire-grid polariser and an InSb detector.
Determination of atomic fractions
The wt.% of element oxides determined by EMPA were used to calculate the atomic fractions (apfu). The B3+ content was assumed to be stoichiometric (B = 3.00 atoms per formula unit, apfu). Lithium was calculated in accord with Pesquera et al. (Reference Pesquera, Gil-Crespo, Torres-Ruiz, Torres-Ruiz and Roda-Robles2016). The (OH) content was calculated by charge balance with the assumption (T + Y + Z) = 15.00 apfu and 31 anions.
According to the results of Mössbauer spectroscopy (see below), all Fe in the blue zone of Fucili sample is in the 2+ reduced state, within an estimated detection limit of 3%. On the basis of this result, all Mn was considered as Mn2+. Concerning the San Silvestro sample, given the comparable composition, the oxidation state of Fe and Mn were also assumed to be +2.
Results
Composition and determination of atomic fractions
Compositional data along the c-axis in the direction of the analogous termination showed heterogeneity in composition for Fe and Mn that can be correlated with the observed colour. Other elements showed no appreciable variation along the c-axis, with the exception of fluorine and calcium. Vanadium, Cr, Cu and Mg were below detection limits. On the basis of the variation in composition homogeneity and colour, each sample has been divided in different zones: four for the Fucili and five for the San Silvestro sample. Figure 3 and Fig. 4 display the pattern of selected elements (as wt.% oxides) determined along the traverse. Tables 1 and 2 summarise the compositions in wt.% and apfu for each selected zone of Fucili and San Silvestro samples, respectively.
Compositions selected elements of the Fucili sample along a straight traverse parallel to the c-axis. See Table 1 for complete compositions as determined by EMPA.

Compositions of selected elements of the San Silvestro sample along a straight traverse parallel to the c-axis. See Table 2 for complete compositions as determined by EMPA.

Representative compositions and atoms per formula unit (apfu) for each zone of the sample from Fucili, San Piero in Campo, Elba Island, Italy.*

* Errors for oxides and fluorine are standard deviations (in brackets)
a Calculated by stoichiometry (see text)
b Determined by Mössbauer spectroscopy
c Estimated with the procedure of Pesquera et al. (Reference Pesquera, Gil-Crespo, Torres-Ruiz, Torres-Ruiz and Roda-Robles2016)
Representative compositions and atoms per formula unit (apfu) for each zone of the sample from San Silvestro, San Piero in Campo, Elba Island, Italy.*
* Errors for oxides and fluorine are standard deviations (in brackets)
a Calculated by stoichiometry (see text)
b Estimated with the procedure of Pesquera et al. (Reference Pesquera, Gil-Crespo, Torres-Ruiz, Torres-Ruiz and Roda-Robles2016)
In both samples, the blue coloured zone located at the upper part of the crystals is characterised by the highest amount of Fe (Z3, Fig. 3 and Fig. 4). In Fucili, FeO increases up to 1 wt.% and then decreases to below detection at the colourless termination of the crystal (Z4, Fig. 3). In San Silvestro, the blue zone is characterised by a lower FeO concentration, which increases up to 0.7 wt.%, and slowly decreases to below detection approaching the termination of the crystal, with a concomitant fading of colour (Z4, Fig. 4). FeO concentration abruptly increases to 0.6 wt.% at the rim of the crystal, where an additional thin bluish overgrowth occurs (Z5, Fig. 4). In all blue coloured zones TiO2 content was below detection limits (Tables 1 and 2).
The prismatic initial part of the two crystals exhibits a yellow–green colour and contains the highest amount of Mn. This zone appears more extended and darker in the San Silvestro sample and is characterised by MnO up to ~4.5 wt.%, which decreases to values below detection in the remaining part of the crystal (Fig. 4). This zone is also enriched in TiO2 (up 0.11 wt.%) (Table 2). Similarly, the Fucili yellow–green zone shows MnO up to ~1.5 wt.%, which sharply decreases to values 0.1–0.3 wt.% in the remaining part of the crystal (Fig. 3).
The yellow–green zones of the Fucili and the San Silvestro samples (Z1) are enriched in F, compared to other parts of the crystals. In the Fucili sample, the F content remains higher throughout the entire length of the prismatic colourless section (Z2), with an average value of 0.7 wt.%, decreasing to lower values at the terminal part of the crystal (Fig. 3). In contrast, the San Silvestro sample contains the highest concentration of F (~1.2 wt.%) close to the base of the crystal. Fluorine content slowly decreases within the yellow–green zone to reach very low values in the remaining part of the crystal (Fig. 4).
Iron speciation
To evaluate the Fe redox state, the blue zone of Fucili sample, characterised by the highest Fe content, was subjected to Mössbauer spectroscopic analysis. The spectrum could be accurately fitted with three Lorentzian doublets with centre shift (δ) values around 1.09 mm/s, consistent with [6]Fe2+ (Fig. 5). The doublets are distinguished by their quadrupole splitting (ΔEQ) values: the first two doublets with ΔEQ equal to 2.61 mm/s and 2.33 mm/s, were interpreted as Fe2+ at the Y site (Y1 and Y2), whereas the third Fe2+ doublet, which has ΔEQ = 1.31 mm/s, was interpreted as [6]Fe2+ at the Z site according to the model described in Andreozzi et al. (Reference Andreozzi, Bosi and Longo2008). No indication of the presence of Fe3+, within the experimental error, was observed by Mössbauer spectroscopy, consistent with the absence of Fe3+-related signals in OAS spectra (see below).
Room temperature 57Fe Mössbauer spectrum for the blue zone of the Fucili sample. The experimental spectrum is represented by dots, and calculated spectrum by a thick red curve. Lorentzian absorption doublets assigned to Fe2+ are represented by coloured areas. The different colour of the areas refers to the assignment of Fe2+ between Y and Z sites.

The hyperfine parameters of the Mössbauer spectroscopy doublets and the relative Fe oxidation state and site assignment for the blue zone of Fucili sample are summarised in Table 3.
Room-temperature 57Fe Mössbauer parameters for the blue zone of the sample from Fucili, San Piero in Campo, Elba Island, Italy.*

* Centroid shift (δ) in mm/s relative to α-Fe foil; errors are estimated no less than ±0.02 mm/s for δ, quadrupole splitting (ΔEQ), and peak width (Γ), and no less than ±3% for doublets areas.
Determination of site population and mineral formula
The site populations for each zone of the Fucili and San Silvestro samples were calculated following Henry et al. (Reference Henry, Novák, Hawthorne, Ertl, Dutrow, Uher and Pezzotta2011). The resulting empirical formulae are reported in Table 4. All the compositions are consistent with a tourmaline belonging to the alkali-group, subgroup 2 (Henry et al., Reference Henry, Novák, Hawthorne, Ertl, Dutrow, Uher and Pezzotta2011): they are Na-dominant at the X position of the tourmaline general formula and hydroxy-dominant at W with (OH+F)− > O2− and (OH) >> F, with the exception of Z1 yellow–green zone of San Silvestro which is fluor-dominant. All tourmalines investigated are ZAl- and Y(Al1.5Li1.5)-dominant, thus they are elbaitic from a nomenclature viewpoint (Henry et al., Reference Henry, Novák, Hawthorne, Ertl, Dutrow, Uher and Pezzotta2011). In detail, all the zones of Fucili and San Silvestro can be classified as elbaite, ideally Na(Li1.5Al1.5)Al6Si6O18(BO3)3(OH)3OH, except for Z1 of San Silvestro that is fluor-elbaite, ideally Na(Li1.5Al1.5)Al6Si6O18(BO3)3(OH)3F. The Z1 zone of both samples is a Mn-bearing tourmaline (MnO > 1 wt.%), whereas the Z3 zone of the two samples and Z5 of San Silvestro are Fe-bearing tourmalines (FeO > 0.2 wt.%).
Empirical formulae of the different zones of the Fucili and San Silvestro samples.

a Iron site distribution has been calculated on the basis of Mössbauer data
Optical spectra
The optical absorption spectra (E⊥c and E||c) in the UV-Vis-NIR region of San Silvestro and Fucili blue zone highlight the cause of colour (shown in Fig. 6). The spectrum of the San Silvestro sample recorded in polarised mode perpendicular to the c-axis direction displays two absorption bands centred at 13800 and 9200 cm–1 and two very weak absorption bands at ~19000 and ~23000 cm–1. The same bands, with higher intensities, are also observed in the E⊥c spectrum of the Fucili sample (Fig. 6). In light polarised parallel to the crystallographic c-axis, the recorded spectra are characterised by the same absorption bands observed in E⊥c spectra, but with a lower intensity.
Optical absorption spectra polarised perpendicular (E⊥c, blue line) and parallel (E||c, red line) to the c-axis direction of the blue zone of the San Silvestro (a) and Fucili (b) samples. Sample thickness: San Silvestro = 364 μm; Fucili = 865 μm.

The set of strongly E||c-polarised sharp bands in the NIR region of spectra of the blue zones of the San Silvestro and Fucili samples between 6700–7200 cm–1 are due to overtones of the fundamental (OH)-stretching modes (Fig. 6).
FTIR spectra in the (OH)-stretching region
FTIR spectra recorded in polarised mode perpendicular and parallel to the c-axis for the blue zones of San Silvestro and Fucili samples, display a set of absorption bands with different intensities in the (OH)-stretching region (3300–3800 cm–1) (Fig. 7). As observed in previous polarised-FTIR studies on tourmalines (e.g. Gebert and Zemann, Reference Gebert and Zemann1965), the absorption bands are strongly polarised in the c-axis direction, and the main bands suffer from truncation problems due to excessive absorption.
Polarised FTIR spectra (E⊥c, blue line, and E||c, red line) of the blue zone of the San Silvestro (a) and Fucili (b) samples. Peak positions are indicated. Sample thickness: San Silvestro = 74 μm; Fucili = 45 μm.
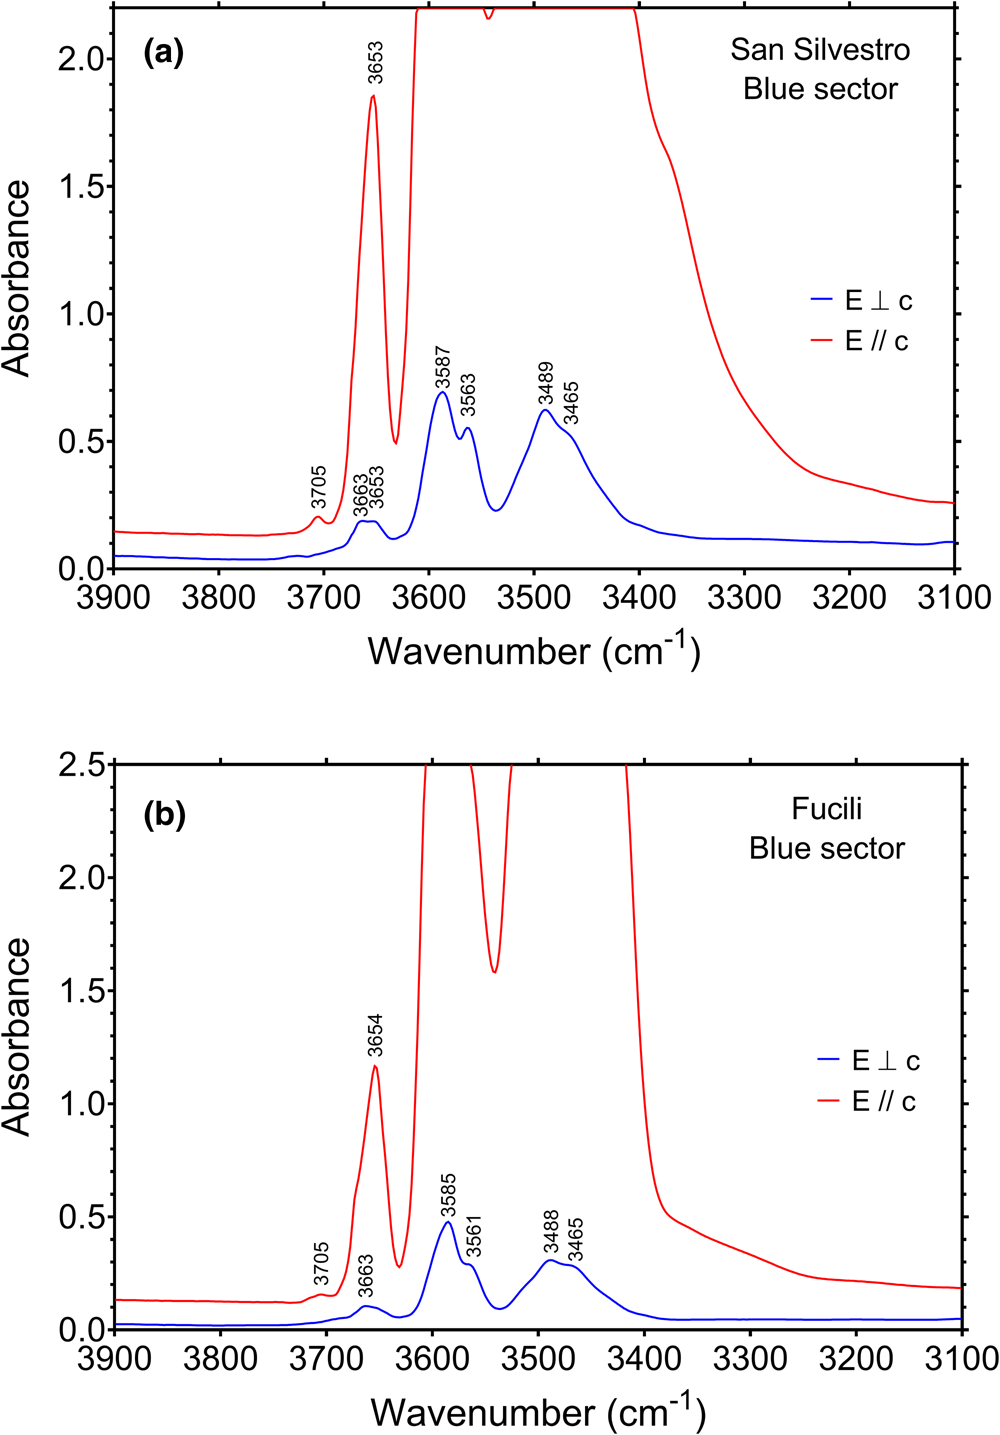
Infrared spectra of the blue zone in the San Silvestro sample display the presence of several bands where intensity is strongly dependent on the polarisation direction (Fig. 7a). Four main intense bands are observable in E⊥c polarisation at 3465, 3489, 3563 and 3587 cm–1, and two weaker bands occur at 3653 and 3663 cm–1. In the E||c direction the band at 3653 cm–1 shows a much stronger intensity, and an additional weak band occurs at 3705 cm–1, whereas the bands below 3600 cm–1 are off-scale.
The FTIR spectra of the blue zone of Fucili sample (Fig. 7b) display very similar features to those observed in the spectra of San Silvestro sample, with four main intense bands at 3465, 3488, 3561 and 3585 cm–1 (E⊥c), two relatively weak bands at 3654 (E||c) and 3663 cm–1 (E⊥c), and a very weak band at 3705 cm–1, only present in the E||c direction.
Discussion
Cause of colour
Colours in tourmaline are essentially related to transitions elements (Ti, V, Cr, Fe, Mn and Cu), acting as colour-causing agents through several mechanisms at structural levels, with the most common ones being crystal field transitions (CFT), intervalence charge transfer (IVCT) interactions, and colour centres (e.g. Fritsch and Rossman, Reference Fritsch and Rossman1987; Pezzotta and Laurs, Reference Pezzotta and Laurs2011; Rossman, Reference Rossman, Henderson, Neuville and Downs2014). Because compositional analyses of the San Silvestro and Fucili samples revealed contents of V2O3, Cr2O3 and CuO below the detection limit (≤0.03 wt.%), the main transition metals that could contribute to the colour of the blue zone of these tourmaline crystals are Fe, Mn and Ti.
Polarised spectra (E⊥c and E||c) recorded on the blue zone (Z3) of the San Silvestro sample (Fig. 6a) show two absorption bands centred at 13800 and 9200 cm–1, which are caused by electronic transitions in Fe2+ (e.g. Mattson and Rossman, Reference Mattson and Rossman1987). Results from EMPA confirmed the presence of Fe as the only colour-causing agent (FeO up to 0.7 wt.%), because Mn and Ti are barely detectable (below detection) in the blue zone of this sample (Fig. 4). Moreover, the weak polarisation of 13800 and 9200 cm–1 bands is attributable to the absence of Fe3+ in the sample. Consequently, these bands are assigned to pure spin-allowed d-d transitions in [6]-coordinated Fe2+ (e.g. Mattson and Rossman, Reference Mattson and Rossman1987). In addition, weak absorption bands at ~19000 and 23000 cm–1 are tentatively assigned to spin-forbidden electronic transitions in [6]-coordinated Fe2+.
As observed for San Silvestro, spectra of the blue zone (Z3) of the Fucili sample are characterised by two strong absorption bands at 13800 and 9200 cm–1 (Fig. 6b), which are attributable to pure spin-allowed d-d transitions in [6]-coordinated Fe2+. This assignment agrees with the Fe valency and site distribution observed from Mössbauer spectra of the blue zone of this sample (Fig. 5 and Table 3). The stronger intensity of the bands at 13800 and 9200 cm–1 relate to the higher concentration of Fe (FeO up to ~1 wt.%) compared to the blue zone of the San Silvestro sample. Similarly, the weaker absorption bands due to spin-forbidden transitions in [6]-coordinated Fe2+ also display increased intensities.
The blue colour of elbaite crystals is predominantly due to Fe2+, which causes absorption in the red range of the visible spectrum, and in rare cases by Cu2+. The blue hue can be amplified significantly by very low amounts of Ti4+ and Fe3+, through Fe2+–Ti4+ and Fe3+–Fe2+ IVCT interactions. These latter interactions have been reported in the OAS data of the ‘blue capped’ tourmalines from the Tourmaline Queen Mine (Pala, California). Although similar to the Queen Mine tourmalines by sharing a blue zone at the analogous pole, the samples analysed here only have absorption bands in the OAS spectra related to Fe2+. Thus, the blue colour for these samples is due to Fe2+ alone, without the influence of Ti or Fe3+.
Compositional analyses of the yellow–green zones (Z1) identify Ti, Mn and Fe as potential colour-causing agents (Tables 1 and 2). In the spectra of the San Silvestro sample, the broad and strongly polarised (E⊥c) absorption in the near UV-region extending from 19000 to 32000 cm–1 can be assigned tentatively to a Mn2+–Ti4+ IVCT-band at ~30100 cm–1 (Rossman and Mattson, Reference Rossman and Mattson1986) and to a Fe2+–Ti4+ IVCT-band at ~23900 cm–1 (data not shown). A slightly higher energy of 23900 cm–1 for the Fe2+–Ti4+ IVCT-band as compared to a previously reported energy range of 22000–22900 cm–1 (e.g. Smith, Reference Smith1978; Taran et al., Reference Taran, Lebedev and Platonov1993; Bosi et al., Reference Bosi, Skogby, Hålenius and Mills2022b) could be explained by differences in local cation ordering. This suggests that Ti4+ acts as colour-causing agent in combination with Mn2+ and Fe2+ in the yellow–green zone of the San Silvestro sample, consistent with the Ti enrichment of this zone (TiO2 up to 0.11 wt.%). Concerning the E⊥c spectrum of the Fucili sample, the weak band at ~24500 cm–1 in is caused by spin-forbidden electronic transitions in [6]-coordinated Mn2+ (Rossman and Mattson, Reference Rossman and Mattson1986). Overall, these data are in agreement with the paleness of the yellow–green zone of Fucili sample, which is also much thinner than that of the San Silvestro sample (Fig. 2b–c).
(OH) band assignment
In the structure of tourmaline, the O1 site (≡ W) is surrounded by three Y cations, whereas the O3 site (≡ V) is surrounded by one Y and two Z cations. The highest energy bands above 3600 cm–1 correspond to O–H stretching vibrations at the O1 site, whereas bands in the range 3600–3400 cm–1 are associated with OH vibrations at the O3 site (e.g. Gonzalez-Carreño et al., Reference Gonzalez-Carreño, Fernandez and Sanz1988; Bosi et al., Reference Bosi, Skogby, Lazor and Reznitskii2015). The O1(OH) stretching modes are affected by the X-site constituents, with the bands between ~3600–3700 cm–1 normally assigned to X□, whereas bands above 3700 cm–1 are considered associated with XNa+ for electrostatic repulsion reasons between cations at X-site and H+ of the O1(OH) group (e.g. Gonzalez-Carreño et al., Reference Gonzalez-Carreño, Fernandez and Sanz1988; Berryman et al., Reference Berryman, Wunder, Ertl, Koch-Müller, Rhede, Scheidl, Giester and Heinrich2016).
On the basis of studies of Bosi et al. (Reference Bosi, Skogby, Agrosì and Scandale2012, Reference Bosi, Skogby and Balić-Žunić2016, Reference Bosi, Celata, Skogby, Hålenius, Tempesta, Ciriotti, Bittarello and Marengo2021) and Watenphul et al. (Reference Watenphul, Burgdorf, Schlüter, Horn, Malcherek and Mihailova2016), the four main FTIR bands between 3465 and 3587 cm–1 are probably caused by the occurrence of the atomic arrangements 3[Y(Li,Fe2+,Mn2+,Al)ZAlZAl]−O3(OH)3. The bands between 3600−3700 cm–1 are probably caused by the arrangements Y[(Li,Fe2+,Mn2+)(Mn2+,Al)Al]−O1(OH)−X(□), whereas the weak band above 3700 cm–1 can be ascribed to Y[(Li,Fe2+,Mn2+)(Mn2+,Al)Al]−O1(OH)−X(Na). These possible short arrangements are consistent with the compositional characteristics of both blue zones, specifically Fe-bearing tourmalines that are ZAl- and Y(Al1.5Li1.5)-dominant.
Petrogenesis and evolution of the blue growth zones in tourmaline crystals from Elba Island
The rarity of the blue growth zone in tourmaline crystals from Elba Island could be linked to unusual environmental conditions that are responsible for the compositional variation and, thus, the colour changes observed along the crystals. Our data indicate that the blue colour of San Silvestro and Fucili samples is related to a slight enrichment in Fe2+ in the crystallisation environment.
The formation of yellow–green colouration at the base of the tourmaline crystals from Fucili and San Silvestro pegmatites, required specific geochemical conditions: the original pegmatite-forming melt, a B-rich peraluminous melt, must be enriched in Mn and relatively low in Fe (Bosi et al., Reference Bosi, Pezzotta, Altieri, Andreozzi, Ballirano, Tempesta, Cempírek, Škoda, Filip, Čopjacová, Novák, Kampf, Scribner, Groat and Evans2022a). Moreover, during the early stages of tourmaline crystallisation, Fe must be removed. The most probable mechanism for depleting Fe from the pegmatitic melt is early crystallisation of an Fe-rich mineral, such as biotite, or garnet, or Fe-sulfides. Biotite is a typical paragenetic mineral in the Fucili and San Silvestro pegmatites. Additional removal of Fe during the evolution of pegmatite crystallisation is guaranteed by the development of schorl. Furthermore, Mn must be preserved when highly evolved Li-rich tourmaline starts to crystallise; this can be only achieved when spessartine garnet (the main competitor for Mn in Elba pegmatites) is absent or has crystallised during the very early stages of the pegmatite evolution. Spessartine crystallisation is recognised as an important mechanism for regulating the Mn content during the evolution of the pegmatite systems (Novak et al., Reference Novák, Selway, Černý, Chapman and Masau2000; Laurs et al., Reference Laurs, Simmons, Rossman, Fritz, Koivula, Anckar and Falster2007). In the Elba tourmalines investigated, Mn incorporation during the early stage of tourmaline crystallisation occurred when spessartine was not crystallising. This led to the Mn-rich yellow–green zone in the initial part of both crystals, followed by a decrease in Mn content in the remaining part as a consequence of Mn depletion in the system by tourmaline crystallisation.
During the latest stages of the Fucili and the San Silvestro miarolitic cavity growth, a further change in the fluid compositions occurred. This change is recorded by the presence of blue growth zones at the analogous pole of tourmaline crystals in some cavities from both pegmatites, corresponding to an increased Fe content. We interpret the formation of such blue growth zones in the tourmalines investigated as evidence of partial opening of the geochemical system at the scale of the cavities, which allowed some minor addition of Fe to the crystallising fluids. Dutrow and Henry (Reference Dutrow and Henry2000) also invoked cavity opening for stabilising/destabilising different tourmaline compositions. Indeed, textural and paragenetic observations of the cavities in which tourmaline samples were collected reveal that such pockets are associated with a series of micro-fractures, which crosscut some early formed tapering biotite crystals hosted in the surrounding solid pegmatitic rock. Such crystals appear also partially altered (bleached) along the fractures and at their rims.
In our model, the late-stage minor fracturing phenomenon, possibly related to thermal contraction during the cooling of the rock, allowed the cavity fluids to infiltrate the surrounding solid pegmatite and locally react with the cross-cut tapering biotite crystals. This led to the formation of a new generation of ‘white mica’ and the release of Fe that diffuses within the cavity fluids. The crystallising tourmaline registered this event with a bluish growth zone slightly richer in Fe2+, which ceased to grow when no more Fe was available in the system. This partial opening of the geochemical system is probably similar, though much less developed than the one associated with the formation of the well-known black-cap tourmaline crystals from Elba pegmatites (Bosi et al., Reference Bosi, Pezzotta, Altieri, Andreozzi, Ballirano, Tempesta, Cempírek, Škoda, Filip, Čopjacová, Novák, Kampf, Scribner, Groat and Evans2022a). This system is probably related to more-or-less extensive fracturing and even pocket collapse before the end of the cavity crystallisation, when abundant and reactive fluids were still present. This scenario could be similar to the one that led to the formation of the ‘blue capped’ tourmalines from Queen Mine (Pala, California, USA). However, because the blue colour of these tourmalines is also influenced by Ti and Fe3+, this required the availability of a low amount of Ti in the environment and mild oxidising conditions.
Conclusions
The comparison between the composition of the San Silvestro and the Fucili samples, characterised by a blue growth zone in the upper part of the crystal, suggests a common crystallisation environment. Originally, the environment was rich in Mn and poor in Fe, to account for the Mn-enrichment at the base of the crystals. Here, a yellow–green colouration is related to Mn2+ and, for the San Silvestro sample, to Ti4+ in combination with Mn2+ and Fe2+, as colour-causing agents. Fluorine content in pegmatitic melts has been correlated to Mn (e.g. Selway et al., Reference Selway, Novák, Černý and Hawthorne1999). This is valid for the San Silvestro sample, where the higher availability of Mn, and consequently F, in the early-stage of crystallisation, led to the formation of fluor-elbaite at the base of the crystal. Subsequently, in both cases, a late-stage minor fracturing phenomenon led to a partial opening of the geochemical system at the scale of the cavities. This allowed cavity fluids to infiltrate the surrounding pegmatite and locally react with early-formed biotite crystals. As a result, the corrosion and alteration of such Fe-rich crystals due to leaching processes (i.e. mineral dissolution, hydrothermal reactions) were responsible for the availability of Fe in the crystallisation environment and thus the formation of the blue-growth zone in the upper part of the crystals. The blue colour is caused exclusively by pure spin-allowed d-d transitions in [6]-coordinated Fe2+ without the influence of Ti or Fe3+. The presence of Fe only in the divalent state suggests that all the above described events occurred during the latest stages of crystallisation and did not change the redox state of the environment, which remained as reducing. This interpretation is consistent with a partial opening of the cavity system associated with the minor fracturing phenomena.
This work represents the first detailed chemical and spectroscopic study on tourmaline crystals with a blue growth zone from Elba Island. Furthermore, it contributes to the understanding on the origin and composition of fluids involved in tourmaline crystallisation, which are responsible for the colour changes at the analogous termination observed in Elba tourmaline crystals.
Acknowledgements
Sample preparation for chemical and spectroscopic analyses was carried out with the support of Dr. D. Mannetta to whom the authors express their gratitude. The authors sincerely thank M. Serracino for his assistance during chemical analyses. F.B. acknowledges funding by Sapienza University of Rome (Prog. Università 2020) and by the Italian Ministry of Education (MIUR)–PRIN 2020, ref. 2020WYL4NY. The authors sincerely thank Barbara L. Dutrow and an anonymous reviewer for their constructive comments that helped to improve the manuscript.
Competing interests
The authors declare none.


 Open access