

1 Introduction
Virtually all industrialized countries guarantee a certain minimum income in old age. To do so, they provide supplemental benefits that are typically means-tested and whose eligibility is determined by both income and assets. In the Organisation for Economic Co-operation and Development (OECD) countries means-tested retirement benefits provide almost 22% of average earnings; approximately 17% of individuals above age 65 claim such supplemental benefits (OECD, 2011). While means-tested benefits are a parsimonious way of alleviating poverty in old age, they are also likely to increase the likelihood to cash out second pillar pension wealth at retirement. The latter is an important element to consider in pension reforms as reliance on individual retirement savings is increasing. Many observers fear that the recent abolishment of mandatory annuitization of old age balances in the UK would increase costs of social assistance later in life.
In this paper we show such fears are not unwarranted. Indeed, by comparing the predictions from a calibrated life-cycle model with unique data on individual cash-out decisions at retirement, we can show that means-tested benefits generate strong incentives to cash-out accumulated pension wealth at retirement even if full annuitization was optimal in the absence of means-tested benefits. Because the latter guarantee a minimum income in retirement, they provide not only additional free income, but also an implicit insurance against the financial consequences of longevity similar to an annuity contract.
Given the size of means-tested social insurance programs in many industrialized countries, low annuitization rates may thus not be that surprising. The real world example of Switzerland nicely illustrates the basic mechanisms at work: maximal first pillar benefits amount to roughly CHF 2,000 per month.Footnote 1 At the same time, means-tested supplements to first pillar benefits lift the effective minimum income to roughly CHF 3,000 a month. An individual with a monthly second pillar benefit of less than CHF 1,000 a month (corresponding to accumulated occupational pension wealth of approximately CHF 170,000) and no other wealth, is always better off withdrawing the money upon retirement, spending it down in the years after retirement and then applying for means-tested benefits. For middle-income individuals there is a trade-off. The retiree weighs the benefits from taking the lump sum, ‘free’ means-tested benefits after depletion of funds, against the disadvantages, a lower degree of longevity insurance and a non-flat consumption pattern. Descriptive evidence is consistent with the incentives generated by means-tested benefits. Using micro data from pension providers Bütler and Teppa (Reference Bütler and Teppa2007) and Bütler et al. (Reference Bütler, Staubli and Zito2013) show that the probability to annuitize increases in pension wealth.
Annuities provide sizeable utility gains for the individual as Yaari (Reference Yaari1965) already demonstrated in his seminal paper: a life-cycle consumer without a bequest motive should choose to annuitize his entire wealth to insure longevity risk. Davidoff et al. (Reference Davidoff, Brown and Diamond2005) show that positive, but not necessarily complete annuitization survives even with market incompleteness, liquidity constraints, as well as in the presence of bequest motives and under habit formation preferences. However, when international numbers are analyzed, it is apparent that when given a choice, only a minority annuitizes voluntarily even in countries in which the pre-existing annuitization implied by the public pension system is small. A great amount of literature has attempted to shed light on the ‘annuity puzzle’.Footnote 2 Nonetheless, the low observed annuitization rates remain hard to reconcile with economic theory.Footnote 3
To test the predictions from economic theory, previous studies have primarily relied on self-reported annuitization choices or ex ante intentions to annuitize using survey data. This paper directly compares the quantitative predictions from a calibrated life-cycle model with actual annuitization choices, involving large stacks of money. The impact of means-tested benefits on optimal annuity demand and consumption/savings decisions is measured using a realistic life-cycle model with a social security scheme in which means-tested benefits can be claimed if income and wealth fall below a certain level. The model also includes inflation and equity risk, and allows for differential tax treatments of annuity payments versus lump sum withdrawals. We show that means-tested benefits have a quantitatively important impact on the probability to annuitize. The effect is especially large for retirees with a low income and wealth level. In the absence of means-tested benefits, most individuals would annuitize their second pillar pension wealth. However, the optimal annuity level is often zero when means-tested supplemental income is available.
The model is calibrated to Switzerland, which is an interesting case study for a number of reasons. A relatively low level of pre-existing annuitization from the first pillar goes hand in hand with generous means-tested benefits that guarantee an income in retirement, which exceeds first pillar benefits by roughly 50%. Most individuals have accumulated a large capital stock at retirement through the mandatory occupational pension scheme. The average capital stock of approximately CHF 300,000–350,000 translates into a second pillar income that approximately equals first pillar benefits.
In contrast to most other countries, the Swiss second pillar shows a considerable variability of cash-out decisions against which the theoretical predictions can be compared. The administrative data we compiled from Swiss occupational pension providers confirm the model's clear pattern: Individuals with low pension wealth levels tend to take the lump sum while those with higher second pillar pension wealth annuitize more often. Moreover, the observed annuity decisions of individuals is close to the optimal annuitization rate predicted by our model. Means-tested benefits can thus provide a potential explanation for the low voluntary annuitization of second pillar pension wealth and financial wealth of individuals.
The model's good fit with the data also allows for policy experiments in which the costs and welfare implications of alternative poverty-alleviation schemes which guarantee the same (means-tested) income level: stricter asset test rules, a minimum income requirement policy restricting cash-out decisions, and mandatory annuitization. We find that stricter eligibility tests or requiring individuals to annuitize a certain but limited amount of their pension wealth can reduce the costs of these schemes substantially, while not reducing welfare too much.
Our paper relates to several studies that have examined the effect of means-tested social insurance programs on savings, purchase of private insurance, and labor supply. Theoretical work by Hubbard et al. (Reference Hubbard, Skinner and Zeldes1995) and Sefton et al. (Reference Sefton, Van De Ven and Weale2008) demonstrate that means-tested welfare programs discourage savings by households with low expected lifetime income. Empirical evidence for this prediction is provided by Neumark and Powers (Reference Neumark and Powers1998) and Powers (Reference Powers1998) using US data. Exploiting variation across US states in Supplemental Security Income (SSI) benefits, Neumark and Powers (Reference Neumark and Powers2000) demonstrate that generous SSI benefits reduce pre-retirement labor supply of older men. The existing literature has largely ignored the role of means-tested social insurance programs on the decision to annuitize pension wealth. The only exception, to our knowledge, is Pashchenko (Reference Pashchenko2013) who investigates different determinants of the annuitization decision using a model parameterized for the USA. In contrast to her study, we perform an empirical analysis to validate our conjecture and show that a life-cycle model with means-tested benefits matches empirical annuity decisions well.Footnote 4
The paper proceeds as follows. Section 2 describes the life-cycle model used for the simulations of annuitization decisions in the presence of means-tested benefits. Section 3 gives an overview of the Swiss pension system to which the model is calibrated and which serves as an illustration for the quantitative impact of means-tested benefits. The data used to verify the predictions of our model is presented in Section 4. Section 5 presents the results of the empirical analysis and discusses alternative interpretations of a positive relationship between pension wealth and the likelihood to annuitize. Implications for income policy in old age are discussed in Section 6. Section 7 concludes.
2 A life-cycle model during retirement with means-tested benefits and optimal annuitization
An annuity, even small, is detrimental to the eligibility for income- or asset-tested benefits. If the combined income from the first and second pillar is below the minimum income guaranteed by means-tested benefits, an individual can increase the present value of his income choosing the lump sum, spending the money, and later applying for means-tested benefits. While the incentives for individuals with low pension and non-pension wealth are straightforward, for middle-income individuals there is a trade-off. The retiree weighs the benefits from taking the lump sum – ‘free’ means-tested benefits after withdrawal – against the disadvantages, a decrease in consumption once the capital is depleted and a lower level of longevity insurance.
Institutional features, which are often specific to a country, also influence annuitization decisions. First, the eligibility for means-tested benefits usually depends on total wealth and not only on pension wealth (with the possible exemption of housing wealth). Even for low levels of pension wealth, taking the annuity may be optimal if non-pension wealth is high. Second, differences in taxation may either favor one of the two polar options (100% annuitization versus 100% lump sum) or induce a certain optimal split between the two. Third, since annuities are typically not indexed to inflation, uncertainty about future prices may reduce the demand for these annuities. People might be induced to keep a certain amount of wealth liquid to smooth real consumption in the presence of inflation shocks.
The next section presents a life-cycle model that incorporates several important aspects of the annuitization decision, including means-tested benefits, non-pension wealth, differential taxation of the annuity income compared with the lump sum, and stochastic asset return and inflation rates. To facilitate the analysis, we focus on single individuals. The numerical method to solve this life-cycle problem is described in detail in the Web Appendix.
2.1 Individual's preferences and constraints
Our analysis focuses on the retirement phase of the life cycle. There is no active decision with respect to the retirement timing. At the beginning of his retirement period the individual decides on the fraction of pension wealth to be annuitized. The amount withdrawn as a lump sum is subject to an immediate tax.Footnote 5 For the entire remaining life the individual receives an annuity income from the first and second pillar on which regular income taxes are levied. The individual decides optimally how much to consume and how to divide the remaining wealth between stocks and bonds. In each period, he also takes into account the possibility of claiming means-tested benefits. More formally, we examine an individual during retirement with age t = 1,…,T, where t = 1 is the retirement age and T is the maximum age possible. Let p t denote the probability of surviving to age t, conditional on having lived to period t−1. The individuals’ preferences are presented by a time-separable, constant relative risk aversion utility function and the individual derives utility from real consumption, C t . Lifetime utility equals
 $$V = {E_0}\left[ {\sum\limits_{t = 1}^T {\beta ^{t - 1}}\left( {\left( {\prod\limits_{s = 1}^t {\,p_s}} \right)\displaystyle{{C_t^{1 - \gamma}} \over {1 - \gamma}}} \right)} \right],$$
where β is the time preference discount factor, γ denotes the level of risk aversion, and C
t
is the level of date t real consumption. Nominal consumption is given by $\overline {{C_t}} = {C_t}{\Pi _t}$
, where Π
t
is the price index at time t.
$\overline {{C_t}} = {C_t}{\Pi _t}$
, where Π
t
is the price index at time t.
At retirement, second pillar wealth, Wpw , can be transformed into an annuity income, taken as a lump sum, or a combination of both:
 $${W^{\,pw}} = {W^{ls}} + {W^a}.$$
Wls is the amount taken as a lump sum, while Wa is the part of the pension wealth annuitized. Second pillar pension wealth taken as a lump sum is subject to a tax τ ls once. The tax rate is increasing in the amount withdrawn. Total net wealth at time t = 1, W 1, is the sum of after-tax pension wealth plus non-pension financial wealth, Wnpw :
 $${W_1} = (1 - {\tau _{ls}}){W^{ls}} + {W^{npw}}.$$
The annuity income, $Y_t^{II} $
, is given by
$Y_t^{II} $
, is given by
 $$Y_t^{II} = {W^a}c,$$
with c being the conversion rate prescribed by law (it is basically the inverse of the annuity factor). The second pillar annuity income provides a nominal income, while the first pillar income is inflation protected. The income tax, τ i , is progressive and levied over the sum of first and second pillar pension income.
Net means-tested benefits M t equal
 $$M_t = \max (\tilde{M}_t - Y_t^I - Y_t^{II} - r{W_t} - g{W_t},0)$$
where $\tilde{M}_t$
is the guaranteed consumption level. The applicable income for the determination of means-tested benefits consists of first pillar pension income
$\tilde{M}_t$
is the guaranteed consumption level. The applicable income for the determination of means-tested benefits consists of first pillar pension income $Y_t^I $
, second pillar pension income
$Y_t^I $
, second pillar pension income $Y_t^{II} $
, investment income (wealth times a fictitious investment return r), and a fraction g of wealth. The income numbers
$Y_t^{II} $
, investment income (wealth times a fictitious investment return r), and a fraction g of wealth. The income numbers $Y_t^I $
and
$Y_t^I $
and $Y_t^{II} $
are defined net of taxes.
$Y_t^{II} $
are defined net of taxes.
There are two assets individuals can invest in: stocks and a riskless bond. w
t
is the fraction invested in equity, which yields a gross nominal return of R
t+1. The nominal return on the riskless bond is denoted by $R_t^f $
. The intertemporal budget constraint of the individual is, in nominal terms, equal to
$R_t^f $
. The intertemporal budget constraint of the individual is, in nominal terms, equal to
 $${W_{t + 1}} = ({W_t} + Y_t^I + Y_t^{II} + {M_t} - \overline {{C_t}} )(1 + R_t^f + ({R_{t + 1}} - R_t^f ){w_t}),$$
where W
t
is the amount of financial wealth at time t. If the person receives means-tested benefits, his consumption is always at least as high as the guaranteed income level, $\tilde{M}_t$
.
$\tilde{M}_t$
.
The individual faces a number of constraints on the consumption and investment decisions. First, we assume that the retiree faces borrowing and short-sales constraints
 $${w_t} \ge 0\quad {\rm and}\quad {w_t} \le 1.$$
Second, we impose that the investor is borrowing constrained
 $$\overline {{C_t}} \le {W_t},$$
which implies that the individual cannot borrow against future annuity income to increase consumption today.
2.2 Financial market
The asset menu of an investor consists of a riskless 1-year nominal bond and a risky stock. The return on the stock is normally distributed with an annual mean nominal return μ R and a standard deviation σ R . The interest rate at time t + 1 equals
 $${r_{t + 1}} = {r_t} + {a_r}({r_t} - {\mu _r}) + {\epsilon} \hskip0.5pt_{t + 1}^r, $$
where r
t
is the instantaneous short rate and a
r
indicates the mean reversion coefficient. μ
r
is the long run mean of the instantaneous short rate, and ${\epsilon} \hskip0.5pt_t^r $
is normally distributed with a zero mean and standard deviation σ
r
. The yield on a risk-free bond with maturity h is a function of the instantaneous short rate in the following manner:
${\epsilon} \hskip0.5pt_t^r $
is normally distributed with a zero mean and standard deviation σ
r
. The yield on a risk-free bond with maturity h is a function of the instantaneous short rate in the following manner:
 $$R_t^{\,f(h)} = - \displaystyle{1 \over h}\log (A(h)) + \displaystyle{1 \over h}B(h){r_t},$$
where A(h) and B(h) are scalars and h is the maturity of the bond. The real yield is equal to the nominal yield minus expected inflation and an inflation risk premium.
For the instantaneous expected inflation rate we assume
 $${\pi _{t + 1}} = {\pi _t} + {a_\pi} ({\pi _t} - {\mu _\pi} ) + {\epsilon} \hskip0.5pt_{t + 1}^\pi, $$
where a
π
is the mean reversion parameter, μ
π
is long run expected inflation, and the error term ${\rm \epsilon} _t^\pi {\rm \sim} N(0,\sigma _\pi ^2 )$
. Subsequently the price index Π follows from
${\rm \epsilon} _t^\pi {\rm \sim} N(0,\sigma _\pi ^2 )$
. Subsequently the price index Π follows from
 $${\Pi _{t + 1}} = {\Pi _t}\exp ({\pi _{t + 1}} + {\epsilon} \hskip0.5pt_{t + 1}^\Pi ),$$
where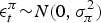 ${\rm \epsilon}_t^{\pi} {\rm \sim} N(0,\sigma_{\pi}^2)$
are the innovations to the price index. We assume there is a positive relation between the expected inflation and the instantaneous short interest rate, that is the correlation coefficient between
${\rm \epsilon}_t^{\pi} {\rm \sim} N(0,\sigma_{\pi}^2)$
are the innovations to the price index. We assume there is a positive relation between the expected inflation and the instantaneous short interest rate, that is the correlation coefficient between ${\rm \epsilon}_t^r $
and
${\rm \epsilon}_t^r $
and ${\rm \epsilon} _t^\Pi $
is positive. The benchmark parameters are presented in Section 3.3.
${\rm \epsilon} _t^\Pi $
is positive. The benchmark parameters are presented in Section 3.3.
3 Calibration: case study Switzerland
In the next step we quantify the impact of means-tested benefits on the cash-out decision at retirement. Switzerland is an interesting case to study as it combines a relatively low level of pre-existing annuitization by the first pillar with a generous income guarantee exceeding first pillar benefits by roughly 50%.
3.1 The Swiss pension system: the first and the second pillar
Switzerland's pension system consists of two main pillars. The first pillar is a publicly financed pay-as-you-go scheme, which provides a basic level of income to all retired residents in Switzerland. The second pillar is an employer-based, fully funded occupational pension scheme, which aims to maintain the pre-retirement living standard in addition to benefits from the first pillar. It is compulsory for all employees with annual earnings above roughly CHF 20,000.
The first pillar is financed by government revenues and a payroll tax, which is proportional to labor income (without any upper bound). Benefits are strongly dependent on the number of years contributed, but only to a limited degree on average labor income. In particular, individuals whose income is high enough to qualify for the second pillar usually get a first-pillar income between 90 and 100% of the maximal first pillar benefits. The statutory retirement age is 64 for women and 65 for men. Working beyond age 64/65 is possible, but most work contracts specify a retirement age that coincides with the statutory retirement age.
The second pillar covers around 96% of working men and 83% of working women. As non-working individuals are not covered, the lowest income quartile – and thus the individuals with the lowest life expectancy – are only marginally included in these schemes. Occupational pension plans are heavily regulated, and although they typically work as a defined contribution system, far reaching income guarantees are included. Including income from the first pillar, the target replacement rate of most pension funds is approximately 50–60% of insured income, corresponding to a net replacement rate of 70–80%.
Income above CHF 80,000 is covered by the so-called super-mandatory part of the system. Although employers are not obliged to offer super-mandatory coverage, a large majority do as occupational pensions are viewed as an important tool to attract qualified workers in a tight labor market. Individuals are automatically enrolled in both the mandatory and super-mandatory part of the plan. They only have very limited investment choice during the accumulation phase. Contributions to the pension plan correspond to a certain fraction of the covered salary (usually 7–18% depending on age) of which the employer has to pay at least half. The capital is fully portable; when an employee starts working at another company, he receives all of the accumulated contributions (including the employer's part). The full sum has to be paid into the new fund.
The accrued retirement capital can be withdrawn either as a monthly life-long annuity (including a 60% survivor benefit), a lump sum or a mix of the two options. A few plans limit the cash-out to 50 or 25% of accumulated capital. Depending on insurer regulations the individual must declare his choice between 3 months and 3 years prior to the effective withdrawal date. Many pension insurers define a default option for the case when the beneficiary does not make an active choice.
Nominal occupational pension annuities are strictly proportional to the accumulated retirement assets.Footnote 6 The conversion rate (or inverse of the annuity factor) is independent of marital status, but depends on retirement age and gender. In the mandatory part the law stipulates a minimum conversion rate, which was 7.2% during the period we have the data for (currently 6.8%). The rate is more generous than the conversion rate in the unregulated market, which is around 5% for a 65-year-old single man.Footnote 7
3.2 Means-tested supplemental benefits in Switzerland
If the total income does not cover basic needs in old age, means-tested supplemental benefits may be claimed as part of the first pillar. Like in most OECD countries, these benefits are means-tested so that only individuals whose income and assets are below a certain threshold are eligible. In Switzerland, these benefits guarantee an income corresponding to around 47% of average earnings, which is considerably above the average in OECD countries of 22% (OECD, 2011). Around 12% of the population in retirement age receive means-tested benefits.Footnote 8 The share of benefit recipients is increasing with age which is consistent with our hypothesis of spending down assets.
Means-tested benefits in Switzerland are determined by subtracting an individual's income from the so-called applicable expenditures. The income used in the calculations of means-tested supplemental benefits is the sum of pension income from first and second pillars, investment income, and earnings plus one-tenth of the wealth exceeding a threshold level of CHF 25,000. The relevant annual expenditures consist of a cost-of-living allowance, a health insurance premium, and rent or interest payments for the mortgage. Summing up all the applicable expenditures, means-tested supplemental benefits guarantee a gross income of approximately CHF 36,000 for singles.
As shown in Table 1, average annual means-tested supplemental benefits, conditional on claiming, for retired beneficiaries in 2008 were CHF 9,600 for single beneficiaries. The cost-of-living allowance, the health insurance premium, and rent payments are the largest categories on the expenditure side, while interest payments on mortgages are negligible. Because the value of a home is taken into account in the calculation of means-tested benefits, home owners rarely qualify for means-tested benefits. The main source of income, other than means-tested benefits, are first pillar benefits.
Maximum and average means-tested benefits of single retired recipients in 2008

Means-tested benefits correspond to the difference between applicable expenditures and income but cover at least the health insurance premium.
3.3 Benchmark parameters
The chosen parameter values for our specification of the life-cycle model are displayed in Table 2. Following related literature (Yogo, Reference Yogo2009; Pang and Warshawsky, Reference Pang and Warshawsky2010) we set the time preference discount factor, β, equal to 0.96. Like Ameriks et al. (Reference Ameriks, Caplin, Laufer and Van Nieuwerburgh2011), we set the risk aversion coefficient γ to 3. We only consider individuals after retirement from age 65 (t = 1) to age 100 (t = 1). For all other parameters we aim to be as close as possible to the Swiss case to facilitate a comparison of the simulation results with actual choices. The survival probabilities are the current male survival probabilities in Switzerland and are obtained from the Human Mortality Database.Footnote 9 We assume a certain death at age 100.
Benchmark parameters

The equity return is normally distributed with a mean annual nominal return, μ R , of 6.5% (corresponding to an equity premium of 4%) and an annual standard deviation, σ R , of 20%, which is in accordance with historical stock performance. The mean instantaneous short rate is set equal to 2.5%, the standard deviation to 1%, and the mean reversion parameter to −0.15. The correlation between the instantaneous short rate with the expected inflation is 0.4. The parameters for the inflation dynamics are estimated with data from the Swiss National Bank from 1921 to 2009. Mean inflation is equal to 1.79%, the standard deviation of the instantaneous inflation rate is equal to 1.12%, the standard deviation of the price index equals 1.11%, and the mean reversion coefficient equals −0.165.
Pillar I annuity income, $Y_1^I $
, is set to CHF 24,000, and is indexed to inflation. This number approximately corresponds to the average first pillar income of individuals covered by occupational pensions. The gross guaranteed income level to determine the means-tested benefits,
$Y_1^I $
, is set to CHF 24,000, and is indexed to inflation. This number approximately corresponds to the average first pillar income of individuals covered by occupational pensions. The gross guaranteed income level to determine the means-tested benefits, $\tilde{M}_t$
, is CHF 36,000 in real terms. Under this assumption the maximum amount of means-tested benefits, M
t
is CHF 12,000.Footnote
10
The fraction of wealth g that is taken into account when calculating means-tested benefits is 0.1.Footnote
11
$\tilde{M}_t$
, is CHF 36,000 in real terms. Under this assumption the maximum amount of means-tested benefits, M
t
is CHF 12,000.Footnote
10
The fraction of wealth g that is taken into account when calculating means-tested benefits is 0.1.Footnote
11
The conversion rate c used to translate the accumulated capital into a yearly nominal annuity income is set to 7.2%, which is the rate applied to second pillar wealth for the period of our data. The values taken for the progressive lump sum tax τ ls and the income tax τ Y are displayed in Appendix A. They represent the applicable tax rates of the largest Swiss city, Zurich. Zurich's tax burden lies in the middle of all Swiss regions. The annuity is treated as normal income and therefore subject to income taxes. The lump sum, on the other hand, is taxed only once and treated independently of other income. Due to the differential tax treatment the present value of the lump sum's total tax bill is almost always smaller than the annuity's tax burden, especially for larger capital stocks.
4 Data
4.1 Data description and limitations
The predictions from our simulated life-cycle model are compared with administrative individual records from several Swiss companies. We compiled this unique dataset from records provided by autonomous pension schemes as well as large insurance companies. While the former are typically sponsored by large companies, the latter provide occupational pension plans for small and medium sized companies. For all companies in our sample, all individual retirement decisions for the period 1996–2006 are recorded.Footnote 12 Each of the 22,600 individuals is observed only once at retirement. The data contain information on the date of birth, the retirement date, annuitization decision, amount of accumulated pension wealth, conversion factor as well as company specific pension scheme information such as default and cash-out options.
We restrict the data on annuitization decisions of men only for three reasons. A number of social security reforms affected women during the sample period (such as an increase in the retirement age for women from 62 to 64 and the introduction of child care credits). Moreover, neglecting spousal income has larger consequences for women than for men, thereby making the difference in decisions across (unobserved) marital status more pronounced. Women also have much smaller balances in the second pillar for the birth cohorts considered.
Our data usually does not record marital status, age, or income of the spouse. Using a similar date set Bütler and Teppa (Reference Bütler and Teppa2007) find little difference in annuitization patterns between married and single men for those pension funds that do provide information about marital status. As our data spans a time period in which married women did not work much, pension wealth for married couples does not exceed that of single men by much. Moreover, the additional income of the first pillar for the spouse just covers the additional expenditures that are credited against means-tested benefits. Hence, for a given second pillar income, a married and a single man face very similar trade-off. The higher money's worth of the annuity for married individuals (due to survivor benefits and higher life expectancy) seems to be offset by a lower demand for insurance of married couples and/or bequest motives.
Since the amount of means-tested benefits depends on total wealth, information on non-pension wealth is important. Unfortunately, this information is not recorded in the administrative data. Therefore, we utilize asset data for Switzerland from waves one, two, and four of the Survey of Health, Aging and Retirement in Europe (SHARE).Footnote 13 More specifically, our sample consists of all retired men between ages 65 and 95 with pension wealth below CHF 750,000 and liquid non-pension wealth below |CHF 1,000,000.Based on this sample, we estimate a joint distribution of pension wealth, liquid non-pension wealth, and illiquid non-pension wealth. We use this joint distribution to calculate a weighted average of the optimal annuitization levels, as described in detail in Section 5.3.
4.2 Summary statistics
Table 3 reports key statistics for the variables of interest. The average retirement age is close to the statutory retirement age of 65 for men. Average total pension wealth is about CHF 257,000. A large fraction of the beneficiaries chose a polar option, either full lump sum or full annuity. Mainly as a consequence of early retirement adjustments, the mean conversion rate in the mandatory part is 6.9, slightly lower than the rate used in the calibrated life-cycle model.
Summary statistics of pension funds data, men

Figure 1 illustrates the relationship between pension wealth and the annuitization level of pension wealth for wealth levels below CHF 750,000.Footnote 14 The solid line represents the fraction of retirees who annuitize fully for different levels of pension wealth.Footnote 15 As 94% of retirees choose one of the polar options, we also consider the annuitization as a binary decision even for the remaining 6% of the sample. Annuitization rates of 50% or more were set to 100%, those below 50% to 0%. Our simulations show that indeed a polar choice is often optimal: the fraction of individuals choosing a polar option is 60%.
Empirical annuitization levels of second pillar pension wealth. We show retirees’ annuitization decisions of second pillar pension wealth in Swiss pension funds. The dots are the individual decisions and the solid line is the fraction of retirees that choose the annuity instead of the lump sum.

The fraction of individuals who annuitize is low for small levels of pension wealth and increases continuously for higher levels of pension wealth. Heterogeneity in non-pension wealth leads to some retirees choosing the annuity, while for the rest taking the lump sum is optimal. As pension wealth increases, the fraction of retirees who take an annuity over a lump sum increases.
5 Results: how means-tested benefits affect annuitization
Our results are organized as follows. First, the impact of means-tested benefits on optimal annuity demand is illustrated using the most basic life-cycle model. Second, we show how the optimal annuity demand changes when inflation and equity risk, non-pension wealth, and taxes are taken into consideration. Third, these simulation findings are compared with the observed annuitization decisions from administrative data. Finally, we discuss and test for alternative explanations of the observed close relation between pension wealth and the likelihood to annuitize.
5.1 Optimal annuity demand: the baseline model
To isolate the impact of means-tested benefits, we start with a baseline annuity model that includes first pillar benefits, but abstracts from equity markets, taxes, inflation, and interest rate risk. The model serves as an illustrative example that highlights the main mechanisms at work. Figure 2 displays the optimal consumption levels in case the entire pension wealth is annuitized or cashed-out, respectively, for two different levels of pension wealth.Footnote 16 The left panel (pension wealth level of CHF 200,000) shows that for the first 10 years of retirement the consumption stream is much higher when the lump sum is taken than if the pension wealth is annuitized. Thereafter consumption is slightly higher in the case of the lump sum compared with full annuitization. The annuity income that can be generated by annuitizing all wealth (CHF 38,000) only marginally exceeds the guaranteed income (CHF 36,000). As a consequence, it is optimal to take the lump sum, spend it down in the first years of retirement, and subsequently apply for means-tested benefits.
Optimal consumption patterns: Illustrative example. The figure displays the consumption pattern if an individual (1) annuitized his entire pension wealth or (2) took the lump sum. Equity, inflation, non-pension wealth, and taxes are excluded from the model, the only risk that agents face is longevity risk. The 7.2% conversion rate of Switzerland is used, which means that the implicit load on the annuity is 12%. If the pension wealth level equals CHF 200,000, it is optimal to choose the consumption stream from the lump sum. If the wealth level is CHF 350,000, the consumption stream from full annuitization is preferred. The guaranteed income equals CHF 36,000.

The right panel of Figure 2 illustrates that for a higher wealth level (CHF 350,000 in the Figure) the lump sum option still generates a higher consumption level during the first 10 years. However, once the lump sum is depleted, the difference between the annuity income (CHF 49,000) and the guaranteed level due to means-tested benefits (CHF 36,000) is much higher. As a consequence, it is optimal to annuitize everything because the benefits from annuitization, consumption smoothing and a higher insured income late in life, outweigh the benefits from a lump sum, receiving ‘free’ wealth in the form of means-tested benefits.
The simple example demonstrates that means-tested benefits reduce the value of an annuity because they replace the benefits the annuity would have otherwise provided. The simulations also show that even those individuals who strategically choose to cash out to qualify for means-tested benefits take some time (16 years in the example) to spend down their entire pension wealth. The utility benefits of consumption smoothing still play some role in the individuals’ decisions. As a consequence the number of beneficiaries of means-tested benefits will go up only later during the retirement period.
Means-tested benefits also increase the likelihood of polar choices. The additional benefits are highest when annuity levels are 0%. Any annuity income would just reduce the means-tested benefits dollar for dollar. In a similar vein, annuitization is most beneficial (in the absence of differential taxation) when the entire capital is annuitized. A partial annuity reduces the value of longevity insurance without increasing the probability of receiving means-tested benefits later in life.
To quantify the impact of means-tested benefits on the value of an annuity, the willingness to pay for access to an annuity market with means-tested benefits is computed. The willingness to pay is defined as the monetary equivalent of the utility gain from following an optimal consumption path in the presence of an annuity market relative to an optimal consumption path in the absence of an annuity market. In a second step, willingness to pay for access to an annuity market without means-tested benefits is calculated. The difference in the willingness to pay between these two cases measures both the reduction in the insurance value of the annuity and the additional income due to means-tested benefits. We use the same baseline annuity model as above, but assume that the single-life annuities we consider are actuarially fair.Footnote 17
Table 4 summarizes the results. Means-tested benefits reduce the optimal annuitization level from 100% to 0% for retirees with less than CHF 300,000 pension wealth (columns 1 and 2), while the willingness to pay for access to the annuity market is always larger in the case retirees cannot claim means-tested benefits (columns 3 and 4). The difference in the willingness to pay is substantial in both absolute and relative terms, as shown in columns 5 and 6. For example, for a retiree with CHF 100,000 pension wealth means-tested benefits reduce the insurance value of the annuity by 13.5%. The fall in the insurance value is highest for retirees with CHF 300,000 pension wealth (17%) and then declines continuously for higher levels of pension wealth.
Reduction in value of annuity due to means-tested benefits

The table presents the willingness to pay (WTP) for access to the annuity market for different pension wealth levels. We use a baseline-type annuity model that includes first pillar benefits and actuarially fair annuities, but abstracts from equity markets, taxes, inflation, and interest rate risk.
5.2 Optimal annuity demand: the full model
Table 5 displays optimal annuity demand for different levels of means-tested benefits using a life-cycle model that includes equity and interest rate risk, inflation and taxes but ignores non-pension wealth. In the absence of means-tested benefits the optimal annuitization level increases with pension wealth from 40% for CHF 100,000 pension wealth to around 80% for CHF 700,000 pension wealth. Recall that this annuitization is on top of an annuity from the first pillar. (The annual first pillar annuity (CHF 24,000) is equivalent to a net present value of more than CHF 300,000.) In the augmented model annuitizing 100% of pension wealth is no longer optimal. Progressivity in both the income tax (which is levied on the annuity) and the tax on the cash-out, in combination with a preferential tax treatment on the lump sum, induce a shift towards a higher cash-out rate for a given capital stock. Moreover, individuals might want to keep part of their wealth liquid to smooth inflation shocks.
Influence of means-tested benefits on optimal annuity levels

The table displays the optimal annuitization levels for varying levels of means-tested benefits. We assume that the agent has zero non-pension wealth. The rest of the parameters are as in the benchmark case.
If means-tested benefits are available, the optimal annuity demand falls sharply for low to intermediate levels of pension wealth. For the maximum means-tested benefits of CHF 12,000, the annuity is no longer optimal for pension wealth below CHF 700,000 in the absence of non-pension wealth. A higher utility level can be achieved by cashing-out pension wealth, spending it down, and subsequently applying for generous means-tested benefits. Wealthier retirees still prefer to annuitize the bulk of retirement balances because a smooth consumption pattern sustained by the annuity dominates the receipt of ‘free wealth’ in the form of means-tested benefits. Table 5 also clearly demonstrates that the availability of means-tested benefits makes the annuitization decision basically a 0–1 decision: individuals either do not annuitize at all or they nearly fully annuitize their pension wealth. The intuition behind this result is the same as in the baseline case: an intermediate degree of annuitization cuts individuals off from means-tested benefits, but does not give them the full benefits of an annuity. In a similar vein, the optimal annuitization level also increases with the level of liquid non-pension. An additional Swiss franc in non-pension wealth has the same impact as an after-tax Swiss franc of pension wealth.Footnote 18
Means-tested benefits create an implicit tax on annuities, as means-tested benefits are foregone by buying the annuity contract.Footnote 19 To quantify the implicit tax, we calculate the average amount of means-tested benefits received when an individual annuitizes optimally and compare this number with the average amount of means-tested benefits received when the individual does not annuitize. The implicit tax of means-tested benefits corresponds to the benefits forgone due to choosing the annuity.
The results of this analysis for two different levels of non-pension wealth are summarized in Table 6. Column 1 shows the gross load, which is the pricing load (again assuming single-life annuities). Columns 2 and 3 report the implicit tax on the annuity in absolute terms and relative to pension wealth. The relative implicit tax is declining with pension wealth, which is consistent with optimal annuitization levels rising with pension wealth. A comparison of panel A and B shows that the implicit tax rate is lower for individuals with more liquid non-pension wealth, because wealthier individuals are less likely to be eligible for mean-tested benefits. Columns 4 and 5 document the net load in absolute terms and relative to pension wealth. The net load is the gross load plus the implicit tax on the annuity. We find that due to the implicit tax net loads for individuals at the lower end of the pension wealth distribution are substantial. This explains why few individuals with low pension wealth annuitize their retirement balances.
The implicit tax of means-tested benefits on annuities

The gross load is the pricing load, which in the Swiss case is equal to 12.1% of pension wealth. The MTB forgone is the average amount of means-tested benefits received when an agent does not annuitize minus the average amount of means-tested benefits when an agent annuitizes optimally. The net load is the MTB forgone plus the gross load.
5.3 Comparing optimal annuity demand with observed decisions
The data clearly show a positive relationship between the accumulated pension wealth at retirement and the fraction of individuals who choose the annuity (see Section 4.2). The more important question is whether the annuitization pattern found in the data is quantitatively consistent with the theoretical model.
In order to calculate the optimal annuity demand we also take into account that individuals differ in their liquid and illiquid non-pension wealth. We calculate a weighted average of optimal annuitization rates as a function of second pillar pension wealth levels. The weights are derived from the empirical joint distribution of pension wealth, liquid non-pension wealth, and illiquid non-pension wealth using SHARE data (see Table A1 in Appendix A).Footnote 20 We assume that individuals can never transform illiquid into liquid non-pension wealth. This is rather conservative approach, which is tantamount to infinite liquidation costs, potentially underestimates the incentive to spend down non-pension wealth in order to claim means-tested benefits.Footnote 21 There are two ways to calculate and interpret the optimal annuity demand: (1) the percentage of individuals who primarily opt for the annuity, i.e., choose to annuitize more than to cash out; or, (2) the percentage of pension wealth invested into annuities as a function of pension wealth. In what follows below we focus on (1) – the percentage of individuals who choose the annuity instead of the lump sum – as in the data almost all individuals either choose full annuitization or zero annuitization.Footnote 22 Hence, we round up the optimal annuity demand to 100%. The numbers in case we do not round up the annuity level to 100% are included as a robustness check.
In Figure 3 the optimal annuitization pattern predicted by the calibrated life-cycle model is compared with its empirical counterpart. The solid line shows the data: the observed fraction of individuals who take an annuity as a function of pension wealth. We first focus on case (1) in which individuals are assumed to either fully annuitize or not at all. The dashed line and the solid line with squares illustrate the predicted likelihood to annuitize in the presence or absence of means-tested benefits, respectively. When means-tested benefits are unavailable, 100% of individuals with pension wealth between CHF 150,000 and CHF 250,000 are predicted to choose (close to) full annuitization, which is clearly at odds with the data. In both the data and the model the likelihood to take the annuity increases with pension wealth. The fraction of individuals who are expected to annuitize drops dramatically when they have access to means-tested benefits. The predicted optimal likelihood to annuitize in the presence of means-tested benefits (dashed line) is remarkably close to the data (solid line). The empirical annuitization patterns in Switzerland seem to be consistent with the proposed explanation of means-tested benefits creating strong incentives to cash-out pension wealth. For case (2), which shows the predicted fraction of retirement capital taken as an annuity, the match between the data (solid line) and simulations (dotted line) remains close.Footnote 23
Comparison optimal annuitization pattern and empirical annuitization pattern. The figure displays the optimal and the empirical average percentage of people that annuitize for different wealth levels. The optimal annuity level is displayed for two cases: (1) agents can apply for means-tested benefits (MTB) and (2) agents cannot apply for means-tested benefits. The optimal percentage is the weighted average of all the optimal annuitization levels for different levels of liquid-non pension wealth and illiquid non-pension wealth. Weights derived from SHARE-Switzerland data are used, assuming independency between pension wealth, illiquid non-pension wealth, and liquid non-pension wealth. There are two ways we calculate and interpret the optimal annuity demand: (1) the percentage of individuals who primarily opt for the annuity, i.e., choose to annuitize more than to cash out; or, (2) the percentage of pension wealth invested into annuities as a function of pension wealth. The first is the baseline case, for which we round up all annuity levels above 50% to 100%. All the parameters are as in the benchmark case.

5.4 Alternative explanations
The literature shows that wealthier people tend to live longer than poorer individuals. For example, De Nardi et al. (Reference De Nardi, French and Jones2010) find a difference in life expectancy at age 70 of 4.6 years between the lowest and the highest income quintile in the USA. Annuities are relatively more attractive for people with a longer life expectancy and thus for wealthier individuals. This can potentially result in a similar annuitization pattern as the one observed in the Swiss case: high annuitization for people with high pension wealth and low annuitization for people with low pension wealth.
Unfortunately, data on mortality differences by (pension) wealth are not available in Switzerland. We therefore use a very conservative test of the importance of differential mortality as a competing explanation, based on the US mortality difference of 4.6 years (De Nardi et al., Reference De Nardi, French and Jones2010). This difference is likely to be larger than the Swiss mortality difference because the lowest income quintile is only partially covered by occupational pension plans. To isolate the effect of differential mortality we assume that individuals cannot apply for means-tested benefits.Footnote 24 The optimal annuitization pattern is computed assuming that longevity depends on pension wealth. To do so, we divide agents into four groups: 50 and 100 pension wealth, 200 and 300 pension wealth, 400 and 500 pension wealth, and 600 and 700 pension wealth.Footnote 25 Following De Nardi et al. (Reference De Nardi, French and Jones2010) we then assume that the difference in life expectancy between the poorest and the richest is 4.6 years. More specifically, we adjust the life expectancy in each bin as follows:
-
1st group's difference in life expectancy relative to average: −2.3 years
-
2nd group's difference in life expectancy relative to average: −0.77 years
-
3rd group's difference in life expectancy relative to average: +0.77 years
-
4th group's difference in life expectancy relative to average: +2.3 years
Individuals in the lowest quartile of pension wealth are assumed to live 4.6 years less than individuals in the highest quartile. Figure 4 shows (1) the empirical annuitization pattern (solid line), (2) the optimal annuitization patterns assuming uniform mortality rates and means-tested benefits (dashed line), and (3) the optimal annuitization pattern assuming differential mortality rates but no means-tested benefits (dot-dashed line). The pattern generated by differential mortality deviates substantially from the observed annuitization pattern: while only 40% of individuals in the first quartile of pension wealth annuitize, 100% of individuals annuitize in the second to fourth quartile. Thus, differential mortality alone is unable to reproduce the empirical annuitization pattern.
Can differential mortality explain annuitization pattern? Individuals are divided into 4 bins: 50–100 pension wealth, 200–300 pension wealth, 400–500 pension wealth, and 600–700 pension wealth. The survival probabilities correspond to differences to average life expectancy as follows: 1st bin's average −2.3 years, 2nd bin's average −0.77 years, 3rd bin's average +0.77 years, and 4th bin's average +2.3 years.

In reality, the case for differential mortality is even weaker for the Swiss case. First, as previously mentioned, the Swiss occupational scheme does not cover the poorest individuals. This latter group usually accounts for the bulk of mortality differences between wealth groups. Second, differential mortality is typically far less prevalent in European countries than in the USA. Using Dutch data, Kalwij et al. (Reference Kalwij, Alessie and Knoef2013) find that the difference in life expectancy between 65-year old men with a low income (defined as minimum income or no income) and 65-year old men with high income (defined as two times the median) is at most 3 years, which is substantially less than in the USA.Footnote 26
Home equity could be another competing explanation for the positive correlation between the fraction of individuals who take an annuity and pension wealth. As shown by Davidoff (Reference Davidoff2009), home equity can reduce the demand for annuities and long-term care insurance if people sell their homes only if they live a long time or require long-term care. The reduction in annuity demand due to housing is likely to be strongest among the poor compared with the rich because housing wealth usually accounts for a larger share of total wealth. However, this aspect should play a smaller role in the Swiss context. Homeownership rates are low by international comparison, at approximately 40% (2010) they are far lower than the US homeownership rate. Moreover, for the wealth range we consider in our analysis home equity as a share of total wealth is relatively constant, as shown in Figure 5. For retired men with second pillar pension wealth below CHF 750,000 housing wealth as a fraction of total wealth is roughly constant at 40%.
Housing wealth as a share of total wealth. The figure displays housing wealth as a share of total wealth for different levels of pension wealth. Housing wealth, pension wealth, and total wealth are calculated using asset data from SHARE-Switzerland.

6 Policy implications and discussion
Means-tested programs in old age differ in both generosity (guaranteed income in old age) and the strength of the asset test. In Switzerland the supplemental income is on top of first pillar pension income and guarantees a much higher level of income than in other countries such as the USA or Australia. Individuals who have CHF 24,000 of pension income can still apply for an additional CHF 12,000 of supplemental income. Only one-tenth of the wealth above a threshold level of CHF 25,000 is taken into consideration. In the US program retirees are only eligible if they have less than $2,000 (=CHF 1,900) of assets. For this reason only 5% of the population over age 65 receives supplemental income in the USA. Although this number underestimates the impact of means-tested benefits as it ignores means-tested benefits via Medicaid, the impact of US means-testing programs on annuitization choices are more limited.
Motivated by the US SSI program we also explore the impact of stricter asset eligibility rules (conditional on the same level of guaranteed income). We assume that the means-tested benefits are reduced dollar for dollar with income.Footnote 27 Figure 6 compares the effect of means-tested benefits (dashed line) and the more stringent asset test (consumption floor, dotted line). Stricter asset tests increase the probability to annuitize compared with the less stringent (Swiss) rules. They thus reduce the costs of means-tested benefits via two channels: First, stricter asset rules delay the onset of benefit payments as wealth has to be depleted first. Second, they induce a larger fraction of the population to annuitize pension wealth.
Comparison of the influence of (1) means-tested benefits with less strict asset rules (benchmark case) and (2) means-tested benefits with strict asset rules (dollar for dollar reduction) on optimal annuitization levels. The figure displays the optimal and the empirical average fraction annuitized for varying wealth levels. The optimal fraction is displayed assuming agents can receive (1) means-tested benefits facing less strict asset rules a (2) means-tested benefits with strict asset rules (dollar for dollar reduction). The optimal fraction is the weighted average of all the optimal annuitization levels for varying liquid-non pension wealth and illiquid non-pension wealth. Weights derived from SHARE-Switzerland data are used, assuming independency between pension wealth, illiquid non-pension wealth, and liquid non-pension wealth. All the parameters are as in the benchmark case.

To quantify the costs of offering means-tested benefits we compare the benchmark case, (1) means-tested benefits as in the Swiss example, with alternative poverty-alleviation schemes in old age: (2) mandatory annuitization (as for example in the Netherlands), (3) a minimum income requirement (MIR, as in the UK until 2014) and (4) a stricter asset test (comparable with the US case).Footnote 28
All counterfactual policies are assumed to guarantee the same gross minimum income in old age (CHF 36,000 per year), but do this in different ways. The benchmark case does not put any restrictions on individuals’ annuitization choices and retirees are allowed to keep a certain amount of wealth and can still be eligible for supplemental income. For the first alternative (2), we compute the costs for the government with mandatory full annuitization. For the second alternative (3), individuals are required to annuitize pension wealth, but only up to the amount that would guarantee a nominal income equal to the level provided by means-tested benefits just after retirement. This is the so-called minimum income requirement (MIR), which was used in the UK until 2014. To guarantee an income equal to the guaranteed income level, individuals need to annuitize at least CHF 167,000 of their pension wealth.Footnote 29 In all these schemes, individuals are eligible for the same supplemental income schemes (including less strict assets tests as in the Swiss case) in case their combined income falls short of the guaranteed income. As a final alternative (4) we consider stricter asset tests to qualify for additional benefits, also called consumption floor. The minimum income is the same as the income guaranteed by means-tested benefits in the Swiss benchmark case. It puts no restrictions on the cash out decision and thus ensures that a retiree will always receive an amount deemed necessary to finance a decent living. In contrast to the benchmark case, however, it requires individuals to run down their entire wealth before applying for supplemental financial assistance.
In a first step we compare the impact of the different policy alternatives on individuals’ utility. Figure 7 shows the certainty equivalent consumption as a function of accumulated pension wealth. The benchmark policy obviously dominates all other options in terms of individual utility as it puts the least restrictions on individual choice and offers the most generous protection. Using the same argument, the minimum income requirement scheme dominates the mandatory full annuitization system. The ranking of a stricter asset test policy relative to the minimum income requirement and the mandatory full annuitization case is not clear a priori. Furthermore, the utility from the stricter asset test scheme (but with unrestricted cash-out decision) is very close to the utility when imposing a minimum income requirement.
Certainty equivalent consumption for different old-age poverty alleviation schemes assuming zero liquid non-pension wealth (in |CHF 1,000). All the parameters are as in the benchmark case.

In a second step, we quantify the public costs of the different schemes by calculating the average net present value of means-tested benefits a person claims over a lifetime for different levels of pension wealth. Because we assume that non-pension wealth is zero, our numbers form an upper bound for these costs. Table 7 shows the average net present value of means-tested benefits per person for the four policies and the willingness to pay to have one policy compared with another policy. In the benchmark case an individual with CHF 100,000 pension wealth generates average costs of CHF 146,000 due to supplemental income. For an individual with the same wealth level mandatory full annuitization decreases the net present value of costs to CHF 101,000, and a stricter resource test policy to CHF 95,000.
Comparison different poverty alleviation policies

The table displays the average net present value (NPV) of means-tested benefits received by the agents, as well as the willingness to pay (WTP) to have a different policy. Liquid non-pension wealth is set to zero. The MTB column displays the NPV of means-tested benefits when the benchmark means-tested benefits policy is in place. The MIR column displays the NPV of means-tested benefits when the minimum income requirement policy is in place. Under the MIR policy, agents are obliged to annuitize pension wealth at least up to the amount that would guarantee a nominal income equal to the level provided by means-tested benefits. The dollar for dollar MTB reduction column displays the NPV of means-tested benefits when this policy is in place. The dollar for dollar MTB reduction column is a strict asset test policy under which means-tested benefits are reduced dollar for dollar with wealth.
The difference in costs between poverty-alleviation schemes is relatively small for low levels of pension wealth because these beneficiaries can claim supplemental income regardless of the scheme in place. The difference in costs for the government is higher in both absolute and relative terms for intermediate levels of pension wealth (CHF 200,000–400,000). For wealthier individuals the difference in costs is declining; for these retirees the value of a flat consumption plan exceeds the value of potential supplemental income.
It is possible to provide income protection in old age at substantially lower costs than in the benchmark case. Stricter eligibility tests or requiring individuals to annuitize a certain amount of their pension wealth impose less restriction on individual choice than mandatory annuitization and at the same time reduce the negative impact generated by individuals strategically reducing the fraction of pension wealth annuitized. However, it is generally impossible to rank the costs of stricter asset and income tests with respect to the other alternatives. This is also true for individual utility. Column 2 in Table 7 shows that an individual with CHF 100,000 pension wealth would be willing to pay CHF 84,000 to have access to the benchmark scheme instead of a minimum income requirement policy (which is equivalent to mandatory annuitization in this case). The willingness to pay for the benchmark scheme is almost twice that of the cost differential between the benchmark and MIR (CHF 146,000–101,000).
Combining Table 7 and Figure 7, it is obvious that neither of the policies can generate similar utilities without being also more costly, hence no poverty-alleviation policy is strictly dominated by another. Lowering the costs for the tax payers also entails distributional consequences: It reduces the redistribution from the wealthy to the less wealthy among the retired as the latter are more affected by curtailing choice or stricter asset tests.
7 Conclusions
Our analysis looks at the impact of means-tested benefits on annuity demand in mandated fully-funded pension plans. These schemes play a growing role in the provision of retirement income in most industrialized countries. Annuitization in mandatory plans is thus a more pressing concern for public policy than in voluntary annuity markets, which traditionally have a low annuitization rate. Our paper is one of the few papers on annuity demand that employ individual level data. Together with the institutional setup in Switzerland the dataset lends itself well for testing the effects that means-tested benefits can have on optimal annuity decisions.
The results from a calibrated life-cycle model demonstrate that means-tested benefits substantially decrease the optimal annuity demand. The effect is more pronounced for individuals at the lower end of the wealth distribution: Taking the lump sum in view of applying for means-tested benefits later generates a higher lifetime utility. For higher pension wealth levels, on the other hand, the desire for a smooth consumption path and the value of the longevity insurance implied by the annuity dominate the incentives of the free means-tested supplemental benefits. The model's predictions are close to the observed annuitization decisions of 22,000 individuals in Swiss pension funds.
While empirical annuitization patterns are consistent with optimal decisions in the presence of means-tested benefits, causality is much more difficult to establish. To the best of our knowledge there are no within country variation that can be explored up to now. Cross country variations in means-tested benefits programs are unlikely to deliver clear results as large institutional differences are bound to confound the analysis. Nonetheless, we are convinced that despite the shortcomings mentioned, our approach is able to demonstrate that means-tested benefits are quantitatively important for annuitization.
Although we derived the quantitative impact of means-tested benefits on the decision to annuitize for a single country, our results have more general implications for the adequacy of income provided in old age. A partial shift from first to second pillar income provision in old age, as discussed in many countries, has to be evaluated carefully with respect to incentives that are created when allowing individuals to cash out second pillar wealth. A means-tested scheme in old age may generate a strong tendency to deplete pension wealth in the years after retirement – and thus potentially high costs for the welfare system. Policy makers will have to trade-off the benefits of leaving the annuitization choice to the individuals and the costs from doing so.
Supplementary material
The supplementary material for this article can be found at http://dx.doi.org/10.1017/S1474747216000081.
Appendix A – Additional tables
In order to calculate the optimal annuity demand, we also take into account that individuals differ in their liquid and illiquid non-pension wealth. We calculate a weighted average of optimal annuitization rates as a function of second pillar pension wealth levels. The weights are derived from the empirical joint distribution of pension wealth, liquid non-pension wealth, and illiquid non-pension wealth using SHARE data. Summary statistics characterizing the joint distribution of pension wealth, liquid non-pension wealth, and illiquid non-pension wealth are shown in Table A1.
Distribution of liquid and illiquid non-pension wealth (NPW) by pension wealth

Table A2 shows the tax rates for singles in Switzerland, which we use to calculate the after-tax value of the lump-sum and the annuity, respectively.
Tax rates for the lump-sum and income



