


Introduction
The Bunger Hills, islands and peninsulas immediately to the north (collectively, Highjump Archipelago (HJA)) and several nunataks within the Denman Glacier (Figs 1 & 2), are of fundamental importance in understanding the tectonic evolution of the Precambrian East Antarctic Craton, yet they occur within one of the least understood geological regions on Earth. Geophysical interpretations place this region within the Bunger Hills Block, which is characterized by a series of aligned high-intensity magnetic anomalies (Aitken et al. Reference Aitken, Young, Ferraccioli, Betts, Greenbaum and Richter2014). Magnetic intensity and gravity anomaly data reflect a continuity of major geophysical features between south-west Australia and Wilkes Land in East Antarctica (Aitken et al. Reference Aitken, Young, Ferraccioli, Betts, Greenbaum and Richter2014, Reference Aitken, Betts, Young, Blankenship, Roberts and Siegert2016). By accounting for significant offset along these geological structures, intercontinental stitching points are invoked between the two continents in Rodinian and Gondwanan palaeogeographical reconstructions, although the exact pre-breakup alignment of Australia and East Antarctica is a topic of debate (White et al. Reference White, Gibson and Lister2013 and references therein, Aitken et al. Reference Aitken, Betts, Young, Blankenship, Roberts and Siegert2016, Halpin et al. Reference Halpin, Daczko, Kobler and Whittaker2017, Daczko et al. Reference Daczko, Halpin, Fitzsimons and Whittaker2018, Williams et al. Reference Williams, Whittaker, Halpin and Müller2018). Recent geochronological and isotopic work (Tucker et al. Reference Tucker, Payne, Clark, Hand, Taylor and Kylander-Clark2017) and evidence for a comparable high-grade Mesoproterozoic metamorphic evolution (Harris Reference Harris, Yoshida and Santosh1995, Fitzsimons Reference Fitzsimons2000, Reference Fitzsimons2003, Tucker & Hand Reference Tucker and Hand2016, Tucker et al. Reference Tucker, Hand, Kelsey, Taylor, Clark and Payne2018) reconcile the Bunger Hills with the west Albany–Fraser Orogen in south-west Australia. Ultimately, the Bunger Hills are located in a critical position within this region of disputed overlap between the different suggested palaeogeographical fits and close to a critical piercing point during supercontinent assembly and breakup (Fig. 1).
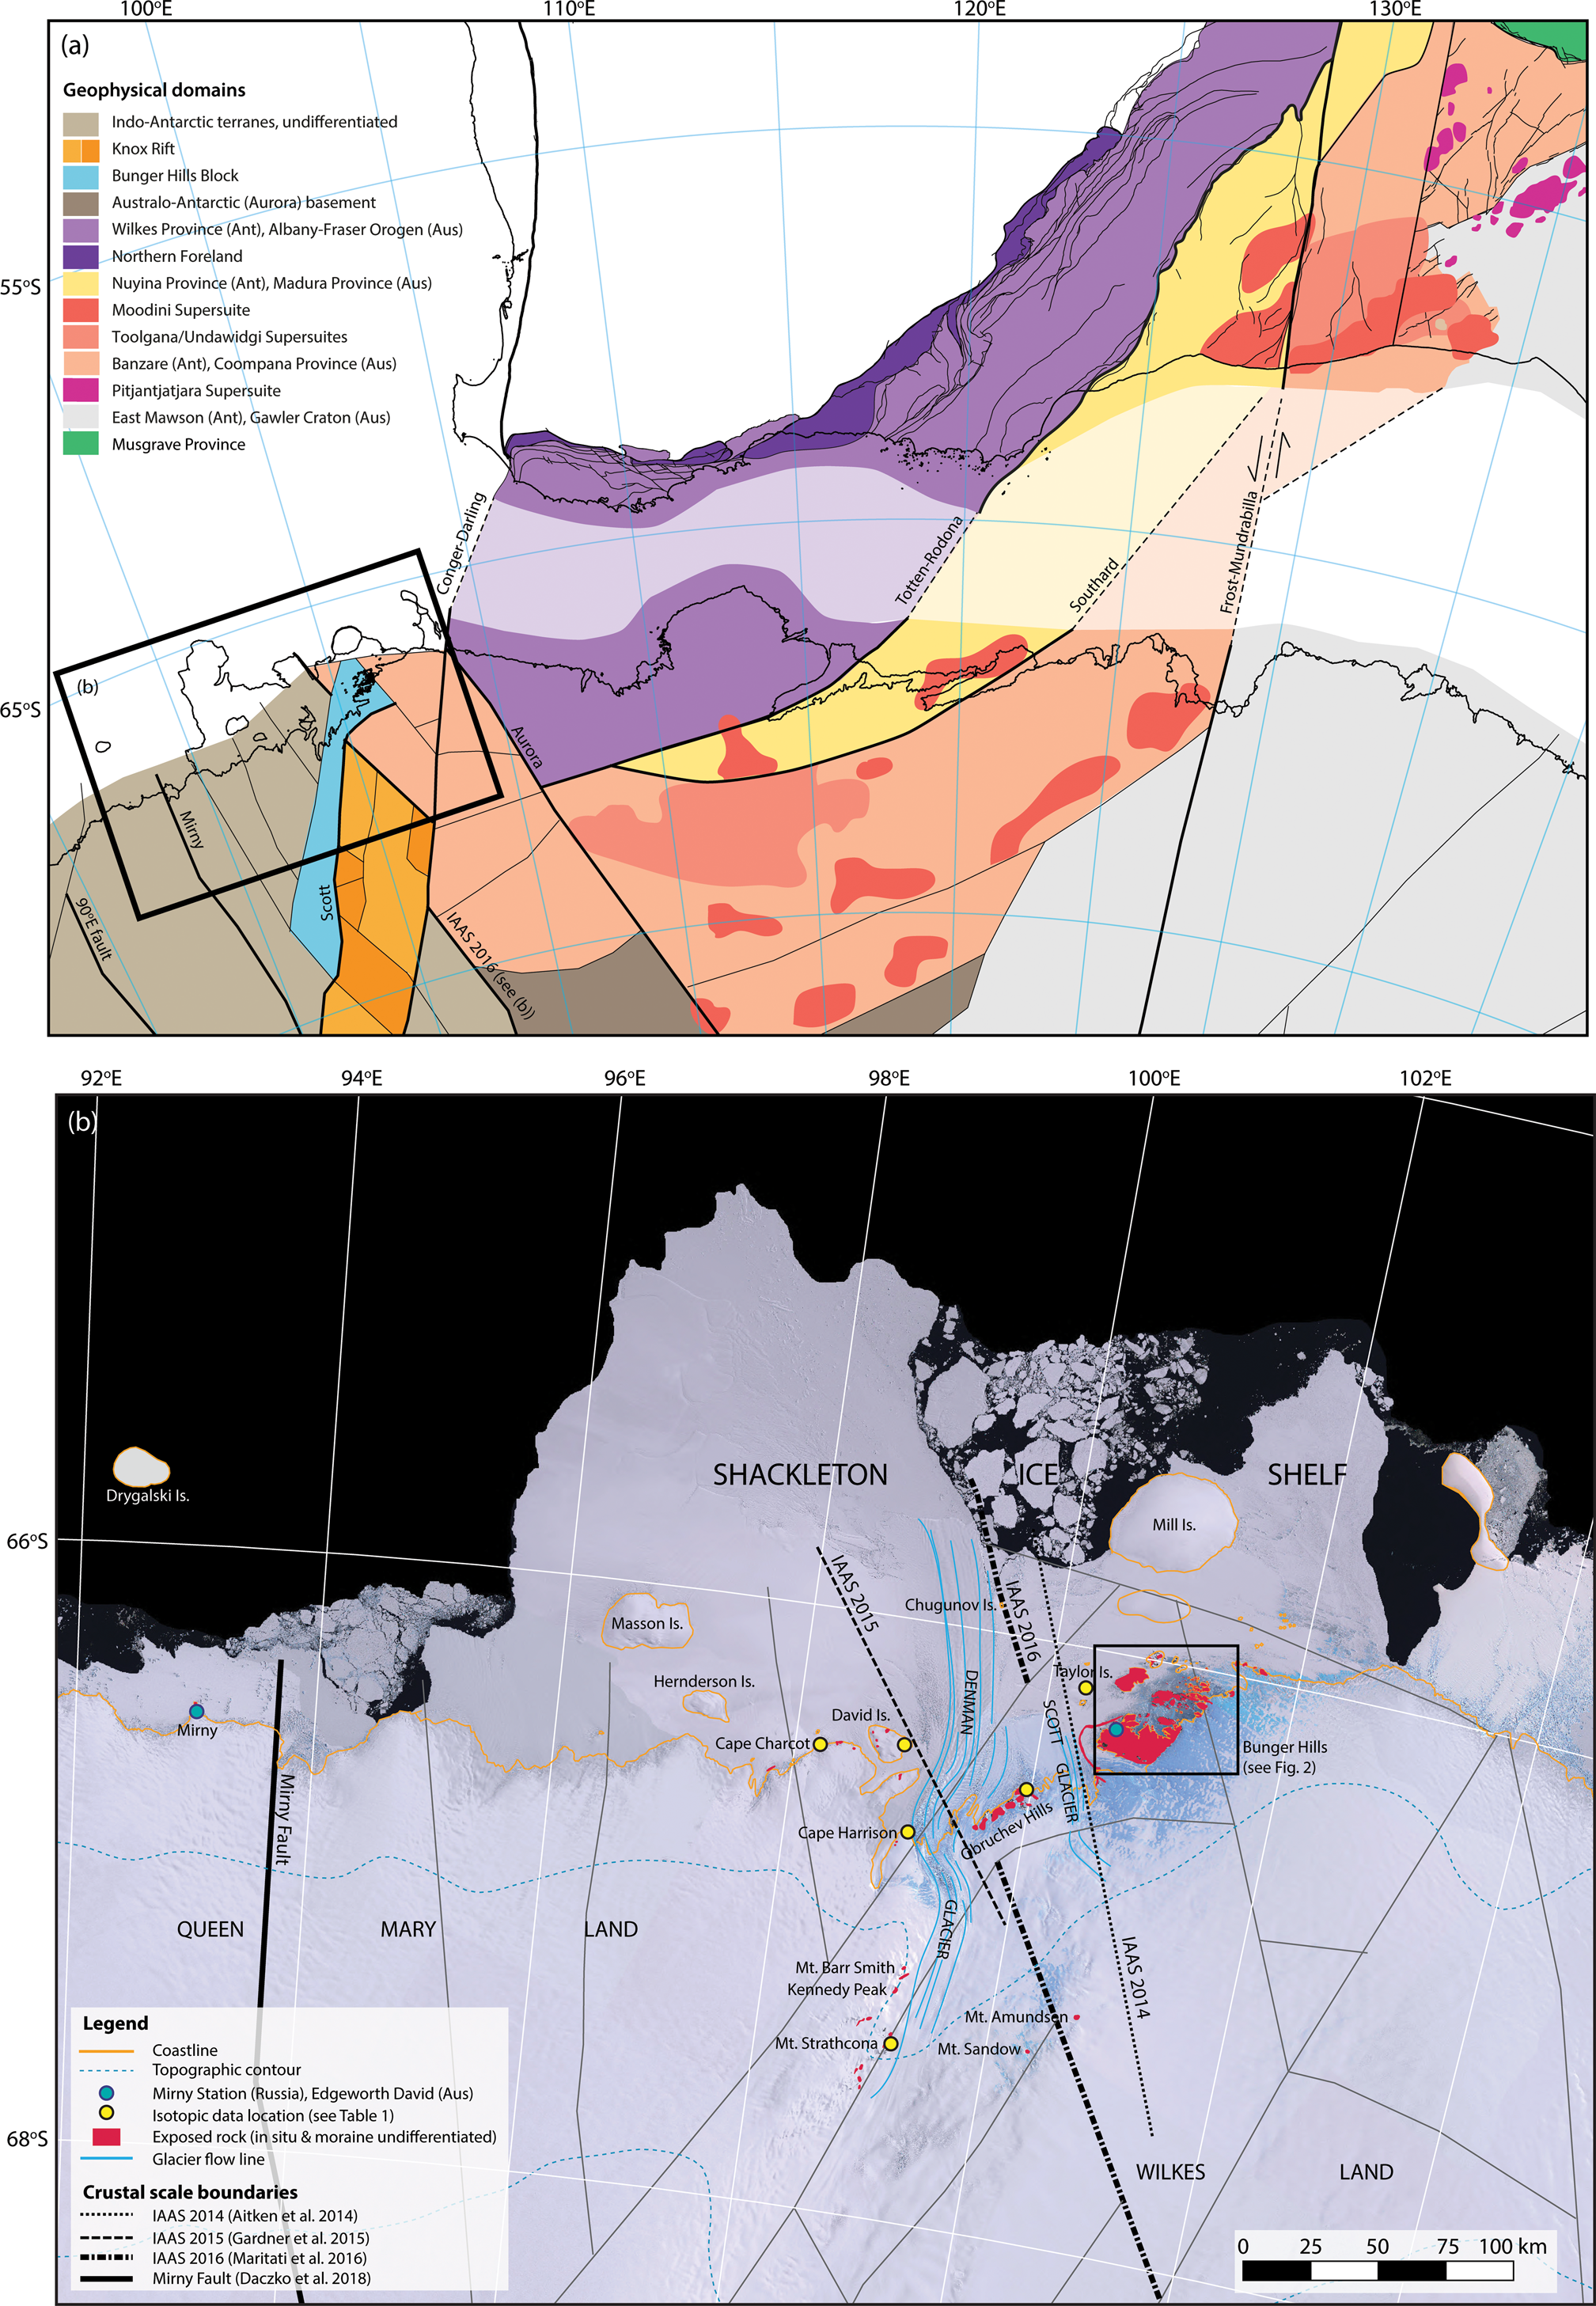
a. Reconstruction of conjugate Proterozoic tectonic provinces of south-west Australia and Wilkes Land, East Antarctica. The reconstruction is shown for c. 160 Ma (pre-Gondwana breakup), for which there are robust full-fit models, and was generated with GPlates (v. 2.1) using the Leeuwin model of Williams et al. (Reference Williams, Whittaker and Müller2011) with Antarctica fixed in its present-day reference frame (datum WGS84). Major structures are shown as bold lines and are labelled. The boxed region is enlarged in b. Australian tectonic elements and Archean–Mesoproterozoic structures are adapted from Western Australia and South Australia state-wide geospatial datasets (State of Western Australia, Department of Mines and Industry Regulation and Safety 2019: https://dasc.dmp.wa.gov.au/dasc; Geological Survey of South Australia online database (South Australian Resources Information Gateway, SARIG): https://map.sarig.sa.gov.au), and geophysical interpretations for the Moodini, Toolgana and Undawidgi Supersuites are from Maritati et al. (Reference Maritati, Halpin, Whittaker and Daczko2019). East Antarctic tectonic elements and geophysical lineaments are from Aitken et al. (Reference Aitken, Young, Ferraccioli, Betts, Greenbaum and Richter2014) and the updated interpretations of Maritati et al. (Reference Maritati, Aitken, Young, Roberts, Blankenship and Siegert2016, Reference Maritati, Halpin, Whittaker and Daczko2019). b. Simplified map of Wilkes Land and Queen Mary Land. Spatial data, including rock outcrop and moraine extent (pink shading), and the Landsat Image Mosaic of Antarctica (United States Geological Survey, USGS) are from various sources collated in the Quantarctica spatial dataset (Norwegian Polar Institute: https://quantarctica.npolar.no). Summarized isotopic constraints for outcrops in these regions are shown as yellow circles (refer to Table I). The coastline is outlined in yellow. The location of the Bunger Hills (enlarged in Fig. 2) is indicated. Grid references refer to the present-day geographical location of Antarctica. Different interpretations of the locations of major crustal boundaries are shown as solid and dashed bold lines and labelled (from Aitken et al. Reference Aitken, Young, Ferraccioli, Betts, Greenbaum and Richter2014, Gardner et al. Reference Gardner, Daczko, Halpin and Whittaker2015, Maritati et al. Reference Maritati, Aitken, Young, Roberts, Blankenship and Siegert2016, Daczko et al. Reference Daczko, Halpin, Fitzsimons and Whittaker2018). Thin black lines represent other geophysical lineaments from Maritati et al. (Reference Maritati, Aitken, Young, Roberts, Blankenship and Siegert2016).
Simplified geological map of the Bunger Hills and Highjump Archipelago (after Tucker et al. Reference Tucker, Hand, Kelsey, Taylor, Clark and Payne2018). The location of isotopic and age data and metamorphic constraints from Tucker & Hand (Reference Tucker and Hand2016) and Tucker et al. (Reference Tucker, Hand, Kelsey, Taylor, Clark and Payne2018) are shown (see also Table I). Representative structural data from Sheraton et al. (Reference Sheraton, Tingey, Oliver and Black1995) are overlain.

Summarized age and isotopic data from the Bunger Hills and surrounding areas.

Lithological association is indicated in parentheses if previously assigned. Only concordant age data are considered in Table I. Age dating method: aU–Pb zircon, bRb–Sr whole-rock/minerals, cU–Pb monazite, dSm–Nd minerals, eU–Pb baddeleyite. Age calculation method: *upper intercept, **lower intercept, ^individual ages, ‡weighted mean age. Interpretations on age data that are unclear or based on limited data are indicated with ‘?’. Isotopic data are quoted as per original source (i.e. mean value, single analysis or range of individual analyses). Where ɛHf(t) and ɛNd(t) are not calculated at the protolith/metamorphic age indicated in Table I, t is indicated. Some age data for Group 1, 2 and 3D tholeiite and 4A, 4B and 4D dolerite dykes are associated with significant uncertainties (see Sheraton et al. Reference Sheraton, Black, McCulloch and Oliver1990) and are therefore not included. K–Ar age data of Ravich et al. (Reference Ravich, Klimov and Solovʹev1968) are not included due to the low closure temperature of this system and known high-temperature Mesoproterozoic and Cambrian deformation history in the region.
bi = biotite, cd = cordierite, g = garnet, mt = magnetite, opx = orthopyroxene, ru = rutile, sa = sapphirine, sill = sillimanite, sp = spinel.
The first geological observations of the Bunger Hills were documented by Ravich et al. (Reference Ravich, Klimov and Solovʹev1968), who provided a largely petrological account of samples collected during the 1956–1957 Soviet Antarctic Expedition. A subsequent expedition in 1986 provided detailed structural, lithological and geochemical observations (Stüwe & Powell Reference Stüwe and Powell1989, Sheraton et al. Reference Sheraton, Black, McCulloch and Oliver1990, Reference Sheraton, Black and Tindle1992, Reference Sheraton, Tingey, Black and Oliver1993, Reference Sheraton, Tingey, Oliver and Black1995, Stüwe & Wilson Reference Stüwe and Wilson1990, Ding & James Reference Ding, James and Thomson1991) and reconnaissance geochronological and metamorphic data. These data provided the first indication of a broad geological connection between the Bunger Hills and south-west Australia since the Mesoproterozoic (Clarke et al. Reference Clarke, Sun and White1995, Harris Reference Harris, Yoshida and Santosh1995, Sheraton et al. Reference Sheraton, Tingey, Oliver and Black1995, Fitzsimons Reference Fitzsimons2000, Reference Fitzsimons2003). These early field and petrographic observations, geochronological and geochemical data and tectonic interpretations were recently complemented by a third field campaign (2014–2015) primarily to investigate the crustal evolution of the Bunger Hills (Tucker et al. Reference Tucker, Payne, Clark, Hand, Taylor and Kylander-Clark2017) and its metamorphic evolution (Tucker & Hand Reference Tucker and Hand2016, Tucker et al. Reference Tucker, Hand, Kelsey, Taylor, Clark and Payne2018), mafic dyke petrogenesis (Stark et al. Reference Stark, Wang, Li, Rasmussen, Sheppard and Zi2018) and palaeomagnetism (Liu et al. Reference Liu, Li, Pisarevsky, Kirscher, Mitchell and Stark2018). These new investigations have been aided by geophysical work on the subglacial geology of Wilkes Land (Aitken et al. Reference Aitken, Young, Ferraccioli, Betts, Greenbaum and Richter2014, Reference Aitken, Betts, Young, Blankenship, Roberts and Siegert2016, Maritati et al. Reference Maritati, Aitken, Young, Roberts, Blankenship and Siegert2016, Reference Maritati, Halpin, Whittaker and Daczko2019) and isotopic studies on legacy samples from the Bunger Hills region and Wilkes Land coastal exposures (Daczko et al. Reference Daczko, Halpin, Fitzsimons and Whittaker2018, Mulder et al. Reference Mulder, Halpin, Daczko, Orth, Meffre and Thompson2019). These recent additions warrant a review of existing geological data and tectonic interpretations of the Bunger Hills region.
Accordingly, this contribution presents a concise, updated account of the subglacial geology of the Bunger Hills and immediate areas. It integrates published geological data from all field seasons at the time of writing and serves as a standalone reference for the present state of knowledge of the geological evolution of the Bunger Hills region and its geological connection with other parts of East Antarctica and south-west Australia.
Lithological framework
The Bunger Hills region comprises primarily granulite facies rocks with igneous and sedimentary protoliths, voluminous weakly deformed gabbro–granite and mafic dykes (Fig. 3). Sheraton et al. (Reference Sheraton, Tingey, Oliver and Black1995) and Ravich et al. (Reference Ravich, Klimov and Solovʹev1968) provided detailed accounts of the major lithologies and their mineralogies and whole-rock geochemical data for the igneous rocks. Tucker et al. (Reference Tucker, Hand, Kelsey, Taylor, Clark and Payne2018) refined the main lithologies into five subdivisions by age and spatial distribution. Field relations and geochronological and isotopic data show that the Bunger Hills comprise: 1) a Neoarchean basement (Association 1; Fig. 3a, b & d), 2) a Palaeo–Mesoproterozoic sequence of interlayered orthogneiss–pelite gneiss (Associations 2 and 3; Fig. 3e & f) and migmatitic pelite gneiss (Association 4; Fig. 3g–i), 3) Mesoproterozoic plutonic rocks (Association 5; Fig. 3j & k), and 4) several chemically distinct mafic dyke suites that intruded between c. ≥ 1140 and 500 Ma (collectively denoted Association 6 in this contribution; Fig. 3l). A summary of all existing isotope and age data from the Bunger Hills region is provided in Table I.
Typical outcrop appearance and lithological relationships of rocks in the Bunger Hills. a. Mafic and felsic orthogneiss, south-east Bunger Hills (Association 1). b. Garnet–cordierite–orthopyroxene gneiss (dark layers) with voluminous orthopyroxene-bearing leucosomes (light layers) hosted within mafic–felsic orthogneiss in the south-east Bunger Hills (Association 1). c. Garnet–cordierite–orthopyroxene gneiss within the moraine, similar in appearance to b. d. Sapphirine–spinel–orthopyroxene–plagioclase ± garnet gneiss near the location of b. e. Typical appearance of tonalite–diorite gneiss comprising Association 2 near Edgeworth David base. f. Regularly interlayered sequence of metasedimentary rocks, tonalite gneiss, minor mafic gneiss, quartzite and pssamite in the north-east Bunger Hills (Association 3). g. Typical appearance of migmatitic garnet–cordierite ± sillimanite ± orthopyroxene ± biotite ± magnetite gneiss in the central Bunger Hills (Association 4). h. & i. Metasedimentary rocks comprising Association 4 are typically cross-cut by (h.) late cordierite or (i.) orthopyroxene leucosomes, depending on bulk composition. j. Lithological contact between granite (Paz Cove Batholith, left, Association 5) and metasedimentary rocks (Association 4) on Krylatyy Peninsula. k. Weakly deformed plutonic rocks of Paz Cove Batholith are interlayered with Association 4 at their margins. l. Mafic dyke cross-cutting all other lithological associations. Photograph taken near Paz Cove. m.–o. Representative photographs of sedimentary (conglomerate and arkose sandstone) and igneous (rapakivi granite) moraine.

Neoarchean basement (Association 1)
The south-eastern part of the Bunger Hills is dominated by tonalite–dolerite orthogneiss and lesser migmatitic garnet–cordierite–orthopyroxene–spinel–sapphirine gneiss with voluminous orthopyroxene-bearing leucosomes. These rocks have inferred c. 2800–2700 Ma protolith emplacement and depositional ages, respectively (Tucker et al. Reference Tucker, Payne, Clark, Hand, Taylor and Kylander-Clark2017). The metasedimentary rocks appear to form a large (~20 m long) enclave within the mafic–felsic gneiss, but lithological contacts in this region are largely obscured, with further exploration required to elucidate the lithological relationships. However, broad similarities are observed between the morphology, age and isotopic composition of the Neoarchean zircon from the mafic–felsic orthogneiss (ɛHf(t) = −4.2 to +5.1; δ18O = +5.2 to +6.4) and those from the pelite (ɛHf(t) = +0.6 to +5.7; δ18O = +4.5 to +5.7), suggesting that the latter were sourced from the igneous rocks (Tucker et al. Reference Tucker, Payne, Clark, Hand, Taylor and Kylander-Clark2017).
Palaeo–Mesoproterozoic gneissic sequence (Associations 2–4)
A sample of garnet–cordierite gneiss from the south-central Bunger Hills (sample BH95; near the contact between Association 1 and 2) yielded a dominant c. 1900–1800 Ma zircon population and a discordant array of dates to c. 1520 Ma (Tucker et al. Reference Tucker, Payne, Clark, Hand, Taylor and Kylander-Clark2017). Zircon from this sample was isotopically juvenile (mean ɛHf(t) = +2.3; mean δ18O = +4.5; Tucker et al. Reference Tucker, Payne, Clark, Hand, Taylor and Kylander-Clark2017). Owing to ancient Pb loss and a lack of additional samples exhibiting comparable zircon spectra, the significance of this rock remains unclear. It is plausible that the rock has a mid-Palaeoproterozoic protolith, but the zircon subsequently underwent Pb loss. Alternatively, the rock may be dominated by mid-Palaeoproterozoic detritus and have a possible Mesoproterozoic maximum depositional age (Tucker et al. Reference Tucker, Payne, Clark, Hand, Taylor and Kylander-Clark2017).
The Neoarchean tonalite–dolerite orthogneiss becomes increasingly felsic (tonalite–granite) and interlayered with mafic granulite and metasedimentary rocks (all Association 2) towards the north-west (Fig. 2; Sheraton et al. Reference Sheraton, Tingey, Oliver and Black1995, Tucker et al. Reference Tucker, Payne, Clark, Hand, Taylor and Kylander-Clark2017). The central Bunger Hills comprise a regularly interlayered sequence (centimetre to metre scale) of garnet–cordierite ± sillimanite gneiss and orthopyroxene ± garnet ± hornblende tonalite–granitic orthogneiss, with lesser quartzofeldspathic gneiss, mafic granulite, garnet ± biotite granitic gneiss and rare calc-silicate (Association 3; Sheraton et al. Reference Sheraton, Tingey, Oliver and Black1995, Tucker et al. Reference Tucker, Payne, Clark, Hand, Taylor and Kylander-Clark2017). Reconnaissance U–Pb zircon geochronology on an Y-depleted, I-type granodiorite and orthopyroxene–quartzofeldspathic orthogneiss suggested that the protoliths to these rocks from the south-west Bunger Hills and Thomas Island (both inferred Association 2) were emplaced at 1699 ± 15 and 1521 ± 29 Ma, respectively (Sheraton et al. Reference Sheraton, Black and Tindle1992). These rocks yielded isotopically evolved ɛNd(t) values of -9.6 and −7.5, respectively (Sheraton et al. Reference Sheraton, Tingey, Oliver and Black1995). Recent U–Pb geochronology from orthopyroxene-bearing tonalite orthogneiss in the west Bunger Hills (Association 2) and tonalitic orthogneiss interlayered with metasedimentary rocks in the north-east Bunger Hills (Association 3) yielded imprecise inferred crystallization ages of c. 1750–1650 Ma (sample BH79) and 1666 ± 49 Ma (sample BH12), respectively (Tucker et al. Reference Tucker, Payne, Clark, Hand, Taylor and Kylander-Clark2017). These rocks yielded ɛHf(t) and δ18O values of +1.3 to -6.3 (t as the upper intercept age of discord due to Pb loss) and +6.8 to +7.9, and +1.3 to −4.8 and +5.4 to +7.9, respectively (Tucker et al. Reference Tucker, Payne, Clark, Hand, Taylor and Kylander-Clark2017). These new age and isotopic constraints are broadly consistent with those obtained previously from the same lithological sequence (i.e. Sheraton et al. Reference Sheraton, Black and Tindle1992). Rocky outcrops within the HJA are inferred to largely comprise Associations 2 and 3 based on field observations (Fig. 2).
The northern Bunger Hills are dominated by a thick sequence of migmatitic garnet–cordierite ± sillimanite ± orthopyroxene ± spinel ± magnetite-bearing gneiss and minor quartzite and psammite (Association 4; Fig. 2). Sheraton et al. (Reference Sheraton, Tingey, Oliver and Black1995) noted that the rocks are strongly migmatized adjacent to the Paz Cove in the central Bunger Hills and that the migmatitic gneisses in this region are dominated by cordierite. Tucker et al. (Reference Tucker, Hand, Kelsey, Taylor, Clark and Payne2018) support this observation, noting the presence of cordierite-bearing leucosomes (Fig. 3h). Elsewhere in the central Bunger Hills, the migmatitic gneisses are dominated by orthopyroxene, with coarse-grained orthopyroxene-bearing leucosomes (Fig. 3i; e.g. sample BH54; Tucker et al. Reference Tucker, Payne, Clark, Hand, Taylor and Kylander-Clark2017, Reference Tucker, Hand, Kelsey, Taylor, Clark and Payne2018). Sheraton et al. (Reference Sheraton, Tingey, Oliver and Black1995) note that, in places, spinel is rimmed by coronae of garnet, cordierite or sillimanite. The sedimentary protoliths to Association 4 contain abundant c. 1800–1600 Ma detritus and minor zircon ages between c. 2200 and 1800 Ma and c. 3000 and 2500 Ma (Tucker et al. Reference Tucker, Payne, Clark, Hand, Taylor and Kylander-Clark2017). These rocks are interpreted to have been deposited during the Mesoproterozoic, after c. 1700 Ma magmatism but prior to the onset of magmatism and metamorphism during the Albany–Fraser Orogeny (see below), with a probable maximum depositional age of c. 1490 Ma (Tucker et al. Reference Tucker, Payne, Clark, Hand, Taylor and Kylander-Clark2017). This age is based on the youngest concordant analysis of an oscillatory-zoned (inferred detrital) zircon core; however, the integrated trace element and geochronological approach of Tucker et al. (Reference Tucker, Hand, Kelsey, Taylor, Clark and Payne2018) highlighted that zircon morphology alone may be a deceptive indicator of metamorphic vs detrital zircon. Many ages from zircon initially inferred to be metamorphic were subsequently reinterpreted as reflecting isotopic resetting, meaning that the maximum depositional age of this sequence is loosely constrained and potentially younger. The minimum depositional age is constrained by intrusion of the Paz Cove Batholith (c. 1200–1170 Ma) that is observed interlayered with and hosting enclaves of Association 4 on Geologov Island (Fig. 3k; see below; Sheraton et al. Reference Sheraton, Tingey, Oliver and Black1995, Tucker et al. Reference Tucker, Payne, Clark, Hand, Taylor and Kylander-Clark2017).
A sample of biotite–orthopyroxene-rich tonalite–granodiorite gneiss, ~5 km west of the Algae Lake Pluton (BH100; Fig. 2), yielded an inferred protolith age of 1256 ± 5 Ma (Tucker et al. Reference Tucker, Payne, Clark, Hand, Taylor and Kylander-Clark2017). This sample is located within a region denoted as Association 2 and is interlayered with garnet–sillimanite gneiss, but it is significantly younger than all other rocks presently analysed from this sequence. The protolith emplacement age of this rock and its isotopically evolved composition (ɛHf(t) = −4.6 to -11.4; δ18O = +7.4 to +8.4; Tucker et al. Reference Tucker, Payne, Clark, Hand, Taylor and Kylander-Clark2017) are similar, however, to the Mesoproterozoic plutonic rocks in the Bunger Hills, although the later were clearly emplaced during the late stages of deformation, as they are weakly deformed or undeformed.
Weakly deformed Mesoproterozoic plutonic rocks (Association 5)
Three large (up to ~10 km in diameter) intrusive bodies crop out in the Bunger Hills (together Association 5; Fig. 1). Field observations indicate that the intrusive bodies contain orthopyroxene, minor clinopyroxene, biotite and hornblende and are mineralogically and lithologically heterogeneous at the outcrop scale (10–100 m; Sheraton et al. Reference Sheraton, Black and Tindle1992, Reference Sheraton, Tingey, Oliver and Black1995, Tucker et al. Reference Tucker, Payne, Clark, Hand, Taylor and Kylander-Clark2017). The Paz Cove Batholith and Algae Lake Pluton contain orthopyroxene-bearing leucosomes that both align with and cross-cut a weak fabric that is defined by the alignment of orthopyroxene and plagioclase. Sheraton et al. (Reference Sheraton, Black and Tindle1992, Reference Sheraton, Tingey, Oliver and Black1995) noted that the Algae Lake Pluton and Paz Cove Batholith are petrographically similar, ranging geochemically between gabbro and quartz monzogabbro, although granite also crops out in the latter on the Vertoletnyy and Krylatyy peninsulas (Fig. 2). The Booth Peninsular Batholith is larger, more compositionally varied and contains significantly more gabbro and quartz–gabbro than the other two intrusive bodies (Fig. 2; Sheraton et al. Reference Sheraton, Tingey, Oliver and Black1995). The different lithological domains within each intrusive body locally exhibit cross-cutting and intrusive relationships (Sheraton et al. Reference Sheraton, Black and Tindle1992, Reference Sheraton, Tingey, Oliver and Black1995, Tucker et al. Reference Tucker, Payne, Clark, Hand, Taylor and Kylander-Clark2017). Sheraton et al. (Reference Sheraton, Tingey, Oliver and Black1995) note that on the Booth Peninsula the felsic lithologies appear to postdate the mafic lithologies, though locally they grade into one another. In places, the intrusive rocks clearly cross-cut and host enclaves of, or are interlayered with, the surrounding gneissic country rocks (e.g. Geologov Island; Tucker et al. Reference Tucker, Payne, Clark, Hand, Taylor and Kylander-Clark2017).
Reconnaissance U–Pb zircon geochronology suggested that the Algae Lake Pluton, Paz Cove Batholith and Booth Peninsula Batholith (formerly Lake Figure and Fishtail Gulf plutons and the Charnockite Peninsula Batholith; Sheraton et al. Reference Sheraton, Black and Tindle1992) were emplaced at 1171 ± 3, 1170 ± 4 and 1151 ± 4 Ma, respectively (Sheraton et al. Reference Sheraton, Tingey, Oliver and Black1995). These ages are younger than those obtained by Tucker et al. (Reference Tucker, Payne, Clark, Hand, Taylor and Kylander-Clark2017), who suggested that the Algae Lake Pluton and Paz Cove Batholith were emplaced at 1203 ± 5 and 1200 ± 5 Ma, respectively. Tucker et al. (Reference Tucker, Payne, Clark, Hand, Taylor and Kylander-Clark2017) reported a large spread in isotopically evolved zircon compositions (ɛHf(t) = −13 to −6) and positive δ18O values (+8.3 to +9.2) for the Paz Cove Batholith and Algae Lake Pluton. These isotopic data are consistent with data obtained previously from the Algae Lake Pluton (ɛNd(t) = −9.4; Sheraton et al. Reference Sheraton, Black and Tindle1992), revealing the highly evolved nature of the protolith to these rocks. Sheraton et al. (Reference Sheraton, Black and Tindle1992) obtained a slightly more isotopically juvenile ɛNd(t) value of -3.5 for the Booth Peninsular Batholith, which is consistent with the higher proportion of mafic rocks in this region.
The lithological heterogeneity and significant variation in age and isotopic compositions of the Paz Cove Batholith and Algae Lake Pluton (Sheraton et al. Reference Sheraton, Black and Tindle1992, Reference Sheraton, Tingey, Oliver and Black1995, Tucker et al. Reference Tucker, Payne, Clark, Hand, Taylor and Kylander-Clark2017) suggest that they are composite intrusive bodies (i.e. comprising a cluster of multiple smaller intrusions). It is probable that Mesoproterozoic magmatism in the Bunger Hills occurred episodically between c. 1200 and 1170 Ma (Tucker et al. Reference Tucker, Payne, Clark, Hand, Taylor and Kylander-Clark2017). A similar explanation was proposed by Zhang et al. (Reference Zhang, Zhao, Liu, Liu, Hou, Li and Ye2012) to reconcile differences in the protolith ages obtained for Mesoproterozoic plutonic rocks in the Windmill Islands, ~400 km east of the Bunger Hills (1205 and 1196 Ma; Post Reference Post2000, Zhang et al. Reference Zhang, Zhao, Liu, Liu, Hou, Li and Ye2012).
Mafic dykes (Association 6)
The Bunger Hills are dissected by abundant dolerite–basalt dykes. Field observations and whole-rock Rb–Sr and Sm–Nd geochronological data suggest that they intruded between c. ≥ 1140 and 500 Ma (Sheraton et al. Reference Sheraton, Black, McCulloch and Oliver1990, Reference Sheraton, Tingey, Black and Oliver1993, Reference Sheraton, Tingey, Oliver and Black1995). The dykes can be subdivided into an older generation of deformed and metamorphosed olivine–tholeiites and quartz–tholeiites within the plutonic bodies and mafic granulite layers within the basement gneisses and a series of younger undeformed dykes that cross-cut the basement rocks and plutonic bodies (Sheraton et al. Reference Sheraton, Black, McCulloch and Oliver1990, Reference Sheraton, Black and Tindle1992, Reference Sheraton, Tingey, Black and Oliver1993, Reference Sheraton, Tingey, Oliver and Black1995). The latter have an inferred maximum emplacement age of c. 1203 Ma, which is the crystallization age of the plutonic rocks that are intruded by the dykes (Tucker et al. Reference Tucker, Payne, Clark, Hand, Taylor and Kylander-Clark2017). As the current age constraints on the plutons are disparate (i.e. compare the ages obtained by Tucker et al. Reference Tucker, Payne, Clark, Hand, Taylor and Kylander-Clark2017 and Sheraton et al. Reference Sheraton, Black and Tindle1992), there is a high degree of uncertainty on this maximum emplacement age.
Geochemistry and field relations indicate that the undeformed dykes comprise five compositionally distinct groups (olivine–tholeiites, weakly alkaline dolerites, picrites–ankaramites, alkali basalts and trachybasalts; Sheraton et al. Reference Sheraton, Black, McCulloch and Oliver1990, Reference Sheraton, Tingey, Oliver and Black1995, Stark et al. Reference Stark, Wang, Li, Rasmussen, Sheppard and Zi2018). Group 1 dykes are tholeiitic, < 2 m wide and largely restricted to the south-west Bunger Hills (Sheraton et al. Reference Sheraton, Black, McCulloch and Oliver1990, Reference Sheraton, Tingey, Oliver and Black1995). Group 2 dykes are north-west-trending, high-Mg dolerites of variable thickness. Group 3 and 4 dykes are the most abundant of all the dykes in the Bunger Hills, commonly trend NW–SE, comprise dolerite and range up to 50 m in width (Sheraton et al. Reference Sheraton, Black, McCulloch and Oliver1990, Reference Sheraton, Tingey, Oliver and Black1995). Early Rb–Sr and Sm–Nd isochron ages suggested that the Group 2–4 dykes were emplaced at c. 1140 Ma, but this estimate was based on imprecise data and isochrons inferred to reflect partial resetting at c. 500 Ma (Sheraton et al. Reference Sheraton, Black, McCulloch and Oliver1990, Reference Sheraton, Tingey, Oliver and Black1995). Stark et al. (Reference Stark, Wang, Li, Rasmussen, Sheppard and Zi2018) provided the first U–Pb zircon and baddeleyite age data for the largest mafic dyke in the Bunger Hills (equivalent to Group 4B dykes of Sheraton et al. Reference Sheraton, Black, McCulloch and Oliver1990), constraining its emplacement age to 1134 ± 9 and 1131 ± 16 Ma by the two methods, respectively. These new age data suggest that other similarly orientated dykes in the Bunger Hills (i.e. Group 3 and 4) are coeval, but further investigation is required. The Group 5 dykes comprise alkali basalts and trachybasalts from the west Bunger Hills and Taylor Islands. These dykes are E–W trending, typically < 1 m wide and have an inferred emplacement age of 502 Ma based on Rb–Sr whole-rock geochronology (Sheraton et al. Reference Sheraton, Black, McCulloch and Oliver1990).
Structural geology
The Bunger Hills have experienced at least three major phases of deformation at high temperature during the Palaeo–Mesoproterozoic (Table II; Stüwe & Wilson Reference Stüwe and Wilson1990, Ding & James Reference Ding, James and Thomson1991, Sheraton et al. Reference Sheraton, Tingey, Black and Oliver1993, Reference Sheraton, Tingey, Oliver and Black1995, Harris Reference Harris, Yoshida and Santosh1995, Tucker et al. Reference Tucker, Payne, Clark, Hand, Taylor and Kylander-Clark2017). Several structural models have been proposed to contextualize the different phases of Mesoproterozoic deformation and metamorphism (see Table II). These models largely disagree on the timing of magmatism relative to deformation (see Harris Reference Harris, Yoshida and Santosh1995, Sheraton et al. Reference Sheraton, Tingey, Oliver and Black1995); however, the deformation sequence proposed by Sheraton et al. (Reference Sheraton, Tingey, Oliver and Black1995), who reconcile earlier structural observations (i.e. Stüwe & Wilson Reference Stüwe and Wilson1990, Ding & James Reference Ding, James and Thomson1991) with geochronology, and the updated metamorphic interpretations of Tucker et al. (Reference Tucker, Payne, Clark, Hand, Taylor and Kylander-Clark2017, Reference Tucker, Hand, Kelsey, Taylor, Clark and Payne2018) appear to best describe the tectono-metamorphic evolution of the Bunger Hills area. A brief description of the currently accepted structural framework of the Bunger Hills is summarized below, but the reader is referred to the publications above for a more in-depth understanding.
Summarized interpretations of the Mesoproterozoic structural and metamorphic evolution of the Bunger Hills.

The oldest recognizable tectonic fabric is a pervasive, gentle to moderately dipping composite gneissic fabric (S1–S2 of Sheraton et al. Reference Sheraton, Tingey, Oliver and Black1995, Tucker et al. Reference Tucker, Payne, Clark, Hand, Taylor and Kylander-Clark2017) defined by K-feldspar-rich leucosomes that alternate with Mg–Fe–Al-rich melanosome, and within the melanosome by the alignment of sillimanite–biotite + garnet + cordierite + magnetite (Tucker et al. Reference Tucker, Hand, Kelsey, Taylor, Clark and Payne2018). Mesoscopic structures in the Bunger Hills largely relate to the second phase of deformation (D2), but the intensity of D2 is variable. The S1 fabric is locally preserved by the alignment of sillimanite and biotite within mesoscale F2 fold hinges, perpendicular to the strong S2 axial planar fabric, which is also defined by the alignment of these minerals (Tucker et al. Reference Tucker, Payne, Clark, Hand, Taylor and Kylander-Clark2017, Reference Tucker, Hand, Kelsey, Taylor, Clark and Payne2018). Stüwe and Wilson (Reference Stüwe and Wilson1990) attributed the layer-parallel S1 fabric to flattening from crustal extension. The F2 folds are typically tight–isoclinal and reclined–recumbent in orientation, lie in the plane of the S1–S2 fabric and have shallow SSW-dipping axial planes. L2 is south-dipping and best observed in the north-east and central parts of the Bunger Hills.
The third phase of deformation (D3) resulted in open, upright meso–macroscale folding of the earlier fabrics, transposing them into steep orientations. The F3 folds are typically NW–SE trending and have steep SE–SW-dipping axial planes and shallow south plunges. East to north-east of the Paz Cove Batholith, the F3 folds are near recumbent and strongly SE-verging, and the S3 fabric is intense and steeply SW–NW dipping, suggesting that this region is a high-intensity D3 domain. Elsewhere in the Bunger Hills, F2 folds are often sheared by steep S3 shear fabrics (e.g. north of Edgeworth David in the cliff exposure), and F2–F3 fold interference patterns are also locally observed (e.g. north of Edgeworth David and Thomas Island; Sheraton et al. Reference Sheraton, Tingey, Oliver and Black1995). Variation in the structural trend of F3 folds (F2 folds of Stüwe & Wilson Reference Stüwe and Wilson1990) has been suggested to result from emplacement of the Algae Lake Pluton and Paz Cove Batholith during the late stages of deformation (pre-syn D4 of Ding & James Reference Ding, James and Thomson1991, Sheraton et al. Reference Sheraton, Tingey, Black and Oliver1993, Reference Sheraton, Tingey, Oliver and Black1995). Late D3 emplacement of the plutonic bodies is supported by their weak (inferred) igneous foliation relative to the surrounding gneissic country rocks that they cross-cut and are interleaved with (Ding & James Reference Ding, James and Thomson1991, Sheraton et al. Reference Sheraton, Tingey, Oliver and Black1995, Tucker et al. Reference Tucker, Payne, Clark, Hand, Taylor and Kylander-Clark2017). Sheraton et al. (Reference Sheraton, Tingey, Black and Oliver1993) interpreted the present-day regional structure of the Bunger Hills to primarily reflect D3 NNW–SSE compression.
The Booth Peninsula Batholith on east Thomas Island cross-cuts the D3 structures of Sheraton et al. (Reference Sheraton, Tingey, Black and Oliver1993), suggesting that it was emplaced post-D3 (Sheraton et al. Reference Sheraton, Tingey, Oliver and Black1995). This interpretation is supported by its younger emplacement age than the Paz Cove Batholith and Algae Lake Pluton, although current interpretations are limited by the low number of analysed samples.
Coarse-grained orthopyroxene-bearing and cordierite-bearing leucosomes overprint the reorientated S1–S2 fabrics and hinges of the F3 folds in the migmatitic pelitic gneiss (Tucker et al. Reference Tucker, Hand, Kelsey, Taylor, Clark and Payne2018). Locally garnet-bearing leucosomes and pegmatites also occur parallel to steeply dipping F3 axial planes and within the hinges of the F3 folds. Previous studies also postulate localized D4 brittle deformation (equivalent to D3 of Stüwe & Wilson Reference Stüwe and Wilson1990) characterized by multiple generations of retrograde shear zones, pseudotachylite and mylonitic fabrics, pegmatites and mafic dykes, with complex cross-cutting relationships.
Neoarchean–Mesoproterozoic crustal evolution
The west Albany–Fraser Orogen and Bunger Hills share a similar crustal evolution, with both regions recording evidence of Palaeoproterozoic–early Mesoproterozoic autochthonous reworking of the Yilgarn Craton margin (Fig. 4; Kirkland et al. Reference Kirkland, Spaggiari, Pawley, Wingate, Smithies and Howard2011, Reference Kirkland, Smithies and Spaggiari2015, Spaggiari & Tyler Reference Spaggiari and Tyler2014, Smithies et al. Reference Smithies, Spaggiari and Kirkland2015b, Spaggiari et al. Reference Spaggiari, Kirkland, Smithies, Wingate and Belousova2015, Tucker et al. Reference Tucker, Payne, Clark, Hand, Taylor and Kylander-Clark2017). In contrast, the proposed crustal evolution of the Windmill Islands, which is situated ~400 km east of the Bunger Hills, diverges from the Bunger Hills and is more strongly linked to accretion of the isotopically juvenile Madura Province on the eastern margin of the Albany–Fraser Orogen (Fig. 4; Spaggiari et al. Reference Spaggiari, Kirkland, Smithies, Wingate and Belousova2015, Morrissey et al. Reference Morrissey, Payne, Hand, Clark, Taylor, Kirkland and Kylander-Clark2017b). The following description of the Neoarchean–Mesoproterozoic Bunger Hills crustal evolution is compiled from published geochronological, isotopic and geochemical data and highlights the geological links between the Bunger Hills and the Albany–Fraser Orogen.
Time–space comparison of the Archean–Mesoproterozoic crustal evolution of the Bunger Hills region with other constituent terranes of the Musgrave–Albany–Fraser–Wilkes Orogen (MAFWO). Figure adapted from Tucker (Reference Tucker2018). AFO = Albany–Fraser Orogeny, L. Arc = Loongana Arc, NAC = North Australian Craton, SAC = South Australian Craton, SS = supersuite, WAC = West Australian Craton.

Tucker et al. (Reference Tucker, Payne, Clark, Hand, Taylor and Kylander-Clark2017) proposed that protoliths to the Neoarchean garnet–sapphirine–orthopyroxene gneiss and mafic–felsic orthogneiss in the Bunger Hills were deposited and emplaced, respectively, within an extensional setting involving volcano–clastic sedimentation. The mafic–felsic orthogneiss has age and Hf isotopic affinity to c. 3000–2600 Ma gneisses, granites and metasedimentary rocks of the Northern Foreland of the Albany–Fraser Orogen, which represents the reworked margin of the Yilgarn Craton, and magmatic rocks from the Yilgarn Craton itself (Kirkland et al. Reference Kirkland, Smithies and Spaggiari2015). Although the present dataset limits a robust comparison with the specific terranes of the Yilgarn Craton, the Archean rocks in the Bunger Hills are considered to reflect a rifted, reworked fragment of the Yilgarn Craton margin (Tucker et al. Reference Tucker, Payne, Clark, Hand, Taylor and Kylander-Clark2017) that experienced a similar Proterozoic crustal evolution to the Northern Foreland (see below; Kirkland et al. Reference Kirkland, Spaggiari, Pawley, Wingate, Smithies and Howard2011, Reference Kirkland, Smithies and Spaggiari2015, Spaggiari et al. Reference Spaggiari, Kirkland, Smithies, Wingate and Belousova2015). The Neoarchean age of the basement rocks comprising Association 1 is broadly consistent with the inferred crystallization age of 2660 ± 12 Ma tonalite orthogneiss from the Obruchev Hills (Daczko et al. Reference Daczko, Halpin, Fitzsimons and Whittaker2018; c. 2640 Ma of Sheraton et al. Reference Sheraton, Black and Tindle1992), although the relationship of the two regions remains unclear because of limited isotopic data to facilitate a robust comparison.
Tucker et al. (Reference Tucker, Payne, Clark, Hand, Taylor and Kylander-Clark2017) suggested that the regular layer-parallel distribution of the orthogneiss and metasedimentary rocks in the central Bunger Hills (Associations 2 and 3) reflected the contemporaneous emplacement of magmas and deposition of sediments during Palaeoproterozoic extension (i.e. within a volcano–sedimentary basin). The Hf isotopic compositions of zircon from the Palaeoproterozoic igneous rocks from the Bunger Hills (ɛHf(t) = −6 to +2; Associations 2 and 3; Tucker et al. Reference Tucker, Payne, Clark, Hand, Taylor and Kylander-Clark2017) fall within the compositional range of those from similarly aged orthogneisses in the Biranup Zone (ɛHf(t) = −10 to +8; Kirkland et al. Reference Kirkland, Spaggiari, Pawley, Wingate, Smithies and Howard2011, Reference Kirkland, Spaggiari, Smithies, Wingate, Spaggiari and Tyler2014). Furthermore, the Hf isotopic compositions of the Palaeoproterozoic zircon from both the Bunger Hills and Biranup Zone span a range of Hfinitial and ɛHf(t) values that are more isotopically juvenile than would be expected solely by reworking of the Archean (Yilgarn-like) crust (Tucker et al. Reference Tucker, Payne, Clark, Hand, Taylor and Kylander-Clark2017). The O isotope compositions of the zircon from the Bunger Hills are suggestive, however, of a crustal component within the parent melt to these rocks, leading Tucker et al. (Reference Tucker, Payne, Clark, Hand, Taylor and Kylander-Clark2017) to conclude that they formed by mixing between a juvenile source at c. 1700 Ma and recycled Archean (Yilgarn) basement rocks.
Based on whole-rock geochemistry, Sheraton et al. (Reference Sheraton, Black and Tindle1992) initially suggested that the 1699 Ma Y-depleted granodiorite orthogneiss from the south-west Bunger Hills formed by partial melting of subducted oceanic crust. The 1521 Ma orthogneiss from Thomas Island was interpreted to reflect metamorphic differentiation of the same lithology, supported by inferred metamorphic zircon overgrowths on Palaeoproterozoic zircon cores from this sample (1190 Ma; Sheraton et al. Reference Sheraton, Black and Tindle1992). At present, it is difficult to relate the interpretations of Sheraton et al. (Reference Sheraton, Black and Tindle1992) to those of Tucker et al. (Reference Tucker, Payne, Clark, Hand, Taylor and Kylander-Clark2017) without more robust isotopic data from the former to better constrain the protolith age and a comprehensive geochemical dataset from the latter. Should a widespread subduction signature in magmatic rocks from Associations 2 and 3 be observed, this may provide support for a back-arc rift setting and thus account for the subduction signature inferred by Sheraton et al. (Reference Sheraton, Black and Tindle1992); however, this would contrast with current interpretations for the Biranup Zone, where there is presumed little evidence for Palaeoproterozoic subduction-related magmatism (see below).
The Palaeoproterozoic crustal evolution of the Bunger Hills is considered analogous to that of the Biranup Zone, which involved three phases of Palaeoproterozoic extension and reworking of the Yilgarn Craton margin (1815–1800, 1780–1760 and 1710–1650 Ma; Kirkland et al. Reference Kirkland, Spaggiari, Pawley, Wingate, Smithies and Howard2011, Reference Kirkland, Spaggiari, Smithies, Wingate, Spaggiari and Tyler2014, Spaggiari & Tyler Reference Spaggiari and Tyler2014, Smithies et al. Reference Smithies, Spaggiari and Kirkland2015b, Spaggiari et al. Reference Spaggiari, Kirkland, Smithies, Wingate and Belousova2015), voluminous mantle magmatism during extension (Smithies et al. Reference Smithies, Spaggiari and Kirkland2015b) and widespread sedimentation within a series of sub-basins that were cyclically linked with the emplacement, crystallization and erosion of the Palaeoproterozoic magmatic rocks (Spaggiari et al. Reference Spaggiari, Kirkland, Smithies, Wingate and Belousova2015). Palaeoproterozoic extension was initially proposed to have occurred within a back-arc that formed due to subduction retreat (Kirkland et al. Reference Kirkland, Spaggiari, Pawley, Wingate, Smithies and Howard2011), but was subsequently reinterpreted as occurring in a continental rift, or that the active subduction margin was far-field because of a lack of evidence for subduction-related geochemistry of the igneous rocks (Smithies et al. Reference Smithies, Spaggiari and Kirkland2015b), the maturity of the basin sediments and the abundance of Yilgarn Craton detritus (Spaggiari et al. Reference Spaggiari, Kirkland, Smithies, Wingate and Belousova2015). In the latter scenario, the subduction zone was possibly as distal as the present-day Madura or Coompana provinces (Spaggiari & Smithies Reference Spaggiari and Smithies2015, Spaggiari et al. Reference Spaggiari, Kirkland, Smithies, Wingate and Belousova2015) and their East Antarctic equivalents.
The significance of the garnet–cordierite gneiss from the south-central Bunger Hills (sample BH95; Association 2) remains unclear. At present, there is little evidence for c. 1900–1800 Ma magmatism in East Antarctica and central and west Australia, meaning that, regardless of the interpretation on the age data, the Palaeoproterozoic zircon was probably sourced from unexposed or now destroyed Palaeoproterozoic basement rocks (Tucker et al. Reference Tucker, Payne, Clark, Hand, Taylor and Kylander-Clark2017).
One sample of garnet–cordierite gneiss from the central Bunger Hills contains abundant c. 1800–1600 Ma detritus, suggesting that rocks comprising Association 4 were sourced primarily from the Palaeoproterozoic igneous rocks of the Biranup Zone and/or Bunger Hills. Minor age components between c. 2200 and 1800 Ma are suggestive of more far-field sources, such as parts of the northern West Australian Craton, and rare Neoarchean ages are suggestive of a minor contribution from Archean (Yilgarn) basement rocks (Tucker et al. Reference Tucker, Payne, Clark, Hand, Taylor and Kylander-Clark2017). Deposition was approximately synchronous with sedimentation in the Windmill Islands, east Albany–Fraser Orogen and west Musgrave Inlier (Arid Basin and equivalent; Fig. 4) that occurred between c. 1600 and 1305 Ma (Spaggiari et al. Reference Spaggiari, Kirkland, Smithies, Wingate and Belousova2015), although their zircon provenance diverges, with the majority of detritus sourced from an oceanic arc (c. 1410 Ma) and lesser recycled Palaeoproterozoic basin sediments, and detritus from the Biranup Zone and the Yilgarn Craton (Spaggiari et al. Reference Spaggiari, Kirkland, Smithies, Wingate and Belousova2015, Morrissey et al. Reference Morrissey, Payne, Hand, Clark, Taylor, Kirkland and Kylander-Clark2017b). Morrissey et al. (Reference Morrissey, Payne, Hand, Clark, Taylor, Kirkland and Kylander-Clark2017b) infer a back-arc setting for sediment deposition, whereas Spaggiari et al. (Reference Spaggiari, Kirkland, Smithies, Wingate and Belousova2015) infer a passive margin with sedimentation in a fore-arc to foreland basin. The abundance of Archean–Palaeoproterozoic detritus and a lack of younger isotopically juvenile zircon in the Bunger Hills metasedimentary rocks suggest that sediment deposition occurred proximal to the craton margin, but further analyses are required to be able to contribute to interpretations surrounding the passive margin vs back-arc models for the Arid Basin and correlatives.
Structural and lithological observations and geochronological data suggest that Mesoproterozoic magmatism in the Bunger Hills occurred during syn–late granulite facies metamorphism (Stüwe & Wilson Reference Stüwe and Wilson1990, Sheraton et al. Reference Sheraton, Tingey, Oliver and Black1995, Tucker & Hand Reference Tucker and Hand2016, Tucker et al. Reference Tucker, Payne, Clark, Hand, Taylor and Kylander-Clark2017). The isotopically evolved nature of the plutonic rocks (Sheraton et al. Reference Sheraton, Tingey, Oliver and Black1995, Tucker et al. Reference Tucker, Payne, Clark, Hand, Taylor and Kylander-Clark2017) suggests that their protoliths formed by crustal recycling of Archean crust (i.e. Association 1) mixed with juvenile melts and/or partial melting of the Palaeoproterozoic rocks (i.e. Association 2 and 3) with minor juvenile addition (Tucker et al. Reference Tucker, Payne, Clark, Hand, Taylor and Kylander-Clark2017). This interpretation is consistent with that based initially on geochemical data that these rocks were derived from an enriched mantle source (Stüwe & Wilson Reference Stüwe and Wilson1990, Sheraton et al. Reference Sheraton, Black and Tindle1992, Reference Sheraton, Tingey, Oliver and Black1995). Isotopic data of Sheraton et al. (Reference Sheraton, Black and Tindle1992) for the Algae Lake Pluton suggested derivation from a heterogeneous, long-enriched mantle source and that the parent magmas were probably of crustal origin, but whether they entirely reflected subduction-related mantle enrichment processes or were due to more direct crustal contamination was uncertain.
Two-pyroxene, Al-in-amphibole, Ti-in-biotite and clinopyroxene–plagioclase–quartz thermobarometry suggest that the Mesoproterozoic intrusives were emplaced at 800–900°C at 5–7 kbar (i.e. ~20 km depth; Sheraton et al. Reference Sheraton, Tingey, Oliver and Black1995). These constraints are supported by the presence of pigeonite in granites and quartz monzodiorites from the Paz Cove and Booth Peninsula batholiths, suggesting that crystallization occurred at > 820°C at 5 kbar (Sheraton et al. Reference Sheraton, Tingey, Oliver and Black1995).
Despite recent geochronological studies (e.g. Stark et al. Reference Stark, Wang, Li, Rasmussen, Sheppard and Zi2018), the overall lack of robust age constraints means that the petrogenesis and tectonic context of each dyke generation in the Bunger Hills remains largely unclear and is an avenue for further work. Trace element and isotope geochemistry have suggested that the young dyke generations were derived from at least six different, heterogeneous sources of partially melted mantle (Sheraton et al. Reference Sheraton, Black, McCulloch and Oliver1990). The largest mafic dyke (Group 3–4) is sourced from enriched mid-ocean ridge basalt with an ocean-island basalt-like crustal component; the other dyke generations were probably derived from at least two sources with slightly depleted to moderately enriched compositions (Sheraton et al. Reference Sheraton, Black, McCulloch and Oliver1990, Stark et al. Reference Stark, Wang, Li, Rasmussen, Sheppard and Zi2018). Stark et al. (Reference Stark, Wang, Li, Rasmussen, Sheppard and Zi2018) suggested that dyke emplacement at c. 1140 Ma occurred due to mafic underplating and was associated with orogenic collapse (i.e. thermal weakening) during the waning stages of high-temperature metamorphism. Stark et al. (Reference Stark, Wang, Li, Rasmussen, Sheppard and Zi2018) also proposed a regional correlation between similarly orientated olivine gabbro dykes in the Windmill Islands, suggesting that a major dyke swarm (~400 km in extent) may have been emplaced due to plume-related activity and mantle interaction with a chemically heterogeneous and variable metasomatized lithosphere.
Liu et al. (Reference Liu, Li, Pisarevsky, Kirscher, Mitchell and Stark2018) recently provided palaeomagnetic data for East Antarctica based on precise age dating of the largest mafic dyke from the Bunger Hills (north-west trending, Group 4), but noted geographical disparity between this palaeopole and two previously measured (and similarly aged) poles from Dronning Maud Land (c. 1130 Ma) and Coats Land (c. 1100 Ma). Liu et al. (Reference Liu, Li, Pisarevsky, Kirscher, Mitchell and Stark2018) concluded that these parts of East Antarctica were not rigid terranes at 1134 Ma and were probably unconnected until the final assembly of Gondwana at c. 520 Ma, and thus Precambrian continental reconstructions of East Antarctica remain speculative.
High-grade metamorphism
The Bunger Hills were originally thought to have experienced high-temperature metamorphism at 1190 ± 15 Ma (Sheraton et al. Reference Sheraton, Black and Tindle1992), during D1 deformation (Stüwe & Powell Reference Stüwe and Powell1989), based on the age of inferred metamorphic zircon overgrowths from one sample of tonalite orthogneiss from Thomas Island. Daczko et al. (Reference Daczko, Halpin, Fitzsimons and Whittaker2018) recently re-dated the same sample, obtaining a weighted mean U–Pb zircon age of 1166 ± 8 Ma. Zircon geochronology on legacy samples of Sheraton et al. (Reference Sheraton, Tingey, Oliver and Black1995) from the Bunger Hills, HJA and nearby nunataks are consistent with these ages (c. 1180–1165 Ma; Daczko et al. Reference Daczko, Halpin, Fitzsimons and Whittaker2018); however, a large in situ monazite and zircon geochronology dataset has suggested that high temperatures were maintained over a significantly longer timeframe (c. 150 Myr; Tucker & Hand Reference Tucker and Hand2016, Tucker et al. Reference Tucker, Payne, Clark, Hand, Taylor and Kylander-Clark2017, Reference Tucker, Hand, Kelsey, Taylor, Clark and Payne2018), with peak metamorphism constrained to between c. 1220 and 1180 Ma (Tucker et al. Reference Tucker, Hand, Kelsey, Taylor, Clark and Payne2018). These new constraints on the timing and duration of high-temperature metamorphism and revised interpretations on the episodic emplacement of Mesoproterozoic magmas over a longer period (see above) are reflective of much more continuous processes than initially thought, challenging the deformation history proposed by previous workers (Table II) that is seemingly rigid, but not rate constrained.
Using forward phase equilibria modelling, Tucker et al. (Reference Tucker, Hand, Kelsey, Taylor, Clark and Payne2018) and Tucker and Hand (Reference Tucker and Hand2016) constrained the peak pressure–temperature (P–T) conditions to 5.5–7.1 kbar at 800–960°C from garnet–cordierite ± sillimanite ± orthopyroxene ± magnetite assemblages in the Bunger Hills and 6–9 kbar at 850–950°C from garnet ± sillimanite ± rutile-bearing assemblages in the HJA. These revised pressure constraints are consistent with those obtained initially by conventional thermobarometry by Stüwe and Powell (Reference Stüwe and Powell1989). These P–T conditions are consistent with the observation that mafic granulite in the north-east Bunger Hills contains garnet (Sheraton et al. Reference Sheraton, Tingey, Oliver and Black1995). Both the initial and revised peak P–T conditions suggest that the HJA attained slightly higher temperature and pressure conditions than the Bunger Hills (Stüwe & Powell Reference Stüwe and Powell1989, Tucker & Hand Reference Tucker and Hand2016, Tucker et al. Reference Tucker, Hand, Kelsey, Taylor, Clark and Payne2018).
Tucker et al. (Reference Tucker, Hand, Kelsey, Taylor, Clark and Payne2018) considered the peak P–T estimates to relate to the first phase of deformation and formation of the S1–S2 fabric. This is because the fabric is defined by the alignment of K-feldspar-rich leucosomes and minerals that are inferred to form part of the peak mineral assemblage within the sillimanite–biotite–garnet–cordierite–magnetite-rich melanosome. The S1–S2 fabric is transposed by tight–isoclinal mesoscale F2 folds and steeply reorientated by regional, open, upright F3 folds (see above; Stüwe & Powell Reference Stüwe and Powell1989, Sheraton et al. Reference Sheraton, Tingey, Oliver and Black1995, Tucker et al. Reference Tucker, Payne, Clark, Hand, Taylor and Kylander-Clark2017). Orthopyroxene- and cordierite-bearing leucosomes (Fig. 3h & i) also overprint the reorientated S1–S2 fabrics and sometimes align axial planar to F3, providing evidence that high temperatures persisted during the third deformation phase and that the rocks continued to undergo partial melting as pervasive strain declined (Tucker et al. Reference Tucker, Hand, Kelsey, Taylor, Clark and Payne2018).
Revised interpretations on the microstructural relationships, abundances and compositions of the peak metamorphic minerals suggest that the Bunger Hills and HJA rocks cooled along a post-peak down-temperature to isobaric path (Tucker & Hand Reference Tucker and Hand2016, Tucker et al. Reference Tucker, Hand, Kelsey, Taylor, Clark and Payne2018). This interpretation is consistent with early observations of garnet forming a symplectitic corona around orthopyroxene in granite from the Paz Cove Batholith and orthogneiss from the north-east HJA (Sheraton et al. Reference Sheraton, Tingey, Oliver and Black1995). Tucker et al. (Reference Tucker, Payne, Clark, Hand, Taylor and Kylander-Clark2017) observe cordierite and orthopyroxene coronae about garnet and cordierite and plagioclase coronae around sapphirine and spinel in Archean metasedimentary rocks from the south-east Bunger Hills. Orthopyroxene and cordierite also occur within the inferred syn–late-D3 leucosomes, and they are suggestive of low-pressure, high-temperature conditions after peak metamorphism; however, their absolute timing and P–T conditions are currently unconstrained, as it is unclear what mineral assemblage they existed in equilibrium with, as the P–T models are interpreted to relate to S1–S2 (Tucker et al. Reference Tucker, Hand, Kelsey, Taylor, Clark and Payne2018).
Regional Mesoproterozoic correlations
Rare nunataks and coastal exposures of the East Antarctic basement rocks, immediately west of the Bunger Hills (Fig. 1; Obruchev Hills, Mount Strathcona, Cape Harrison), also record evidence for Mesoproterozoic metamorphic zircon and monazite growth and recrystallization (c. 1190–1140 Ma; Table I; Mikhalsky et al. Reference Mikhalsky, Belyatsky and Presnyakov2015a, Daczko et al. Reference Daczko, Halpin, Fitzsimons and Whittaker2018) and charnockite emplacement (1142 ± 3.6 Ma, Obruchev Hills; Alexeev et al. Reference Alexeev, Zinger and Kapitonov2011). Evidence for Mesoproterozoic high-temperature metamorphism, deformation and magmatism (between c. 1345–1260 and/or c. 1220–1130 Ma) is also preserved in the Windmill Islands (Post Reference Post2000, Morrissey et al. Reference Morrissey, Hand and Kelsey2017a), the Albany–Fraser Orogen in south-west Australia (Clark et al. Reference Clark, Hensen and Kinny2000, Smithies et al. Reference Smithies, Spaggiari and Kirkland2015b), Madura and Coompana provinces in southern Australia (Spaggiari & Smithies Reference Spaggiari and Smithies2015, Wise et al. Reference Wise, Pawley and Dutch2015, Kirkland et al. Reference Kirkland, Smithies, Spaggiari, Wingate, de Gromard and Clark2017) and Warumpi Province, Musgrave Inlier and southern parts of the North Australian Craton in central Australia (Figs 4 & 5; Morrissey et al. Reference Morrissey, Payne, Kelsey and Hand2011, Smithies et al. Reference Smithies, Howard, Evins, Kirkland, Kelsey and Hand2011, Tucker et al. Reference Tucker, Hand, Kelsey and Dutch2015, Walsh et al. Reference Walsh, Kelsey, Kirkland, Hand, Smithies and Clark2015, Wong et al. Reference Wong, Morrissey, Hand, Fields and Kelsey2015). This shared high-temperature Mesoproterozoic evolution is broadly attributed to convergence between the North and West Australian cratons and the Mawson Continent (South Australian and Mawson cratons; e.g. Clark et al. Reference Clark, Hensen and Kinny2000, Fitzsimons Reference Fitzsimons2003, Tucker Reference Tucker2018 and references therein).
Summarised pressure–temperature (P–T) constraints for Stage 1 (orange) and Stage 2 (blue) metamorphism in the Musgrave–Albany–Fraser–Wilkes Orogen. Data from the Bunger Hills and Highjump Archipelago are indicated by blue filled ellipses. Dashed lines indicate that P–T constraints were obtained by conventional thermobarometry or estimated from field observations; all other constraints are based on forward phase equilibria modelling. Figure adapted from Tucker (Reference Tucker2018). Data are from: 1) Southern Aileron/North Warumpi Province (Wong et al. Reference Wong, Morrissey, Hand, Fields and Kelsey2015), 2) East Warumpi Province (Morrissey et al. Reference Morrissey, Payne, Kelsey and Hand2011), 3) East Musgrave Inlier, Kalamurta Gneiss (Tucker et al. Reference Tucker, Hand, Kelsey and Dutch2015) and Mulga Park andalusite-bearing rocks (unpublished), 4) West Musgrave Inlier (Walsh et al. Reference Walsh, Kelsey, Kirkland, Hand, Smithies and Clark2015), 5) Biranup Zone (Bordorkos & Clark 2004), 6) Bunger Hills (Tucker et al. Reference Tucker, Payne, Clark, Hand, Taylor and Kylander-Clark2017), 7) Highjump Archipelago (Tucker & Hand Reference Tucker and Hand2016), 8) Windmill Islands (Morrissey et al. Reference Morrissey, Hand and Kelsey2017a), 9) Madura Province (Salisbury Gneiss; Clark et al. Reference Clark, Hensen and Kinny2000), 10) East Nornalup Zone (Ragged Basin; Clark et al. Reference Clark, Hensen and Kinny2000), 11) East Nornalup Zone (Malcolm Metamorphics; Clark et al. Reference Clark, Hensen and Kinny2000), 12) Fraser Zone (Arid Basin; Clark et al. Reference Clark, Kirkland, Spaggiari, Oorschot, Wingate and Taylor2014), 13) Fraser Zone (gabbro; Glasson et al. Reference Glasson, Johnson, Kirkland, Gardiner, Clark and Blereau2019) and 14) Barren Basin (Fly Dam Formation; Kirkland et al. Reference Kirkland, Spaggiari, Johnson, Smithies, Danišík and Evans2016). AND = andalusite, KY = kyanite, SILL = sillimanite.

Magmatism and metamorphism between c. 1345 and 1260 Ma were spatially confined to central parts of the orogen (i.e. the Windmill Islands, eastern parts of the Albany–Fraser Orogen and west Musgrave Inlier; Tucker Reference Tucker2018) and were controlled by the ‘soft collision’ of an oceanic arc (Spaggiari et al. Reference Spaggiari, Kirkland, Smithies, Wingate and Belousova2015, Reference Spaggiari, Smithies, Kirkland, Wingate, England and Lu2018) and subsequent generation of a back-arc basin (Morrissey et al. Reference Morrissey, Payne, Hand, Clark, Taylor, Kirkland and Kylander-Clark2017b, Glasson et al. Reference Glasson, Johnson, Kirkland, Gardiner, Clark and Blereau2019) and/or westward-migrating lower crustal hot zone (Smithies et al. Reference Smithies, Spaggiari and Kirkland2015b, Spaggiari et al. Reference Spaggiari, Kirkland, Smithies, Wingate and Belousova2015). Rocks in the Bunger Hills did not show or were metamorphically unresponsive to deformation and magmatism at this time. The Bunger Hills and Windmill Islands do, however, record minor emplacement of granitic–tonalitic magmas at c. 1260–1215 Ma (Post Reference Post2000, Zhang et al. Reference Zhang, Zhao, Liu, Liu, Hou, Li and Ye2012, Morrissey et al. Reference Morrissey, Payne, Hand, Clark, Taylor, Kirkland and Kylander-Clark2017b, Tucker et al. Reference Tucker, Payne, Clark, Hand, Taylor and Kylander-Clark2017). Magmatism of this age is not recorded in the Australian terranes of the Musgrave–Albany–Fraser–Wilkes Orogen (MAFWO), suggesting that this event was localized or that equivalent magmatism occurred later in the Bunger Hills and Windmill Islands. At present, magmatism of this age in East Antarctica is therefore largely tectonically ambiguous. The Hf isotope compositions of zircon from c. 1260 Ma orthogneiss from the Bunger Hills suggest that the parent magmas to these rocks formed from reworked Yilgarn Craton/Biranup Zone crust (and/or equivalent rocks in the Bunger Hills; see above) with minor mantle addition (Tucker et al. Reference Tucker, Payne, Clark, Hand, Taylor and Kylander-Clark2017). The c. 1260–1215 Ma granitoids in both the Bunger Hills and Windmill Islands are foliated and deformed by upright folds (Morrissey et al. Reference Morrissey, Hand and Kelsey2017a, Tucker et al. Reference Tucker, Hand, Kelsey, Taylor, Clark and Payne2018).
Magmatism and metamorphism between c. 1220 and 1130 Ma were widespread, occurring within all tectonic regions of the MAFWO (Tucker Reference Tucker2018 and references therein). Magmatism was almost exclusively voluminous felsic–intermediate to charnockitic; however, field evidence for bimodal mafic and felsic magmatism and mafic dyke emplacement is recorded in the Bunger Hills (Sheraton et al. Reference Sheraton, Black, McCulloch and Oliver1990, Reference Sheraton, Black and Tindle1992, Reference Sheraton, Tingey, Oliver and Black1995). Zircon Hf isotope compositions and whole-rock Nd isotopes from the felsic plutonic rocks also suggest variable incorporation of a mantle end member source into their parent magmas (Smithies et al. Reference Smithies, Howard, Evins, Kirkland, Kelsey and Hand2011, Reference Smithies, Kirkland, Korhonen, Aitken, Howard and Maier2015a, Reference Smithies, Spaggiari and Kirkland2015b, Howard et al. Reference Howard, Smithies, Kirkland, Kelsey, Aitken and Wingate2015, Kirkland et al. Reference Kirkland, Smithies, Spaggiari, Wingate, de Gromard and Clark2017, Morrissey et al. Reference Morrissey, Payne, Hand, Clark, Taylor, Kirkland and Kylander-Clark2017b, Tucker et al. Reference Tucker, Payne, Clark, Hand, Taylor and Kylander-Clark2017). Their isotopic signature reflects the pre-existing crust that they intruded combined with new mantle input, with the most evolved magmas occurring in regions interpreted to have reworked craton margins (e.g. the Biranup Zone and Bunger Hills; Tucker Reference Tucker2018 and references therein).
The peak metamorphic conditions and post-peak down-temperature P–T path recorded by the Bunger Hills are consistent with equivalent-aged high-temperature metamorphism in other parts of the orogen (Fig. 5). Magmatism and metamorphism between c. 1220 and 1130 Ma were independent of the spatial extent of c. 1345–1260 Ma tectonothermal events (Tucker Reference Tucker2018), suggesting that the thermal driver for the younger event was not the same as the former, was independent of pre-existing crustal character and was considerably more regional. Metamorphism between c. 1220 and 1130 Ma was characterized by remarkably similar high to ultrahigh apparent thermal gradients (Fig. 5), which is suggestive of an orogen-wide thermal driver and regional geodynamic control on metamorphism. Differences in absolute P–T probably reflect different mid–lower crustal expressions of metamorphism within the same orogenic system (Fig. 5; Tucker Reference Tucker2018) and the local effects of advective heating due to the syn-metamorphic emplacement of magmas (e.g. Windmill Islands; Morrissey et al. Reference Morrissey, Hand and Kelsey2017a). Peak pressures are low to moderate and differences in metamorphic pressure are smaller than differences in temperature (Fig. 5; Tucker Reference Tucker2018), suggesting that c. 1220–1130 Ma metamorphism and magmatism were associated with extension rather than tectonic thickening. This interpretation is supported by the consistent shallow decompressive to quasi-isobaric post-peak evolutions orogen-wide (Fig. 5).
Tucker (Reference Tucker2018) surmised that regional, long-lived and anomalously high thermal gradients during metamorphism, P–T evidence for thin crust and large-volume crustal melting with a significant mantle source contribution require unusually high heat flow and can be explained by mantle lithosphere removal, specifically delamination. The specific mechanism that initiated orogen-wide delamination, however, is presently ambiguous, but it is inferred to relate to the anatomy of the final craton convergence between the two Mesoproterozoic tectonothermal events (Tucker Reference Tucker2018) in which all terranes of the MAFWO were joined and thus recorded a united c. 1220–1130 Ma thermal evolution (e.g. Clark et al. Reference Clark, Hensen and Kinny2000, Fitzsimons Reference Fitzsimons2003, Boger Reference Boger2011, Tucker Reference Tucker2018 and references therein).
Gondwanan assembly and Pan-African tectonothermal events
Initial models for the late Neoproterozoic–early Cambrian assembly of Gondwana interpret East Antarctica, parts of east Africa, India and Australia to have remained as a coherent crustal block since the breakup of Rodinia, with these continents linked by c. 1300–900 Ma orogenic belts (e.g. Hoffman Reference Hoffman1991, Moores Reference Moores1991, Meert & Van Der Voo Reference Meert and Van Der Voo1997). Fitzsimons (Reference Fitzsimons2000) subsequently identified that Rodinian orogenesis occurred at 1330–1130 and 980–900 Ma in Wilkes Land and the Rayner Complex in East Antarctica, respectively, and considered these two age populations to be indicative of Indo-Antarctic and Australo-Antarctic crust. These early interpretations were reinforced by Mikhalsky et al. (Reference Mikhalsky, Belyatsky, Presnyakov, Skublov, Kovach and Rodionov2015b), who identified abundant 980–920 Ma metamorphic zircon in in situ basement rocks from Mount Brown and Mirny Station and xenocrystic zircon in Quaternary lavas from Gaussberg volcano. Daczko et al. (Reference Daczko, Halpin, Fitzsimons and Whittaker2018) compiled previously published detrital zircon data from offshore sediments and highlighted contrasting age populations between Prydz Bay (980–900 Ma) and the Wilkes Land coast (1190–1140 Ma), which is consistent with the known onshore geology. Mulder et al. (Reference Mulder, Halpin, Daczko, Orth, Meffre and Thompson2019) also demonstrated that Indo- and Australo-Antarctic crust have distinct Pb isotope signatures and hence evolved independently with respect to their tectonothermal histories, prior to being juxtaposed.
Furthermore, Daczko et al. (Reference Daczko, Halpin, Fitzsimons and Whittaker2018) identified that offshore detritus from Prydz Bay and the Denman Glacier coastline recorded ages of c. 550–500 Ma, supporting the record of Cambrian high-grade metamorphism and felsic magmatism from rare exposures in this region (e.g. Sheraton et al. Reference Sheraton, Black and Tindle1992, Dirks & Wilson Reference Dirks and Wilson1995, Carson et al. Reference Carson, Fanning and Wilson1996, Fitzsimons et al. Reference Fitzsimons, Kinny and Harley1997, Harley Reference Harley2003, Mikhalsky et al. Reference Mikhalsky, Sheraton, Kudriavtsev, Sergeev, Kovach and Kamenev2013, Reference Mikhalsky, Belyatsky, Presnyakov, Skublov, Kovach and Rodionov2015b, Gardner et al. Reference Gardner, Daczko, Halpin and Whittaker2015, Morrissey et al. Reference Morrissey, Hand, Kelsey and Wade2016) and dredge samples from the Batavia and Gulden Draak knolls and Naturaliste Plateau that reconstruct close to this location in Gondwanan East Antarctica (Halpin et al. Reference Halpin, Crawford, Direen, Coffin, Forbed and Borissova2008, Reference Halpin, Daczko, Kobler and Whittaker2017, Gardner et al. Reference Gardner, Daczko, Halpin and Whittaker2015). Notably, there is a comparative lack of Cambrian ages in Wilkes Land and the Rayner Complex to the east and west of these regions, respectively.
The differences in protolith age between Wilkes Land and the Rayner Complex (excluding locally identified 1380–1020 Ma orthogneiss in the Rayner Complex; e.g. Liu et al. Reference Liu, Zhao, Song, Liu and Cui2009, Halpin et al. Reference Halpin, Daczko, Milan and Clarke2012), evidence for anorogenic magmatism approximately between the two and c. 700–750 Ma palaeopoles from India (Torsvik et al. Reference Torsvik, Carter, Ashwal, Bhushan, Pandit and Jamtveit2001, Gregory et al. Reference Gregory, Meert, Bingen, Pandit and Torsvik2009) and Australia (Wingate & Giddings Reference Wingate and Giddings2000) suggest that crust with Indo- and Australo-Antarctic affinity collided during the Ediacaran–Cambrian (Gondwana assembly; e.g. Fitzsimons Reference Fitzsimons2000, Reference Fitzsimons2003, Wilson et al. Reference Wilson, Boger and Fanning2001, Meert Reference Meert2003, Boger Reference Boger2011, Aitken et al. Reference Aitken, Young, Ferraccioli, Betts, Greenbaum and Richter2014, Reference Aitken, Betts, Young, Blankenship, Roberts and Siegert2016, Halpin et al. Reference Halpin, Daczko, Kobler and Whittaker2017, Mulder et al. Reference Mulder, Halpin, Daczko, Orth, Meffre and Thompson2019). The suture is inferred to bisect East Antarctica, immediately west of the Bunger Hills, approximately beneath the Denman and/or Scott glaciers (Fitzsimons Reference Fitzsimons2003, Meert Reference Meert2003, Boger Reference Boger2011, Harley et al. Reference Harley, Fitzsimons and Zhao2013, Aitken et al. Reference Aitken, Young, Ferraccioli, Betts, Greenbaum and Richter2014), although its exact position and geometry are unclear as it is concealed by the Antarctic ice sheet (see Fig. 1b). Furthermore, the specific timing of collision is not well constrained from palaeomagnetic data (Halpin et al. Reference Halpin, Daczko, Kobler and Whittaker2017).
Using geophysical data, Aitken et al. (Reference Aitken, Young, Ferraccioli, Betts, Greenbaum and Richter2014) suggested that the Gondwanan suture intersected the coast near Scott Glacier (Fig. 1b) and that its position was defined by prominent changes in density and subglacial topography and the truncation of magnetic features, which trend NE in Australo-Antarctica and SSE in Indo-Antarctica. Gardner et al. (Reference Gardner, Daczko, Halpin and Whittaker2015) subsequently proposed that the suture was located ~50 km further west, near the Denman Glacier, whilst Maritati et al. (Reference Maritati, Aitken, Young, Roberts, Blankenship and Siegert2016) suggested that it passed through Chugunov Island (Fig. 1b). Using U–Pb ages of offshore detritus along the East Antarctic coast as a proxy for the poorly exposed subglacial crust and new geochronology from inland exposures, Daczko et al. (Reference Daczko, Halpin, Fitzsimons and Whittaker2018) demonstrated that rocks on both sides of all previously proposed sutures in the Denman–Scott Glacier area have Australo-Antarctic affinities, and they alternatively suggested that the suture was located further west, within a ~250 km stretch of coastline between Mirny and Cape Charcot. Specifically, Daczko et al. (Reference Daczko, Halpin, Fitzsimons and Whittaker2018) suggested the terrane boundary to be one of the geophysical lineaments east of Mirny Station identified by Aitken et al. (Reference Aitken, Young, Ferraccioli, Betts, Greenbaum and Richter2014), which they term the Mirny Fault (Fig. 1b). Further support for the juxtaposition of Indo- and Australo-Antarctic crust along the Mirny Fault (Daczko et al. Reference Daczko, Halpin, Fitzsimons and Whittaker2018) comes from detrital feldspar, zircon and monazite isotopic data from offshore Holocene sediments near Mirny Station that were sourced locally from crust either side of the Mirny Fault and include contributions from both Indo- and Australo-Antarctic crust (Mulder et al. Reference Mulder, Halpin, Daczko, Orth, Meffre and Thompson2019).
The suture was initially interpreted as a collision zone between Indo-Antarctic and Australo-Antarctic terranes (e.g. Fitzsimons Reference Fitzsimons2003, Boger & Miller Reference Boger and Miller2004, Collins & Pisarevsky Reference Collins and Pisarevsky2005, Boger Reference Boger2011, Harley et al. Reference Harley, Fitzsimons and Zhao2013); however, this tectonic interpretation was based on limited coastal exposures and is thus speculative. Syenitic to granitic magmatism (c. 516 Ma) between Mirny and the Bunger Hills is interpreted to be post-orogenic or anorogeneic (Sheraton et al. Reference Sheraton, Black and Tindle1992). Hf isotope compositions of zircon from the Cambrian granites are also suggestive of reworking of Archean (> 2.9 Ga) crust, possibly from the Yilgarn Craton, Cape Charcot, Obruchev Hills or Bunger Hills, with little juvenile input, which is inconsistent with their emplacement in an arc environment (i.e. subduction zone) and more consistent with strike-slip tectonics (Halpin et al. Reference Halpin, Daczko, Kobler and Whittaker2017). This interpretation is consistent with some recent palaeogeographic reconstructions that juxtapose Indo- and Australo-Antarctic terranes in Gondwana along a sinistral strike-slip margin (Gregory et al. Reference Gregory, Meert, Bingen, Pandit and Torsvik2009, Li et al. Reference Li, Evans and Halverson2013), the inferred reactivation direction of basement faults in Mesozoic west Australian basins during Gondwanan breakup (Hall et al. Reference Hall, Gibbons, Bernardel, Whittaker, Nicholson and Rollet2013), Cambrian strike-slip kinematics near the Darling Fault (Beeson et al. Reference Beeson, Delor and Harris1988, Fitzsimons Reference Fitzsimons2003) and the approximately east to west trend of c. 500 Ma mafic dykes in the Bunger Hills that imply and approximately north to south extension (Sheraton et al. Reference Sheraton, Black, McCulloch and Oliver1990) and is thus consistent with sinistral strike-slip movement along possible terrane boundaries to the west of the Bunger Hills (e.g. Aitken et al. Reference Aitken, Young, Ferraccioli, Betts, Greenbaum and Richter2014, Halpin et al. Reference Halpin, Daczko, Kobler and Whittaker2017, Daczko et al. Reference Daczko, Halpin, Fitzsimons and Whittaker2018, Mulder et al. Reference Mulder, Halpin, Daczko, Orth, Meffre and Thompson2019). The record of Cambrian metamorphism and deformation in East Antarctica between the Rayner Complex and Wilkes Land may therefore be suggestive of a sinistral strike-slip zone that is > 500 km wide and > 2000 km long (Halpin et al. Reference Halpin, Daczko, Kobler and Whittaker2017). Alternatively, Boger and Wilson (Reference Boger and Wilson2005) report evidence for Cambrian compressional orogenesis in the Prydz Bay region, suggesting that this segment of the Gondwanan Orogen may represent a zone of high-angle convergence between Indo- and Australo-Antarctica (i.e. an accretionary or collisional setting). Mulder et al. (Reference Mulder, Halpin, Daczko, Orth, Meffre and Thompson2019) present one possible interpretation of the architecture of the Kuunga Orogen between Mirny and Prydz Bay, suggesting that East Gondwanan assembly involved dominantly strike-slip motion in the Mirny region coupled with high-angle convergence between Indo-Antarctica and Australo-Antarctica further west (see also Fitzsimons Reference Fitzsimons2003, Boger Reference Boger2011, Mikhalsky et al. Reference Mikhalsky, Belyatsky, Presnyakov, Skublov, Kovach and Rodionov2015b). Importantly, there is a lack of Cambrian compressional deformation, metamorphism and subduction-related magmatism in the Bunger Hills region, suggesting that this was not the site of orthogonal collision between Indo- and Australo-Antarctica.
The exact timing of the Gondwanan collision of Indo- and Australo-Antarctica remains unresolved as the current palaeopoles do not provide accurate age constraints. It is also possible that Cambrian zircon in the offshore detritus relates to post-amalgamation granite magmatism as the magmatic rocks are undeformed (Halpin et al. Reference Halpin, Daczko, Kobler and Whittaker2017). Regardless, collision is inferred to have occurred between c. 550–500 Ma (granite crystallization and metamorphic ages; e.g. Corvino et al. Reference Corvino, Boger, Henjes-Kunst, Wilson and Fitzsimons2008, Liu Reference Liu2009, Liu et al. Reference Liu, Zhao, Song, Liu and Cui2009, Gardner et al. Reference Gardner, Daczko, Halpin and Whittaker2015) and c. 630–620 Ma (biotite recrystallization ages from the south-west Yilgarn Craton; Lu et al. Reference Lu, Phillips, Kohn, Gleadow and Matchan2015).
The Bunger Hills and East Gondwana breakup
Post Pan-African tectonism, the Bunger Hills remained in a key position at the triple junction of Greater India, Australia and East Antarctica (e.g. Fitzsimons Reference Fitzsimons2003). Therefore, although the primary scope of this review is the Neoarchean–Cambrian evolution of the Bunger Hills region, we briefly highlight the aerogeophysical data of Aitken et al. (Reference Aitken, Young, Ferraccioli, Betts, Greenbaum and Richter2014) and Maritati et al. (Reference Maritati, Aitken, Young, Roberts, Blankenship and Siegert2016), who identified the inferred Mesozoic Knox Rift. The Knox Rift overprints the Precambrian basement in Wilkes Land, is bounded by the NNE-trending Conger and Scott faults and is inferred to contain a deep sedimentary basin segmented by NNW-trending faults (Fig. 1). Maritati et al. (Reference Maritati, Aitken, Young, Roberts, Blankenship and Siegert2016) suggested the Knox Rift to be a failed transtensional rift that developed during Permian–Triassic global reorganization of East Gondwana and subsequent Jurassic–Cretaceous rifting of Greater India from East Antarctica. Geophysical constraints from the Knox Rift have refined the position of Australia and East Antarctica in full-fit Gonwanan reconstructions, as it is inferred to be a conjugate to the Perth Basin and offshore Mentell Basin of Western Australia (Maritati et al. Reference Maritati, Aitken, Young, Roberts, Blankenship and Siegert2016).
Acknowledgements
The authors wish to acknowledge support from the Australian Antarctic Division (Project 4191) for undertaking fieldwork in the Bunger Hills in the Australian–Antarctic 2014–2015 summer season. A. Maritati and an anonymous reviewer are thanked for their constructive and insightful suggestions and comments on the manuscript. A. Maritati is also thanked for providing a spatial dataset for constructing Fig. 1.
Author contributions
NMT was primarily responsible for the literature review, data collation and preparation of the manuscript and figures. All authors were involved in the original paper concept and design. All authors undertook fieldwork in the Australian–Antarctic 2014–2015 summer season, which formed the basis for this review.


