


The outcomes of political reforms are never perfectly known. This uncertainty is exacerbated as voters are confronted with conflicting predictions from competing political actors. Can parties exploit this uncertainty to shape public opinion?
For example, outcome uncertainty lies at the center of the minimum wage debate. Would increasing the minimum wage help low-income households by raising their wages or hurt them by increasing unemployment? If voters are concerned with the outcome of the policy rather than the policy itself, beliefs about outcomes should be decisive in shaping attitudes to the reform.
Prior research has theoretically and empirically examined how the uncertainty from policy to outcome affects the rhetorical strategies of political actors (see, for example, Hirschman Reference Hirschman1991; Riker Reference Riker, Enelow and Hinich1990, Reference Riker1996). Outcome uncertainty enables opponents of a policy to campaign against it, not by questioning the purpose of the policy but by claiming that the outcomes will be different from those intended. Consequently, voters may find themselves facing conflicting predictions about the outcomes of a policy (Chong and Druckman Reference Chong and Druckman2007). These conflicting predictions may reflect the fact that political actors sincerely disagree in their beliefs about the outcomes. However, political actors may send conflicting predictions even when they share beliefs about outcomes, if they have a private interest in implementing a specific policy (Roemer Reference Roemer1994) or to balance unfavorable predictions from an opponent (Minozzi Reference Minozzi2011). To understand how political debates shape public opinion, it is crucial to understand how voters form beliefs about and attitudes to reforms in conflicting information environments. However, we know little about how conflicting predictions affect public opinion (see Jerit Reference Jerit2009 for an important exception).
Outcome uncertainty is central to many models of institutional choice, legislative voting and bureaucratic delegation (for example, Austen-Smith and Riker Reference Austen-Smith and Riker1987; Callander Reference Callander2008; Gilligan and Krehbiel Reference Gilligan and Krehbiel1990). Yet, except for a handful of studies, it has received little attention in models of elections, voting and accountability, where voters are assumed to base their vote either on policy platforms (for example, Downs Reference Downs1957; Grofman Reference Grofman2004) or outcomes (for example, Adams Reference Adams2012; Lewis-Beck and Stegmaier Reference Lewis-Beck and Stegmaier2000), disregarding the need for rational voters to prospectively assess policies based on uncertain outcomes. Building on insights from work on outcome uncertainty in legislative politics (Austen-Smith Reference Austen-Smith1990; Austen-Smith and Riker Reference Austen-Smith and Riker1987) and candidate uncertainty (Alvarez Reference Alvarez1997; Hobolt Reference Hobolt2006; Shepsle Reference Shepsle1972), I present a spatial preference model for policy proposals with uncertain outcomes in mass elections.
First, I theorize that predictions about outcomes shape voter attitudes by changing beliefs about outcomes – not by changing outcome preferences. Secondly, I argue that uncertainty may increase when the voter is exposed to conflicting information, and that this decreases the appeal of a policy proposal. I test this empirically using a pre-registered survey experiment on three real political reforms in the United States. In the experiment, I manipulate the predicted outcomes of the reforms, the uncertainty of the predictions and the political interest of the senders of the predictions. By manipulating both the predicted outcomes and the uncertainty of the predictions, I am able to separate the effect of changing the voter-expected outcome from the effect of changing uncertainty, unlike prior research on outcome uncertainty.
The experiment shows that respondents change their support for the reforms because their beliefs regarding the outcomes, rather than their outcome preferences, change. Contrary to previous research and the theoretical expectations, I find that respondents give equal weight to pessimistic and optimistic predictions (cf. Jerit Reference Jerit2009; Nadeau, Martin and Blais Reference Nadeau, Martin and Blais1999; Riker Reference Riker1996) and are not repelled by the uncertainty inherent in conflicting predictions. Instead, respondents discount outcome uncertainty by averaging over predictions when forming their beliefs and preferences. This is true even when voters face conflicting predictions from party representatives. The findings question the importance of uncertainty on public opinion formation and corroborate research showing that uncertainty matters little for vote choice and attitude formation (Berinsky and Lewis Reference Berinsky and Lewis2007; Milita et al. Reference Milita2017; Tomz and Van Houweling Reference Tomz and Van Houweling2009).
Influencing voter beliefs is a powerful tool that political actors use to shape public opinion. Even if a reform's appeal does not decrease with the uncertainty of the predictions, its opponents are incentivized to send conflicting signals about its effects in order to shape voters’ beliefs about the expected outcome. In light of the Brexit referendum and the election of Donald Trump, the findings suggest that scholars may have underestimated the electoral prospects of radical reform. This highlights the importance of reconsidering the effect of uncertainty and belief formation on voter behavior and attitude formation.
VOTER BEHAVIOR AND ATTITUDE FORMATION UNDER UNCERTAINTY
Voters face at least two kinds of uncertainty: candidate uncertainty and outcome uncertainty. Candidate uncertainty means that voters cannot be sure what policies a candidate will deliver once he or she takes office. Outcome uncertainty means that voters cannot be sure what the effects of a policy will be once it is enacted. These two forms of uncertainty are conceptually similar, but operate independently of each other. In particular, even if voters know with certainty what policies a candidate will enact once in office, outcome uncertainty may still be considerable because the effects are hard to predict.
Most work on uncertainty in mass elections focuses on candidate uncertainty.Footnote 1 If voters have a dispreference for risk, the attractiveness of a candidate or policy proposal should decrease as uncertainty increases (Shepsle Reference Shepsle1972). While some studies show that perceived candidate uncertainty negatively affects both votes for and evaluations of candidates (Alvarez Reference Alvarez1997; Bartels Reference Bartels1986), more recent studies find that voters are hardly sensitive to uncertainty (Berinsky and Lewis Reference Berinsky and Lewis2007; Tomz and Van Houweling Reference Tomz and Van Houweling2009) or mitigate uncertainty by relying on heuristics such as candidate party affiliation (Milita et al. Reference Milita2017).Footnote 2
Research in political behavior has paid little attention to outcome uncertainty, but this has been examined in formal models of strategic communication, especially in legislative politics (see, for instance, Gilligan and Krehbiel Reference Gilligan and Krehbiel1987, Reference Gilligan and Krehbiel1989). In these models, legislators generally possess some private information about the mapping from policy to outcome and try to influence the beliefs of other legislators to affect their voting behavior. This literature often focuses on characterizing the behavior of senders under different institutional settings. For example, when are senders truthful (Austen-Smith Reference Austen-Smith1990) and when do they reveal or conceal private information (Austen-Smith and Riker Reference Austen-Smith and Riker1987)? How much information senders reveal, and their ability to influence receiver beliefs, have also been examined in theoretical work on outcome uncertainty in mass elections (for example, Minozzi Reference Minozzi2011; Roemer Reference Roemer1994).
These models are based on three assumptions about how persuasion works. First, legislators have preferences over outcomes, but vote on policy proposals (Austen-Smith and Riker Reference Austen-Smith and Riker1987). Secondly, persuasion works through influencing beliefs about the proposal outcomes and not changing outcome preferences (Austen-Smith Reference Austen-Smith1990). Thirdly, beliefs influence proposal preferences because they change the expected outcome or the uncertainty of the outcome (Gilligan and Krehbiel Reference Gilligan and Krehbiel1987). I argue that these modeling assumptions provide important insights into how outcome uncertainty structures persuasion not only between legislators, but also between politicians and voters.
Empirical work on outcome uncertainty suggests that this type of uncertainty matters, but these studies have only partially examined the core modeling assumptions from the theoretical literature. Jacobs and Matthews (Reference Jacobs and Matthews2012) find that as a policy's time horizon increases, both policy and outcome uncertainty increase and support for the policy decreases. However, they do not address whether political actors can themselves influence voter outcome beliefs by making predictions about the effects of policies. Jerit (Reference Jerit2009) exposes respondents to positive and negative predictions about the effect of a policy proposal and finds that respondents give more weight to the negative prediction, which is consistent with a status quo bias. However, neither of these studies manipulate expected outcomes separately from the uncertainty of outcomes, which is necessary to disentangle the two mechanisms. Nor do they fully address the relationship between preferences over policies, preferences over outcomes and outcome beliefs. In their seminal work, Tomz and Van Houweling (Reference Tomz and Van Houweling2009) manipulate both the position and uncertainty of the position of a candidate in the policy space and find that, on average, policy uncertainty does not repel voters. This has not been done in the context of outcome uncertainty. We do not know how outcome uncertainty, produced by conflicting information, affects public opinion.
UNCERTAIN OUTCOMES IN A SPATIAL PREFERENCE MODEL
I provide a simple model of how voters form policy preferences under conditions of outcome uncertainty. The model builds on the assumption that parties campaign on policy proposals while voters care about policy outcomes. For example, voters do not care if the minimum wage is increased by $2 or $4. They care only about how the increase affects the living standard of minimum wage workers. To model this, we need to separate the policy space, Π, from the outcome space, Ω.Footnote 3 Although voters only have a preference over outcomes, indicated by the bliss point in the outcome space, O* ∈ Ω, they do not choose between outcomes. They choose between a policy proposal, P ∈ Π, and the status quo, SQ ∈ Π. While the effect of the status quo, O SQ ∈ Ω, is known with certainty, voters do not know the policy outcome, O p ∈ Ω, with certainty and must therefore assess the policy based on their beliefs about the outcome. Assuming that voters have quadratic utility and, consequently, are risk averse, a voter will prefer the policy over the status quo if:
 $$EU( P\vert m_p) = {-}[ O ^\ast {-}E( O_p\vert m_p) ] ^2-{\mathop{\rm var}} ( O_p\vert m_p) > -( O ^\ast {-}O_{SQ}) ^2 = EU( SQ) , \;$$
where E(⋅) is expectation and  ${\mathop{\rm var}} ( {\cdot} ) $ is the variance of the belief about the policy outcome after receiving some prediction, m p, about the policy outcome (Enelow and Hinich Reference Enelow and Hinich1981).Footnote 4 If the bliss point is fixed, the only way for political actors to influence public opinion is to change voters’ beliefs. As for models of candidate uncertainty (Alvarez Reference Alvarez1997; Hobolt Reference Hobolt2006), there are principally two ways that beliefs can affect attitudes. I illustrate these in Figure 1.
Illustrating two forms of persuasion
Note: the figure shows a policy space, Π, and an outcome space, Ω. P represents a policy proposal and SQ the status quo. O* represents the bliss point of the voter, O SQ refers to the outcome of the status quo and O p the outcome of the policy proposal. The outcome of the policy proposal is not perfectly known, which is represented by the probability distribution around O p.
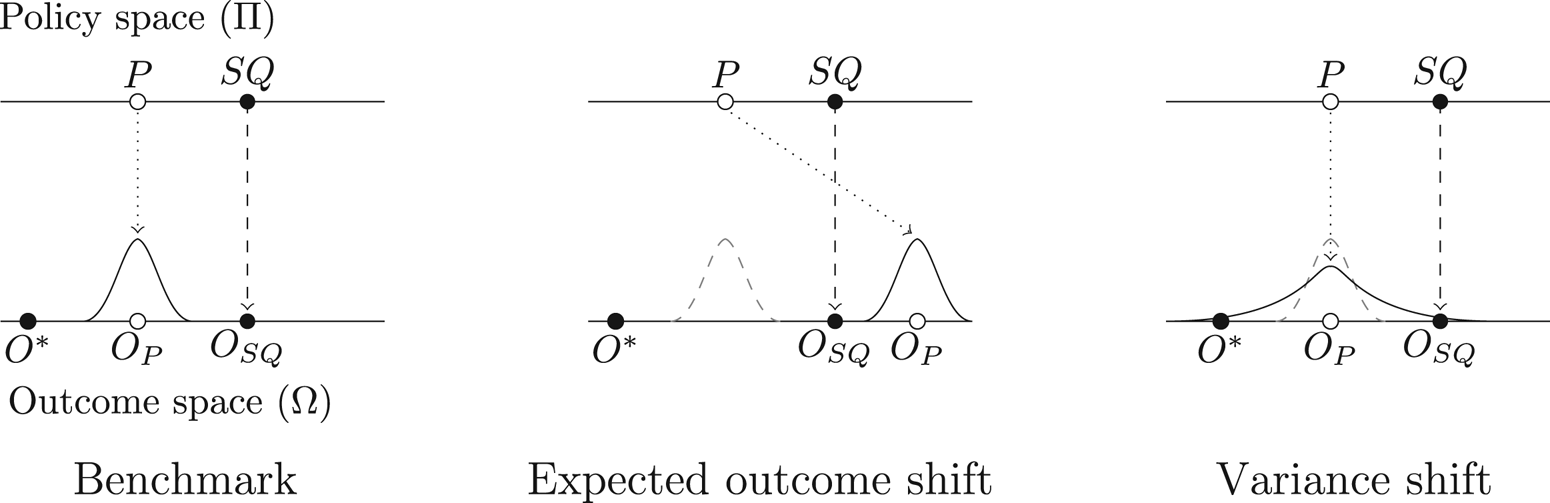
In all three panels in Figure 1, the policy proposal, P, and the status quo, SQ, are held constant. There is no uncertainty about what the policy or the status quo entail. The only thing that changes across the panels is the voter's belief about the policy outcome, O p, represented by the probability distribution in the outcome space. The left panel is our benchmark case. The voter is certain that the policy proposal will produce outcomes closer to the bliss point, O*, compared to the status quo outcome, O SQ; thus the voter prefers the policy proposal over the status quo.
The first way to change voter attitudes is by shifting the expected outcome of the policy proposal. This is captured by the first term of the expected utility of the policy in Equation 1 and is depicted in the center panel. The voter's belief has shifted compared to the left panel, and the voter is certain that the policy proposal will produce worse outcomes compared with the status quo. The voter now prefers the status quo over the policy proposal. From this, I derive the first hypothesis.
Hypothesis 1 As predictions about outcomes improve (deteriorate), support for the policy proposal increases (decreases).
The second way to change voter attitudes is to change the variance of the beliefs – that is, the voter's perceived uncertainty about the outcomes. This is captured by the second term of the policy's expected utility in Equation 1 and is illustrated in the right panel. The expected outcome is identical to that in the left panel, but the uncertainty of the beliefs is much greater. There is a risk that the outcome of the policy proposal will be further from the bliss point compared to the status quo. In such a case, whether the voter prefers the policy over the status quo depends on its risk preferences. Assuming that voters are risk averse, increasing outcome uncertainty will decrease support for the policy compared with a safer option, and it follows that:
Hypothesis 2 As the uncertainty of predictions increases (decreases), support for the policy decreases (increases).
Separating policies and outcomes enables a natural understanding of voter persuasion in a spatial preference framework. I assume that outcome preferences are fixed, but that beliefs are subject to influence. Persuasion through changing beliefs enables voters to change their policy preferences while keeping their outcome preferences constant. Instead of changing voters' views of how the world should work, this form of persuasion changes the voters' views of how it does work. For example, to persuade voters to be less supportive of a minimum wage increase, voters do not have to be convinced that the purpose of the policy – helping low-income workers – is bad. It suffices to convince them that the policy may hurt low-income workers. This also implies that changing policy without changing beliefs may have little impact on public opinion. If no distinction is made between policy proposals and policy outcomes, persuasion implies shifting the voters' outcome preferences (Riker Reference Riker, Enelow and Hinich1990). Returning to the example, this means convincing voters that helping low-income workers is bad. This has implications for how outcome predictions affect voter preferences in the model. What the effect of a policy will be should not influence what a voter would ideally want the outcome to be. That is, outcome predictions should not affect what I call idealistic preferences. Consequently, I expect that:
Hypothesis 3 Predictions do not change idealistic preferences.
Policy preferences, however, are a composite of outcome preferences and beliefs (Austen-Smith Reference Austen-Smith1990; Austen-Smith and Riker Reference Austen-Smith and Riker1987). Since policy preferences depend on outcome beliefs and outcome beliefs depend on predictions, I expect that:
Hypothesis 4 Predictions influence outcome beliefs and, thereby, policy preferences.
From a Bayesian learning perspective, voters use predictions to update beliefs and, thereby, policy attitudes. But predictions about outcomes are not used to update idealistic preferences. In Appendix Section A, I provide a fuller interpretation of the model from a Bayesian learning perspective.
Voters are not experts, and need to rely on external information to form beliefs. Therefore, they should be more susceptible to persuasion through changing outcome beliefs compared to changing idealistic preferences. However, forming outcome beliefs is a complex task and voters will face conflicting messages from politically motivated actors. Political actors have an incentive to misrepresent reality for their own political gain. But they may also have an incentive to be sincere, if the policy outcomes are dire enough (Minozzi Reference Minozzi2011). Since voters cannot be sure what motivates politicians, communication becomes ineffective. In the model, I implicitly assume that voters update their beliefs when presented with predictions. Yet, it may be that voters discount predictions from politicians as cheap talk. The view of voters as rational and cognizant has been the subject of a great deal of scholarship. Numerous studies find that voters are ignorant, misinformed and persuadable (for example, Achen and Bartels Reference Achen and Bartels2016; Carpini and Keeter Reference Carpini and Keeter1996; Lenz Reference Lenz2013), yet other studies find that voters are sophisticated enough to distinguish cheap talk from costly signals (Alt, Marshall, and Lassen Reference Alt, Marshall and Lassen2016; Fernandez-Vazquez Reference Fernandez-Vazquez2019). Thus, we do not know whether voters are competent enough to identify and discount cheap talk signals. It is therefore of substantial interest to examine how voters update their beliefs when the self-interest of the sender varies. Even if voters update their attitudes strongly when their beliefs change, it is ineffective for political actors to attempt to shape public opinion by changing voter beliefs if voters discount information from political actors.
EXPERIMENTAL DESIGN
In this section, I present a survey experiment testing the hypotheses derived from the theoretical model. In the experiment, the respondents are presented with predictions of outcomes of three real policy proposals from the US political debate.Footnote 5 The treatments consist of manipulating the message, m p, in Equation 1, to influence respondents’ posterior beliefs. The predictions vary in the predicted outcome, the uncertainty about the predicted outcome and sender credibility. I examine how the predictions influence individual outcome beliefs, idealistic preferences and support for the policy proposals.
Sampling Strategy
Data was collected using an online survey of 5,888 respondents (approximately 5,500 treated and 350 control), with quota sampling by age, sex, education, income and partisanship.Footnote 6 Due to the potential problem of prior heterogeneity, the most relevant variation in testing the theory is the variation between treatment groups – not between the treatment groups and the control group. To illustrate this, suppose that support for a policy proposal is increasing in some outcome belief and that two individuals have prior outcome beliefs located on opposite sides of a given prediction. Assuming that the individuals update toward the prediction, this will cause them to move in opposite directions, leading one individual to increase their support and the other to decrease their support. Although both respond to the new information, we may find no aggregate change in support for the reform when we compare the treatment group to the counterfactual control group, which received no prediction. If we instead compare between different treatment groups, we circumvent the monotonicity problem that may lead to an attenuation of the treatment effect. Because of this, the number of respondents assigned to the treatment group is much greater than the number of individuals assigned to the pure control.
The experiment was fielded in the United States by Lucid, an online exchange for survey responses. Examining the validity of this platform, Coppock and McClellan (Reference Coppock and McClellan2019) find that the Lucid sample matches the distribution of demographics in a US nationally representative sample better than MTurk and that experimental findings replicate well on this platform. Although convenience samples should not be used to make descriptive inferences, theoretically driven experimental work appears to replicate well both on Mechanical Turk and Lucid. The data collection proceeded in two steps using a soft launch procedure. First, I collected data on 15 per cent of the full sample and ensured that the randomization procedure worked. After this, no changes were made to the experiment and the exact same survey was fielded to the rest of the sample. The pre-analysis plan was registered before the second stage of the data collection commenced. I use the full sample in all analyses.
Cases
In the experiment, I focus on voter responses to the outcomes of three real economic policy proposals from the US debate: (1) the effect of a minimum wage increase on unemployment among low-skilled individuals, (2) the effect of a corporate tax rate cut on employment and (3) the effect of joining a free trade agreement, the Trans-Pacific Partnership, on manufacturing employment. Economic policy is ideal for studying outcome uncertainty, because politicians lack precise control over the outcomes (Ehrlich and Maestas Reference Ehrlich and Maestas2010).Footnote 7 Using real reforms has the additional benefit of reducing the risk of conflating outcome uncertainty with policy uncertainty. I further mitigate this issue by precisely specifying what outcomes are uncertain in the treatments.
There are two potential issues associated with using real reforms in the experiment. The first is multidimensionality, meaning that they may have multiple effects. For example, in addition to affecting the number of manufacturing jobs, joining the Trans-Pacific Partnership may also influence consumption, investments and tax revenue. I mitigate this issue by holding the general reform purpose constant in the vignette while focusing the respondent's attention on one outcome per reform. The second potential issue is that polarized political debates might lead respondents to infer a political leaning among experts based on their predictions, even when there is none. This underlines the importance of including a reform that has been endorsed by both sides of the political spectrum, such as free trade reform, among the proposals.
Treatments
In the experiment, all respondents are presented with a vignette that briefly describes the purpose of the policy and explains that there is disagreement over its expected effects. Importantly, the vignette emphasizes that not implementing the reform will leave the outcome variable unchanged. This is all the information the control group receives about the reform. The treatment groups are presented with either one or two quantitative predictions from either experts or partisan actors regarding the effects of the policy. For the treatment groups, a graphic complements the vignette and summarizes the information in the prediction. It shows both the predictions and who their senders are. A treatment example is available in Appendix Section C.
The treatments are constructed as follows. First, the respondents are randomly assigned to the expert sender or partisan sender treatment. To avoid confounding, the same sender is assigned for all three reforms. Secondly, the respondents are randomly assigned to receive either one or two predictions. Thirdly, the respondents are randomly assigned to a specific value for the prediction(s) received. The second and third steps are performed once for each policy.
Compared with qualitative predictions stating that the reform will, for example, ‘strongly increase unemployment’, using numerical predictions gives precise meaning to the effects of the reform. This allows me to precisely change both the predicted outcome and the uncertainty of the proposals. However, when presenting respondents with quantitative or numerical information, it is important to provide them with a benchmark that anchors the relative magnitude of the quantity (Ansolabehere, Meredith and Snowberg Reference Ansolabehere, Meredith and Snowberg2012). Therefore, the graphic shows the development of the outcome variable over the past 10 years and the predicted effect of the proposed policy in the future. The purpose of illustrating the effect of a policy as an effect over time is to emphasize the causal nature of the prediction. As our intuition about causality is strongly associated with change over time, this should make it easier for respondents to understand the predictions. In Table 1, I provide six examples of the treatment graphs. Below I discuss the treatments in greater detail. I provide the full treatment texts used in the experiment in Appendix Section D.
Examples of treatment graphs
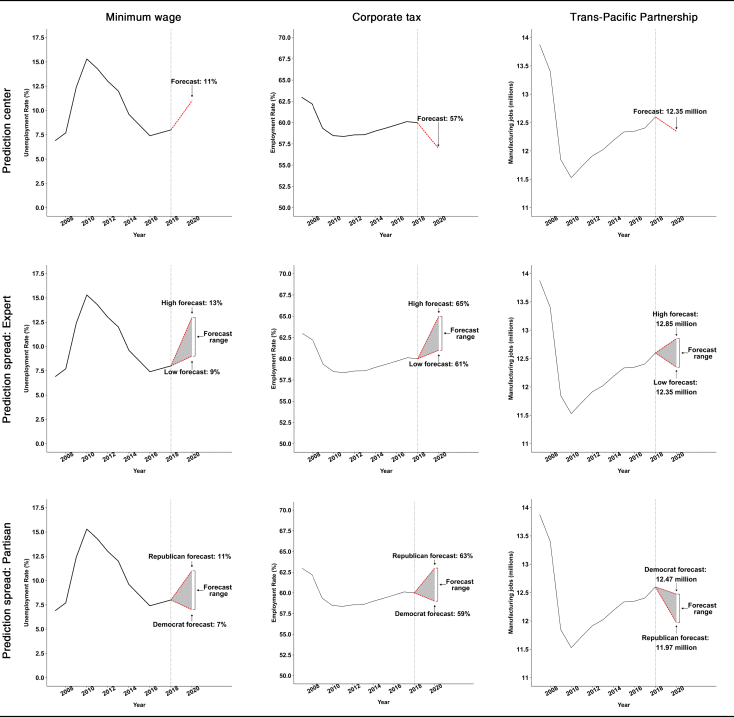
Note: the table shows examples of treatment graphs for the single prediction treatment, the expert uncertainty treatment – that is, the multiple predictions treatment and the partisan uncertainty treatment.
Predicted outcomes
The first treatment numerically varies the predicted outcome to examine whether respondents change their support and beliefs as the predicted outcomes change. Comparing the responses among respondents who get two different predicted outcomes is equivalent to comparing the left panel with the center panel in Figure 1.
Table 2 gives an overview of the three policy proposals, the outcome variables and the levels of the predicted outcomes. The treatments include widely different predictions about the effects of the reforms. Some of the predicted effects closely correspond to the estimated elasticities from the policy evaluation literature, whereas others do not. The predicted effects include both large and small changes to the outcome variables. In Table 1, the first row shows one example per policy proposal of the predicted outcome treatment graphics.
Reforms, outcomes and treatment levels
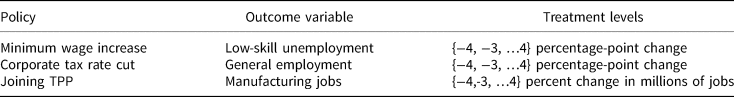
Note: the treatment levels for the Trans-Pacific Partnership reform are percent change from the baseline, but the information presented to respondents is in millions of manufacturing jobs.
Outcome uncertainty
The second treatment category is outcome uncertainty. I manipulate this by presenting the respondents with two predictions simultaneously, varying the distance between them. Similar to Tomz and Van Houweling (Reference Tomz and Van Houweling2009), who manipulate policy uncertainty by presenting a range of possible policy positions taken by a candidate, this exposes the respondent to a range of possible outcomes. In contrast to previous studies, this allows me to manipulate both the extensive and intensive margins of uncertainty. By keeping the predicted outcome constant and changing the spread between the predictions, I can disentangle the effect of increasing uncertainty from shifting the expected outcome.
To ensure comparability with the single prediction treatments, the two predictions in the uncertainty treatment are distributed symmetrically around the predicted outcome treatment levels. This is equivalent to identifying the treatment effect by comparing the left and right panels in Figure 1. To preserve the correspondence to the estimated effects from the policy evaluation literature, I bound the magnitude of uncertainty in the treatments. I put a maximum bound on the uncertainty to an interval of 4 percentage points (or percent for the Trans-Pacific Partnership reform). In the second row of Table 1, I provide one example per proposal of the uncertainty treatment when experts are senders.
I do not provide the respondents with explicit information about the predicted outcome for the uncertainty treatments. That is, I do not inform them that the two predictions are centered on some predicted outcome. Providing respondents with the predicted outcome risks attenuating the effect of uncertainty. When asked about their outcome beliefs, respondents might simply defer to the predicted outcome and ignore the uncertainty about it. Not providing this information allows me to better examine whether a treatment effect of uncertainty is driven by the perceived likelihood or the valuation of good versus bad outcomes. For example, suppose that uncertainty decreases support for a proposal. This could be driven by respondents perceiving bad outcomes as more likely, consistent with negativity bias, shifting their expected outcome toward the pessimistic prediction. This could also be driven by respondents being more concerned with avoiding negative outcomes than seeking positive outcomes, as suggested by the risk preference mechanism. If I do not detect any evidence of negativity bias, but find that uncertainty decreases support, this suggests that the effect is channeled through the risk preference mechanism.
Sender
To examine whether respondents can tell self-interested from credible actors, I manipulate the sender of the predictions. The senders are either non-partisan experts, or representatives from the Democratic or Republican parties. This addresses the question of whether politically motivated actors are able to influence voters’ beliefs and thereby shape public opinion.
I impose some restrictions on the predictions when the senders are partisans. For the minimum wage and corporate tax proposals, the partisan representatives always send cheap talk signals in the uncertainty treatment. Democrats always provide a more optimistic prediction about the effect of the minimum wage on the unemployment rate, and Republicans always provide a more optimistic prediction about the effect of the corporate tax rate on the employment rate. For the Trans-Pacific Partnership proposal, I randomly assign which representative provides the optimistic prediction. This enables me to test the extent to which partisan respondents rely on party cues when forming beliefs and attitudes. The last row of Table 1 shows one example of the treatment graphs per policy when partisans send conflicting predictions.
Outcome Measurement
From the theoretical model, I derive empirical implications for outcome beliefs, idealistic preferences and support. I measure support for the proposals on a seven-point Likert scale. Outcome beliefs are measured with a question asking the respondent to provide a best guess about the effect of the reform on the associated outcome, using the scale of the outcome, for each proposal. I present the question wordings in Appendix Section E.
The measure of idealistic preferences aims to capture the respondent's principled support for the policy. For the minimum wage reform, the idealistic preference is operationalized as a question about whether the government should do more to help individuals or let each person get ahead on their own. For the corporate tax reform, it is measured with a question about whether the government does too many things that should be left to individuals and private companies to take care of. For the Trans-Pacific Partnership reform, it is operationalized with a question about whether the United States should think less in international terms and focus more on its own problems or help other countries deal with their problems. Agreement with these statements is measured on a seven-point Likert scale.
To validate the measurement of idealistic preferences, I regress support for the reforms on their respective measurement of idealistic preference. The results, provided in Appendix Section F.2, show a robust and strong association in the expected direction between support for the reform and the measurement of idealistic preferences. This shows that the measurement of idealistic preferences is meaningfully related to support for the policy. This analysis suggests that, if predictions have no effect on idealistic preferences, but do have an effect on outcome beliefs and policy support, this is not because respondents perceive no relationship between policy support and idealistic preferences.
Main Specification
To test the theory, I estimate the following pre-registered specification, for individual i and reform j,
 $$\eqalign{& y_{i, j} = \beta _0 + \beta _1\,predictionCenter_{i, j} + \beta _2\,predictionSpread_{i, j} + \beta _3\,partisanSender_{i, j} \cr & \quad \quad + \beta _4\,partisanSender_{i, j}\cdot predictionCenter_{i, j} \cr & \qquad + \beta _5\,partisanSender_{i, j}\cdot predictionSpread_{i, j} + \varepsilon _{i, j}} $$
where Prediction Center is the predicted outcome around which the predictions are symmetrically distributed, Prediction Spread is half the absolute distance between the predictions, and Partisan Sender is a dummy indicating whether the senders are partisans or not. Prediction Center ranges from −4 to 4 and Prediction Spread from 0 to 2. The outcome variable, y, is either support for the reform, outcome beliefs or idealistic preferences. To avoid the monotonicity problem of heterogeneous priors, only treated individuals are included in the main specification. All models are estimated using ordinary least squares (OLS) with robust standard errors.
RESULTS
In this section, I first present the results for whether the treatments influence outcome beliefs and idealistic preferences. This forms the main premise of the argument. I proceed by examining whether the treatments shape policy support. Lastly, I present the heterogeneity analyses and several sensitivity tests.
Do Predictions Change Beliefs?
I hypothesize that predictions about the outcomes of policies shape public opinion by changing outcome beliefs and not by changing idealistic preferences. I test this by estimating Equation 2 with outcome beliefs and idealistic preferences as dependent variables. In Table 3, I present the results for the three proposals.
Predictions Affect Outcome Beliefs but not Idealistic Preferences
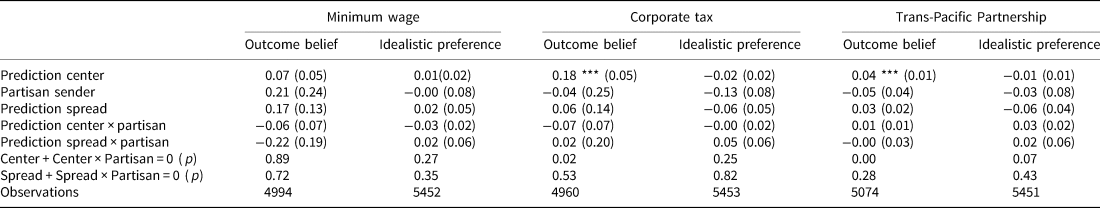
Note: all models are estimated using least squares. Robust standard errors in parentheses. Outcome belief is a measure of the respondent's expectation of the effect of the reform on the respective outcome variables. Idealistic preference measures the principled support for the policy on a seven-point Likert scale. The wording of questions are available in the appendix. Rows 6 and 7 show p-values from two F-tests of the marginal effect of prediction center and prediction spread when partisans are senders. *p < 0.05, **p < 0.01, *** p < 0.001
Let us first examine the effect of the treatments on outcome beliefs. Table 3 shows a strong, statistically significant effect in the expected direction of Prediction Center on beliefs for both the corporate tax and Trans-Pacific Partnership reforms when the senders are experts. When the predicted outcome of the corporate tax reform on employment increases by 1 percentage point, the respondent outcome belief increases by 0.18 percentage points. When the predicted outcome of the Trans-Pacific Partnership reform increases by 1 per cent or 126,000 jobs, the respondent outcome belief increases by 42,000 jobs. Neither interaction term with Partisan is statistically significant, meaning that partisans are equally effective at shaping respondent outcome beliefs.Footnote 8 For the minimum wage reform, the effect of Prediction Center is in the expected direction, both when experts and partisans are senders, but neither is statistically significant. These effects, however, are also significant for the minimum wage reform when Prediction Center is operationalized as a dummy variable instead of as a continuous variable, as shown in Appendix Section F.10. These results demonstrate that respondents understand the treatment information and update their beliefs toward the Prediction Center when senders are both experts and partisans.
The prediction center treatment captures the effect of a consensus prediction, that is, when there is no disagreement among experts or partisans. The estimate of the prediction spread treatment captures the effect on beliefs when predictions conflict. For all three proposals, including when senders are partisans, the effect on outcome beliefs is not statistically significant. This means that respondents average over conflicting predictions and weight optimistic and pessimistic predictions equally. In other words, respondents react to both conflicting predictions when forming their beliefs, but, in contrast to Jerit (Reference Jerit2009), project neither optimistically nor pessimistically.
As expected, Table 3 shows no statistically significant effects of any treatment variables on idealistic preferences, as indicated by the individual coefficients. Neither expert nor partisan predictions influence respondents’ idealistic preferences. Comparing the significant treatment effects on outcome beliefs to the null effects on idealistic preferences, we see that these effects are primarily driven by smaller point estimates and not greater uncertainty of the estimates.
The results show that the treatment predictions can influence respondent beliefs, but they do not change respondent preferences over outcomes. This supports Hypotheses 3 and 4, suggesting that respondents can distinguish immediately available information from salient considerations (Zaller Reference Zaller1992). Information about a policy's outcome should not affect preferences about what outcomes are good.
The treatment effects, however, are weaker for the minimum wage reform. Why are beliefs about the minimum wage reform harder to shift? One explanation is that respondents have stronger prior beliefs about this reform due to pre-treatment from political debates. I examine this possibility by comparing the level of certainty about the effects of the three reforms for the control group, in which no respondents are treated with predictions. The full results are presented in Appendix Section F.3.Footnote 9 Regressing the certainty of respondent expectations on dummies for the three reforms shows that respondents in the control group are substantially more certain about the effects of the minimum wage reform than the effects of the two other reforms. Compared with the minimum wage reform, average certainty about the effects of the corporate tax reform is 7 per cent (0.17 standard deviations) lower. For the Trans-Pacific Partnership reform, the average certainty is 15 per cent (0.39 standard deviations) lower. Both of these differences are statistically significant.
Do Predictions Change Support?
The results in the preceding section show that, in general, the treatments successfully shifted outcome beliefs, but did not affect idealistic preferences. In this section, I examine how the predictions affect support for reform. I estimate Equation 2 with support for each reform as the dependent variable. The findings are presented in Table 4.
Predictions Affect Support for Reforms
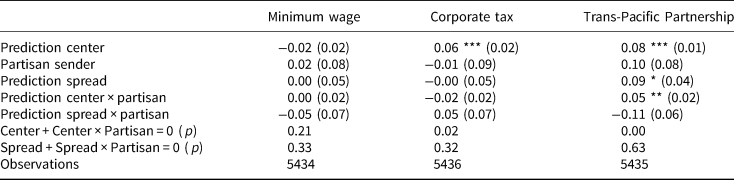
Note: all models are estimated using least squares. Robust standard errors in parentheses. Higher values imply stronger support for the policy. Rows 6 and 7 show p-values from two F-tests of the marginal effect of prediction center and prediction spread when partisans are senders. *p < 0.05, **p < 0.01, *** p < 0.001
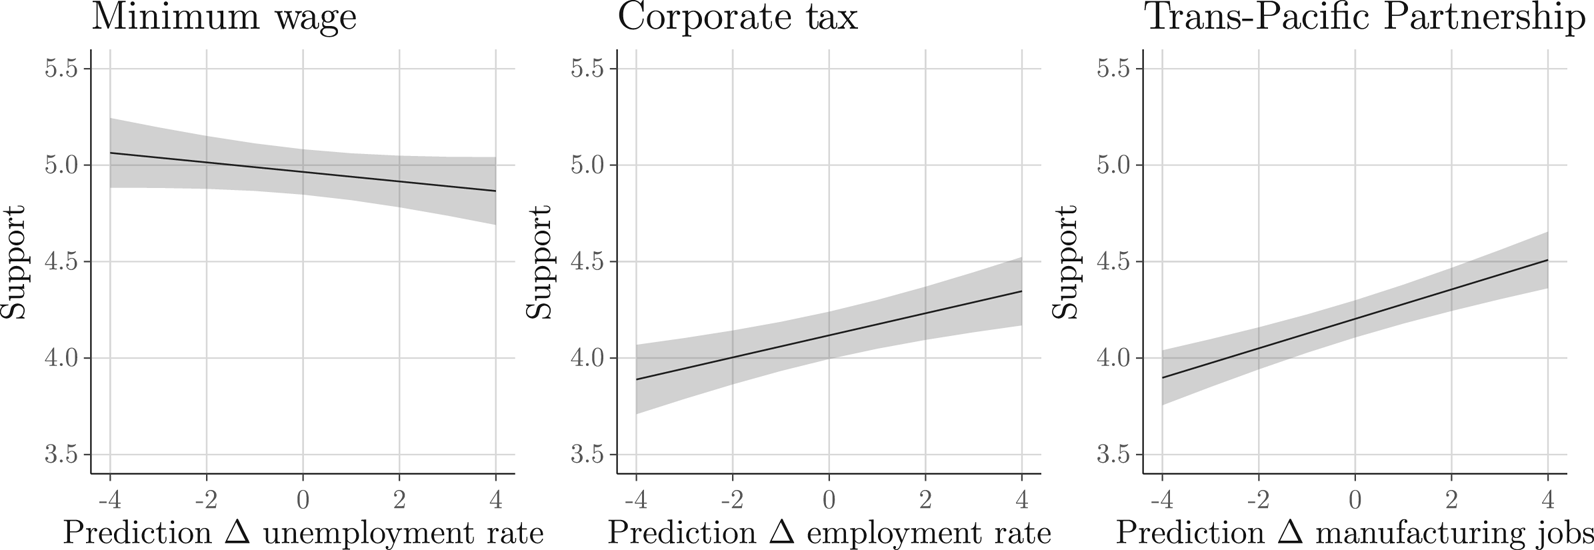
The effect of Prediction Center is statistically significant and in the expected direction for both the corporate tax and the Trans-Pacific Partnership proposal. As predicted outcomes improve, so does support for the reforms. A one-unit increase in Prediction Center increases support by 3 per cent of a standard deviation for the corporate tax reform and approximately 5 per cent of a standard deviation for the Trans-Pacific Partnership reform. In substantive terms, the effect sizes for both reforms are similar (see Figure 2). Shifting from the most pessimistic to the most optimistic prediction increases support for both reforms by approximately half a scale step. These findings support Hypothesis 1. The F-tests, testing the marginal effect of Prediction Center when partisans are senders, show that whenever experts are able to shift respondent support, partisan senders are too. For the Trans-Pacific Partnership proposal, the effect is even stronger when partisans are the senders of the prediction. Thus, respondents do not merely update their outcome beliefs in response to the predictions; they also update their support for the reforms.
Average treatment effect of predictions on reform support
Note: the figure shows the effect of the models from Table 4 when experts are senders. The shading shows the 95 per cent confidence interval. Higher values imply stronger support for the policy.
Contrary to expectations, support for the reforms does not decrease as the spread between predictions increases. For the corporate tax proposal, the effect of uncertainty is not statistically significant when either experts or partisans are senders. The same is true for the Trans-Pacific Partnership proposal when partisans are senders. When experts are senders, however, higher uncertainty increases support. Shifting from no uncertainty to maximum uncertainty is expected to increase support for the reform by 0.18 of a scale step.
The findings show that the respondents are not repelled by the uncertainty from conflicting predictions and do not provide any support for Hypothesis 2. This does not mean that they ignore information from conflicting predictions, but rather that they weight the predictions equally. I show this in Appendix Section F.13, where I drop the single-prediction treatments from the sample. The effect of Prediction Center remains virtually the same as for the full sample, emphasizing that respondents do comprehend and respond to both predictions. This is also true when outcome belief is the dependent variable. This finding suggests that the conflicting predictions place lower and upper bounds on the outcome, which may ameliorate any uncertainty implied by conflicting predictions. This interpretation is further strengthened by the analysis of respondent perceived uncertainty, which I present in Appendix Section F.5.Footnote 10 Although the coefficient of Prediction Spread is positive for both the minimum wage and corporate tax reform, it only significantly increases perceived uncertainty when experts send conflicting predictions for the latter reform. Nevertheless, the effect of Prediction Center from the subset analysis shows that both predictions influence beliefs and attitudes by shifting the expected outcome. This incentivizes political actors to dispute predictions from competing actors in order to shift voters’ expected outcome, despite the absence of an additional penalty of uncertainty on support.
Consistent with the findings for outcome beliefs, the treatments have no significant effects for the minimum wage reform. The effect of Prediction Center has the expected negative sign, but is much smaller in magnitude compared to the other proposals. Figure 2 shows that average support is much higher for the minimum wage reform than for the other reforms, despite the fact that respondents have pessimistic expectations about the effect of a minimum wage increase on unemployment. Average beliefs in the control group show that respondents expect all three reforms to increase the respective outcome variable. For the corporate tax and Trans-Pacific Partnership reforms, this implies an increase in employment and manufacturing jobs. For the minimum wage reform, it implies an increase in unemployment. Support for a minimum wage increase does not appear to be driven by the expectation that it will not increase unemployment; rather, it occurs in spite of this expectation.
Heterogeneity and Sensitivity Analysis
In this section, I first address two potential explanations of why conflicting predictions on average decrease neither outcome beliefs nor support for the proposals. Secondly, I examine how party identifiers assess information from in-group compared to out-group senders. Thirdly, I show that the effects are robust to alternative specifications and modeling choices.
Prediction spread
Only respondents who have a distaste for risk should decrease their support for their policy as prediction uncertainty increases. Consequently, the null finding of Prediction Spread may mask substantial treatment effects among risk-seeking and risk-averse respondents. I examine this by regressing support for the policy on an interaction between Prediction Spread and individually measured risk preferences. The results, available in Appendix Section F.6, show no indications that risk-averse respondents react differently to increasing uncertainty compared to their risk-seeking counterparts. The interaction between Prediction Spread and risk preferences is never statistically significant and often a precisely estimated null. Nor do I find a systematic difference between risk-seeking and risk-averse respondents when forming outcome beliefs. This is consistent with respondents averaging over the conflicting predictions and ignoring the spread between them. However, consistent with previous research (for example, Eckles et al. Reference Eckles2014; Kam and Simas Reference Kam and Simas2012), risk-seeking respondents consistently show higher support for the reforms independent of the treatments. This finding is striking, as support for the corporate tax and minimum wage reforms in the full sample are negatively correlated.
A second explanation for the null effect of Prediction Spread is that the operationalization and modeling of uncertainty as an additive effect of the distance between conflicting predictions does not adequately capture uncertainty. First, as I show in detail in Appendix Section A, Bayesian updating implies that the magnitude of updating depends on an interaction between Prediction Center and Prediction Spread. Thus Prediction Spread may indirectly affect attitudes and beliefs by moderating the effect of Prediction Center. Secondly, respondents may perceive uncertainty differently depending on the qualitative agreement and the domain of the predictions. Respondents may perceive uncertainty (and the potential implications of a poor outcome) as greater if Prediction Spread contains predictions across both the loss and gain domains, includes the null prediction or lies in the loss domain. I examine this by estimating a series of models with policy support and outcome beliefs as the dependent variables, where I interact Prediction Spread with Prediction Center, a dummy variable indicating whether both predictions are in the loss domain, a dummy variable indicating whether Prediction Spread contains the null prediction, and a dummy variable indicating whether the Prediction Spread contains both loss and gain predictions.
The results, presented in Appendix Section F.8, show no systematic effects of diverging predictions on either outcome beliefs or policy support regardless of the specification.Footnote 11 Out of seventy-two estimated marginal effects of Prediction Spread per dependent variable, only four have a significant effect on attitudes and four on outcome beliefs. Of these, six show positive effects of Prediction Spread and one displays a negative effect. There is thus little evidence that conflicting predictions moderate the effect of Prediction Center, or that the effect of Prediction Spread depends on the outcome domain. Contrary to what we would expect from the negativity bias literature (Lau Reference Lau1985), respondents give equal weight to both predictions even when one prediction is in the loss domain and one is in the gain domain. Thus, pessimistic predictions or predictions in the loss domain are not more influential than optimistic predictions or predictions in the gain domain.
Partisanship
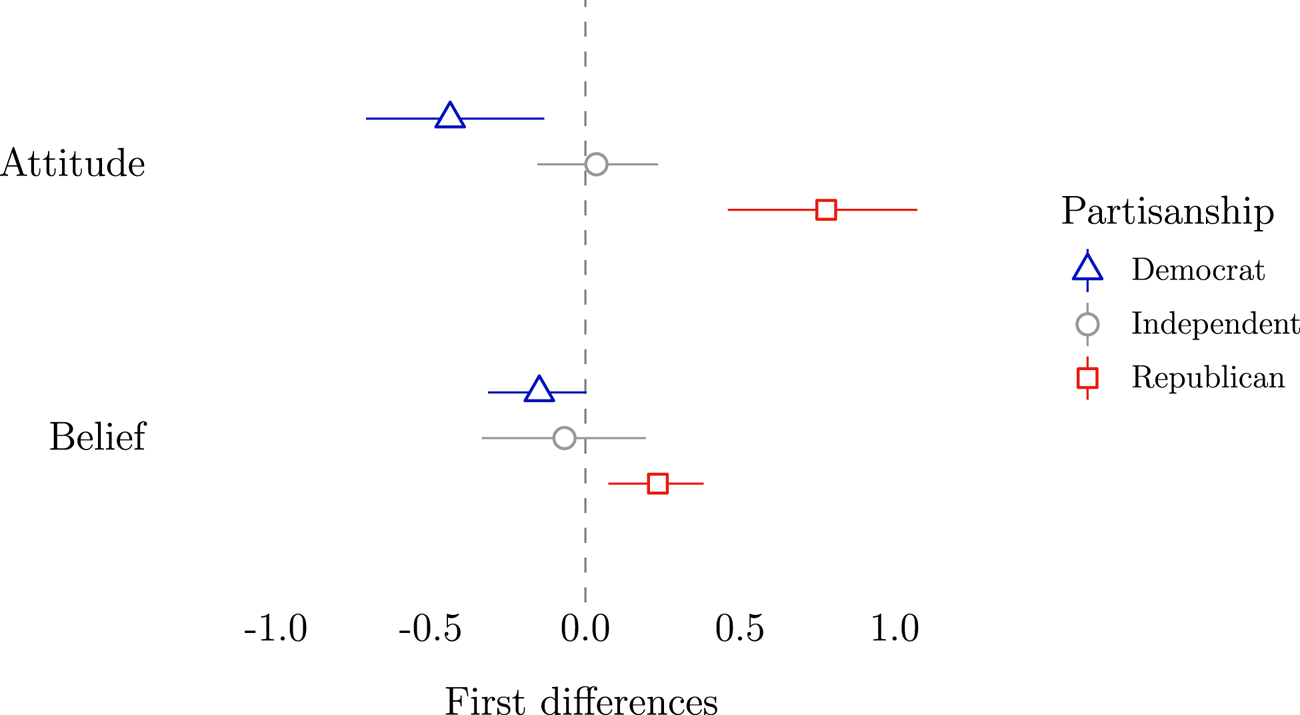
For party identifiers, what party makes which prediction may strongly affect the credibility of the signal. For the Trans-Pacific Partnership reform, I randomly assign what party sends the optimistic prediction. This allows me to examine whether partisans defer to the signal from their in-group representative when the predictions diverge. I do this by comparing the difference in beliefs and attitudes within each partisan group when the Republican representative sends the optimistic prediction vs. when the Democratic representative sends it.
Figure 3 shows the first differences for Democrat, Independent and Republican respondents. Partisans clearly give greater weight to the signal from their favored party, and the effect is especially strong for attitude formation. When the Republican representative sends the more optimistic prediction compared to the Democrat representative, Republicans increase their support by 0.75 scale steps (0.5 SD) on average, while Democrats decrease their support by 0.5 scale steps (0.3 SD). The analogous comparison for beliefs shows that Republican respondents expect 234,000 more jobs (0.28 SD) and Democrat respondents expect 150,000 fewer jobs (0.18 SD) when the Republican representative sends the optimistic prediction instead of the Democratic representative. Independents, however, do not respond more strongly to either Democratic or Republican predictions. Interestingly, I do not find that partisanship moderates the response when the senders are experts. In this case, partisans assign equal weight to both predictions. This is also true when the predictions of party representatives align.
Partisans follow their party when party predictions diverge
Note: the figure shows 1,000 first differences within each partisan group of Republicans and Democrats sending the optimistic prediction when prediction spread is at its maximum value. The full model is shown in Appendix Section F.7. The line shows the 95 per cent confidence interval. Higher values imply stronger support for the policy and more manufacturing jobs.
In Appendix Section F.7, I present the details of the analysis including the partisan heterogeneity analysis for the minimum wage and corporate tax reforms. I find little evidence of partisan heterogeneity for the minimum wage reform, but, similar to the findings for the Trans-Pacific Partnership, I find that Republicans and Democrats gravitate toward the prediction from their co-partisan both when forming beliefs and attitudes for the corporate tax reform.
Sensitivity
In Appendix Section F, I present a range of sensitivity tests showing that the article's findings are not dependent on particular specifications or models. First, the findings on beliefs, idealistic preferences and attitudes replicate using a difference of means estimator, operationalizing treatments as dummy variables instead of continuous variables. Secondly, two different multilevel analyses show that the null effect of the treatment variables on idealistic preferences and the null effect of Prediction Spread on all outcomes are precise nulls. Thirdly, the findings on idealistic preferences and support are robust to using an ordered probit estimator instead of OLS. Fourthly, the significant effect of Prediction Center remains when dropping the single prediction treatment. Fifthly, the results for belief formation remain when beliefs are operationalized using a qualitative measurement.
CONCLUSION
The outcomes of political reforms are never perfectly known. This uncertainty is exacerbated as voters are confronted with conflicting predictions from competing political actors. To understand how political information shapes public opinion, it is crucial to understand how voters form beliefs and attitudes to reforms in conflicting information environments.
In this article, I present a spatial preference model for policy proposals with uncertain outcomes and test the theory using a survey experiment, exposing respondents to predictions about the effects of three policies. The experiment shows that, as expected, respondents change their attitudes to the policy proposals because their outcome beliefs change, while their preferences over outcomes remain unaffected. Contrary to the theoretical expectations and previous research, I find that respondents give equal weight to optimistic and pessimistic predictions (cf. Jerit Reference Jerit2009; Nadeau, Martin and Blais Reference Nadeau, Martin and Blais1999; Riker Reference Riker1996) and are not repelled when the uncertainty of the predictions increases. Respondents discount outcome uncertainty by averaging over predictions when forming their beliefs and preferences. This supports previous research showing that voters are not sensitive to uncertainty (Berinsky and Lewis Reference Berinsky and Lewis2007; Milita et al. Reference Milita2017; Tomz and Van Houweling Reference Tomz and Van Houweling2009).
Just as in Minozzi's (Reference Minozzi2011) jamming equilibrium, it appears that respondents interpret conflicting messages as bounds on the true prediction, but cannot tell which sender is telling the truth. Consequently, they update based on both predictions. This can be contrasted with the less informative pooling equilibrium in, for instance, Gilligan and Krehbiel (Reference Gilligan and Krehbiel1989), where senders send noisy messages and receivers are able to learn little. Yet respondents do not blindly average over predictions. They rely on the information in the predictions when forming beliefs and attitudes to the policies, but not when forming their idealistic preferences. This offers an optimistic view of voters’ competence, suggesting that they can distinguish immediately available information from relevant information. Information about what the outcome of a policy will be should not affect preferences about what outcomes are good.
Is the null effect of outcome uncertainty caused by the characteristics of the treatment? The conflicting numerical predictions presented to the respondents capture the essence of conflicting information in debates and allow us to infer how respondents weight more or less diverging predictions. Still, it is possible that the numerical and matter-of-fact character of uncertainty in the experiment ameliorates perceived uncertainty by effectively bounding the outcomes. Future studies should therefore examine the effect of outcome uncertainty on belief and attitude formation when uncertainty is multidimensional, non-numerical and asymmetric. For example, if respondents perceive conflicting predictions as bounds on the outcome, competing senders might more effectively induce uncertainty, not by countering the prediction with an alternative precise prediction, but by questioning the credibility of the prediction without offering an alternative.
The symmetry of the predictions may also explain why I find no difference between expert and partisan senders. Suppose that respondents interpret partisan predictions as upper or lower bounds and expert predictions as credible point estimates. Regardless of whether the predictions are perceived as point estimates or bounds, a sensible decision rule for voters is to learn from both predictions by averaging them. To tell upper and lower bounds from credible point estimates, we need an experimental design that compares single and multiple predictions from both partisans and experts.
The experimental findings point to two promising topics for future research. First, are there any constraints moderating the predictions from political actors? If political actors can influence voters’ beliefs, why not send extreme predictions in order to maximize support or opposition to a policy? Two mechanisms could moderate this incentive. First, the reputational cost of being wrong could prevent political actors from sending extreme and inaccurate predictions. However, as the effects of reforms are difficult to identify, ex post uncertainty could mitigate the effect of the reputational mechanism. For instance, if unemployment increases following a minimum wage reform, politicians could blame the global economy. Secondly, voters might discount predictions that are far from their prior belief. In this case, political actors face a tradeoff between trying to sway voters in a certain direction and not being too extreme, which would lead voters to discount the prediction.
The second area for further research is how do material stakes condition belief and attitude formation? Many policy proposals directly affect only a minority of the electorate. For instance, only 2.3 per cent of all hourly paid workers in the US made wages at or below the minimum wage in 2017.Footnote 12 Consequently, the majority of the electorate does not have an egotropic perspective on a minimum wage reform. It is possible that individuals directly affected by a reform might respond more strongly to pessimistic predictions and be more averse to uncertainty. Future studies should examine how the material stake conditions belief and attitude formation.
What is the role of uncertainty in public opinion and elections? In light of the Brexit referendum and the election of Donald Trump in 2016, the finding that the appeal of a reform does not decrease with the uncertainty of the predictions suggests that scholars may have underestimated the electoral prospects of radical reform. Although the outcomes of elections may have substantial consequences for the individual welfare of the voter, the voter only has infinitesimal influence on election outcomes (Riker and Ordeshook Reference Riker and Ordeshook1968). If voters believe that their vote has only a negligible impact, our knowledge of risk and ambiguity aversion from experiments with material stakes might travel poorly to the domains of elections and public opinion. This highlights the importance of reconsidering the effect of uncertainty and belief formation on voter behavior and attitude formation.
Supplementary material
Online appendices are available at https://doi.org/10.1017/S0007123421000247.
Data availability statement
Replication data is available at the British Journal of Political Science's Dataverse at: https://dataverse.harvard.edu/dataset.xhtml?persistentId=doi:10.7910/DVN/F9D6TH.
Acknowledgements
This study was pre-registered at EGAP with study ID 20180905AA. The pre-analysis plan can be accessed at https://osf.io/q87kn. I am grateful to Mattias Agerberg, Alex Coppock, Peter Esaiasson, Andrej Kokkonen, Felix Hartmann, Don Green, Mikael Persson, Vincent Pons, Sander Renes, Mike Tomz, Kåre Vernby and participants at the Annual Toronto Political Behaviour Workshop 2017, the Mannheim ZEW/SFB Conference for Understanding Policy Preferences using Experimental Methods, and the Barcelona-Gothenburg-Bergen Workshop for Experimental Political Science 2019 for valuable comments. This manuscript was greatly improved by the comments of the three anonymous reviewers.


 Open access